![Acta Materialia 55 (2007) 4567 CPFEM Pil[...]](https://static.fdocuments.us/doc/165x107/586a30fa1a28ab4e0b8b9579/acta-materialia-55-2007-4567-cpfem-pil.jpg)
Acta Materialia, in press (2013) -...
33
1 Plasticity of BCC micro-pillars controlled by competition between dislocation multiplication and depletion Ill Ryu *a , William D. Nix a , Wei Cai b a Department of Materials Science and Engineering, b Department of Mechanical Engineering, Stanford University, Stanford CA, 94305-4040, United States. *Corresponding author E-mail address : [email protected] Present address: 496 Lomita Mall, Durand Bldg., Rm. 129 Stanford University Stanford, CA 94305 Tel/Fax: +1 (650) 714-0731 / (650) 725 – 4034 Abstract Recent micro-pillar experiments have shown strong size effects at small pillar diameters. This ‘smaller is stronger’ phenomenon is widely believed to involve dislocation motion, which can be studied using dislocation dynamics (DD) simulations. In the present paper, we use a 3-D DD model to study the collective dislocation behavior in body-centered cubic (BCC) micro-pillars under compression. Following the molecular dynamics (MD) simulations of Weinberger and Cai, we consider a surface-controlled cross-slip process, involving image forces and non-planar core structures, that leads to multiplication without the presence of artificial dislocation sources or pinning points. The simulations exhibit size effects and effects of initial dislocation density and strain rate on strength, which appear to be in good agreement with recent experimental results and with a simple dislocation kinetics model described here. In addition, at the high strain rates considered, plasticity is governed mainly by the kinetics of dislocation motion, not their elastic interactions. Keywords: plasticity, micro-pillars, dislocation dynamics, stress-strain relations Acta Materialia, in press (2013)
Transcript of Acta Materialia, in press (2013) -...
1
Plasticity of BCC micro-pillars controlled by competition between
dislocation multiplication and depletion
Ill Ryu *a
, William D. Nix a, Wei Cai
b
a Department of Materials Science and Engineering,
b Department of Mechanical Engineering, Stanford
University, Stanford CA, 94305-4040, United States.
*Corresponding author
E-mail address : [email protected]
Present address: 496 Lomita Mall, Durand Bldg., Rm. 129 Stanford University Stanford, CA 94305
Tel/Fax: +1 (650) 714-0731 / (650) 725 – 4034
Abstract
Recent micro-pillar experiments have shown strong size effects at small pillar diameters. This
‘smaller is stronger’ phenomenon is widely believed to involve dislocation motion, which can be studied
using dislocation dynamics (DD) simulations. In the present paper, we use a 3-D DD model to study the
collective dislocation behavior in body-centered cubic (BCC) micro-pillars under compression. Following the
molecular dynamics (MD) simulations of Weinberger and Cai, we consider a surface-controlled cross-slip
process, involving image forces and non-planar core structures, that leads to multiplication without the
presence of artificial dislocation sources or pinning points. The simulations exhibit size effects and effects of
initial dislocation density and strain rate on strength, which appear to be in good agreement with recent
experimental results and with a simple dislocation kinetics model described here. In addition, at the high
strain rates considered, plasticity is governed mainly by the kinetics of dislocation motion, not their elastic
interactions.
Keywords: plasticity, micro-pillars, dislocation dynamics, stress-strain relations
Acta Materialia, in press (2013)

2
1. Introduction
As the technology of micro-scale devices evolves to smaller dimensions, plasticity at small scales
attracts more and more attention. This is driven by the knowledge that many mechanical properties at the
sub-micron scale differ from those at the continuum scale. From the recent micro-pillar compression
experiments [1-3], it is now known that the flow stress of metallic micro-pillars increases with decreasing
sample size even in the absence of significant hardening by geometrically necessary dislocations or strain
gradients [4,5]. Recent review articles have summarized the current state of this research [6,7]. To understand
the 'smaller is stronger' phenomenon in metals, several models have been proposed, most notably the
dislocation starvation model [2,8,9] and the single arm source model [10-12]. In the dislocation starvation
model, the small number of mobile dislocations present in sub-micron pillars is expected to annihilate at the
nearby free surfaces during plastic flow, so that nucleation of new dislocations is required for further plastic
deformation to occur. In general, higher stresses are required for dislocation nucleation than for activating
existing dislocation sources. Since dislocations in smaller pillars might move out of the sample more quickly
than they multiply, smaller samples are expected to have higher flow stresses. Recent in-situ TEM
observations of Ni pillars under compression show that mechanical annealing can occur in sub-micron sized
pillars [9]. In the single arm source model, the radius of the truncated Frank-Read source is smaller in smaller
samples, so that the stress needed to activate the source is higher. As a result, smaller samples are predicted to
have higher flow stresses. Support for the single arm source model can be found in the in-situ TEM
observations [13,14].
Although in-situ TEM is a powerful tool for exploring the microscopic behavior of materials
directly, it has several limitations. For example, it requires a very thin electron transparent section of material
and the dislocations often move too fast to be observed clearly [15]. To contribute to a better understanding of
small-scale plasticity, it helps to delve more deeply into the details of dislocation behavior, as dislocation
motion is the primary mechanism for plastic deformation. In this sense, dislocation dynamics (DD) simulation
provides a unique opportunity to explore the motion of individual dislocations, and allows us to develop a
better microscopic understanding of the mechanical behavior of micro-pillars [16-18].

3
For metals with the face-centered cubic (FCC) crystal structure, DD simulations have provided
significant insight into understanding the mechanical behavior at small scales in terms of the collective
behavior of dislocations [12,19-24]. The same approach can be taken for BCC metals provided changes are
made to account for the different dislocation mobilities and multiplication mechanisms. For BCC metals,
dislocation plasticity is thought to be governed mainly by the motion of screw dislocations, which have a low
mobility, attributed to a non-planar core structure and a high Peierls barrier [25-28]. In addition, from
molecular dynamics (MD) simulations of plasticity of BCC nano-pillars, multiplication is expected to occur
by a process of surface induced cross-slip, wherein isolated screw dislocations, aided by image stresses, can
self-multiply and generate sources of dislocations [29,30].
In this paper, we implement an algorithm that accounts for surface cross-slip in BCC metal pillars
under uniaxial loading in DD models and explore its effect on the macroscopic deformation behavior.
Moreover, we compare our simulation results with recent experiments, which have shown that mechanical
annealing and exhaustion hardening are also possible in BCC metals [31,32]. To better understand the results
of these simulations, a simple dislocation kinetics model is developed, based on the competition between
surface controlled multiplication and loss of dislocations by glide out of the micro-pillar. The DD simulation
results and the kinetics model show similar effects of sample size and strain rate on the stress-strain curve.
2. Simulation methods
2.1. Three dimensional dislocation dynamics in a cylinder geometry
The dislocation dynamics simulations were performed using a modified version of ParaDiS, a DD
code originally developed at the Lawrence Livermore National Laboratory [18]. In ParaDiS, dislocations are
described as straight perfect dislocation segments connected by nodes. Based on the stress fields of the
segments and the loading conditions, dislocation movements are computed and updated. In an effort to make
the model conform to a micro-pillar compression experiment, the traction-free surface should be taken into

4
account. Modifications to the ParaDiS code have been made to account for the presence of the cylinder
surface [33]. It considers dislocation motion only in the pre-defined cylinder region and deletes any
dislocations outside of this cylinder region. A spectral method has been developed to compute the image
stress field in order to satisfy the traction-free boundary condition on the cylinder surface. However, in this
work, we include the effect of the image stress only for the surface nodes by specifying image stresses on
them, because they play a critical role in the selection of slip planes and the activation of the surface cross-slip
multiplication process. We have seen that ignoring the image stress for all other segments does not make a
significant qualitative change in the simulations. Using the surface cross-slip algorithm, we performed DD
simulations to explore the effects of sample size, initial dislocation density, and the strain rate on the stress-
strain behavior under uniaxial loading.
2.2. Surface cross-slip mechanism
Recently, Weinberger and Cai [29], using MD, found that even a single, isolated screw dislocation
in a BCC nano-pillar could multiply by a process involving cross-slip near the surface. They found that the
image forces on a straight, inclined, screw dislocation act in opposite directions on either end of the
dislocation, causing the two ends of the dislocation to move on different slip planes, the primary plane and the
cross-slip plane. The pinning point so created serves as an anchoring point on the glide dislocation, which,
above a critical stress, can spiral about that point and create multiple dislocations. Here, we develop a simple
algorithm to implement surface-induced cross-slip in the ParaDiS cylinder code. For simplicity, we allow for
slip to occur only on the 1/2 <111>/{110} type slip systems. Since only screw dislocations can cross-slip,
here we consider a pure screw dislocation in the cylinder geometry, as shown in Figure 1A. The main task is
to determine the slip planes of surface nodes. In Figure 1B, Peach-Koehler forces due to dislocation
interaction and external loading are computed for each surface node. In addition, the image forces are
specified at the surface nodes. The image forces act to move the surface nodes in opposite directions, as
shown in Figure 1C. This may be understood by noting that dislocations tend to shorten their length to
minimize their energy by rotating. By adding up these forces, the slip planes of the surface nodes are chosen
so that the projected force is maximum on the chosen slip plane. In Figure 1D, the slip plane of the front

5
surface node (A) is the (101) plane, while the slip plane of the back node (B) is the (0 1 1) plane. Initially, the
dislocation is on a single slip plane, but it would move on two different slip planes due to the surface cross-
slip mechanism. Because of the surface cross-slip, the dislocation would form a cusp with two arms on
different slip planes and evolve into a spiral loop. Afterwards, because the edge dislocation segments move
much faster than the screw segments, the loop expands mainly by edge motion. For the DD simulation, the
mobility of the edge-character segments is set to be 100 times larger than that of the screw segments [29], and
dislocation motion is limited to glide in specified slip planes, except for surface dislocation segments.
Detailed information on the anisotropic mobility law is given in [34]. When the edge dislocation segments
meet the surface, the one dislocation will have evolved into three dislocations. As a result, a single dislocation
can self-multiply (see supplementary movie1A). However, if the stress is lower than a critical stress for a
given sized pillar, the cusp will move along the dislocation line and escape from the pillar so that surface
multiplication will not occur (see supplementary movie 1B). Since the critical stress needed to cause the
cusped dislocation to bow and multiply is controlled by an Orowan bowing-like process, the critical stress for
multiplication is roughly inversely proportional to the diameter of the pillar.
2.3. Initial dislocation structure
Since the initial dislocation configuration affects the stability of pinning points, it is expected to have
a significant effect on the mechanical response of the micro-pillars [23]. For the modeling of FCC metals,
several initial configurations have been suggested: a Frank network relaxed from randomly distributed
straight and jogged dislocations [20], randomly distributed Frank-Read sources with pinning points [24] and
randomly distributed loops with cross-slip allowed [23]. However, these structures are not especially relevant
to BCC metals because of the different edge/screw dislocation mobilities. Moreover, the physical origin of
potentially permanent pinning points has remained unknown in sub-micron pillars, based on MD simulations
[35].
In the MD study of BCC nano-pillars by Weinberger and Cai [29], if a single dislocation is placed in
a cylinder, it tends to rotate into a screw orientation to reduce its energy. Because only a few dislocations

6
would exist in sub-micron sized pillars, dislocations would rarely interact with others without external loading.
Moreover, since the mobility of the screw orientation is much lower than that of edge, plasticity in BCC
micro-pillars is expected to be governed by screw dislocation motion. As a result, our DD simulation starts
with a configuration of randomly distributed pure screw dislocations prior to loading.
3. Simulation Results
3.1. Size-dependence of flow stress
To investigate the effect of sample size, simulations were performed with different pillar diameters
ranging from 150 nm to 1 μm under periodic boundary conditions along the cylinder axis. For these
simulations, a constant axial strain rate of 105 s
-1 was imposed. This is very much higher than typical
experimental strain rates of 10-3
s-1
or 10-4
s-1
. Due to timescale limitations, we have not yet been able to model
experimental strain rates. The initial dislocation density was 1013
m-2
, which amounts to just a few dislocations
in the smallest pillars and a much higher line content in the largest pillars. With these conditions, the DD
simulation predicts that the stress-strain curve clearly depends on pillar diameter, as shown in Figure 2. As
the sample size decreases from 1 μm to 150 nm in diameter, the flow stress increases from roughly 600MPa to
1.6GPa. In addition, smaller samples show 'jerky' flow behavior while the stress-strain curves for larger
samples are relatively smooth, consistent with experiment [31,32]. The evolving dislocation densities for
differently sized pillars have also been calculated and are plotted against strain in Figure 3A-3D. Interestingly,
the dislocation density for the largest diameter sample (1 μm) increases continuously, while the dislocation
density for the smallest sample (150 nm diameter) shows significant fluctuation but overall remains roughly
constant with increasing plastic deformation. Supplementary movies 2A and 2B show the evolution of the
dislocation structure, the corresponding stress-strain curves and the evolving dislocation density for both the
smallest (150 nm) and the largest (1 μm) diameters, respectively. The colors of the segments indicate the
Burgers vectors of the various dislocations, among which the red segments indicate newly created dislocation
junctions, formed through reactions of the type / 2[111] / 2[111] [100]a a a , while the green segments
7
indicate glide dislocations with Burgers vectors of the type / 2 111a . As shown in supplementary movie
2A, dislocations in the smallest pillar escape the pillar so easily that the dislocation density never rises to a
high value, with the consequence that few dislocation junctions are formed. On the other hand, as shown in
supplementary movie 2B, dislocation multiplication is prolific in the largest pillar, spreading dislocations over
the entire volume of the cylinder and causing a high density of junctions to form.
To see the size dependence clearly, the flow stresses for a plastic strain of 0.6% were determined and
plotted against the corresponding pillar diameters in Figure 4. To make this plot, we take the flow stresses
over 7 or 9 simulations with random initial conditions for a given sized pillar. The log-log plot gives a size
dependence exponent of about -0.48, which is roughly consistent with experimental exponents for BCC
metals: -0.24 to -0.48 [28,30,36,37].
3.2. Effect of initial dislocation density
To study the effect of the initial dislocation density, we have performed simulations with different
initial densities ranging from 1013
m-2
to 8×10¹³
m-2
. For these simulations, a constant strain rate of 105s
-1 was
imposed and the pillar diameter was 150 nm. Stress-strain curves for three different initial dislocation
densities are shown in Figure 5. We see that the flow stress decreases with increasing initial dislocation
density, which is not consistent with the Taylor hardening relationship. However, it can be understood by the
fact that the higher dislocation density would result in a softer response by increasing the plastic strain rate,
through the Orowan formula, and consequentially decreasing the flow stress rate. These results suggest that
Taylor hardening effects are smaller than the softening effects of dislocations as carriers of plasticity.
These results are in good agreement with the micro-compression experiments of Bei et al. on Mo
pillars [38], wherein pre-straining results in a softer response. Because more highly pre-strained pillars would
be expected to have a higher initial dislocation density, the inverse proportionality between initial density and
the flow stress predicted by the DD simulation is in accord with experimental results.
3.3. Effect of strain rate
8
We have also performed simulations for different high strain rates, ranging from 105 s
-1 to 10
6 s
-1.
Here, the initial dislocation density is again taken to be 1013
m-2
and the pillar diameter is 150 nm. The stress-
strain curves for different strain rates are plotted in Figure 6. At the initial stage of loading, the pillar
subjected to a higher strain rate starts to deform plastically at a higher stress (strain), so that the yield stress
increases with increasing strain rate. However, the steady state flow stresses all converged to about 1.6GPa
after around 1.5% strain. As a result, the DD model shows a rate-insensitive steady-state flow stress. However,
it must be repeated that the strain rates for the simulations are much higher than those used in experiments, so
that a direct comparison with experiments is not yet possible.
4. Dislocation kinetics model for micro-pillar plasticity controlled by self-
multiplication
In an effort to better understand plasticity controlled by the surface cross-slip mechanism, we have
developed a simple dislocation kinetics model similar to the one suggested by Nix and Lee [39] for the case of
surface nucleation controlled plasticity. A basic assumption of this model is that a fraction of dislocations will
self-multiply after it has traveled a distance , which is approximated by the diameter of a curved dislocation
segment under the given stress.
The dislocation density is naturally controlled by the competition between the multiplication rate
from the surface cross-slip mechanism and the depletion rate associated with dislocations moving out of the
surface. Thus the density evolution can be expressed by
, (1)
where stands for the multiplication rate and
is the depletion rate. Adapting the expression for given
by Nix and Lee [39], may be approximated by the current dislocation density divided by the lifetime of the

9
dislocation, /lifet D v , where D is the diameter of the sample and v is the average velocity of dislocations.
Using a linear mobility law, the dislocation depletion rate is
life
M b M b
t D D
, (2)
where is the current dislocation density, is the stress along the loading axis and β and β' are constants.
For the multiplication rate, we take the frequency of the dislocation multiplication to be approximated by the
average velocity of the screw dislocation divided by the size of the dislocation loop that can be supported by
the given stress. Using the expression for the critical bowing stress for a Frank-Read source, the size of the
loop can be approximated by
b
, (3)
where is the resolved shear stress. For simplicity, we omit the logarithmic term usually included in this
relation. Together with a linear mobility law, the multiplication rate can then be expressed by
2 2v M M
E
, (4)
where E is the elastic modulus and α, α' are constants which describe the fraction of dislocations which will
self-multiply. Then the dislocation density evolution law is
2 bM
E D
(5)
To compare the dislocation kinetics model with our DD simulations, a constant strain rate needs to be
imposed. Thus, the axial stress can be computed as follows:
total pl applied plE E , (6)

10
Using Orowan's formula for the plastic strain rate and a linear mobility law, the resolved shear stress is then
2
pl
b M
,
(7)
where pl is the shear strain rate. Considering the Talyor hardening effect, we modified the expression for the
resolved flow stress as follows:
2
pl
bb M
,
(8)
where is the Taylor hardening coefficient. Finally, the rate of change of the stress is then
2applied pl appliedE S E S b M S b ,
(9)
where S is the Schmid factor in the typical BCC slip system.
To assess the validity of the dislocation kinetics model, the dislocation density (equation 5) and the
stress (equation 9) were numerically solved and plotted in Figure 7, 8. For comparison, DD simulation results
were also plotted as shaded bands. For the plot, α' , β' and are chosen to be 0.096, 0.264 and 0.3 respectively,
and M is set to be four times higher than the pure screw mobility in the DD model. In Figure 7, in order to
check if the size effect could be predicted by the kinetics model, the diameter varies from 150 nm to 1 μm
with a constant strain rate of 105s
-1 and an initial dislocation density of 10
13m
-2, which are the same conditions
used for the DD simulations. The kinetics model clearly shows the size effect on the flow stress: as the sample
size decreases, the flow stress increases. Moreover, flow stresses and dislocation densities of various sized
pillars are within the range of the DD simulation results, as shown in Figures 3 and 7.
According to the kinetics model, without Taylor hardening both the flow stress and the dislocation
density eventually reach steady state values. By setting , and equal to zero, steady state values of
SS and SS are found as follows.

11
SS
E b
D
(10)
2 3
applied
SS
D
S b M E
(11)
These steady state values for the stress are plotted for each pillar diameter as horizontal dashed lines in
Figures 7 and 8. The stress-strain curves from the kinetics model with Taylor hardening converge to these
steady state values asymptotically, except for the largest pillar, where Taylor hardening becomes significant.
The contribution of Taylor hardening for the largest pillar is to be expected from the sharp increase in the
dislocation density for that pillar, as shown in Figure 3D.
In addition to the size effect, the kinetics model clearly shows a rate insensitivity of the steady state
flow stress, similar to the DD simulations, as shown in Figure 8A. That is to say, the steady state flow stress,
as predicted by the DD simulations, is independent of the strain rate. As a consequence, the dislocation
density remains roughly constant within the range of the DD simulations during further deformation, as
shown in Figure 8B.
.5. Discussion
In bulk FCC metals, plastic flow is strongly influenced by junction formation through the elastic
interactions of dislocations. The critical stress to bow dislocations between obstacles often plays a dominant
role in plastic flow and hardening. Dislocations are assumed to glide quickly from one obstacle to the next so
that the kinetics of dislocation motion plays a relatively minor role. By contrast, for the BCC micro-pillars
studied here, the results of the DD simulations as well as the predictions of the kinetics model suggest that at
the high strain rates being considered, the size effect on the flow stress arises mainly from dislocation
mobility and mobile dislocation density effects. This is also indicated by the simulations which show the yield
stress decreases with increasing initial dislocation density. This is broadly consistent with the findings of Bei
et al.[38] who showed that pre-straining of Mo alloy pillars leads to softening. Consistent with this picture,
both the DD simulations and the kinetics model show a strain softening effect associated with the

12
multiplication of dislocations. This is reminiscent of the kind of plastic flow studied by Johnston and Gilman
[40]. Thus, neither the dislocation starvation/nucleation model nor the single arm source model provides a
good account of the size dependence of the strength of BCC micro-pillars at the high strain rates under this
study.
The conclusion that the single arm source model does not describe the simulated flow behavior well
might seem to be at odds with some of the features included in the modeling. In both the DD simulations and
the kinetics modeling, Orowan bowing effects, with lengths that scale with the size of the pillars, play a key
role. In particular, a critical stress for multiplication, which depends inversely on the pillar diameter, is a
central feature of this modeling. This might seem to be identical to the single arm source model wherein the
strength of the micro-pillar is directly related to the critical stress needed to bow a dislocation segment with a
length that scales with the pillar diameter. But, in the present modeling critical stress does not determine the
flow stress directly. Rather, it controls the flow stress indirectly through the multiplication of dislocations. In
spite of this indirect relation, the steady state flow stress predicted by the kinetics model (equation 10 -
without strain hardening) still takes a form that is reminiscent of the predictions of the single arm source
model. The finding that the yield stress of the simulated micro-pillars increases dramatically with decreasing
initial dislocation density (Figure 5), is the best way to see this distinction. If the single arm source model
were controlling the strength directly, the yield strength would not be expected to increases so dramatically
with decreasing initial dislocation density.(repeat)
As shown in Figure 8A, both the DD model and the kinetics model predict a strong strain rate
sensitivity of the yield stress. This is broadly consistent with experiment, as recent micro-compression
experiments on sub-micron Mo pillars [27] have shown the flow stress to be strain rate sensitive. However,
the rate sensitivity of the yield stress in the present modeling is greater than that observed in the experiments.
This is caused by the very high strain rates in the present simulations and the associated linear mobility law
we have used. At larger plastic strains the predicted flow stresses for different strain rates tend to converge
and lead to a smaller strain rate sensitivity. Eventually, at least for the case of no Taylor hardening, steady
state flow conditions are predicted, wherein the steady state flow stress is completely independent of strain
13
rate. This is caused by the fact that the steady state flow stress is completely determined by the competition
between a stress-dependent multiplication rate and a stress-independent loss rate. Thus the steady state flow
stress and associated velocity becomes independent of the strain rate, making the dislocation density directly
proportional to the strain rate though the Orowan relation. In the presence of Taylor hardening such steady
states are not predicted. Finally, we note that the compression experiments on sub-micron Mo pillars [27]
were conducted under load-controlled conditions. Under these conditions, the strain softening effects shown
in the modeling and which eventually lead to steady states could not have been observed. Once strain
softening begins, a plateau in the load-controlled stress-strain curve would be observed. The flow stresses
reported in [27] should then correspond to the peak stresses in the simulated stress-strain curves, which do
show a strong strain rate sensitivity.
Most existing DD simulations use a simple linear mobility law, in which the velocity of the
dislocation segment is proportional to the resolved stress. However, in BCC metals, it is known that the
velocity of a screw dislocation is not linearly proportional to the resolved stress due to lattice resistance [41].
Since screw dislocation motion could play an important role in plasticity of BCC metals, it would be useful to
modify the mobility law using empirical forms [42,43]. With a nonlinear mobility law, a smaller size
dependence exponent might be expected for lower, more realistic, strain rates, based on the findings of Lee
and Nix [44]. They showed that smaller exponents are expected when the size-independent friction stress is
large compared to the flow stress. Further work is needed to account for nonlinear mobility behavior,
especially at low stresses in BCC metals.
In the DD simulations, dislocation multiplication occurs intermittently so that the dislocation density
shows high fluctuations. This stochastic flow behavior is especially pronounced in the smallest pillars. Since
the kinetics model is based on the collective behavior of dislocations, this kind of 'jerky' flow behavior cannot
be predicted, so that the dislocation density in the kinetics model evolves smoothly, as shown in Figures 7
and 8. In the DD simulations, the frequency of the fluctuation in the dislocation density is very high,
especially for the smallest pillars. Because there is no direct link between the dislocation density and the flow
stress, as in the simple kinetics model, the flow stress in the DD simulations is not as sensitive to those abrupt
14
changes in dislocation density. As a consequence, the predicted flow stress in the kinetics model, where there
is a direct link between the flow stress and the dislocation density, shows much higher oscillations than those
found in the DD simulations, as seen in Figures 7 and 8. As we have pointed out several times, the present
modeling of plasticity of BCC micro-pillars is limited in the sense that it applies to very high strain rates,
much higher than those used in experiments. Further work is needed to extend this analysis to experimental
strain rates.
6. Conclusions
In this research, 3D DD simulations have been performed in order to investigate the effects of
sample size, initial dislocation density and strain rate on the stress-strain relations of BCC sub-micron metal
pillars under uniaxial loading. The DD simulations including a surface cross-slip multiplication mechanism
show that the flow stress increases with decreasing pillar size, decreasing initial dislocation density. They also
show that yield stress is strongly strain rate sensitive.. These findings leads us to the notion that at the high
strain rates considered, plasticity is mainly governed mainly by dislocation mobility and mobile dislocation
density effects, not their elastic interactions. We also develop a dislocation kinetics model, based on the
competition between multiplication due to the surface cross-slip mechanism and depletion by glide out of the
micro-pillar. Results from both the DD model and kinetics model are in good agreement with recent
experiments in BCC metal pillars.
Acknowledgements
Support of this work by the Office of Science, Office of Basic Energy Sciences, of the U.S. Department of
Energy under Contract No. DE-FG02-04ER46163 in gratefully acknowledged. This work is partially
supported by the NSF Career Grant CMS-0547681. We would like to thank Dr. S.W. Lee of California
Institute of Technology for useful discussions.

15
References
[1] Uchic MD, Dimiduk DM, Florando JN, Nix WD, Science 2004; 305:986.
[2] Greer JR, Oliver WC, Nix WD. Acta Mater 2005;53:1821.
[3] Volkert CA, Lilleodden ET. Philos Mag 2006;86:5567.
[4] Fleck NA, Muller GM, Ashby MF, Hutchinson JW. Acta Metall Mater 1994;42:475.
[5] Nix WD, Gao H., J Mech Phys Solids 1998;46:411.
[6] Kraft O, Gruber P, Monig R, Weygand D, Annual Rev Mater Res 2010; 40:293.
[7] Greer JR, De Hosson JTM, Prog Mater Sci 2011; 56:654.
[8] Greer JR, Nix WD, Phys Rev B 2006; 73:245410.
[9] Shan ZW, Mishra RK, Asif SAS, Warren OL, Minor AM, Nat Mater 2008; 7:115.
[10] Parthasarathy TA, Rao SI, Dimiduk DM, Uchic MD, Trinkle DR, Scr Mater 2007; 56: 313.
[11] Rao SI, Dimiduk DM, Parthasarathy TA, Uchic MD, Tang M, Woodward C, Acta Mater
2008;56: 3245.
[12] Rao SI, Dimiduk DM, Tang M, Parthasarathy TA, Uchic MD, Woodward C, Phil Mag
2007:87: 4777.
[13] Oh SH, Legros M, Kiener D, Dehm G, Nat Mater 2009; 8:95.
[14] Kiener D, Minor AM, Nano Lett 2011;11:3816.
[15] Williams DB; Carter CB, Transmission Electron Microscopy: a Textbook for Materials
Science, first ed. New York: Plenum Press;1996.

16
[16] Devincre B, Kubin LP, Mater Sci Eng A 1997; 234–236:8.
[17] Schwarz KW, J Appl Phys 1999;85:120.
[18] Arsenlis A, Cai W, Tang M, Rhee M, Oppelstrup T, Hommes G, Pierce TG, Bulatov VV,
Model Simul Mater Sci Eng 2007;15:553.
[19] Espinosa HD, Panico M, Berbenni S, Schwarz KW. Int J Plasticity 2006;22:2091.
[20] Tang H, Schwarz KW, Espinosa HD Phys Rev Lett 2008;100:185503.
[21] El-Awady JA, Wen M, Ghoniem NM, J Mech Phys Solids 2009;57:32.
[22] Liu ZL, Liu XM, Zhuang Z, You XC, Scr Mater 2009;60: 594.
[23] Motz C, Weygand D, Senger J, Gumbsch P, Acta Mater 2009;57:1744.
[24] Senger J, Weygand D, Motz C, Gumbsch P, Kraft O, Phil Mag 2010;90:617.
[25] Cai W, Bulatov VV, Mater Sci Eng A 2004;277:387.
[26] Brinckmann S, Kim JY, Greer JR, Phys Rev Lett 2008;100:155502.
[27] Schneider AS, Clark BG, Frick CP, Gruber PA, Arzt E, Mater Sci Eng A 2009;508:241.
[28] Schneider AS, Kaufmann D, Clark BG, Frick CP, Gruber PA, Monig R, Kraft O, Arzt E, Phys
Rev Lett 2009;103:105501.
[29] Weinberger CR, Cai W, Proc Natl Acad Sci 2008;105:14304.
[30] Greer JR, Weinberger CR, Cai W, Mater Sci Eng A 2008;493:21.
[31] Chisholm C, Bei H, Lowry M, Oh J, Syed Asif SA. Warren OL, Shan ZW, George EP, Minor
AM, in press, 2012.

17
[32] Huang L, Li QJ, Shan ZW, Li J, Sun J, Ma E, Nature comm 2011;2:547.
[33] Weinberger CR, Cai W, J Mech Phys Solids 2007;55: 2027.
[34] Cai W, Bulatov VV, Mater. Sci. Eng., A 2004; 387:277.
[35] Weinberger CR, Cai W, Scripta Mater 2011;64:529.
[36] Kim JY, Greer JR, Acta Mater 2009;57:5245.
[37] Kim JY, Jang D, Greer JR, Acta Mater 2010;58:2355.
[38] Bei H, Shim S, Pharr GM, George EP, Acta Mater 2008;56:4762.
[39] Nix WD Lee SW, Phil Mag 2010; 91:1084.
[40] Johnston WG , Gilman JJ, J Appl Phys 1959;30:129.
[41] Gilbert MP, Queyreau S, Marian J, Phys. Rev. B 2011;84;174103
[42] Gilman JJ, Aust J Phys 1960;13:327.
[43] Prekel HL, Lawley A, Conrad H, ACTA METALL MATER 1968 ;16;337
[44] Lee SW, Nix WD, Phil Mag 2011; 92:1238.
18
Figure captions
Figure 1. (a) single screw dislocation and its slip planes in a cylinder and (b) Peach-
Koehler forces (c) image forces and (d) total forces on front and back nodes.
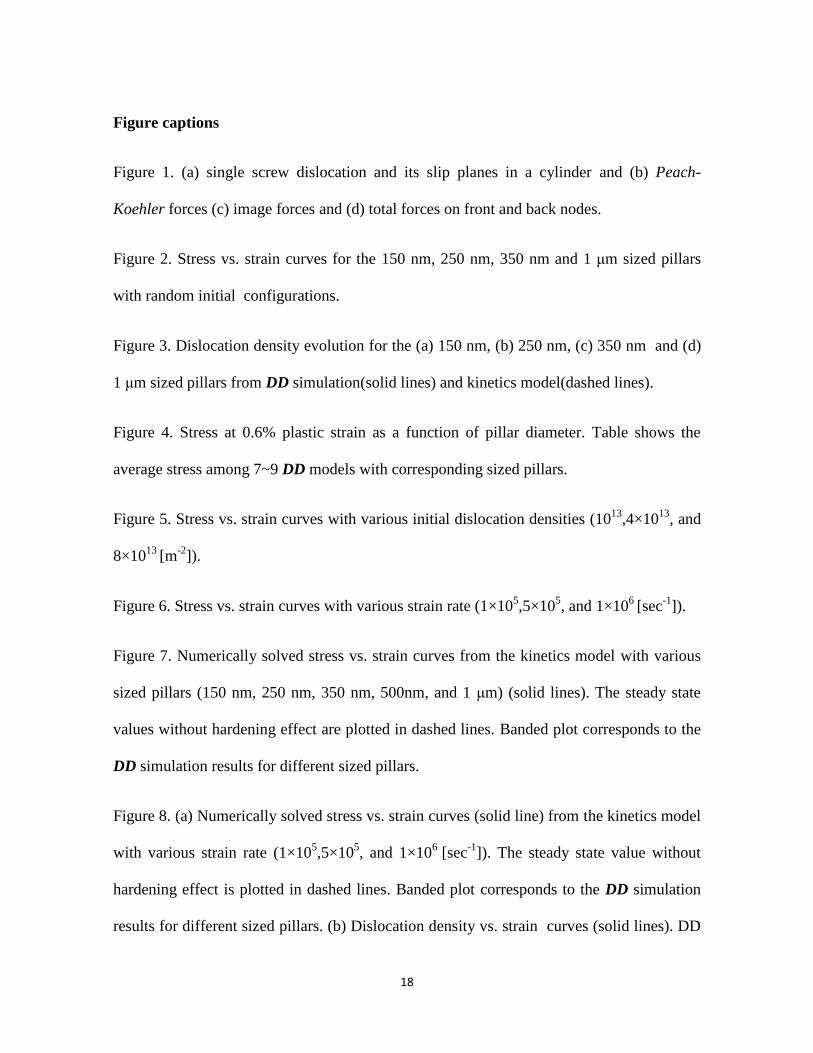
Figure 2. Stress vs. strain curves for the 150 nm, 250 nm, 350 nm and 1 μm sized pillars
with random initial configurations.
Figure 3. Dislocation density evolution for the (a) 150 nm, (b) 250 nm, (c) 350 nm and (d)
1 μm sized pillars from DD simulation(solid lines) and kinetics model(dashed lines).
Figure 4. Stress at 0.6% plastic strain as a function of pillar diameter. Table shows the
average stress among 7~9 DD models with corresponding sized pillars.
Figure 5. Stress vs. strain curves with various initial dislocation densities (1013
,4×1013
, and
8×10¹³
[m-2
]).
Figure 6. Stress vs. strain curves with various strain rate (1×105,5×10
5, and 1×10
6 [sec
-1]).
Figure 7. Numerically solved stress vs. strain curves from the kinetics model with various
sized pillars (150 nm, 250 nm, 350 nm, 500nm, and 1 μm) (solid lines). The steady state
values without hardening effect are plotted in dashed lines. Banded plot corresponds to the
DD simulation results for different sized pillars.
Figure 8. (a) Numerically solved stress vs. strain curves (solid line) from the kinetics model
with various strain rate (1×105,5×10
5, and 1×10
6 [sec
-1]). The steady state value without
hardening effect is plotted in dashed lines. Banded plot corresponds to the DD simulation
results for different sized pillars. (b) Dislocation density vs. strain curves (solid lines). DD

19
simulation results also plotted in red (1×10⁵
[sec-1
]), blue(5×10⁵[sec
-1]), and black (10
6 [sec
-
1]) lines.

20
Supporting movie 1
DD simulation on a screw dislocation in a cylinder (a) above the critical stress, and (b)
below the critical stress. The diameter of the cylinder is 150 nm, and strain rate is 105
[sec-1
].
Above the critical stress, a single screw dislocation can multiply due to the surface cross
slip. On the other hand, below the critical stress, the dislocation moves out of the cylinder
after the cusp moves along the dislocation line. Dislocation segments are colored according
to their slip planes.
Supporting movie 2
DD simulation results for (a) 150 nm, (b) 1 μm sized pillars under compression. The initial
dislocation density is 1013
[m-2
] and strain rate is 105
[sec-1
]. Upper movies show the
dislocation structure evolution when viewed along the pillar axis (left) and from the side
(right). Lower left shows stress strain curve and lower right shows dislocation density
evolution. Dislocation segments are colored according to their Burgers vectors.

Figure 1
(101)
(011)
plane
plane
plane [111]b =[111]ξ =
(110)
[001]
(A)
A
B

Front
Back
imageFP KF −
Front
Back
Front
Back
totalF
(C)(B) (D)
Figure 1
A
B
A
B
A
B
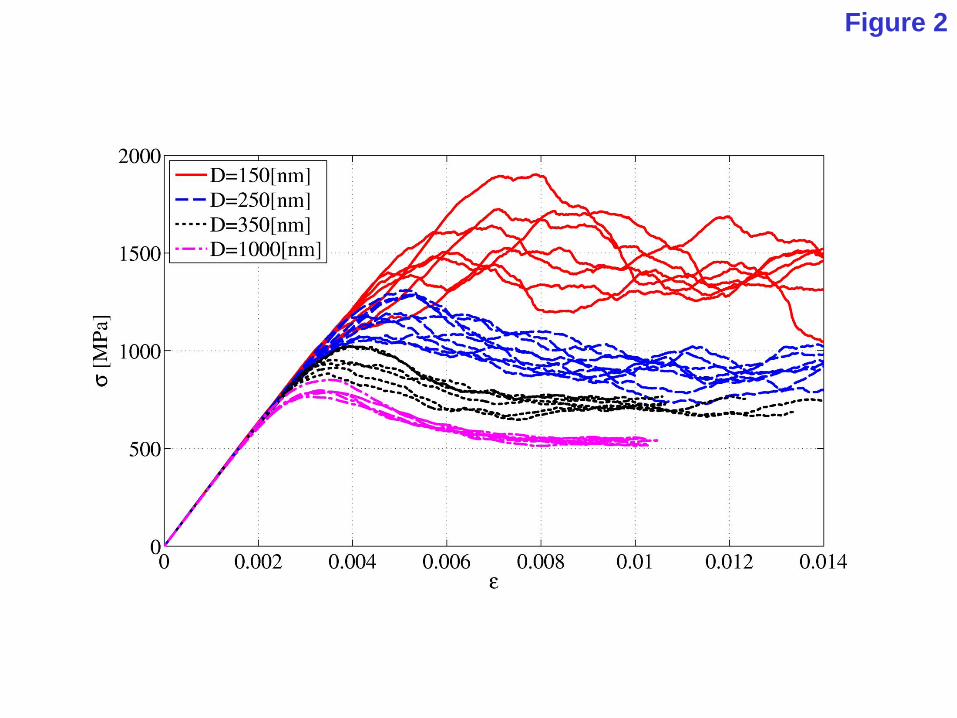
Figure 2

Figure 3A
Kinetics model

Figure 3B
Kinetics model

Figure 3C
Kinetics model

Figure 3D
Kinetics model

Figure 4
150 250 350 1000
1415 942 725 541. [ ]avg MPaσ
[ ]D nm

13 20 1 10 [ ]mρ −= ×
13 20 4 10 [ ]mρ −= ×
13 20 8 10 [ ]mρ −= ×
Figure 5

Figure 6
5 11 10 [sec ]ε −= ×5 15 10 [sec ]ε −= ×6 11 10 [sec ]ε −= ×

Figure 7
150D nm=
250D nm=
350D nm=
500D nm=
1000D nm=

Figure 8A
5 11 10 [sec ]ε −= ×5 15 10 [sec ]ε −= ×6 11 10 [sec ]ε −= ×
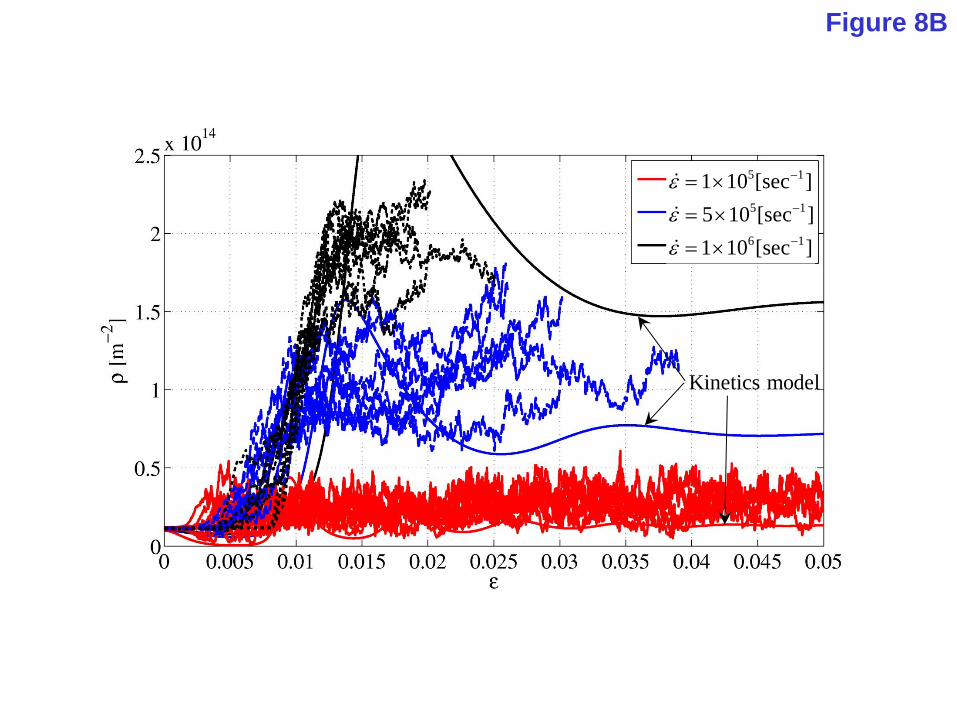
Figure 8B
Kinetics model
5 11 10 [sec ]ε −= ×5 15 10 [sec ]ε −= ×6 11 10 [sec ]ε −= ×


![Acta Materialia - Li Group 李巨小组li.mit.edu/Archive/Papers/19/Yang19LiAM.pdf · 2019. 5. 10. · Acta Materialia 168 (2019) 331e342. during processing or service [3e6]. The](https://static.fdocuments.us/doc/165x107/6002a1f6c3901950a4086ab7/acta-materialia-li-group-climiteduarchivepapers19-2019-5.jpg)