Acromegaly in the North Denmark Region - Aalborg Universitet › ... ›...
11
Research project Susanne Finnerup 5th Semester candidate AAU Counsellors: Jakob Dal and Jesper Karmisholt Side 1 af 11 Acromegaly in the North Denmark Region Susanne Finnerup, Jakob Dal and Jesper Karmisholt Department of Endocrinology, Aalborg University Hospital and School of Medicine and Health, Aalborg University Abstract Introduktion: Akromegali er en sjælden, men alvorlig sygdom. Ofte går der mange år før diagnosen stilles pga. den snigende udvikling af de kliniske karakteristika. Gennem de sidste årtier er der sket fremskridt i diagnosticeringen af akromegali i Danmark. Det er uvist om det har ændret på antallet af patienter og hvordan de fremtræder på diagnosetidspunktet. Metode: Alle patienter diagnosticeret med akromegali ved Aalborg Universitets Hospital blev identificeret vha. Central Personregister nummer (CPR) og Landspatientregistret ved brug af ICD 8 og 10 koder. Data vedrørende postnummer, diagnose år, symptomer, symptomvarighed, IGF-1 niveau, oral glukose tolerance testresultater og hypofyseadenomstørrelse blev hentet fra patientjournalerne. Fødselsår og køn blev hentet via CPR og dødsår vha. Patient administrationssystemet. Desuden blev den tilgængelige litteratur afsøgt og relevante artikler medtaget til sammenligning. Resultat: Incidensen af akromegali har varieret fra 1976-2016. Opsving i 1990’erne resulterede i en incidens på op til 6,9 tilfælde per million indbyggere per år (tpmå) med et nyt niveau på gennemsnitlig 4 tpmå fra 1990-2016. Prævalensen af akromegali i Region Nordjylland i 2016 var på 94 tilfælde per million indbyggere (tpm). Gennemsnitsalderen ved diagnose er steget med fra 37 til 56 år, og mændene var ældre ved diagnosetidspunktet sammenlignet med kvinder (P=0,05). Der var dog ingen ændringer i adenomstørrelse, diagnostisk forsinkelse eller antallet af kliniske karakteristika. Det hyppigste symptom var akrale forstørrelse og ansigtsforandringer. Diabetes og hypertension var hyppige ko-morbiditeter. De fleste patienter kom fra centralt beliggende kommuner, hvor prævalensen i gennemsnit var 4 gange højere end i yderområderne. Konklusion: Incidensraten har nået et nyt niveau efter år 2000 på 4 tpm. Både denne og prævalensen er højere i Nordjylland sammenlignet med internationale studier. Udvikling i diagnostiske værktøj har ikke nedbragt den diagnostiske forsinkelse. Fremover bør der fokuseres på at diagnosticere akromegale patienter i yderområderne.
Transcript of Acromegaly in the North Denmark Region - Aalborg Universitet › ... ›...
Research project Susanne Finnerup 5th Semester candidate AAU Counsellors: Jakob Dal and Jesper Karmisholt
Side 1 af 11
Acromegaly in the North Denmark Region Susanne Finnerup, Jakob Dal and Jesper Karmisholt Department of Endocrinology, Aalborg University Hospital and School of Medicine and Health, Aalborg University
Abstract Introduktion: Akromegali er en sjælden, men alvorlig sygdom. Ofte går der mange år før diagnosen stilles pga. den snigende udvikling af de kliniske karakteristika. Gennem de sidste årtier er der sket fremskridt i diagnosticeringen af akromegali i Danmark. Det er uvist om det har ændret på antallet af patienter og hvordan de fremtræder på diagnosetidspunktet. Metode: Alle patienter diagnosticeret med akromegali ved Aalborg Universitets Hospital blev identificeret vha. Central Personregister nummer (CPR) og Landspatientregistret ved brug af ICD 8 og 10 koder. Data vedrørende postnummer, diagnose år, symptomer, symptomvarighed, IGF-1 niveau, oral glukose tolerance testresultater og hypofyseadenomstørrelse blev hentet fra patientjournalerne. Fødselsår og køn blev hentet via CPR og dødsår vha. Patient administrationssystemet. Desuden blev den tilgængelige litteratur afsøgt og relevante artikler medtaget til sammenligning. Resultat: Incidensen af akromegali har varieret fra 1976-2016. Opsving i 1990’erne resulterede i en incidens på op til 6,9 tilfælde per million indbyggere per år (tpmå) med et nyt niveau på gennemsnitlig 4 tpmå fra 1990-2016. Prævalensen af akromegali i Region Nordjylland i 2016 var på 94 tilfælde per million indbyggere (tpm). Gennemsnitsalderen ved diagnose er steget med fra 37 til 56 år, og mændene var ældre ved diagnosetidspunktet sammenlignet med kvinder (P=0,05). Der var dog ingen ændringer i adenomstørrelse, diagnostisk forsinkelse eller antallet af kliniske karakteristika. Det hyppigste symptom var akrale forstørrelse og ansigtsforandringer. Diabetes og hypertension var hyppige ko-morbiditeter. De fleste patienter kom fra centralt beliggende kommuner, hvor prævalensen i gennemsnit var 4 gange højere end i yderområderne. Konklusion: Incidensraten har nået et nyt niveau efter år 2000 på 4 tpm. Både denne og prævalensen er højere i Nordjylland sammenlignet med internationale studier. Udvikling i diagnostiske værktøj har ikke nedbragt den diagnostiske forsinkelse. Fremover bør der fokuseres på at diagnosticere akromegale patienter i yderområderne.
Research project Susanne Finnerup 5th Semester candidate AAU Counsellors: Jakob Dal and Jesper Karmisholt
Side 2 af 11
IntroductionAcromegaly is caused by a chronic elevated production of growth hormone (GH) and consequently high levels of insulin-like growth factor 1 (IGF-1). The most common pathogenesis for acromegaly is a benign GH-producing pituitary adenoma (PA) (1,2). The condition is predominately characterized by acral growth and facial changes(3,4). Excessive GH production effects numerous organ systems, which result in various comorbidities including diabetes and hypertension (1–3,5). Early intervention is essential in treating the disorder and to prevent or reduce the severity of the comorbidities(6).
Through the last decades different advances has been made into the diagnostics of acromegaly. Today the diagnostics includes an anamnesis with type and duration of symptoms, IGF-1 measurement, a GH profile during an oral glucose tolerance test (OGTT), and MRI of the PA (2,7). The advances of the diagnostics of acromegaly may have shortened the diagnostical delay, which in turn should result in patients with fewer symptoms and comorbidities and smaller PA at the time of diagnosis.
The prevalence of acromegaly has been estimated to between 18-137 cases per million inhabitant (c.p.m)(8,9), with an incidence of 1.9-11 cases per million per year (c.p.m.y)(10,11). This provides an indistinct view of the epidemiology of acromegaly worldwide. Therefore, more research is needed in this area. In some studies, the data has been collected in different areas, showing variation in the incidence between the areas (11–13). Though, no investigation into the reasons for these differences has been done.
The aim of this study was to investigate which variables were present at time of diagnosis in patients diagnosed with acromegaly in the North Denmark Region (NDR) between 1976 to 2016 and if these have changed. Furthermore, the aim was to compare the incidence, prevalence and the characteristics for patients with acromegaly to other national and international cohorts. Finally, the purpose was to explore whether there are geographical differences between the municipalities in NDR.
Methods
Source and Study Population The source population for this study consisted of the population in NDR. All patients suspected of acromegaly are diagnosed and treated at a centralized expert center at Aalborg University Hospital by two highly specialized doctors and one dedicated secretary.
The data was collected by searching the Danish National Registry of Patient (DNRP) using codes from International Classification of Disease (ICD) 8th (25300, 25301) and 10th (E22.0) revision for acromegaly. The search was conducted from 1960-2016. A total of 131 patients were identified with the diagnosis “acromegaly”. The method of patient identification has been validated by Dal et al. (14).
The inclusion criteria for this study was: The patients had to be diagnosed at Aalborg University Hospital (AAUH) in NDR between 1960-2016, the diagnosis had to be made on ≥ 2 of the following criteria: a clinical assessment with signs of acromegaly, elevated IGF-1, pituitary tumor on MRI/CT (x-ray in a few cases), non-suppressed GH-levels during Oral Glucose Tolerance Test (OGTT), or treatment specific for acromegaly only.
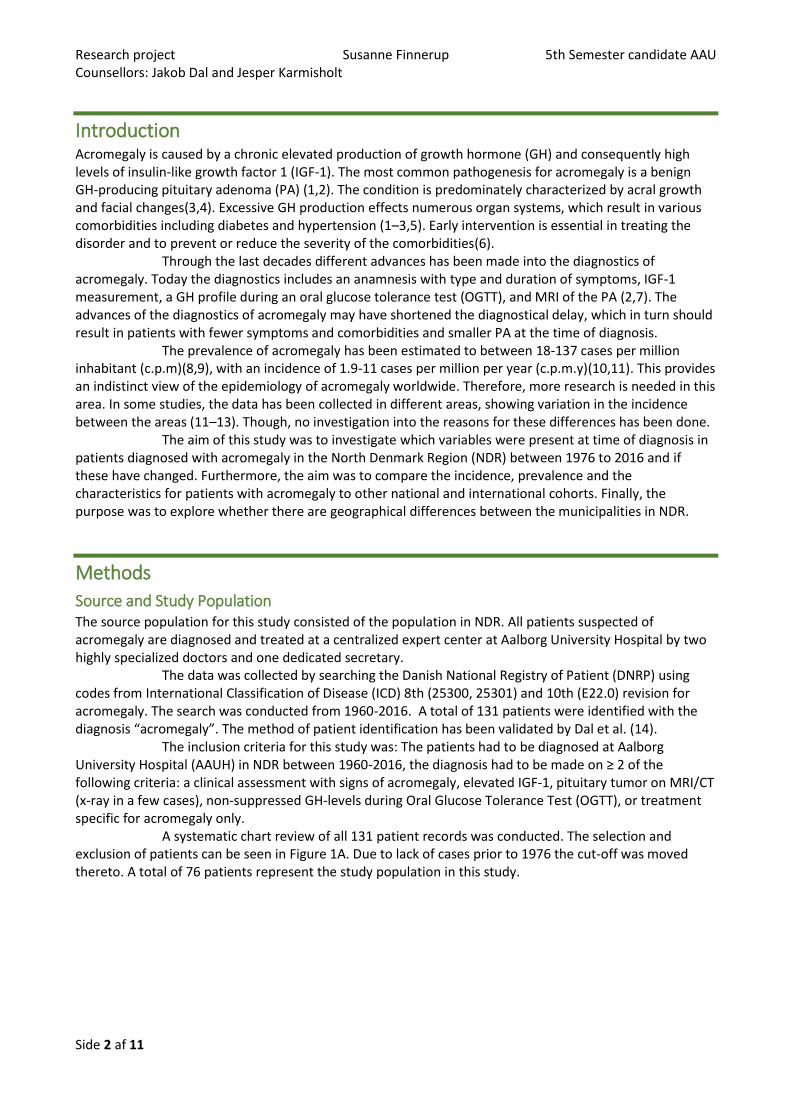
A systematic chart review of all 131 patient records was conducted. The selection and exclusion of patients can be seen in Figure 1A. Due to lack of cases prior to 1976 the cut-off was moved thereto. A total of 76 patients represent the study population in this study.
Research project Susanne Finnerup 5th Semester candidate AAU Counsellors: Jakob Dal and Jesper Karmisholt
Side 3 af 11
Figure 1: Flow chart of patient selection (A) and literary selection (B)
Data Collection The data were collected and stored in a database using Microsoft Excel through retrospective and systematic review of each patient record to confirm diagnosis and to extract zip codes, year of diagnosis, symptoms, IGF-1, OGTT measurement, and adenoma size. Only data from the time of diagnosis were used, which provided a challenge concerning the older cases, for which a part of the data was missing, or the procedures taken into use after time of diagnosis. Time of death were extracted from Patient Administration Systems (PAS)
Analysis and Statistical methods GH fasting is calculated as a median of the two first GH measurement in an OGTT profile, to which the patients were fasting. Diagnostic delay is based on information given by the patient. The zip codes were grouped to match the municipalities they belonged to. Age at diagnosis and gender was extracted using the Central Personal Registry (CPR), which provides a unique CPR-number to all citizens of Denmark. The CPR-number contains data for date of birth and the gender of the individual. Incidence, prevalence, and population distribution in the municipality of NDR were calculated using population specific data from 1976-2016 from Statistics Denmark.
Data with a normal distribution is represented as mean ± Standard Deviation (SD), as opposed to median and range for non-normally distributed data. The difference in age at time of diagnosis between genders and differences between central and peripheral areas in age at diagnosis, number of clinical characteristics, size of adenoma and GH -levels were analyzed using an independent sample t-test.
Search of literature As background and comparison for this article, a block search of Embase and Pubmed were conducted
using the Mesh and Emtree terms “acromegaly” AND ”incidence” OR “prevalence”, which provided 667
articles. The further sorting of articles is illustrated in Figure 1B. In addition, a chain search was conducted
using authors and references in specific focus articles to find further relevant articles. The articles found in
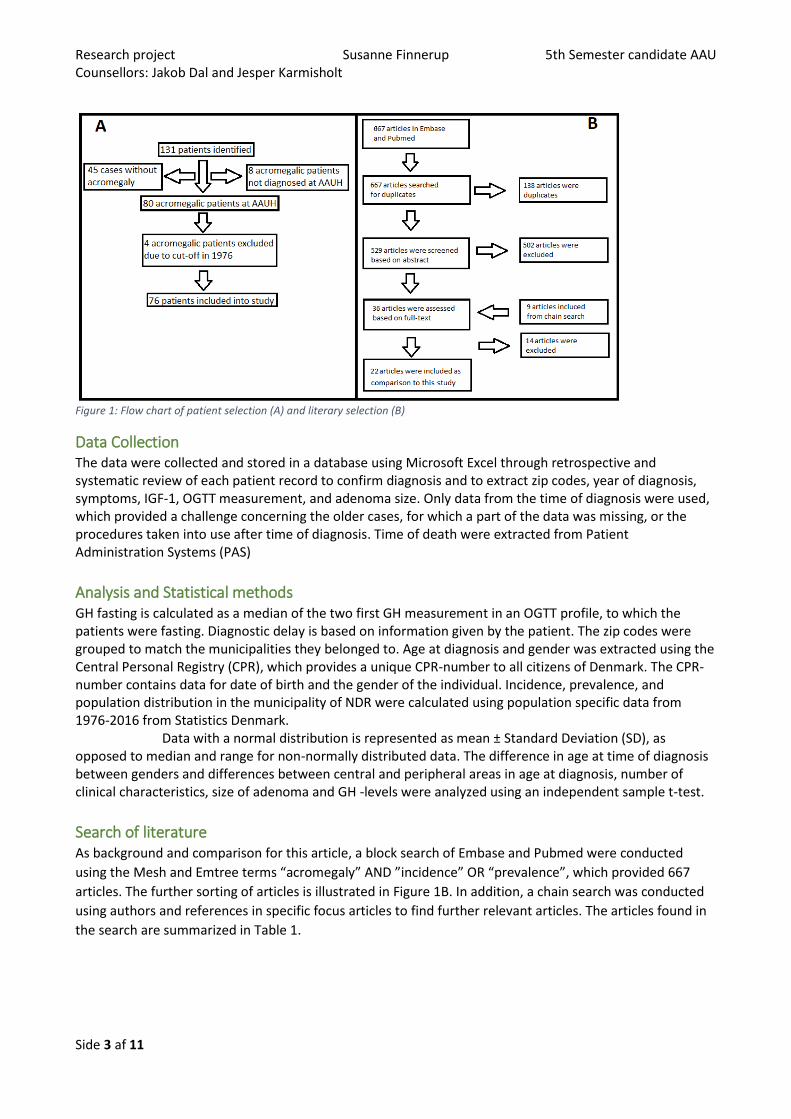
the search are summarized in Table 1.
Research project Susanne Finnerup 5th Semester candidate AAU Counsellors: Jakob Dal and Jesper Karmisholt
Side 4 af 11
Number (female %)
Prevalence per million
Incidence per million per year
(95 %Ci)
Age at diagnosis (Mean (± SD))
(Median(range))
Nationality (Year of publication)
Holdaway, I. M.et al. (3) - 58 3.3 44 Worldwide (1999) Portocarrero-Ortiz, L. A. et
al.(8) 2057 (59.5
%) 18 - 41.1 (±24.5) Mexican (2016)
Agustsson, T. T. et al. (9) 53 (39.7 %) 136.7 - 45 (4-83) Icelandic (2015) Burton, T. et al. (10) 2241 (52 %) 78 11 41 American (2016)
Bex, M. et al. (11) 418 (49 %)
40 1.9 F: 46 (17–80) M:42 (8–81)
Belgian (2007)
Kwon, O et al(12) 1350 (53.5 %)
27.9 3.9 44.1 (± 13.0) South Korean (2013)
Tjörnstrand, A. et al.(15) 53 (49 %) - 3.5 (2.5-4.5) - Swedish (2014) Dal, J. et al.(6) 405 (47.2 %) 85 3.8 (3.6-4.1) F: 48.0 (±15.2)
M:48.6 (±14.6) Danish (2016)
Petersenn, S. et al.(16) 1485 (54.4 %)
- - 44 German (2009)
Maione L, et al. (17) 999 (54 %) - - F: 48.5 (IQ 37-58) M: 43 (IQ 34-53)
French (2017)
Terzolo M et al. (18) 1512 (58.7 %)
- - F: 47.2 M: 42.3
Italian (2017)
Fernandez, et al. (19) 7 (42.9 %) 86 - F: 45.0 (39.0–63.0) M: 48.5 (30.0–52.0)
British (2010)
Hoskuldsdottir, G.T. et al.(20) 52 (38.5 %) 133 Average 3.4 44.5 Icelandic (2015) Mestrón, A. et al. (13) 1219 (60.8
%) 33.7 - 45 (±14) Spanish (2004)
Vitale, G. et al (21) 200 (55 %) - - 46.8 (±14.9) Italian (2005) Dagdelen, S. et al (22) 160 (49.4 %)
- - F:43.7 (±10.9)
M:40.3 (±11.2) Turkish (2014)
Fieffe, S. et al (23) 519 (54.7 %) - - Mean: 46.1 Median: 47 (IQ 35- 55)
French (2011)
Nachtigall, L. et al (24) 100 (55 %) - - 41.2 (±14.2) American (2018) Arosio, M. et al (25) 1512
(58.7%) - - 45 (±13)
Italian (2012)
Park, J. Y. et al (26) 215 (48.8 %) - - 42.9 (±12.3) South Korean (2014) Lavrentaki, A. et al (27) - 28-137 2-11 - Worldwide (2017)
Caputo, M. et al (28) 369 (60.4 %) 83
5.3
50.9 Italian (2018)
Table 1 Demography of acromegaly at time of diagnosis
Results
Incidence and Prevalence Two different prevalences were calculated: 1) by using only the residents of NDR at time of diagnosis and 2) by including newcomers to the region after diagnosis. The prevalence in NDR without newcomers was 94 c.p.m in 2016. When taking the newcomers into account the prevalence was 108 c.p.m in 2016. The average incidence from 1976-2016 was 3.2 c.p.m.y. There was an increase in the number of patients diagnosed with acromegaly in the 1990s. Until the 1990s the incidence was 1.9 c.p.m.y in average, then from 1990-1999 the incidence increased to 5.3 c.p.m.y with a max of 6.9 c.p.m.y in 1999. Afterwards, the incidence decreased to an average of 3 c.p.m.y. The average incidence from 1991 to 2006 was 4 c.p.m.y.
Research project Susanne Finnerup 5th Semester candidate AAU Counsellors: Jakob Dal and Jesper Karmisholt
Side 5 af 11
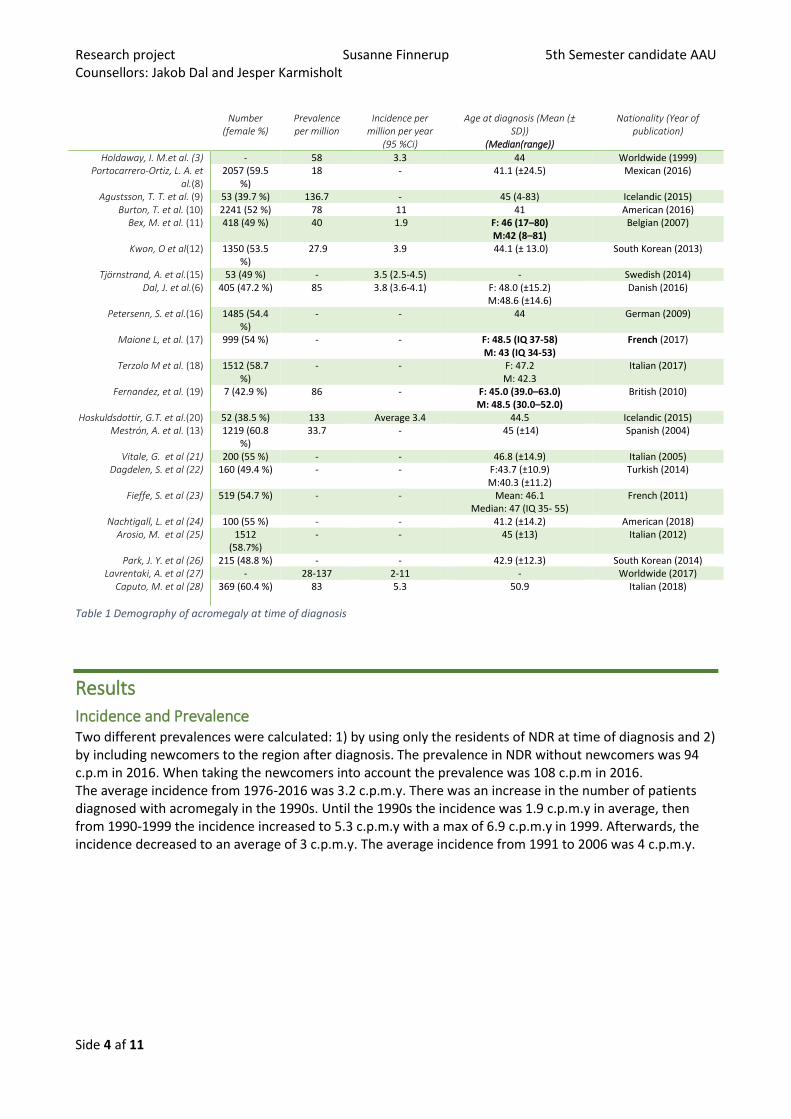
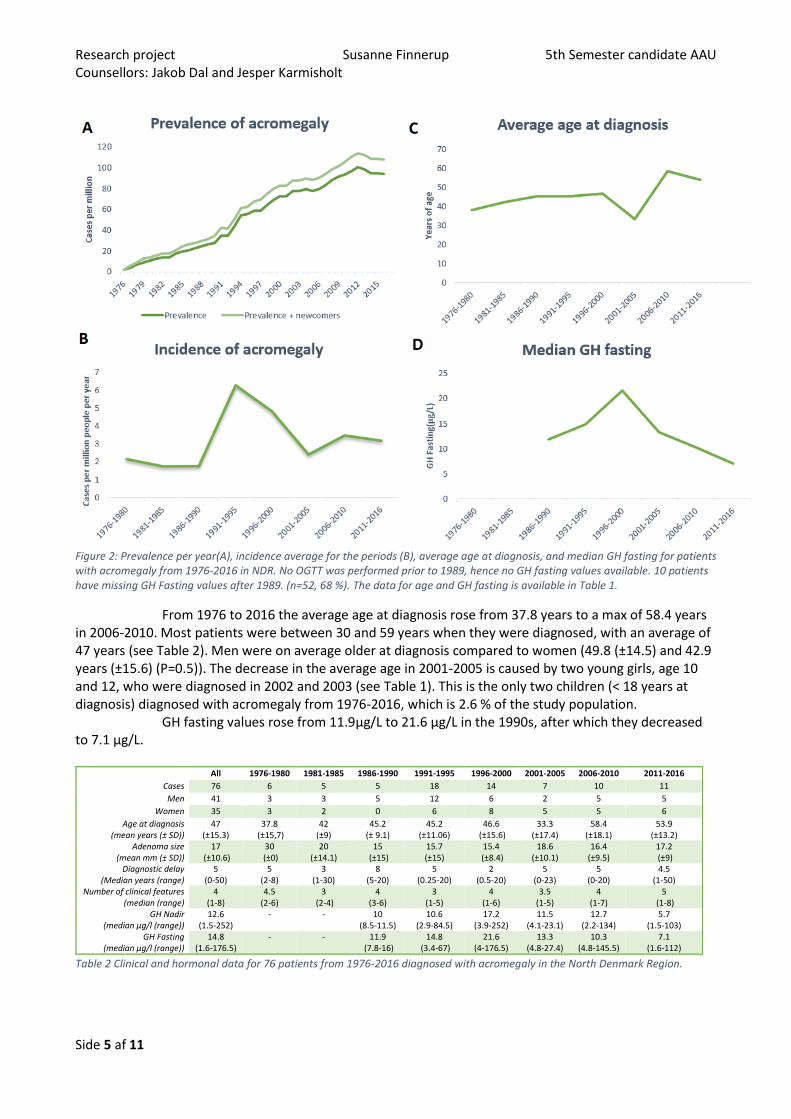
Figure 2: Prevalence per year(A), incidence average for the periods (B), average age at diagnosis, and median GH fasting for patients with acromegaly from 1976-2016 in NDR. No OGTT was performed prior to 1989, hence no GH fasting values available. 10 patients have missing GH Fasting values after 1989. (n=52, 68 %). The data for age and GH fasting is available in Table 1.
From 1976 to 2016 the average age at diagnosis rose from 37.8 years to a max of 58.4 years in 2006-2010. Most patients were between 30 and 59 years when they were diagnosed, with an average of 47 years (see Table 2). Men were on average older at diagnosis compared to women (49.8 (±14.5) and 42.9 years (±15.6) (P=0.5)). The decrease in the average age in 2001-2005 is caused by two young girls, age 10 and 12, who were diagnosed in 2002 and 2003 (see Table 1). This is the only two children (< 18 years at diagnosis) diagnosed with acromegaly from 1976-2016, which is 2.6 % of the study population.
GH fasting values rose from 11.9µg/L to 21.6 µg/L in the 1990s, after which they decreased to 7.1 µg/L.
Table 2 Clinical and hormonal data for 76 patients from 1976-2016 diagnosed with acromegaly in the North Denmark Region.
All 1976-1980 1981-1985 1986-1990 1991-1995 1996-2000 2001-2005 2006-2010 2011-2016
Cases 76 6 5 5 18 14 7 10 11
Men 41 3 3 5 12 6 2 5 5
Women 35 3 2 0 6 8 5 5 6
Age at diagnosis (mean years (± SD))
47 (±15.3)
37.8 (±15,7)
42 (±9)
45.2 (± 9.1)
45.2 (±11.06)
46.6 (±15.6)
33.3 (±17.4)
58.4 (±18.1)
53.9 (±13.2)
Adenoma size (mean mm (± SD))
17 (±10.6)
30 (±0)
20 (±14.1)
15 (±15)
15.7 (±15)
15.4 (±8.4)
18.6 (±10.1)
16.4 (±9.5)
17.2 (±9)
Diagnostic delay (Median years (range)
5 (0-50)
5 (2-8)
3 (1-30)
8 (5-20)
5 (0.25-20)
2 (0.5-20)
5 (0-23)
5 (0-20)
4.5 (1-50)
Number of clinical features (median (range)
4 (1-8)
4.5 (2-6)
3 (2-4)
4 (3-6)
3 (1-5)
4 (1-6)
3.5 (1-5)
4 (1-7)
5 (1-8)
GH Nadir (median µg/l (range))
12.6 (1.5-252)
- - 10 (8.5-11.5)
10.6 (2.9-84.5)
17.2 (3.9-252)
11.5 (4.1-23.1)
12.7 (2.2-134)
5.7 (1.5-103)
GH Fasting (median µg/l (range))
14.8 (1.6-176.5)
- - 11.9 (7.8-16)
14.8 (3.4-67)
21.6 (4-176.5)
13.3 (4.8-27.4)
10.3 (4.8-145.5)
7.1 (1.6-112)
Research project Susanne Finnerup 5th Semester candidate AAU Counsellors: Jakob Dal and Jesper Karmisholt
Side 6 af 11
Cases Deaths Incidence Inhabitants Prevalence Peripheral/central municipality
NDR 76 21 3.2 585,499 94
Hjørring 5 2 1.8 65,411 45.9 Peripheral
Læsø 0 0 0 1,817 0 Peripheral
Frederikshavn 5 2 1.9 60,246 49.8 Peripheral
Brønderslev 8 1 5.5 36,047 194.2 Central
Jammerbugt 3 3 1.9 38,466 0 Peripheral
Aalborg 30 9 3.9 210,316 99.9 Central
Vesthimmerland 2 1 1.3 37,296 26.8 Peripheral
Rebild 6 1 5.2 29,149 171.5 Central
Mariagerfjord 4 0 2.3 42,131 94.9 Central
Thisted 2 0 1.1 43,991 45.5 Peripheral
Morsø 1 0 1.1 20,629 48.5 Peripheral
Unknown 10 2 - - -
16%26%
58%
77%69%
69%41%
33%31%
21%16%
14%11%
6%
0% 10% 20% 30% 40% 50% 60% 70% 80% 90%
0-1 feature2-3 features4-8 features
Hand growth (54)Feet growth (48)
Facial changes (48)Sweating (29)
Musculo- skeletal compliants(23)Head ache (22)
Arterial Hypertension (15)Diabetes Mellitus (11)
Snoring (10)Sleep apnea (8)
Lactation (4)
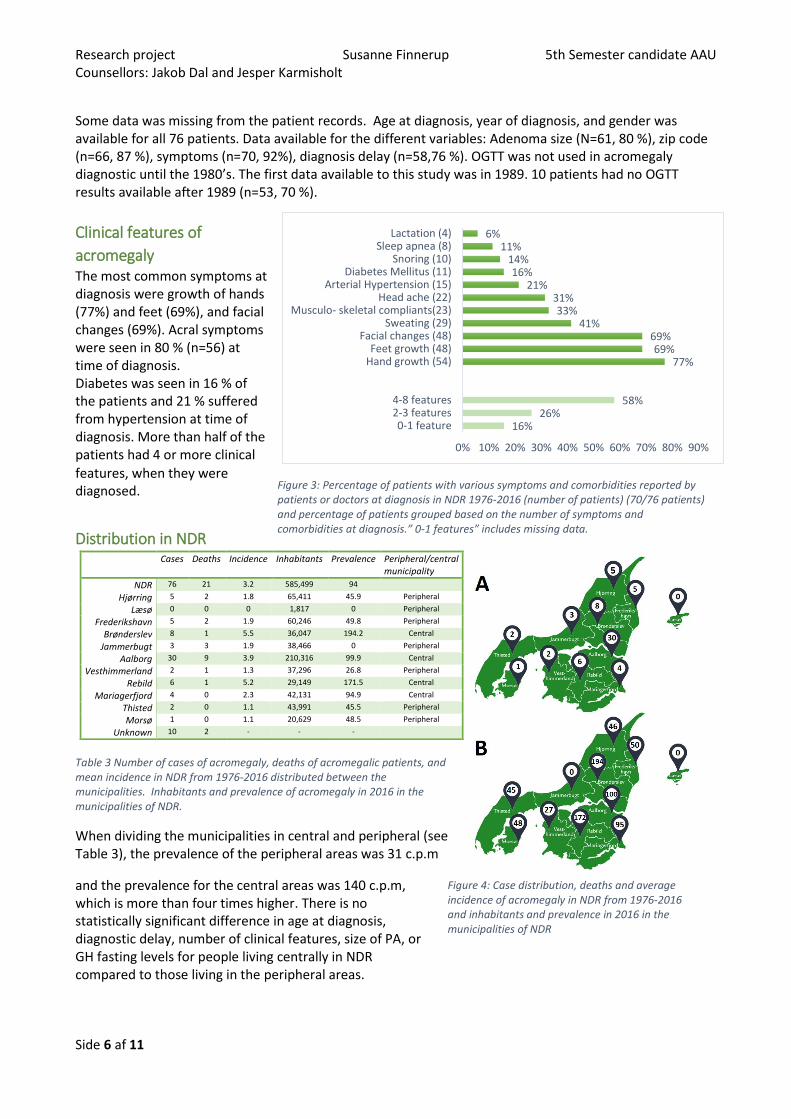
Some data was missing from the patient records. Age at diagnosis, year of diagnosis, and gender was available for all 76 patients. Data available for the different variables: Adenoma size (N=61, 80 %), zip code (n=66, 87 %), symptoms (n=70, 92%), diagnosis delay (n=58,76 %). OGTT was not used in acromegaly diagnostic until the 1980’s. The first data available to this study was in 1989. 10 patients had no OGTT results available after 1989 (n=53, 70 %).
Clinical features of
acromegaly The most common symptoms at diagnosis were growth of hands (77%) and feet (69%), and facial changes (69%). Acral symptoms were seen in 80 % (n=56) at time of diagnosis. Diabetes was seen in 16 % of the patients and 21 % suffered from hypertension at time of diagnosis. More than half of the patients had 4 or more clinical
features, when they were diagnosed.
Distribution in NDR
Table 3 Number of cases of acromegaly, deaths of acromegalic patients, and mean incidence in NDR from 1976-2016 distributed between the municipalities. Inhabitants and prevalence of acromegaly in 2016 in the municipalities of NDR.
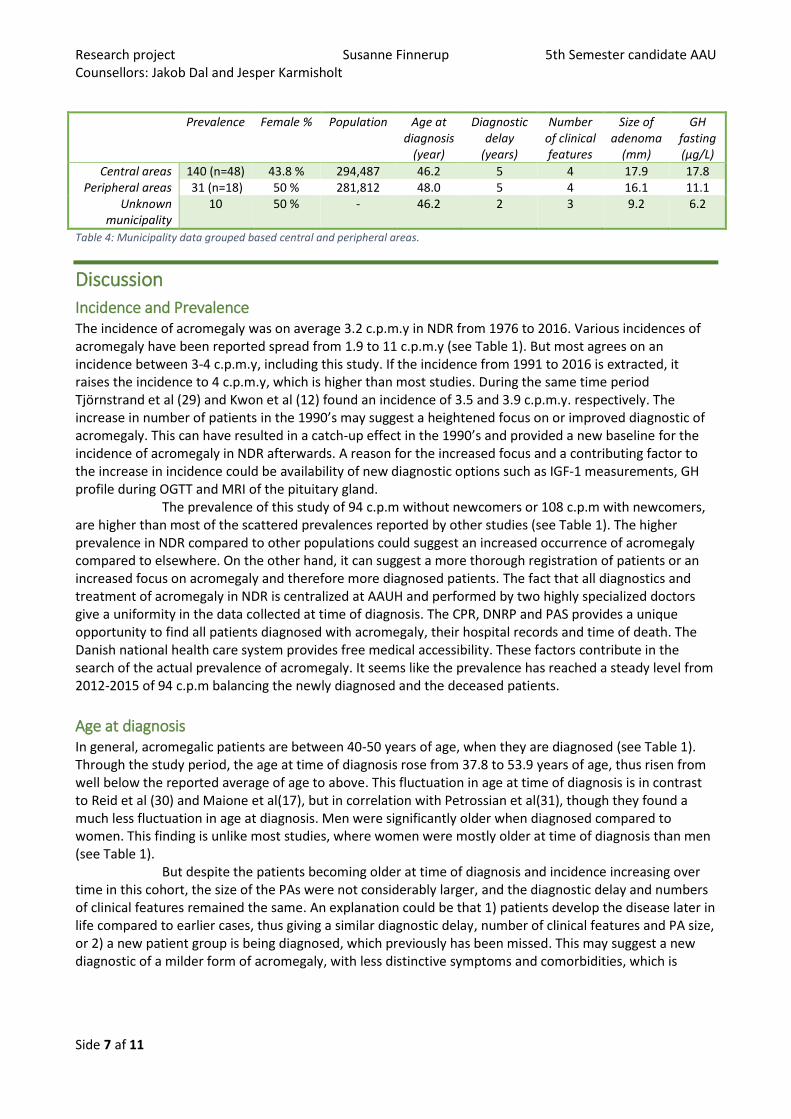
When dividing the municipalities in central and peripheral (see Table 3), the prevalence of the peripheral areas was 31 c.p.m
and the prevalence for the central areas was 140 c.p.m, which is more than four times higher. There is no statistically significant difference in age at diagnosis, diagnostic delay, number of clinical features, size of PA, or GH fasting levels for people living centrally in NDR compared to those living in the peripheral areas.
Figure 3: Percentage of patients with various symptoms and comorbidities reported by patients or doctors at diagnosis in NDR 1976-2016 (number of patients) (70/76 patients) and percentage of patients grouped based on the number of symptoms and comorbidities at diagnosis.” 0-1 features” includes missing data.
Figure 4: Case distribution, deaths and average incidence of acromegaly in NDR from 1976-2016 and inhabitants and prevalence in 2016 in the municipalities of NDR
Research project Susanne Finnerup 5th Semester candidate AAU Counsellors: Jakob Dal and Jesper Karmisholt
Side 7 af 11
Prevalence Female % Population Age at diagnosis
(year)
Diagnostic delay
(years)
Number of clinical features
Size of adenoma
(mm)
GH fasting (µg/L)
Central areas 140 (n=48) 43.8 % 294,487 46.2 5 4 17.9 17.8 Peripheral areas 31 (n=18) 50 % 281,812 48.0 5 4 16.1 11.1
Unknown municipality
10 50 % - 46.2 2 3 9.2 6.2
Table 4: Municipality data grouped based central and peripheral areas.
Discussion
Incidence and Prevalence The incidence of acromegaly was on average 3.2 c.p.m.y in NDR from 1976 to 2016. Various incidences of acromegaly have been reported spread from 1.9 to 11 c.p.m.y (see Table 1). But most agrees on an incidence between 3-4 c.p.m.y, including this study. If the incidence from 1991 to 2016 is extracted, it raises the incidence to 4 c.p.m.y, which is higher than most studies. During the same time period Tjörnstrand et al (29) and Kwon et al (12) found an incidence of 3.5 and 3.9 c.p.m.y. respectively. The increase in number of patients in the 1990’s may suggest a heightened focus on or improved diagnostic of acromegaly. This can have resulted in a catch-up effect in the 1990’s and provided a new baseline for the incidence of acromegaly in NDR afterwards. A reason for the increased focus and a contributing factor to the increase in incidence could be availability of new diagnostic options such as IGF-1 measurements, GH profile during OGTT and MRI of the pituitary gland. The prevalence of this study of 94 c.p.m without newcomers or 108 c.p.m with newcomers, are higher than most of the scattered prevalences reported by other studies (see Table 1). The higher prevalence in NDR compared to other populations could suggest an increased occurrence of acromegaly compared to elsewhere. On the other hand, it can suggest a more thorough registration of patients or an increased focus on acromegaly and therefore more diagnosed patients. The fact that all diagnostics and treatment of acromegaly in NDR is centralized at AAUH and performed by two highly specialized doctors give a uniformity in the data collected at time of diagnosis. The CPR, DNRP and PAS provides a unique opportunity to find all patients diagnosed with acromegaly, their hospital records and time of death. The Danish national health care system provides free medical accessibility. These factors contribute in the search of the actual prevalence of acromegaly. It seems like the prevalence has reached a steady level from 2012-2015 of 94 c.p.m balancing the newly diagnosed and the deceased patients.
Age at diagnosis In general, acromegalic patients are between 40-50 years of age, when they are diagnosed (see Table 1). Through the study period, the age at time of diagnosis rose from 37.8 to 53.9 years of age, thus risen from well below the reported average of age to above. This fluctuation in age at time of diagnosis is in contrast to Reid et al (30) and Maione et al(17), but in correlation with Petrossian et al(31), though they found a much less fluctuation in age at diagnosis. Men were significantly older when diagnosed compared to women. This finding is unlike most studies, where women were mostly older at time of diagnosis than men (see Table 1).
But despite the patients becoming older at time of diagnosis and incidence increasing over time in this cohort, the size of the PAs were not considerably larger, and the diagnostic delay and numbers of clinical features remained the same. An explanation could be that 1) patients develop the disease later in life compared to earlier cases, thus giving a similar diagnostic delay, number of clinical features and PA size, or 2) a new patient group is being diagnosed, which previously has been missed. This may suggest a new diagnostic of a milder form of acromegaly, with less distinctive symptoms and comorbidities, which is
Research project Susanne Finnerup 5th Semester candidate AAU Counsellors: Jakob Dal and Jesper Karmisholt
Side 8 af 11
backed by the lower GH fasting levels after 2000. The focus on acromegaly and advances in the diagnostics may have facilitated the diagnostics of a group of patients, who may have been overlooked earlier.
Even though the incidence were increasing and the diagnostical tools improved, the diagnostic delay for the patients were roughly 5 years throughout the study. This is similar to studies (16,18,19,25). The continuous diagnostic delay was also found by Reid et al (30). It may indicate an ongoing latency of the diagnosis of patients with acromegaly.
Clinical features of acromegaly One of the objectives for this study was to investigate the characteristics of acromegalic patient, including which symptoms and comorbidities they report at time of diagnosis.
Frequently reported comorbidities associated with acromegaly were hypertension (21 %) and diabetes (16 %). On the other hand, the frequency of both hypertension and diabetes was lower in this study compared to others, where the frequency of hypertension is 27-48 % (8,11,13,20,21,25) and diabetes is 16.2-37.6 % (8,11,13,17,18,22,23). The difference in frequencies may be due to different study methods. This study focused on patient records and the doctor’s notes. It was not investigated if the patient in fact had diabetes or hypertension in contrast to other studies. In addition, these comorbidities are monitored and treated by the general practitioners, so there is no focus on it in the patient records. Finally, if the increased incidence is caused by the identification of a milder form of acromegaly, the lower percentage of hypertension and diabetes can be the result of a patient group, that has not developed these comorbidities prior to the time of diagnosis.
The most common symptom among the patients of this study were acral (80%) and facial changes (69%). This suggests, that most patients have visible changes due to the acromegaly at time of diagnosis. Rosario et al(32) suggested a screening for phenotypic alterations by general practitioners to identify patients with acromegaly due to its early onset in the disease in contrast to comorbidities. In a different study by the same investigators, they screened patients with hypertension and no acral growth to identify acromegaly(33). It did not identify any patients with acromegaly.
Municipality distribution In this study, a four times higher prevalence was found in the central municipalities compared to the peripheral ones. Other studies found similar, though less distinct, tendencies. Kwon et al (12) found that more the half of their patients came from the capital area. They suggested that medical accessibility caused the difference. Mestron et al (13) and Bex et al (11) ascribed the differences to varying reporting from different hospitals. This cannot explain the phenomenon observed in this study, due to the national healthcare system in Denmark and the centralized care of acromegalic patients in NDR. There were no significant difference in age at time of diagnosis, diagnostic delay, number of clinical features, size of adenoma, and GH-fasting between patients from peripheral and central areas. The only difference was the number of patients and which municipality they lived in. Assuming the incidence should be the same, the patients with acromegaly are not found in the peripheral areas. Whether the reason is lack of awareness among doctors due the rarity of acromegaly, or because the patients in these areas do not seek medical attention is up to further investigation.
Using the prevalence from the central areas to calculate the supposed prevalence for NDR, it gives a predicted prevalence 162 c.p.m. This is higher than any of the reported prevalences in Table 1, though a much higher prevalence has been reported in a screening study by Schneider et al (34). They screened primary care patients for elevated IGF-1 levels and found a calculated prevalence of 1034 c.p.m, which suggest a much higher prevalence of acromegaly than previously reported. The estimate is based on 6773 subjects and involves a degree of uncertainty.
Research project Susanne Finnerup 5th Semester candidate AAU Counsellors: Jakob Dal and Jesper Karmisholt
Side 9 af 11
Limitations One of the limitations of this study has been the number of cases of acromegaly. The disease is rare and the population of NDR is small compared to other studies. This provides a degree of uncertainty in the results. Furthermore, the assays of the biochemical analysis have changed several times through the study period. This hinders comparison of IGF-1 levels and GH-measurement over time and to other cohorts.
Conclusion The diagnostical work of the physicians in NDR has resulted in an increase in cases during the study period and has provided a higher incidence and prevalence compared to most other studies. This indicates that more patients are identified and perhaps even a new group of patients, which are older and has lower GH-levels. The diagnostic delay, number of clinical features at time of diagnosis and size of PA remained unchanged through the study period. Despite the increase in cases and the advances in biochemical analysis and imaging, the severity and duration of the disease prior to diagnosis has not improved. Besides advanced diagnostical tools, a diagnosis requires the awareness of the physicians and the patient. The focus in the diagnosis of acromegaly should be on the facial and acral changes, and perhaps a screening for IGF -1, especially in patients in the peripheral areas.
References 1. S. M. Acromegaly. N Engl J Med [Internet]. 2006;355(24):2558–73. Available from:
http://www.embase.com/search/results?subaction=viewrecord&from=export&id=L44917504
2. C. C, J.A.H. W. Acromegaly. J Endocrinol [Internet]. 2015;226(2):T141–60. Available from: http://www.embase.com/search/results?subaction=viewrecord&from=export&id=L606211875
3. Holdaway IM, Rajasoorya C. Epidemiology of Acromegaly. Pituitary. 1999;2(1):29–41.
4. Chanson P, Salenave S. Acromegaly. Orphanet J Rare Dis. 2008 Jun 25;3:17.
5. P. C, S. S, P. K, L. C, J. Y. Acromegaly. Best Pract Res Clin Endocrinol Metab [Internet]. 2009;23(5):555–74. Available from: http://www.embase.com/search/results?subaction=viewrecord&from=export&id=L355787076
6. Dal J, Feldt-Rasmussen U, Andersen M, Kristensen LO, Laurberg P, Pedersen L, et al. Acromegaly incidence, prevalence, complications and long-term prognosis: a nationwide cohort study. Eur J Endocrinol. 2016 Sep;175(3):181–90.
7. Endocrinology DS of. http://www.endocrinology.dk/index.php/nbvhovedmenu/4-hypofyse-og-binyresygdomme/nbv-akromegali [Internet]. [cited 2018 Dec 3]. Available from: http://www.endocrinology.dk/index.php/nbvhovedmenu/4-hypofyse-og-binyresygdomme/nbv-akromegali
8. Portocarrero-Ortiz LA, Vergara-Lopez A, Vidrio-Velazquez M, Uribe-Diaz AM, Garcia-Dominguez A, Reza-Albarran AA, et al. The Mexican Acromegaly Registry: Clinical and Biochemical Characteristics at Diagnosis and Therapeutic Outcomes. J Clin Endocrinol Metab. 2016 Nov;101(11):3997–4004.
9. Agustsson TT, Baldvinsdottir T, Jonasson JG, Olafsdottir E, Steinthorsdottir V, Sigurdsson G, et al. The epidemiology of pituitary adenomas in Iceland, 1955-2012: a nationwide population-based study. Eur J Endocrinol. 2015 Nov;173(5):655–64.
10. Burton T, Le Nestour E, Neary M, Ludlam WH. Incidence and prevalence of acromegaly in a large US
Research project Susanne Finnerup 5th Semester candidate AAU Counsellors: Jakob Dal and Jesper Karmisholt
Side 10 af 11
health plan database. Pituitary. 2016 Jun;19(3):262–7.
11. M. B, R. A, G. T, J. M, B. V, K. M, et al. AcroBel - The Belgian registry on acromegaly: A survey of the “real-life” outcome in 418 acromegalic subjects. Eur J Endocrinol [Internet]. 2007;157(4):399–409. Available from: http://www.embase.com/search/results?subaction=viewrecord&from=export&id=L350018442
12. Kwon O, Song YD, Kim SY, Lee EJ, Rare Disease Study Group Korean Endocrine Society S and RC. Nationwide survey of acromegaly in South Korea. Clin Endocrinol (Oxf). 2013 Apr;78(4):577–85.
13. Mestron A, Webb SM, Astorga R, Benito P, Catala M, Gaztambide S, et al. Epidemiology, clinical characteristics, outcome, morbidity and mortality in acromegaly based on the Spanish Acromegaly Registry (Registro Espanol de Acromegalia, REA). Eur J Endocrinol. 2004;151(4):439–46.
14. Dal J, Skou N, Nielsen EH, Jorgensen JO, Pedersen L. Acromegaly according to the Danish National Registry of Patients: how valid are ICD diagnoses and how do patterns of registration affect the accuracy of registry data? Clin Epidemiol. 2014 Sep 1;6:295–9.
15. A. T, K. G, M. E, E. H, O. R, T. R, et al. The incidence rate of pituitary adenomas in western Sweden for the period 2001-2011. Eur J Endocrinol [Internet]. 2014;171(4):519–26. Available from: http://www.embase.com/search/results?subaction=viewrecord&from=export&id=L600058734
16. S. P, M. B, B. G, H. F, H.J. Q, H.M. S, et al. Age and sex as predictors of biochemical activity in acromegaly: Analysis of 1485 patients from the German Acromegaly Register. Clin Endocrinol (Oxf) [Internet]. 2009;71(3):400–5. Available from: http://www.embase.com/search/results?subaction=viewrecord&from=export&id=L355131224
17. L. M, T. B, A. B, B. D, P. P, F. B-C, et al. Changes in the management and comorbidities of acromegaly over three decades: The French acromegaly registry. Eur J Endocrinol [Internet]. 2017;176(5):645–55. Available from: http://www.embase.com/search/results?subaction=viewrecord&from=export&id=L615509971
18. Terzolo M, Reimondo G, Berchialla P, Ferrante E, Malchiodi E, De Marinis L, et al. Acromegaly is associated with increased cancer risk: a survey in Italy. Endocr Relat Cancer. 2017 Sep;24(9):495–504.
19. Fernandez A, Karavitaki N, Wass JA. Prevalence of pituitary adenomas: a community-based, cross-sectional study in Banbury (Oxfordshire, UK). Clin Endocrinol (Oxf). 2010 Mar;72(3):377–82.
20. Hoskuldsdottir GT, Fjalldal SB, Sigurjonsdottir HA. The incidence and prevalence of acromegaly, a nationwide study from 1955 through 2013. Pituitary. 2015 Dec;18(6):803–7.
21. G. V, R. P, R.S. A, E. G, F. M, S. S, et al. Hypertension in acromegaly and in the normal population: Prevalence and determinants. Clin Endocrinol (Oxf) [Internet]. 2005;63(4):470–6. Available from: http://www.embase.com/search/results?subaction=viewrecord&from=export&id=L41442344
22. S. D, N. C, T. E. Increased thyroid cancer risk in acromegaly. Pituitary [Internet]. 2014;17(4):299–306. Available from: http://www.embase.com/search/results?subaction=viewrecord&from=export&id=L52670284
23. S. F, I. M, P. P, P. C, V. R, C. C, et al. Diabetes in acromegaly, prevalence, risk factors, and evolution: Data from the French Acromegaly Registry. Eur J Endocrinol [Internet]. 2011;164(6):877–84. Available from: http://www.embase.com/search/results?subaction=viewrecord&from=export&id=L361846603
Research project Susanne Finnerup 5th Semester candidate AAU Counsellors: Jakob Dal and Jesper Karmisholt
Side 11 af 11
24. L. N, A. D, B. S, H. L, R. Z, A. K. Extensive clinical experience: Changing patterns in diagnosis and therapy of acromegaly over two decades. J Clin Endocrinol Metab [Internet]. 2008;93(6):2035–41. Available from: http://www.embase.com/search/results?subaction=viewrecord&from=export&id=L351831512
25. M. A, G. R, E. M, P. B, A. B, De ML, et al. Predictors of morbidity and mortality in acromegaly: An Italian survey. Eur J Endocrinol [Internet]. 2012;167(2):189–98. Available from: http://www.embase.com/search/results?subaction=viewrecord&from=export&id=L365329686
26. Park JY, Kim JH, Kim SW, Chung JH, Min YK, Lee MS, et al. Using growth hormone levels to detect macroadenoma in patients with acromegaly. Endocrinol Metab (Seoul, Korea). 2014 Dec 29;29(4):450–6.
27. Lavrentaki A, Paluzzi A, Wass JA, Karavitaki N. Epidemiology of acromegaly: review of population studies. Pituitary. 2017 Feb;20(1):4–9.
28. Caputo M, Ucciero A, Mele C, De Marchi L, Magnani C, Cena T, et al. Use of administrative health databases to estimate incidence and prevalence of acromegaly in Piedmont Region, Italy. J Endocrinol Invest. 2018 Aug 1;
29. Tjornstrand A, Gunnarsson K, Evert M, Holmberg E, Ragnarsson O, Rosen T, et al. The incidence rate of pituitary adenomas in western Sweden for the period 2001-2011. Eur J Endocrinol. 2014;171(4):519–26.
30. Tirissa J. Reid. Features at diagnosis of 324 patients with acromegaly. Clin Endocrinol (Oxf). 2008;6(9):2166–71.
31. Petrossians P, Daly AF, Natchev E, Maione L, Blijdorp K, Sahnoun-Fathallah M, et al. Acromegaly at diagnosis in 3173 patients from the Liège Acromegaly Survey (LAS) Database. Endocr Relat Cancer. 2017;24(10):505–18.
32. Weslley P, Maria R, Calsolari R. Screening for acromegaly by application of a simple questionnaire evaluating the enlargement of extremities in adult patients seen at primary health care units. 2012;179–83.
33. Rosario PW, Calsolari MR. Screening for acromegaly in adult patients not reporting enlargement of extremities, but with arterial hypertension associated with another comorbidity of the disease. 2014;
34. Schneider HJ, Sievers C, Saller B, Wittchen HU, Stalla GK. High prevalence of biochemical acromegaly in primary care patients with elevated IGF-1 levels. Clin Endocrinol (Oxf). 2008 Sep;69(3):432–5.