Acoustic Monitoring Report
38
National Park Service U.S. Department of the Interior Natural Resource Stewardship and Science Valles Caldera National Preserve Acoustic Monitoring Report Natural Resource Report NPS/NRSS/NSNSD/NRR—2020/2137
Transcript of Acoustic Monitoring Report

National Park Service U.S. Department of the Interior
Natural Resource Stewardship and Science
Valles Caldera National Preserve Acoustic Monitoring Report
Natural Resource Report NPS/NRSS/NSNSD/NRR—2020/2137

ON THE COVER History Grove at Valles Caldera National Preserve Photograph by: Emma Brown, NSNSD

Valles Caldera National Preserve Acoustic Monitoring Report
Natural Resource Report NPS/NRSS/NSNSD/NRR—2020/2137
Dr. Jacob R. Job National Park Service Natural Sounds and Night Skies Division 1201 Oakridge Drive, Suite 100 Fort Collins, Colorado 80525
June 2020 U.S. Department of the Interior National Park Service Natural Resource Stewardship and Science Fort Collins, Colorado
ii
The National Park Service, Natural Resource Stewardship and Science office in Fort Collins, Colorado, publishes a range of reports that address natural resource topics. These reports are of interest and applicability to a broad audience in the National Park Service and others in natural resource management, including scientists, conservation and environmental constituencies, and the public.
The Natural Resource Report Series is used to disseminate comprehensive information and analysis about natural resources and related topics concerning lands managed by the National Park Service. The series supports the advancement of science, informed decision-making, and the achievement of the National Park Service mission. The series also provides a forum for presenting more lengthy results that may not be accepted by publications with page limitations.
All manuscripts in the series receive the appropriate level of peer review to ensure that the information is scientifically credible, technically accurate, appropriately written for the intended audience, and designed and published in a professional manner.
Data in this report were collected analyzed using methods based on established, peer-reviewed protocols and were analyzed and interpreted within the guidelines of the protocols.
Views, statements, findings, conclusions, recommendations, and data in this report do not necessarily reflect views and policies of the National Park Service, U.S. Department of the Interior. Mention of trade names or commercial products does not constitute endorsement or recommendation for use by the U.S. Government.
This report is available in digital format from the Natural Sounds website and the Natural Resource Publications Management website. If you have difficulty accessing information in this publication, particularly if using assistive technology, please email [email protected].
Please cite this publication as:
Job, J. R. 2020 Valles Caldera National Preserve: Acoustic monitoring report. Natural Resource Report NPS/NRSS/NSNSD/NRR—2020/2137. National Park Service, Fort Collins, Colorado.
NPS 821/132201, March 2020 NPS 216/170371, June 2020

iii
Contents Page
Figures................................................................................................................................................... iv
Tables ..................................................................................................................................................... v
Executive Summary .............................................................................................................................. vi
Glossary of Acoustical Terms ................................................................................................................ x
Introduction ............................................................................................................................................ 1
National Park Service Natural Sounds and Night Skies Division .................................................. 1
Soundscape Planning Authorities ................................................................................................... 1
Study Area ............................................................................................................................................. 3
Methods .................................................................................................................................................. 5
Automatic Monitoring .................................................................................................................... 5
Monitoring Period .......................................................................................................................... 5
Calculation of Metrics .................................................................................................................... 6
Off-Site Listening ........................................................................................................................... 6
Results .................................................................................................................................................... 7
Frequency content .......................................................................................................................... 7
Sound level: Time Above ............................................................................................................... 8
Sound Level: Percentile Levels .................................................................................................... 10
Event duration .............................................................................................................................. 11
Discussion ............................................................................................................................................ 15
Literature Cited .................................................................................................................................... 17
Appendix A: Site Photographs ............................................................................................................. 19
Appendix B: Modeled Impact Levels .................................................................................................. 21

iv
Figures Page
Figure 1. Location of acoustical monitoring sites at Valles Caldera National Preserve. ....................... 4
Figure 2. Day and night percentile sound pressure levels for 33 one-third octave bands at VALL001. .............................................................................................................................................. 8
Figure 3. Day and night percentile sound pressure levels for 33 one-third octave bands at VALL002. .............................................................................................................................................. 8
Figure 4. Median percentile sound levels (LAeq, 1s), in dB re 20 µPa, at VALL001 ............................. 10
Figure 5. Median percentile sound levels (LAeq, 1s), in dB re 20 µPa, at VALL002 ............................. 11
Figure 6. Hourly time audible for aircraft, vehicle, and all noise sources at VALL001. ..................... 14
Figure 7. Hourly time audible for aircraft, vehicle, and all noise sources at VALL002. ..................... 14
Figure 8. Site photograph of VALL001, ‘Valle Toledo’. .................................................................... 19
Figure 9. Site photograph of VALL002, ‘History Grove’. .................................................................. 20
Figure 10. Modeled median sound level impacts in the area immediately surrounding VALL and the nearby region (inset). ................................................................................................... 22

v
Tables Page
Table 1. Sound level examples ............................................................................................................. vi
Table 2. Time above metrics for VALL001 and VALL002. ............................................................... vii
Table 3. Mean time audible for human-caused, aircraft, and vehicle noise sources, existing and natural ambient sound levels (dB re 20 µPa, A-weighted broadband,12.5 Hz—20 kHz) at VALL001 and VALL002 (where day is 7:00 – 19:00 and night is 19:00 – 7:00) .................................................................................................................................................viii
Table 4. VALL acoustic monitoring sites. ............................................................................................. 3
Table 5. Time above metrics for VALL001 and VALL002. ................................................................. 9
Table 6. Mean hourly percent time audible for each noise and sound source at VALL001. ............... 12
Table 7. Mean hourly percent time audible for each noise and sound source at VALL002. ............... 13

vi
Executive Summary In 2016, the Natural Sounds and Night Skies Division (NSNSD) received a request to collect baseline acoustical data at Valles Caldera National Preserve (VALL). Between June and July 2017, two acoustical monitoring stations were deployed within the park. Both sites were disturbed by elk with only three days of usable data gathered at VALL002. The goal of the study was to establish a baseline soundscape inventory of the park. This inventory will be used to establish indicators and thresholds of soundscape quality that will support the park and NSNSD in developing a comprehensive approach to protecting the acoustic environment through soundscape management planning. Additionally, results of this study will help the park identify major sources of noise within the park, as well as provide a baseline understanding of the acoustical environment as a whole for use in potential future comparative studies.
In this deployment, sound pressure level (SPL) was measured continuously every second by a calibrated sound level meter. Other equipment included an anemometer to collect wind speed and a digital audio recorder collecting continuous recordings to document sound sources. In this document, “sound pressure level” refers to broadband (12.5 Hz - 20 kHz), A-weighted, 1-second time averaged sound level (LAeq, 1s), and hereafter referred to as “sound level.” Sound levels are measured on a logarithmic scale relative to the reference sound pressure for atmospheric sources, 20 µPa. The logarithmic scale is a useful way to express the wide range of sound pressures perceived by the human ear. Sound levels are reported in decibels (dB). A-weighting is applied to sound levels in order to account for the response of the human ear (Harris, 1998). To approximate human hearing sensitivity, A-weighting discounts sounds below 1 kHz and above 6 kHz. For reference, Table 1 provides examples of sound levels measured in parks compared to sound levels of common sound sources.
Table 1. Sound level examples
Park Sound Sources Common Sound Sources Sound Level dB*
Volcano crater (HALE) Human breathing at 3m 10
Leaves rustling (CANY) Whispering 20
Crickets at 5m (ZION) Residential area at night 40
Conversation at 5m (WHMI) Busy restaurant 60
Cruiser motorcycle at 15m (BLRI) Curbside of busy street 80
Thunder (ARCH) Jackhammer at 2 m 100
Military jet at 100m AGL (YUCH) Train horn at 1 m 120
* dB re 20 µPa A-weighted broadband (12.5 Hz—20 kHz), sound level measured over varied measurement durations and at the distances indicated.
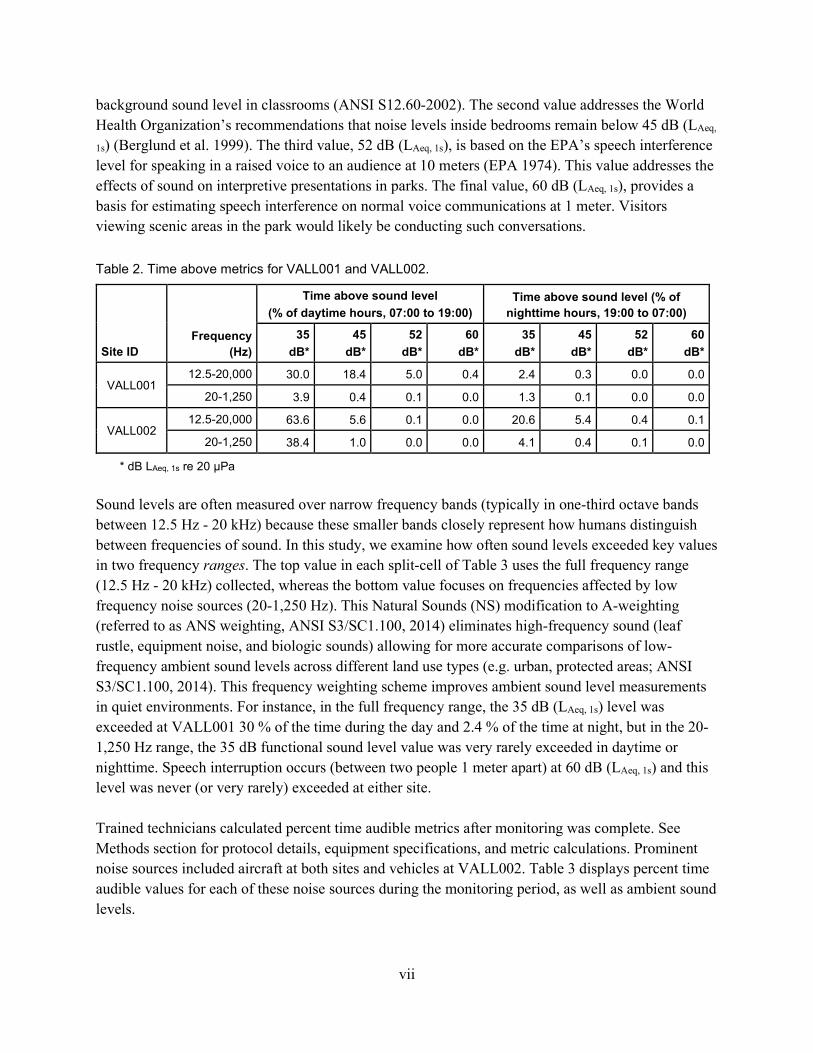
Table 2 reports the percent of time that measured levels at the monitoring locations were above four key sound level values. The first value, 35 dB (LAeq, 1s), addresses the health effects of sleep interruption. Recent studies suggest that sound events as low as 35 dB can have adverse effects on blood pressure in sleeping humans (Haralabidis et al. 2008). This level, 35 dB, is also the desired
vii
background sound level in classrooms (ANSI S12.60-2002). The second value addresses the World Health Organization’s recommendations that noise levels inside bedrooms remain below 45 dB (LAeq,
1s) (Berglund et al. 1999). The third value, 52 dB (LAeq, 1s), is based on the EPA’s speech interference level for speaking in a raised voice to an audience at 10 meters (EPA 1974). This value addresses the effects of sound on interpretive presentations in parks. The final value, 60 dB (LAeq, 1s), provides a basis for estimating speech interference on normal voice communications at 1 meter. Visitors viewing scenic areas in the park would likely be conducting such conversations.
Table 2. Time above metrics for VALL001 and VALL002.
Site ID Frequency
(Hz)
Time above sound level (% of daytime hours, 07:00 to 19:00)
Time above sound level (% of nighttime hours, 19:00 to 07:00)
35 dB*
45 dB*
52 dB*
60 dB*
35 dB*
45 dB*
52 dB*
60 dB*
VALL001 12.5-20,000 30.0 18.4 5.0 0.4 2.4 0.3 0.0 0.0
20-1,250 3.9 0.4 0.1 0.0 1.3 0.1 0.0 0.0
VALL002 12.5-20,000 63.6 5.6 0.1 0.0 20.6 5.4 0.4 0.1
20-1,250 38.4 1.0 0.0 0.0 4.1 0.4 0.1 0.0
* dB LAeq, 1s re 20 µPa Sound levels are often measured over narrow frequency bands (typically in one-third octave bands between 12.5 Hz - 20 kHz) because these smaller bands closely represent how humans distinguish between frequencies of sound. In this study, we examine how often sound levels exceeded key values in two frequency ranges. The top value in each split-cell of Table 3 uses the full frequency range (12.5 Hz - 20 kHz) collected, whereas the bottom value focuses on frequencies affected by low frequency noise sources (20-1,250 Hz). This Natural Sounds (NS) modification to A-weighting (referred to as ANS weighting, ANSI S3/SC1.100, 2014) eliminates high-frequency sound (leaf rustle, equipment noise, and biologic sounds) allowing for more accurate comparisons of low-frequency ambient sound levels across different land use types (e.g. urban, protected areas; ANSI S3/SC1.100, 2014). This frequency weighting scheme improves ambient sound level measurements in quiet environments. For instance, in the full frequency range, the 35 dB (LAeq, 1s) level was exceeded at VALL001 30 % of the time during the day and 2.4 % of the time at night, but in the 20-1,250 Hz range, the 35 dB functional sound level value was very rarely exceeded in daytime or nighttime. Speech interruption occurs (between two people 1 meter apart) at 60 dB (LAeq, 1s) and this level was never (or very rarely) exceeded at either site. Trained technicians calculated percent time audible metrics after monitoring was complete. See Methods section for protocol details, equipment specifications, and metric calculations. Prominent noise sources included aircraft at both sites and vehicles at VALL002. Table 3 displays percent time audible values for each of these noise sources during the monitoring period, as well as ambient sound levels.

viii
Table 3. Mean time audible for human-caused, aircraft, and vehicle noise sources, existing and natural ambient sound levels (dB re 20 µPa, A-weighted broadband,12.5 Hz—20 kHz) at VALL001 and VALL002 (where day is 7:00 – 19:00 and night is 19:00 – 7:00)
Site ID Site Description Season
Mean time audible for noise (% of 24 hour time period)a
Median Existing Ambient (LA50) in
dB
Median Natural Ambient (LAnat)
in dB
All Noise Aircraft Vehicle Day Night Day Night
VALL001 Valle Toledo Summer 26.5 24.5 0.0 26.6 16.5 24.5 16.0
VALL002 History Grove Summer 29.7 18.5 7.5 36.6 23.3 34.5 22.4
a Over a 24-hour period, based on eight days of analysis at VALL001 and three days of analysis at VALL002. Overall, existing ambient sound levels (LA50) at the preserve ranged from 26.6 dB to 36.6 dB during the day and from 16.0 dB to 22.4 dB at night. Sound source analysis results show that aircraft are the primary source of noise within the park; however, vehicles also contribute to the acoustical environment at VALL002. The overall audibility of noise at VALL001 and VALL002 over the 24-hour day was 26.5% and 29.7% respectively, providing visitors the opportunity for solitude. The acoustical environment at these sites consists of natural sounds not found in most urban or suburban environments. These sounds add a unique dimension to the park experience, and the combination of extended noise-free intervals and relatively quiet overall sound levels afford visitors an opportunity to hear faint or very distant natural sounds.

ix
Acknowledgments The author of this report wishes to express his gratitude to Emma Brown and Scott Compton for their work in deploying the acoustical monitoring stations. The author would also like to thank Hannah Vincelette for her work in the off-site analysis of the acoustical data.

x
Glossary of Acoustical Terms
Glossary of acoustic terms and definitions
Term Definition
A-weighting A-weighting is applied to sound levels in order to account for the sensitivity of the human ear (Harris, 1998). To approximate human hearing sensitivity, A-weighting discounts sounds below 1 kHz and above 6 kHz.
Acoustic Environment
A combination of all the physical sound resources within a given area. This includes natural sounds and cultural sounds, and non-natural human-caused sounds. The acoustic environment of a park can be divided into two main categories: intrinsic and extrinsic.
Acoustic Resources Includes both natural sounds like wind, water, & wildlife and cultural and historic sounds like tribal ceremonies, quiet reverence, and battle reenactments.
Amplitude The relative strength of a sound wave, described in decibels (dB). Amplitude is related to what we commonly call loudness or volume.
ANS Weighting
The Natural Sounds (NS) modification to A-weighting eliminates high-frequency sound (leaf rustle, equipment noise, and biologic sounds) allowing for more accurate comparisons of low-frequency ambient sound levels across different land use types (e.g. urban, protected areas; ANSI S3/SC1.100, 2014). This frequency weighting scheme improves ambient sound level measurements in quiet environments.
Audibility The ability of animals with normal hearing, including humans, to hear a given sound. It can vary depending upon the frequency content and amplitude of sound and by hearing ability of individual animals.
Decibel (dB)
A unit of sound energy. Sound levels are measured on a logarithmic scale relative to the reference sound pressure for atmospheric sources, 20 µPa. The logarithmic scale is a useful way to express the wide range of sound pressures perceived by the human ear. Sound levels are reported as decibels (dB). Every 10 dB increase represents a tenfold increase in energy. Therefore, a 20 dB increase represents a hundredfold increase in energy.
Existing ambient sound level (LA50)
sound level (LAeq, 1s) exceeded 50% of the time (50th percentile) for a specified duration. This level is referred to as the existing ambient sound level and the preferred metric for chronic conditions, as it is insensitive to infrequent loud events.
Frequency
Related to the pitch of a sound, and defined as the number of times per second that the wave of sound repeats itself and is expressed in terms of hertz (Hz). Sound levels are often adjusted ("weighted") to match the hearing abilities of a given animal. In other words, different species of animals and humans are capable or hearing (or not hearing) at different frequencies. Humans with normal hearing can hear sounds between 20 Hz and 20,000 Hz, and as low as 0 dB at 1,000 Hz. Bats, on the other hand, can hear sounds between 20 Hz and 200,000 Hz.
Percentile sound levels (LA10, LA50, LA90)
Metrics used to describe A-weighted sound pressure levels (L), in decibels, exceeded 10, 50, and 90 percent of the time, respectively. Put another way, half the time the measured levels of sound are greater than the LA50 value, while 90 percent of the time the measured levels are higher than the LA90 value, and 10 percent of the time measured levels are higher than the LA10 value.

xi
Glossary of acoustic terms and definitions (continued)
Term Definition
Day-Night average sound levels (Ldn)
Day-Night Average Sound Level. Average equivalent sound level over a 24-hour period, with a 10-dB penalty added for sound levels between 10 p.m. and 7 a.m.
Energy Equivalent Sound Level (LAeq)
The sound energy level averaged over the measurement period. Generally, refers to A-weighted 1-second time averaged sound levels measured between 12.5 Hz - 20 kHz. This is a standard measurement collected using NSNSD acoustic monitoring protocol for sound level meters. Sound levels measured over 1 second intervals are used to calculate summary statistics, specifically percent of the time a sound level of interest is exceeded.
Natural Ambient Sound Level (LAnat )
The natural sound conditions in parks, which would exist in the absence of any human-caused noise sources. LAnat is the preferred metric to represent baseline or reference conditions.
Noise Free Interval (NFI) The length of the continuous period of time during which no human-caused sounds are audible.
Time Above Within a defined time period, the percent of the time sound levels (LAeq, 1s) are above a specified sound level (LAeq, 1s). Commonly used levels are 35, 45, 52 dB (LAeq, 1s).
Time Audible
The amount of time that various sound sources are audible to humans with normal hearing, commonly expressed in percent of day, or percent of daytime hours and nighttime hours. A sound may be above natural ambient sound pressure levels, but still not audible. Similarly, some sounds that are below the natural ambient can be audible. Time Audible is useful because of its simplicity. It is a measure that correlates well with visitor complaints of excessive noise and annoyance. Most noise sources are audible to humans at lower levels than virtually all wildlife species. Therefore, time audible is a protective proxy for wildlife. These data can be collected either by a trained observer (on-site listening) or by making high-quality digital recordings for later playback (off-site listening).
Sound Exposure Level (SEL) The total sound energy of the actual sound during a specific time period. SEL is usually expressed using a time period of one second.
Sound Pressure Minute change in atmospheric pressure due to passage of sound that can be detected by microphones.
Sound vs. Noise
Sound and noise are often used interchangeably to describe an acoustic source. A common definition of noise is unwanted sound or sounds that interfere with a signal of interest (Harris 1998; Templeton 1997). However, noise is not a purely subjective designation. Any sound that serves no function is noise. Most sounds produced by human transportation and other machinery are unintended and serve no function, therefore are noise regardless of the attitudes of the listener. While there are unintended sounds in nature, like the footfalls of an animal, these sounds provide vital cues for some receivers and are therefore considered sounds to the receiver, yet noise from the perception of the producer.
Soundscape The human perception of physical sound resources.

1
Introduction A 1998 survey of the American public revealed that 72 percent of respondents thought that providing opportunities to experience natural quiet and the sounds of nature was a very important reason for having national parks, while another 23 percent thought that it was somewhat important (Haas & Wakefield 1998). In another survey specific to park visitors, 91 percent of respondents considered enjoyment of natural quiet and the sounds of nature as compelling reasons for visiting national parks (McDonald et al. 1995). Acoustical monitoring provides a scientific basis for assessing the status of acoustic resources, identifying trends in resource conditions, quantifying impacts from other actions, assessing consistency with park management objectives and standards, and informing management decisions regarding desired future conditions.
National Park Service Natural Sounds and Night Skies Division The Natural Sounds and Night Skies Division (NSNSD) helps parks manage sounds in a way that protects park resources and the visitor experience. The NSNSD addresses acoustical issues raised by Congress, NPS Management Policies, and NPS Director’s Orders. The NSNSD works to protect, maintain, or restore acoustical environments throughout the National Park System. Its goal is to provide coordination, guidance, and a consistent approach to soundscape protection with respect to park resources and visitor use. The program also provides technical assistance to parks in the form of acoustical monitoring, data processing, park planning support, and comparative analyses of acoustical environments.
Soundscape Planning Authorities The National Park Service Organic Act of 1916 states that the purpose of national parks is "… to conserve the scenery and the natural and historic objects and the wild life therein and to provide for the enjoyment of the same in such manner and by such means as will leave them unimpaired for the enjoyment of future generations." In addition to the NPS Organic Act, the Redwoods Act of 1978 affirmed that, "the protection, management, and administration of these areas shall be conducted in light of the high value and integrity of the National Park System and shall not be exercised in derogation of the values and purposes for which these various areas have been established, except as may have been or shall be directly and specifically provided by Congress."
Direction for management of natural soundscapes1 is represented in 2006 Management Policy 4.9:
The Service will restore to the natural condition wherever possible those park soundscapes that have become degraded by unnatural sounds (noise) and will protect natural soundscapes from unacceptable impacts. Using appropriate management planning, superintendents will identify what levels and types of unnatural sound constitute acceptable impacts on park natural soundscapes. The frequencies, magnitudes, and durations of acceptable levels of
1 The 2006 Management Policy 4.9 and related documents refer to “soundscapes” instead of “acoustic resources.” When quoting from this authority, it is advisable to note that the term often refers to resources rather than visitor perceptions.

2
unnatural sound will vary throughout a park, being generally greater in developed areas. In and adjacent to parks, the Service will monitor human activities that generate noise that adversely affects park soundscapes [acoustic resources], including noise caused by mechanical or electronic devices. The Service will take action to prevent or minimize all noise that through frequency, magnitude, or duration adversely affects the natural soundscape [acoustic resource] or other park resources or values, or that exceeds levels that have been identified through monitoring as being acceptable to or appropriate for visitor uses at the sites being monitored (NPS 2006a).
It should be noted that “the natural ambient sound level—that is, the environment of sound that exists in the absence of human-caused noise—is the baseline condition, and the standard against which current conditions in a soundscape [acoustic resource] will be measured and evaluated” (NPS 2006b). However, the desired acoustical condition may also depend upon the resources and the values of the park. For instance, “culturally appropriate sounds are important elements of the national park experience in many parks” (NPS 2006b). In this case, “the Service will preserve soundscape resources and values of the parks to the greatest extent possible to protect opportunities for appropriate transmission of cultural and historic sounds that are fundamental components of the purposes and values for which the parks were established” (NPS 2006b).
Further guidance is provided in 2006 Management Policies 4.1.4 Partnerships, 4.1.5 Restoration of Natural Systems, 8.2 Visitor Use, 8.2.2 Recreational Activities, 8.2.3 Use of Motorized Equipment, and 8.4 Overflights and Aviation Uses (NPS 2006).
Directors Order 47, Preservation of the Acoustic Environment and Noise Management (2015) builds on the principles set out in Management Policies, but goes on to direct how and when to consider acoustic resources in park management. Through this order, parks are guided to manage noise by: identifying noise sources, minimizing noise from park operations, considering the acoustic environment in park planning documents, and promoting park sounds and noise management through communication, education, and outreach.
National Parks Air Tour Management Act (NPATMA) was passed on April 5, 2000 to regulate commercial air tour operations for each unit of the National Park System, or abutting tribal land, where such operations occur or are proposed. The Act required the Federal Aviation Administration (FAA), in cooperation with the NPS, to develop an Air Tour Management Plan (ATMP) for each unit of the National Park System to provide acceptable and effective measures to mitigate or prevent the significant adverse impacts, if any, of commercial air tour operations upon natural and cultural resources and visitor experiences. In 2012, NPATMA was amended to allow the FAA and NPS to enter into voluntary agreements with a commercial air tour operator as an alternative to an ATMP.

3
Study Area Valles Caldera National Preserve (VALL) was formally established in 2000 by Congress and President Bill Clinton to preserve the unique volcanic landscape and homeland of ancestral native Puebloans. From June to July 2017, two acoustical monitoring stations were deployed in the park. The Valle Toledo (VALL001) site was chosen to document quiet background sound levels, as predicted by a recently completed noise model (Mennitt 2014), and low visitor use, as it was behind a closed gate, and accessed infrequently for administrative purposes. The History Grove (VALL002) site was designated as a higher use, frontcountry monitoring site. Both sites were disturbed by elk with VALL002 recording only three days of analyzable data (June 23-25, 2017). Elk also disturbed VALL001, but to a lesser degree, and this system ran for a total of 22 days. Table 4 shows site information regarding the monitoring stations. Figure 1 shows the location of the acoustical monitoring sites within the park. It should be noted that at the time these measurements were gathered, the number of visitor vehicles permitted past the entrance station at VALL per day was 35. This limit was commonly reached on both weekdays and weekends during the summer months.
Table 4. VALL acoustic monitoring sites.
Site ID Site Name
Dates Deployed Vegetation
Elevation (m) Latitude Longitude
VALL001 Valle Toledo June 22, 2017 – July 17, 2017
Temperate Grasslands 2637 35.95393 -106.47450
VALL002 History Grove June 22, 2017 – July 17, 2017
Temperate Grasslands 2642 35.87658 -106.51070

4
Figure 1. Location of acoustical monitoring sites at Valles Caldera National Preserve.
5
Methods Automatic Monitoring A Larson Davis 831 sound level meter (SLM) was deployed at these monitoring sites. The Larson Davis SLM is a hardware-based, real-time analyzer which constantly records sound pressure level (SPL) and one-third octave band data. This Larson Davis-based site met American National Standards Institute (ANSI) Type 1 standards. The sound level meter provided the information needed to calculate metrics described below in Calculation of Metrics.
Acoustical monitoring equipment is used by many industries to determine noise levels in different environments, both indoors and outdoors. NPS uses equipment that is similar to the equipment used by other industries but has developed a unique configuration that stands up to the potentially harsh environment encountered in national parks. The microphone with environmental shroud was set up on a tripod at 1.5 m, which approximates the average height of the human ear. The digital audio recorder recorded continuous audio throughout the entire monitoring period. An anemometer was attached to a tripod and placed near the microphone, to capture local wind conditions without recording possible sound from anemometer wind cup rotation. At both sites, equipment was deployed inside an elk exclosure to discourage wildlife from disrupting the measurement.
Each sampling station consisted of:
• Type 1 sound level meter • Microphone with environmental shroud • Preamplifier • 12 V battery pack • Anemometer (wind speed and direction) • Digital audio recorder
Each sampling station collected:
• A-weighted 1 second time averaged sound level (LAeq, 1s) in dB re 20 µPa • Continuous digital audio recordings • One-third octave band data every second ranging from 12.5 Hz – 20,000 Hz • Continuous meteorological data for wind speed
Monitoring Period NSNSD has determined that 25 day monitoring periods during opposing seasons allow the data to capture seasonal difference that occur at each site within a reasonable margin of error (NPS 2005). The monitoring period lasted 22 days at VALL001 and 3 days at VALL002. Both measurement periods were shortened by elk disturbance.
6
Calculation of Metrics The status of the acoustical environment can be characterized by sound level (LA50, LAnat, LA90, LA10, LAeq) and frequency content, and event durations (through off-site listening). NPS uses descriptive figures and metrics to interpret these characteristics.
Two fundamental descriptors are existing ambient (LA50) and natural ambient (LAnat) sound levels. These are both examples of percentile levels, where each Lx value refers to the sound level that is exceeded x% of the time. The LA50 represents the median sound level, and is drawn from a full dataset (removing data with wind speed > 5m/s to eliminate error from microphone distortion). The LA50 is the preferred metric to represent prevailing acoustic conditions. The natural ambient (LAnat) is an estimate of what the sound levels for a site would be if all human-caused noise sources were removed. LAnat is the preferred metric to represent baseline or reference conditions.
For a given hour (or other specified time period), LAnat is calculated to be the sound level exceeded x percent of the time, where x is defined by equation (1):
𝑥𝑥 = 100−𝑃𝑃𝐻𝐻2
+ 𝑃𝑃𝐻𝐻 ,
PH is the percentage of samples containing noise for the hour. For example, if human caused sounds are present 30% of the hour, x = 65, and the LAnat is equal to the L65, or the level exceeded 65% of the time. To summarize and display these data, the median of the hourly LAnat values for the daytime hours (0700-1900) and the median of the hourly LAnat values for the nighttime (1900-0700) are displayed in Figure 4 in the results section.
Off-Site Listening Off-site listening is normally done by listening to an audio recording and simultaneously visually analyzing a spectrogram. Auditory analysis was used to calculate the audibility of sound sources at the monitoring locations. A trained technician at Colorado State University analyzed a subset of .mp3 samples (10 seconds every two minutes for eight days of audio for VALL001 and three days of audio for VALL002) in order to identify durations of audible sound sources. Staff used the total percent time noise was audible to calculate the natural ambient sound level for each hour (see Equation 1 above for more information). Bose Quiet Comfort Noise Canceling headphones were used for off-site audio playback to minimize limitations imposed by the office acoustical environment. For the complete results of this thorough audibility analysis, see Table 6 and Table 7 in the Event duration section below.
(1)
7
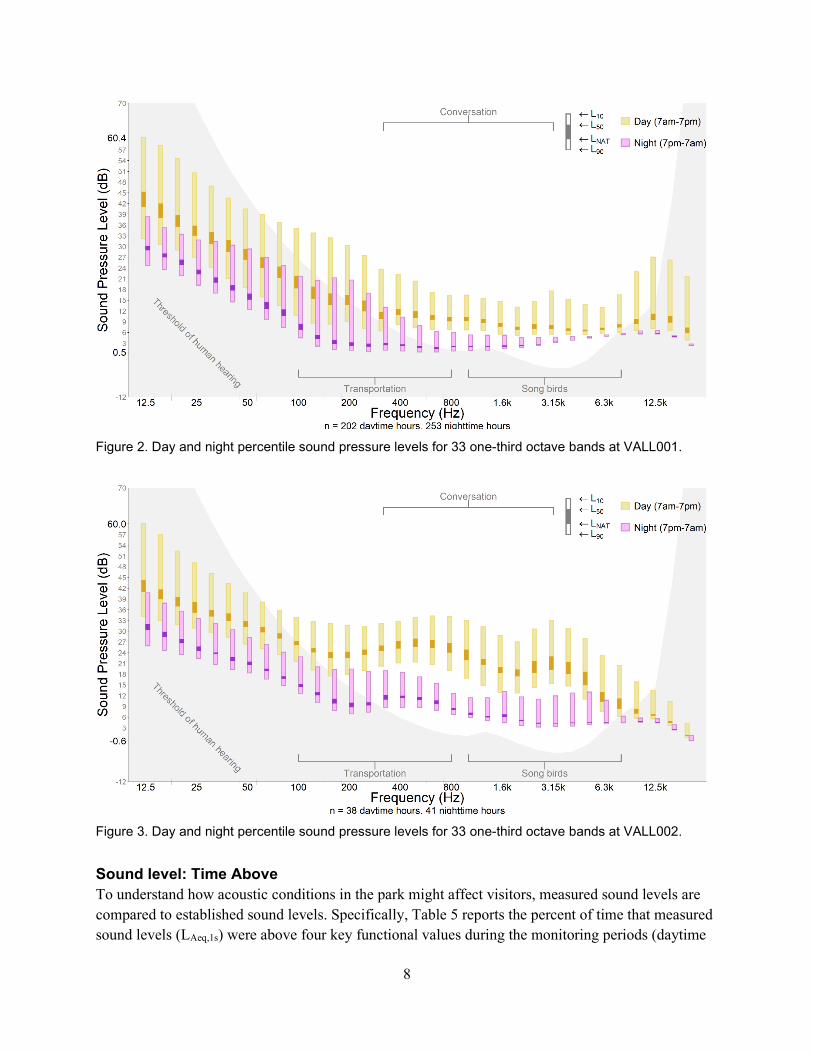
Results Frequency content In order to determine the effect that noise has on the acoustical environment, it is useful to examine percentile metrics across a frequency range. High frequency sounds (such as a cricket chirping) and low frequency sounds (such as flowing water) often occur simultaneously, so the frequency spectrum is split into 33 smaller ranges, each encompassing one-third of an octave. These smaller bands closely represent how humans distinguish between frequencies of sound. For each one-third octave band, sound level (Leq, 1s) was recorded once per second for the duration of the monitoring periods. The percentile sound levels for 33 one-third octave band frequencies over the day and night periods are shown in Figure 2 and Figure 3.
Examining the sound energy in each one-third octave band (combined with digital audio recordings) allows acoustic technicians to determine what types of sounds are contributing to the overall sound level at a site. The grayed area of Figure 2 and Figure 3 represents sound levels outside of the typical range of human hearing. The percentile levels (Lx) are also shown for each one-third octave band. They represent the sound levels exceeded x percent of the measurement period. For example, L90 is the sound level that has been exceeded 90% of the time, and only the quietest 10% of the samples can be found below this point. On the other hand, the L10 is the sound level that has been exceeded 10% of the time, and 90% of the measurements are quieter than the L10. The bold portion of the column represents the difference between L50 and Lnat. The height of this bold portion is a measure of the contribution of anthropogenic noise to the existing sound levels at this site. The size of this portion of the column is directly related to the percent time that human caused sounds are audible. When bold portions of the column do not appear the natural and existing sound levels were either very close to each other or were equal. The typical frequency levels for transportation, conversation, and songbirds are presented on the figure as examples for interpretation of the data. These ranges are estimates and are not vehicle-, species-, or habitat-specific.
8
Figure 2. Day and night percentile sound pressure levels for 33 one-third octave bands at VALL001.
Figure 3. Day and night percentile sound pressure levels for 33 one-third octave bands at VALL002.
Sound level: Time Above To understand how acoustic conditions in the park might affect visitors, measured sound levels are compared to established sound levels. Specifically, Table 5 reports the percent of time that measured sound levels (LAeq,1s) were above four key functional values during the monitoring periods (daytime

9
and nighttime). The first functional value in Table 5 is 35 dB (LAeq,1s), which is designed to address the health effects of sleep interruption. Studies suggest that sound events as low as 35 dB can have adverse effects on blood pressure in sleeping humans (Haralabidis et al. 2008). This is also the desired background sound level in classrooms (ANSI S12.60-2002). The second sound level value, 45 dB (LAeq,1s), addresses the World Health Organization’s recommendations that noise levels inside bedrooms remain below 45 dB (LAeq,1s) (Berglund et al. 1999). The third sound level value, 52 dB (LAeq,1s), is based on the EPA’s speech interference threshold for speaking in a raised voice to an audience at 10 meters (EPA 1974). This threshold addresses the effects of sound on interpretive presentations in parks. The final value, 60 dB (LAeq,1s), provides a basis for estimating impacts on normal voice communications at 1 meter. Visitors viewing scenic areas in the park would likely be conducting such conversations.
The top value in each split-cell uses the full frequency range, whereas the bottom values report the percent of time ANS-weighted sound levels (20-1,250 Hz) are above functional values. Most motorized human-caused noise is confined to the truncated, lower-frequency range, while many natural sounds, including insects and birds, are higher in pitch. ANS weighting eliminates high-frequency sound (leaf rustle, equipment noise, and biologic sounds) allowing for more accurate comparisons of low-frequency ambient sound levels across different land use types (e.g. urban, protected areas; ANSI S3/SC1.100, 2014). This frequency weighting scheme improves ambient sound level measurements in quiet environments. For instance, in the full frequency range, the 35 dB (LAeq, 1s) level was exceeded at VALL001 30 % of the time during the day and 2.4 % of the time at night, but in the 20-1,250 Hz range, the 35 dB functional sound level value was exceeded only 3.9 % during the daytime and only 1.3 % at night (Table 5).
Table 5. Time above metrics for VALL001 and VALL002.
Site ID Frequency
(Hz)
Time above sound level (% of daytime hours, 07:00 to 19:00)
Time above sound level (% of nighttime hours, 19:00 to 07:00)
35 dB*
45 dB*
52 dB*
60 dB*
35 dB*
45 dB*
52 dB*
60 dB*
VALL001 12.5-20,000 30.0 18.4 5.0 0.4 2.4 0.3 0.0 0.0
20-1,250 3.9 0.4 0.1 0.0 1.3 0.1 0.0 0.0
VALL002 12.5-20,000 63.6 5.6 0.1 0.0 20.6 5.4 0.4 0.1
20-1,250 38.4 1.0 0.0 0.0 4.1 0.4 0.1 0.0
* dB LAeq, 1s re 20 µPa
10
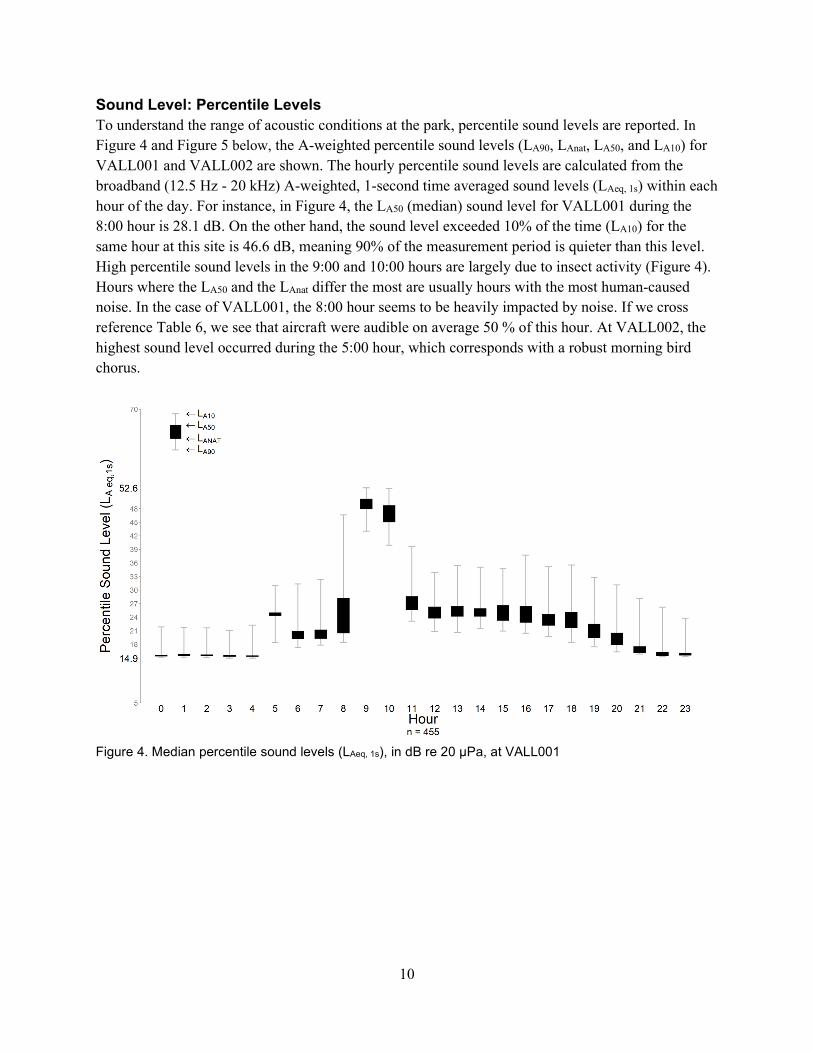
Sound Level: Percentile Levels To understand the range of acoustic conditions at the park, percentile sound levels are reported. In Figure 4 and Figure 5 below, the A-weighted percentile sound levels (LA90, LAnat, LA50, and LA10) for VALL001 and VALL002 are shown. The hourly percentile sound levels are calculated from the broadband (12.5 Hz - 20 kHz) A-weighted, 1-second time averaged sound levels (LAeq, 1s) within each hour of the day. For instance, in Figure 4, the LA50 (median) sound level for VALL001 during the 8:00 hour is 28.1 dB. On the other hand, the sound level exceeded 10% of the time (LA10) for the same hour at this site is 46.6 dB, meaning 90% of the measurement period is quieter than this level. High percentile sound levels in the 9:00 and 10:00 hours are largely due to insect activity (Figure 4). Hours where the LA50 and the LAnat differ the most are usually hours with the most human-caused noise. In the case of VALL001, the 8:00 hour seems to be heavily impacted by noise. If we cross reference Table 6, we see that aircraft were audible on average 50 % of this hour. At VALL002, the highest sound level occurred during the 5:00 hour, which corresponds with a robust morning bird chorus.
Figure 4. Median percentile sound levels (LAeq, 1s), in dB re 20 µPa, at VALL001

11
Figure 5. Median percentile sound levels (LAeq, 1s), in dB re 20 µPa, at VALL002
Event duration
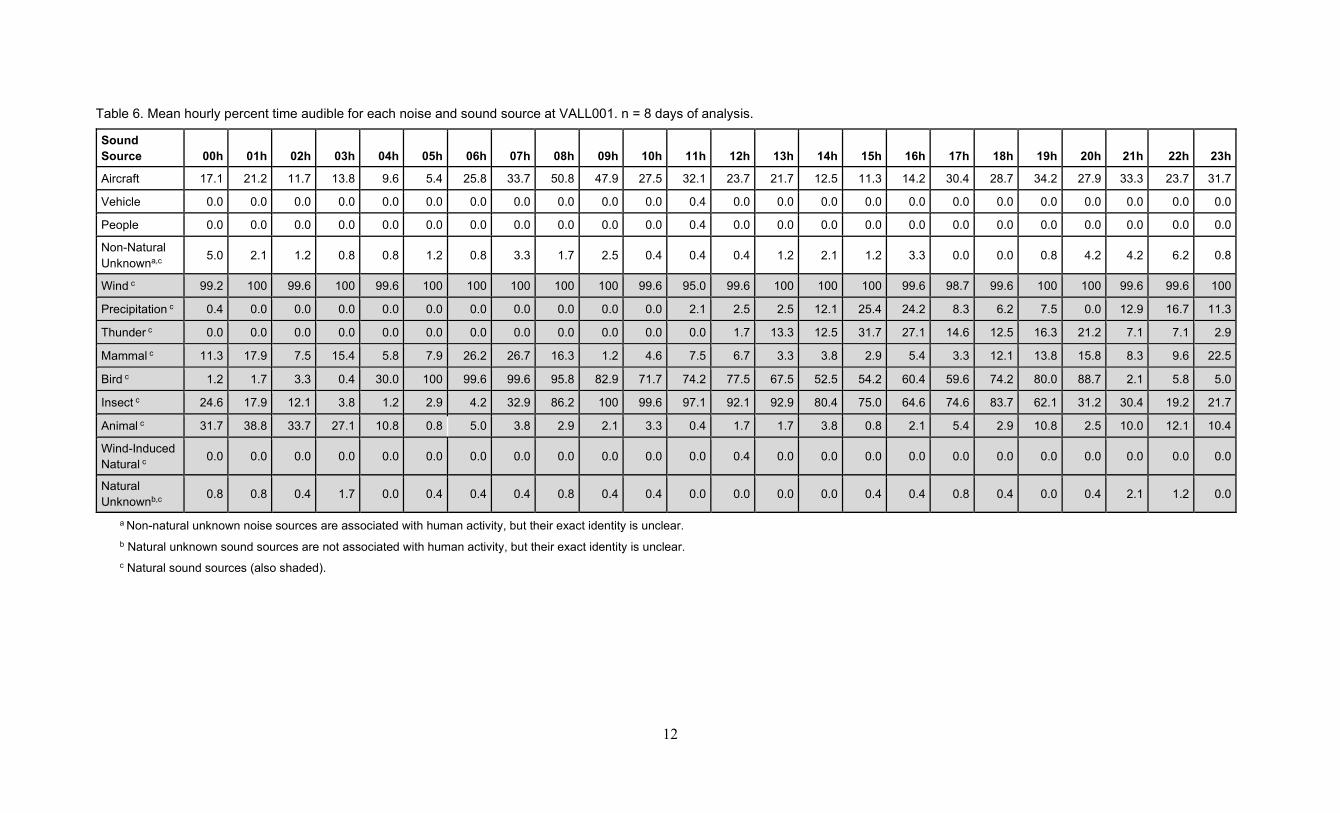
Through off-site listening analysis, event duration for all audible sounds is calculated. Table 6 and Table 7 list audible natural sounds and noise sources at VALL001 and VALL002. Mean hourly audibility was calculated over eight days of analysis for VALL001 and 3 days for VALL002. Figure 6 and Figure 7 display hourly audibility for all non-natural sources, as compared to audibility of two noise sources of interest: aircraft and vehicles.
12
Table 6. Mean hourly percent time audible for each noise and sound source at VALL001. n = 8 days of analysis.
Sound Source 00h 01h 02h 03h 04h 05h 06h 07h 08h 09h 10h 11h 12h 13h 14h 15h 16h 17h 18h 19h 20h 21h 22h 23h
Aircraft 17.1 21.2 11.7 13.8 9.6 5.4 25.8 33.7 50.8 47.9 27.5 32.1 23.7 21.7 12.5 11.3 14.2 30.4 28.7 34.2 27.9 33.3 23.7 31.7
Vehicle 0.0 0.0 0.0 0.0 0.0 0.0 0.0 0.0 0.0 0.0 0.0 0.4 0.0 0.0 0.0 0.0 0.0 0.0 0.0 0.0 0.0 0.0 0.0 0.0
People 0.0 0.0 0.0 0.0 0.0 0.0 0.0 0.0 0.0 0.0 0.0 0.4 0.0 0.0 0.0 0.0 0.0 0.0 0.0 0.0 0.0 0.0 0.0 0.0
Non-Natural Unknowna,c 5.0 2.1 1.2 0.8 0.8 1.2 0.8 3.3 1.7 2.5 0.4 0.4 0.4 1.2 2.1 1.2 3.3 0.0 0.0 0.8 4.2 4.2 6.2 0.8
Wind c 99.2 100 99.6 100 99.6 100 100 100 100 100 99.6 95.0 99.6 100 100 100 99.6 98.7 99.6 100 100 99.6 99.6 100
Precipitation c 0.4 0.0 0.0 0.0 0.0 0.0 0.0 0.0 0.0 0.0 0.0 2.1 2.5 2.5 12.1 25.4 24.2 8.3 6.2 7.5 0.0 12.9 16.7 11.3
Thunder c 0.0 0.0 0.0 0.0 0.0 0.0 0.0 0.0 0.0 0.0 0.0 0.0 1.7 13.3 12.5 31.7 27.1 14.6 12.5 16.3 21.2 7.1 7.1 2.9
Mammal c 11.3 17.9 7.5 15.4 5.8 7.9 26.2 26.7 16.3 1.2 4.6 7.5 6.7 3.3 3.8 2.9 5.4 3.3 12.1 13.8 15.8 8.3 9.6 22.5
Bird c 1.2 1.7 3.3 0.4 30.0 100 99.6 99.6 95.8 82.9 71.7 74.2 77.5 67.5 52.5 54.2 60.4 59.6 74.2 80.0 88.7 2.1 5.8 5.0
Insect c 24.6 17.9 12.1 3.8 1.2 2.9 4.2 32.9 86.2 100 99.6 97.1 92.1 92.9 80.4 75.0 64.6 74.6 83.7 62.1 31.2 30.4 19.2 21.7
Animal c 31.7 38.8 33.7 27.1 10.8 0.8 5.0 3.8 2.9 2.1 3.3 0.4 1.7 1.7 3.8 0.8 2.1 5.4 2.9 10.8 2.5 10.0 12.1 10.4
Wind-Induced Natural c 0.0 0.0 0.0 0.0 0.0 0.0 0.0 0.0 0.0 0.0 0.0 0.0 0.4 0.0 0.0 0.0 0.0 0.0 0.0 0.0 0.0 0.0 0.0 0.0
Natural Unknownb,c 0.8 0.8 0.4 1.7 0.0 0.4 0.4 0.4 0.8 0.4 0.4 0.0 0.0 0.0 0.0 0.4 0.4 0.8 0.4 0.0 0.4 2.1 1.2 0.0
a Non-natural unknown noise sources are associated with human activity, but their exact identity is unclear. b Natural unknown sound sources are not associated with human activity, but their exact identity is unclear. c Natural sound sources (also shaded).

13
Table 7. Mean hourly percent time audible for each noise and sound source at VALL002. n = 3 days of analysis.
Sound Source 00h 01h 02h 03h 04h 05h 06h 07h 08h 09h 10h 11h 12h 13h 14h 15h 16h 17h 18h 19h 20h 21h 22h 23h
Aircraft 14.4 10.0 17.8 11.1 10.0 3.3 10.0 18.9 34.4 27.8 8.9 21.1 17.8 20.0 22.2 21.1 6.7 12.2 23.3 33.3 21.1 26.7 26.7 25.6
Vehicle 1.1 0.0 0.0 10.0 0.0 6.7 11.1 27.8 23.3 21.1 6.7 3.3 4.4 8.9 24.4 13.3 4.4 3.3 2.2 2.2 0.0 0.0 0.0 5.6
Non-Natural Unknowna 2.2 0.0 0.0 1.1 1.1 2.2 7.8 2.2 15.6 5.6 5.6 7.8 10.0 1.1 1.1 3.3 1.1 0.0 2.2 1.1 3.3 8.9 8.9 2.2
Windc 100 100 100 98.9 98.9 18.9 88.9 97.8 98.9 91.1 95.6 100 94.4 96.7 96.7 92.2 85.6 97.8 98.9 95.6 95.6 100 100 100
Precipitationc 0.0 0.0 0.0 0.0 0.0 0.0 0.0 0.0 0.0 0.0 0.0 0.0 0.0 0.0 0.0 8.9 5.6 2.2 0.0 0.0 0.0 0.0 0.0 0.0
Thunderc 0.0 0.0 0.0 0.0 0.0 0.0 0.0 0.0 0.0 0.0 0.0 0.0 0.0 0.0 0.0 2.2 27.8 7.8 0.0 0.0 0.0 0.0 0.0 0.0
Mammal c 7.8 1.1 0.0 1.1 2.2 2.2 24.4 18.9 18.9 14.4 5.6 1.1 2.2 4.4 4.4 1.1 1.1 8.9 15.6 62.2 70.0 15.6 17.8 5.6
Birdc 1.1 5.6 4.4 6.7 36.7 100 100 98.9 100 98.9 97.8 100 97.8 98.9 100 95.6 96.7 98.9 100 98.9 96.7 13.3 3.3 2.2
Insectc 0.0 1.1 0.0 1.1 0.0 10.0 4.4 8.9 20.0 6.7 5.6 5.6 7.8 2.2 6.7 4.4 4.4 0.0 1.1 2.2 3.3 1.1 3.3 0.0
Animal c 12.2 5.6 3.3 6.7 12.2 0.0 3.3 2.2 1.1 5.6 3.3 7.8 3.3 5.6 6.7 5.6 2.2 3.3 1.1 8.9 2.2 16.7 11.1 6.7
Wind-Induced Naturalc 52.2 51.1 33.3 40.0 34.4 33.3 4.4 1.1 31.1 70.0 100 100 95.6 100 97.8 81.1 81.1 100 98.9 66.7 30.0 38.9 48.9 40.0
Natural Unknownb,c 2.2 1.1 1.1 1.1 0.0 1.1 0.0 0.0 0.0 0.0 0.0 0.0 0.0 0.0 0.0 0.0 0.0 0.0 0.0 0.0 0.0 2.2 1.1 1.1
a Non-natural unknown noise sources are associated with human activity, but their exact identity is unclear. b Natural unknown sound sources are not associated with human activity, but their exact identity is unclear. c Natural sound sources (also shaded).

14
Figure 6. Hourly time audible for aircraft, vehicle, and all noise sources at VALL001.
Figure 7. Hourly time audible for aircraft, vehicle, and all noise sources at VALL002.

15
Discussion The purpose of this study was to assess current conditions of the acoustical environment at VALL. Monitoring results include existing ambient sound levels, calculations of sound source audibility through off-site listening, and estimates of natural ambient levels, all of which are intended to provide the park with baseline information and to inform management decisions. The site locations were chosen to assess the effects of noise on the acoustical environment from a backcountry and frontcountry location.
Results indicate that natural ambient sound levels (LAnat) at VALL001 ranged from 24.5 dB during the daytime to 18.6 dB at night. Natural ambient sound levels ranged from 34.5 dB during the daytime to 31.1 dB at night at VALL002. Existing ambient sound levels (LA50) were higher, ranging from 26.6 dB during the day to 20.4 dB at night at VALL001 (Figure 4). Existing ambient sound levels ranged from 36.6 dB during the day to 33.6 dB at night at VALL002 (Figure 5). For comparison, a comprehensive 1982 study of noise levels in residential areas found that nearly 87% of US residents were exposed to day-night sound levels (Ldn) over 55 dB, and an additional 53% were exposed to Ldn over 60 dB (EPA 1982). Noise levels have increased nationally with population growth since the EPA study (Suter 1991; Barber et al. 2010). Therefore, the results imply that natural ambient sound pressure levels during the monitoring period were considerably quieter than most residential areas.
Despite low overall sound levels, noise still exists at VALL, but it occurs infrequently. The mean 24-hour time audible of noise was 26.5% at VALL001 and 29.7% at VALL002, presenting visitors with opportunities for relatively prolonged periods of solitude (Table 3). Noise at VALL001 and VALL002 largely originated from overflights (Tables 6 and 7), with noise from vehicles also contributing to the acoustical environment at VALL002 (Table 7). Outside of these sources, the only other prominent noise source was unknown in origin but might have come from distant vehicles considering patterns of presence were consistent with the morning commute (see ‘Non-Natural Unknown’ in Tables 6 and 7).
Noise has the potential to affect a visitor’s experience in parks by causing annoyance (Rapoza et al. 2015), reducing the perceived scenic beauty (Weinzimmer et al. 2014), or simply by limiting opportunities for solitude. Increased sound levels may also have wide ranging effects on wildlife such as reduced predatory success (Mason 2015), changes in vocal communication, or increased vigilance by keystone species (Shannon et al. 2014). In a review of literature addressing the effects of noise on wildlife published between 1990 and 2013, wildlife responses to noise were observed beginning at about 40 dB (LAeq, x).2 Of the papers reviewed, 20% showed impacts to terrestrial wildlife at or below noise levels of 50 dB (LAeq, 1s) (Shannon et al. 2015).
2 This metric is a composite of multiple metrics with varying time averaging metrics.

16
Natural sound sources within the park were quite prevalent and varied. The most common sources were birds, insects, and wind blowing through vegetation (Table 6 and Table 7). Additionally, several species of mammals could be heard, including coyotes, elk, and prairie dogs. The combination of these natural sounds and periods of noise-free silence provide visitors with a unique opportunity to connect with nature in the preserve. The information presented in this report will be used to inform park managers and planners when they make management decisions, but it will also serve as a permanent record of what the park sounded like in 2016. Sound level data as well as continuous digital audio recordings will be stored at the Natural Sounds and Night Skies Division office in Fort Collins, Colorado for archiving purposes.

17
Literature Cited Acoustical Society of America. 2014. Methods to Define and Measure the Residual Sound in
Protected Natural and Quiet Residential Areas, Melville, NY. ANSI/ASA S3/SC1.100-2014.
Barber J.R., C. Crooks, and K. Fristrup. 2010. The costs of chronic noise exposure for terrestrial organisms. Trends in Ecology and Evolution 25:180–189.
Berglund, B., T. Lindvall, and D. H. Schwela (Eds.). 1999. HWO. Guidelines for community noise. World Health Organization, Geneva.
Environmental Protection Agency. 1974. Information on Levels of Noise Requisite to Protect the Public Health and Welfare with an Adequate Margin of Safety.
Environmental Protection Agency. 1982. National Ambient Noise Survey. Office of Noise Abatement and Control, Washington, DC.
Haas, G.E., and T. J. Wakefield. 1998. National parks and the American public: A national public opinion survey on the national park system. Washington D.C. and Fort Collins, CO.: National Parks and Conservation Association and Colorado State University.
Haralabidis Alexandros, S., et. al. 2008. Acute effects of night-time noise exposure on blood pressure in populations living near airports. European Heart Journal Advance Access. Published online February 12, 2008.
Harris, C. M. 1998. Handbook of Acoustical Measurements and Noise Control, 3rd ed. McGraw-Hill, New York.
Lynch, E., D. Joyce, and K. Fristrup. 2011. An assessment of noise audibility and sound levels in U.S. National Parks. Landscape Ecology 26: 1297-1309.
Mason, J. T. 2015. The Impact of Anthropogenic Noise on Northern Saw-whet Owl (Aegolius acadius) Hunting Behavior. Boise State University Theses and Dissertations. Paper 892. http://scholarworks.boisestate.edu/td/892
McDonald, C. D., R. M. Baumgarten, and R. Iachan. 1995. Aircraft management studies: National Park Service Visitors Survey. HMMH Report No. 290940.12; NPOA Report No. 94-2, National Park Service, U.S. Department of the Interior.
Mennitt, D., K. Sherrill, and K. Fristrup. 2014. A geospatial model of ambient sound pressure levels in the contiguous United States. Journal of the Acoustical Society of America 135:2746-2764.
National Park Service. 2006a. Management Policy 4.9: Soundscape Management.
National Park Service. 2006b. Management Policy 8.2.3: Use of Motorized Equipment.
18
Rapoza, A., Sudderth, E., & Lewis, K. 2015. The relationship between aircraft noise exposure and day-use visitor survey responses in backcountry areas of national parks. The Journal of the Acoustical Society of America, 138(4), 2090-2105.
Shannon G, Angeloni LM, Wittemyer G, Fristrup KM, Crooks KR. 2014. Road traffic noise modifies behaviour of a keystone species. Anim Behav. 94:135–141.
Shannon, G., McKenna, M. F., Angeloni, L. M., Crooks, K. R., Fristrup, K. M., Brown, E., ... & McFarland, S. 2015. A synthesis of two decades of research documenting the effects of noise on wildlife. Biological Reviews, 91(4), 982-1005.
Suter, A. H. 1991. Noise and its Effects. Administrative Conference of the United States. Available at: http://www.nonoise.org/library/suter/suter.htm (accessed 17 January 2014).
Templeton, D. (Ed.). 1997. Acoustics in the built environment: advice for the design team. Architectural Press, Oxford
Weinzimmer, D., Newman, P., Taff, D., Benfield, J., Lynch, E., & Bell, P. 2014. Human responses to simulated motorized noise in national parks. Leisure Sciences, 36(3), 251-267.
19
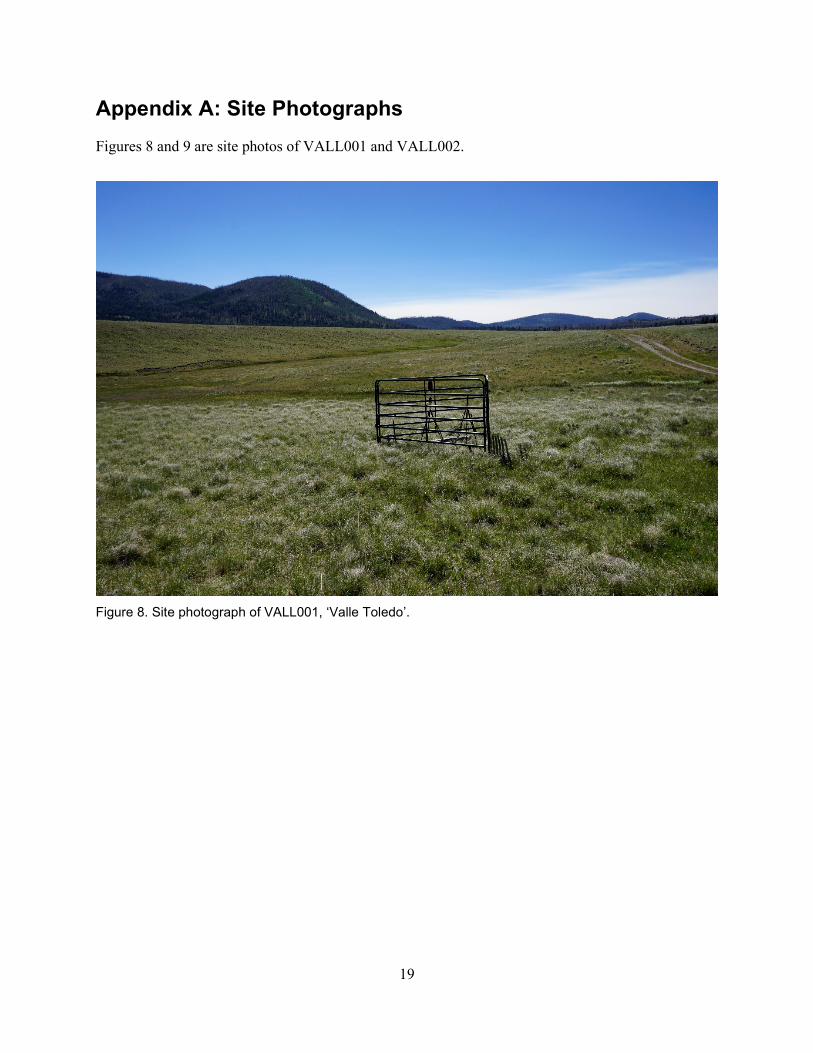
Appendix A: Site Photographs Figures 8 and 9 are site photos of VALL001 and VALL002.
Figure 8. Site photograph of VALL001, ‘Valle Toledo’.

20
Figure 9. Site photograph of VALL002, ‘History Grove’.
21
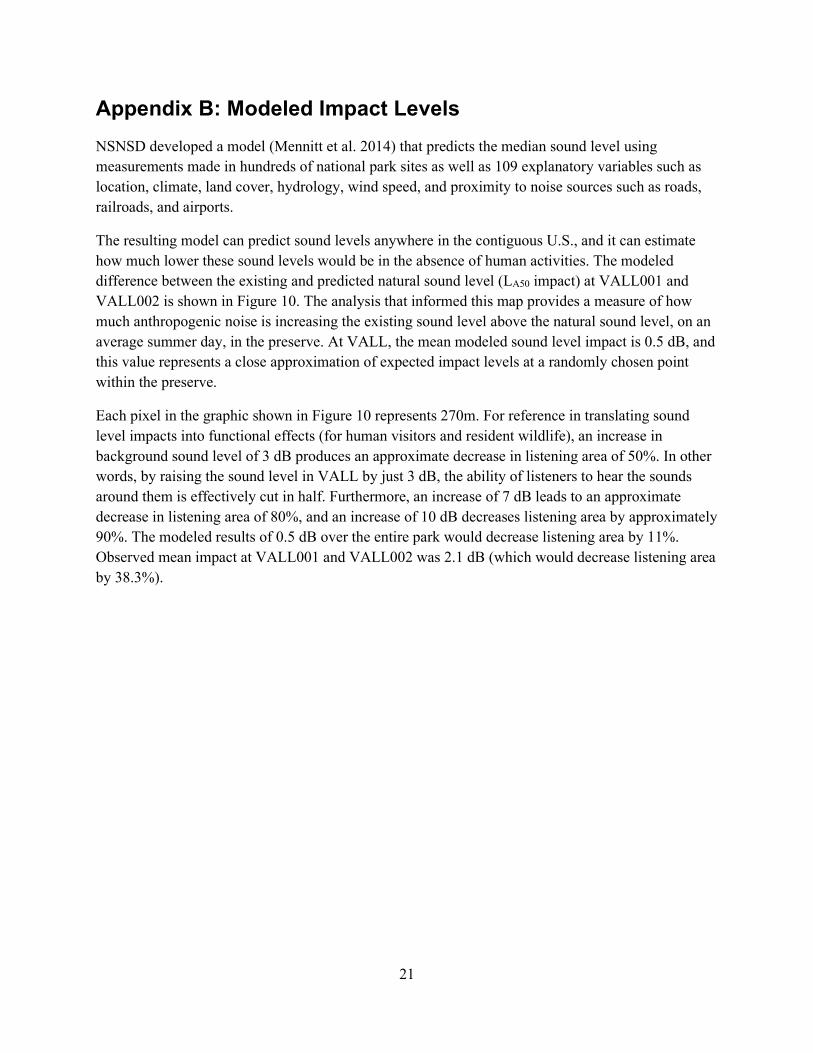
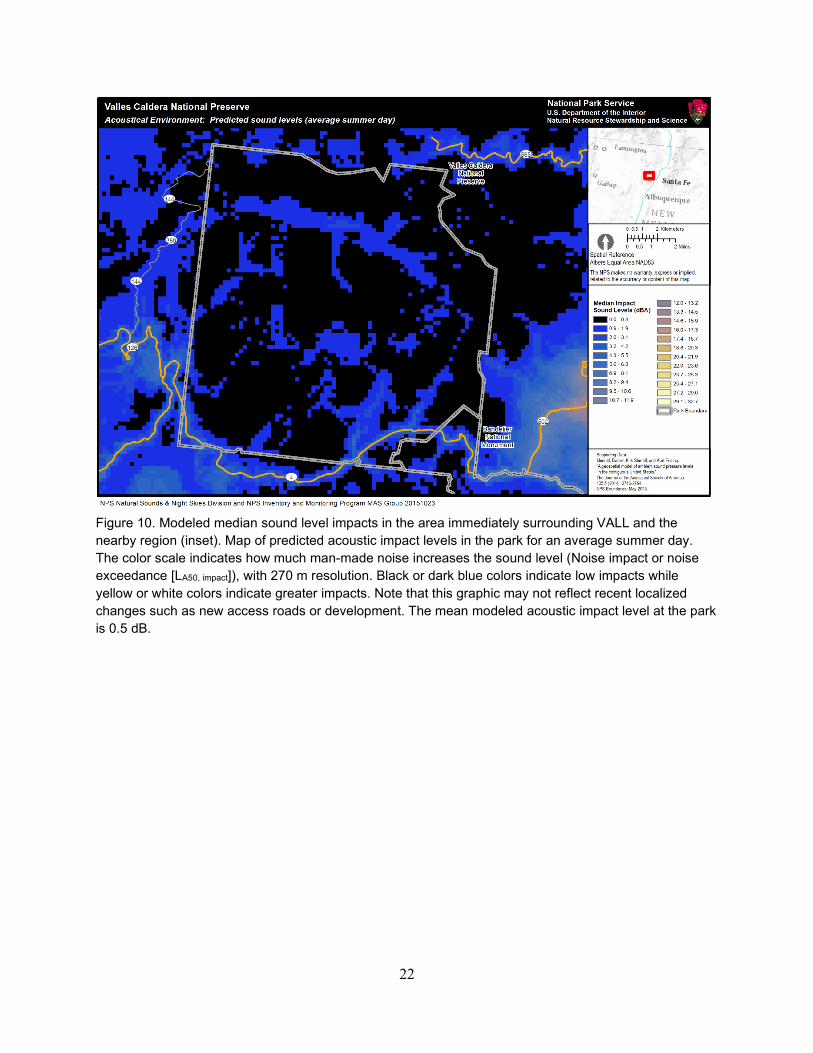
Appendix B: Modeled Impact Levels NSNSD developed a model (Mennitt et al. 2014) that predicts the median sound level using measurements made in hundreds of national park sites as well as 109 explanatory variables such as location, climate, land cover, hydrology, wind speed, and proximity to noise sources such as roads, railroads, and airports.
The resulting model can predict sound levels anywhere in the contiguous U.S., and it can estimate how much lower these sound levels would be in the absence of human activities. The modeled difference between the existing and predicted natural sound level (LA50 impact) at VALL001 and VALL002 is shown in Figure 10. The analysis that informed this map provides a measure of how much anthropogenic noise is increasing the existing sound level above the natural sound level, on an average summer day, in the preserve. At VALL, the mean modeled sound level impact is 0.5 dB, and this value represents a close approximation of expected impact levels at a randomly chosen point within the preserve.
Each pixel in the graphic shown in Figure 10 represents 270m. For reference in translating sound level impacts into functional effects (for human visitors and resident wildlife), an increase in background sound level of 3 dB produces an approximate decrease in listening area of 50%. In other words, by raising the sound level in VALL by just 3 dB, the ability of listeners to hear the sounds around them is effectively cut in half. Furthermore, an increase of 7 dB leads to an approximate decrease in listening area of 80%, and an increase of 10 dB decreases listening area by approximately 90%. The modeled results of 0.5 dB over the entire park would decrease listening area by 11%. Observed mean impact at VALL001 and VALL002 was 2.1 dB (which would decrease listening area by 38.3%).
22
Figure 10. Modeled median sound level impacts in the area immediately surrounding VALL and the nearby region (inset). Map of predicted acoustic impact levels in the park for an average summer day. The color scale indicates how much man-made noise increases the sound level (Noise impact or noise exceedance [LA50, impact]), with 270 m resolution. Black or dark blue colors indicate low impacts while yellow or white colors indicate greater impacts. Note that this graphic may not reflect recent localized changes such as new access roads or development. The mean modeled acoustic impact level at the park is 0.5 dB.


The Department of the Interior protects and manages the nation’s natural resources and cultural heritage; provides scientific and other information about those resources; and honors its special responsibilities to American Indians, Alaska Natives, and affiliated Island Communities. NPS 216/170371, June 2020
National Park Service U.S. Department of the Interior
Natural Resource Stewardship and Science 1201 Oakridge Drive, Suite 150 Fort Collins, CO 80525
EXPERIENCE YOUR AMERICA TM