Acoustic Emission Monitoring of Conventionally Reinforced ......Acoustic Emission Monitoring of...
27
Acoustic Emission Monitoring of Conventionally Reinforced Concrete Highway Bridges Under Service Conditions Thomas Schumacher, University of Delaware Christopher Higgins, Oregon State University Stephen Lovejoy, Oregon Department of Transportation presented by Thomas Schumacher Assistant Professor May 18, 2011 Civil & Environmental Engineering
Transcript of Acoustic Emission Monitoring of Conventionally Reinforced ......Acoustic Emission Monitoring of...

Acoustic Emission Monitoring of Conventionally
Reinforced Concrete Highway Bridges Under Service
Conditions
Thomas Schumacher, University of Delaware
Christopher Higgins, Oregon State University
Stephen Lovejoy, Oregon Department of Transportation
presented by
Thomas Schumacher
Assistant Professor
May 18, 2011
Civil & Environmental Engineering

• BACKGROUND
• IN-SERVICE LOAD TEST
• FULL-SCALE LABORATORY TEST
• B-VALUE MONITORING
• COMPARISON
• SUMMARY
• QUESTIONS
1
OVERVIEW

• USA: 27% of bridges structurally
deficient or functionally obsolete
(ASCE Report Card, 2009)
• Deficient design code provisions
• Increasing traffic volume
• Changing environment
• Structural as well as non-structural components affected
• Acoustic Emission (AE) monitoring
- Short-term monitoring � E.g. to support in-service load testing
- Long-term monitoring � Continuous, real-time feed-back2
CHALLENGES AND SOLUTIONS
Source: www.matcoinc.com

• ‘The term used for transient elastic waves generated by the release of energy
within a material or by a process ’ (EN, 2000).
• Stress wave emissions or nano-seismic activity
• Source time, location, and mechanism unknown
• Sensing typically via
surface-mounted piezo-electric
transducers
• Frequency range for R/C:
approx. 10 to 500 kHz
3
WHAT ARE AE?

Source signal, S(t)
�
Stress wave
�
Propagation
�
Surface motion � voltage
�
Amplification
�
Filtering
� Response Function Digitization/storage on PC
�
Response signal, R(t)4
Pre-amplifier, tfDAQ(ω)
Source, S(ω)
Stress wave front, p-wave
Sensor , tfS(ω)
Data acquisition system , tfDAQ(ω)
Test specimen, tfM(ω)
( ) ( ) ( ) ( ) ( )M S DAQR tf tf tf Sω ω ω ω ω=
MEASUREMENT SYSTEM

ANALYSIS: QUALITATIVE VS. QUANTITATIVE
Stored AE signals, R(t)
AE event forming
Qualitative Quantitative
Source parameters5):
- Location
- Time
AE parameters:
- Hit rates/energy/…
- Historic-severity1)
- Load-Calm ratio2)
- b-Value analysis3)
Waveform analysis:
- Comparisons4)
1)Fowler et al., 1989, 2)Ohtsu et al., 2002, 3)Gutenberg & Richter, 1949, 4)Grosse, 1996, 5)Geiger, 1910,6)Aki & Richards, 1980
Moment tensor
analysis6)

b
Cum
ulat
ive
Hits
(lo
g-sc
ale)
• Goal
- Employ and adapt method used in seismology
- Generate baseline data from full-scale R/C bridge girders
• Method
Gutenberg & Richter (1949)
relationship describes temporal
distribution of earthquakes
where N is number of EQ ≥ M,
a and b are unknown parameters,
and M is the earthquake magnitude
• b-value represents slope in magnitude-frequency distribution plot6
B-VALUE ANALYSIS
10log ( )N a bM= −
b

• Interstate Highway 5 Bridge in Cottage Grove, OR
7
IN-SERVICE LOAD TEST
AE sensors
Strain gageCrack displ.

• Loaded truck (22.7 t) at 3 different speeds (16/64/84 km/h)
• 5 locations (Loc. 3 directly over instrumented girder)
8
LOADING PROCEDURE

9
DATA ANALYSIS
Qualitative Quantitative

• Spurious AE:
Studded tires
(Schumacher et al., 2009) 8
NOISE
Source: www.nokiantires.com

- 2 realistic full-scale R/C girders
- Span length = 6.60 m
(Schumacher et al., 2008 & 2011)11
FULL-SCALE LABORATORY EXPERIMENT

12
INSTRUMENTATION & LOADING PROTOCOL
P
P/2P/2

Example Specimen #2
OL = Overload = Load the specimen has never previously seen
TT = Simulated test trucks (≤ previous OL)13
ACTUAL LOADING PROTOCOL
Experiment Time, t [h]
App
lied
For
ce, P
[kN
]
App
lied
For
ce, P
[kip
s]
-2 0 2 4 6 8 10 12 14 16 18 20 22 24 26 28 300
250
500
750
1000
1250
1500
1750
2000
0
50
100
150
200
250
300
350
400
Dead load, DL
Pult = 1658 kN (373 kips)
1st OL
2nd OL
3rd OL
4th OL
Phase 1, Pmax/Pult = 0.38Phase 2, Pmax/Pult = 0.54Phase 3, Pmax/Pult = 0.70Phase 4, Pmax/Pult = 0.88Phase 5, Pmax/Pult = 1.00
TT
TT
TT TT

LR3 = Previous applied OL / Ultimate capacity 14
LOAD PHASES
(1) LR3 = 0.38 (2) LR3 = 0.54
(3) LR3 = 0.70 (4) LR3 = 0.88

ESTIMATION OF SOURCE LOCATIONS
Source Locations, Phase 1 (DL) Estimated Source Locations, Phase 3 (TT)

• Estimation of b-values from AE hit data
- Linear least-squares curve fit over µA-σA to µA+σA as suggested by Rao et al. (2005).
- Replace EQ magnitude M by max. AE amplitude/20
- (1) continuous monitoring or (2) analysis of discrete loading
events16
B-VALUE ANALYSIS
2 2.5 3 3.5 4 4.5
0
0.5
1
1.5
2
AE Magnitude [AdB/20]
log(
Cum
ulat
ive
AE
Hits
) [-
]
Frequency distribution of hit amplitudes
Estimated b-value (slope of this line)± one standard deviation of data
Data mean value
50 hits
Amax
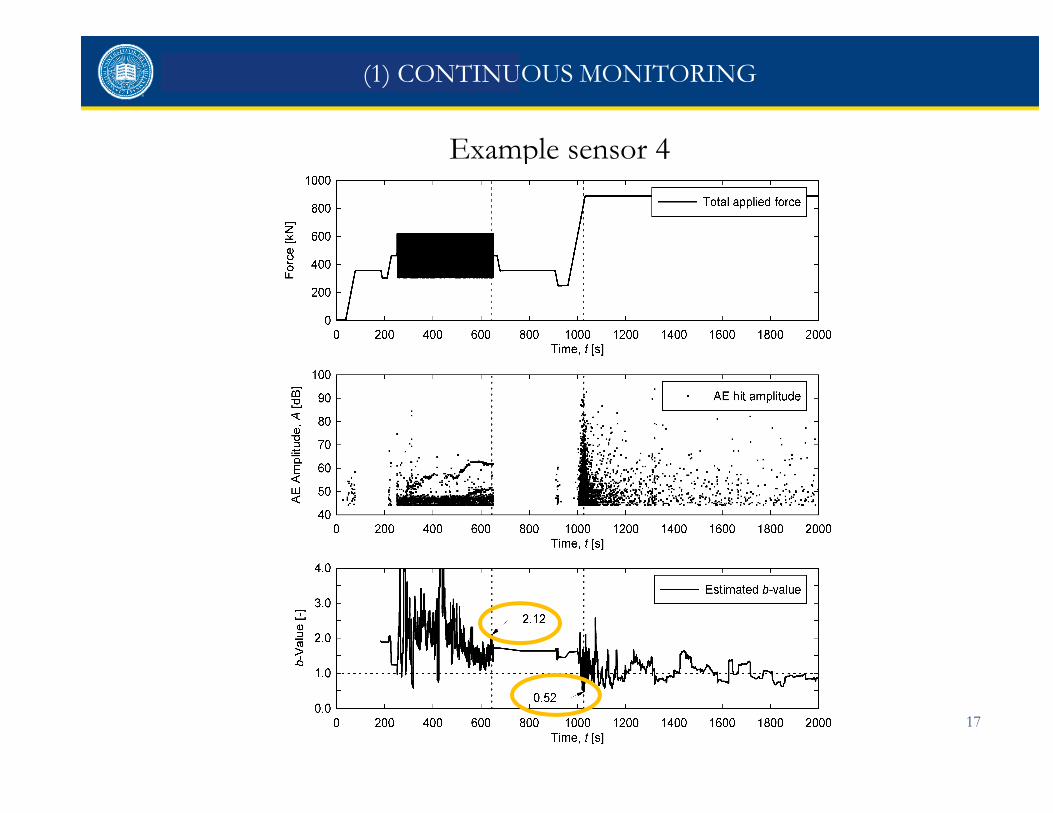
Example sensor 4
17
(1) CONTINUOUS MONITORING

Example for proposed Minimum b-Value Analysis
18
(2) DISCRETE LOADING EVENTS
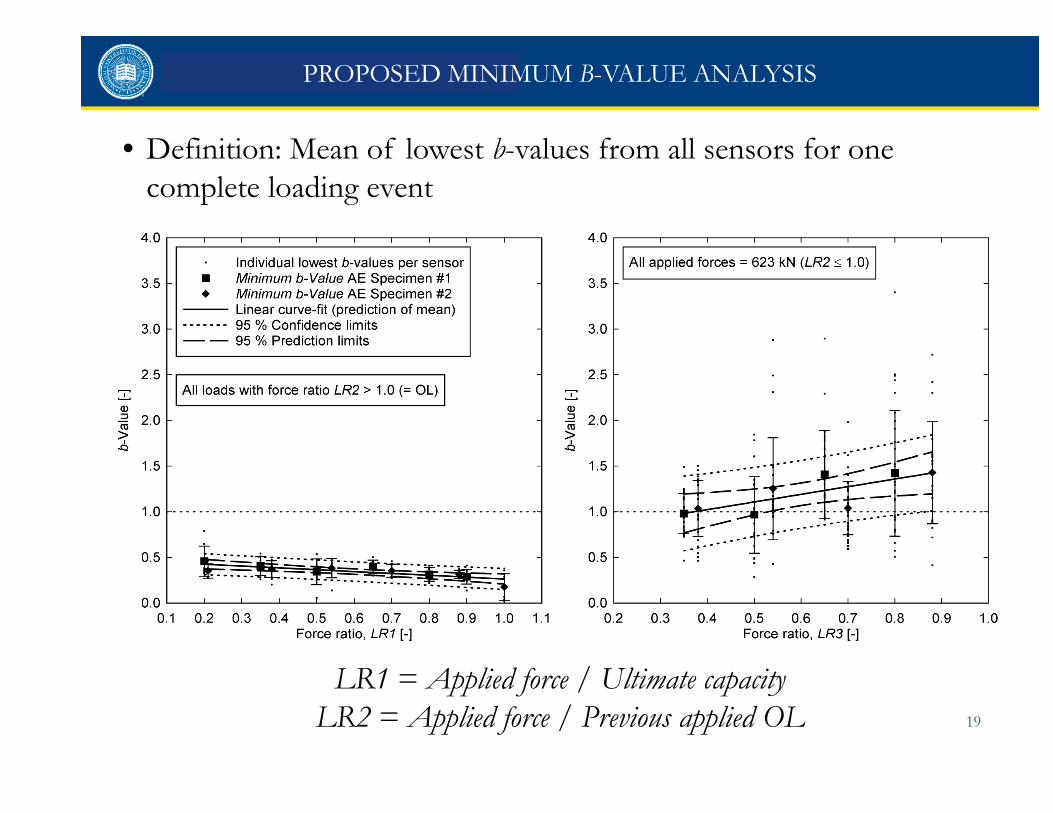
• Definition: Mean of lowest b-values from all sensors for one
complete loading event
LR1 = Applied force / Ultimate capacity
LR2 = Applied force / Previous applied OL 19
PROPOSED MINIMUM B-VALUE ANALYSIS

20
EVALUATION OF LR1

21
EVALUATION OF LR2

LR1 = Applied force / Ultimate capacity
LR2 = Applied force / Previous applied OL
LR3 = Previous applied OL / Ultimate capacity 22
EVALUATION CHART

• Minimum b-values vs. measured rebar strains
23
COMPARISON

• Overloads reliably detected, i.e. b-value << 1.0
• Discrimination of different damage mechanisms difficult
• In-service load conditions difficult to estimate
• Qualitative methods simple but only work for specified conditions
• Very few AE events formed during in-service loads (expected)
• b-Values sensitive to noise and prior history
24
CONCLUSIONS
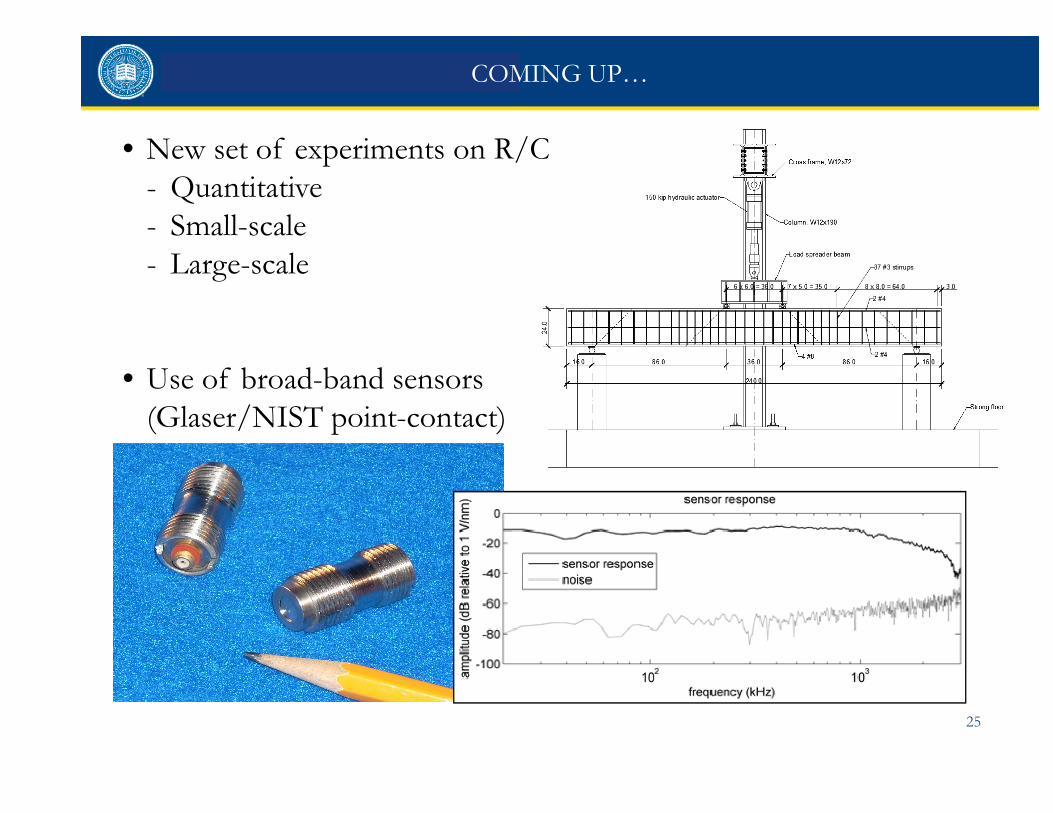
• New set of experiments on R/C
- Quantitative
- Small-scale
- Large-scale
• Use of broad-band sensors
(Glaser/NIST point-contact)
25
COMING UP…

26
THANK YOU!
Civil & Environmental Engineering