Accounting What the Numbers Mean CHAPTER 12: Managerial ...
35
12 - 1 Copyright © 2017 McGraw-Hill Education. All rights reserved. No reproduction or distribution without the prior written consent of McGraw-Hill Education. Marshall, McManus, and Viele 11th Edition Accounting What the Numbers Mean CHAPTER 12: Managerial Accounting and Cost–Volume– Profit Relationships
Transcript of Accounting What the Numbers Mean CHAPTER 12: Managerial ...
12 - 1
Copyright © 2017 McGraw-Hill Education. All rights reserved. No reproduction or distribution without the prior written consent of McGraw-Hill Education.
Marshall, McManus, and Viele
11th Edition
AccountingWhat the Numbers Mean
CHAPTER 12: Managerial Accounting and Cost–Volume–
Profit Relationships

12 - 2
Copyright © 2017 McGraw-Hill Education. All rights reserved. No reproduction or distribution without the prior written consent of McGraw-Hill Education.
The Management Process
Learning Objective 12-1: Explain the management planning and control cycle.
Planning is a key part of the management process. A general model of the process looks like the diagram
shown on the screen.

12 - 3
Copyright © 2017 McGraw-Hill Education. All rights reserved. No reproduction or distribution without the prior written consent of McGraw-Hill Education.
Managerial Accounting versus Financial Accounting
Managerial accounting
supports the internal
planning
(future-oriented)
decisions made by
management.
Financial accounting has
more of a scorekeeping,
historical orientation
that provides information
to owners and others
outside the organization.
Learning Objective 12-2: Identify the major differences between financial accounting and managerial accounting.

12 - 4
Copyright © 2017 McGraw-Hill Education. All rights reserved. No reproduction or distribution without the prior written consent of McGraw-Hill Education.
Managerial Accounting versus Financial Accounting
Learning Objective 12-2: Identify the major differences between financial accounting and managerial accounting.

12 - 5
Copyright © 2017 McGraw-Hill Education. All rights reserved. No reproduction or distribution without the prior written consent of McGraw-Hill Education.
Relationship of Total Costto Volume of Activity
How a cost will react to changes in the level of
business activity.
– Total variable costschange when activity changes.
– Total fixed costs remain unchanged when activity changes.
Learning Objective 12-3: Describe the difference between variable and fixed cost behavior patterns and the
simplifying assumptions made in this classification method.

12 - 6
Copyright © 2017 McGraw-Hill Education. All rights reserved. No reproduction or distribution without the prior written consent of McGraw-Hill Education.
Cost Behavior PatternsThe fixed or variable label refers to the behavior of total cost relative to a change in
activity. When referring to the behavior of unit costs, however, the labels may be
confusing because variable costs are constant if expressed on a per unit basis but
fixed costs per unit will change as the
level of activity changes.
Learning Objective 12-3: Describe the difference between variable and fixed cost behavior patterns and the
simplifying assumptions made in this classification method.
12 - 7
Copyright © 2017 McGraw-Hill Education. All rights reserved. No reproduction or distribution without the prior written consent of McGraw-Hill Education.
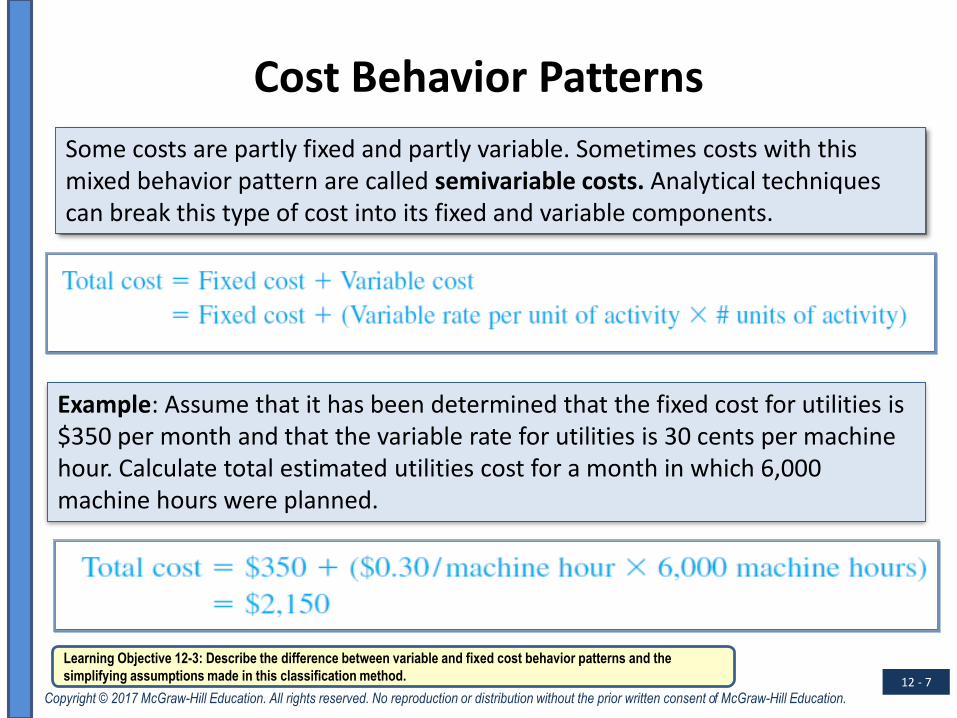
Cost Behavior Patterns
Some costs are partly fixed and partly variable. Sometimes costs with this mixed behavior pattern are called semivariable costs. Analytical techniques can break this type of cost into its fixed and variable components.
Example: Assume that it has been determined that the fixed cost for utilities is $350 per month and that the variable rate for utilities is 30 cents per machine hour. Calculate total estimated utilities cost for a month in which 6,000 machine hours were planned.
Learning Objective 12-3: Describe the difference between variable and fixed cost behavior patterns and the
simplifying assumptions made in this classification method.
12 - 8
Copyright © 2017 McGraw-Hill Education. All rights reserved. No reproduction or distribution without the prior written consent of McGraw-Hill Education.
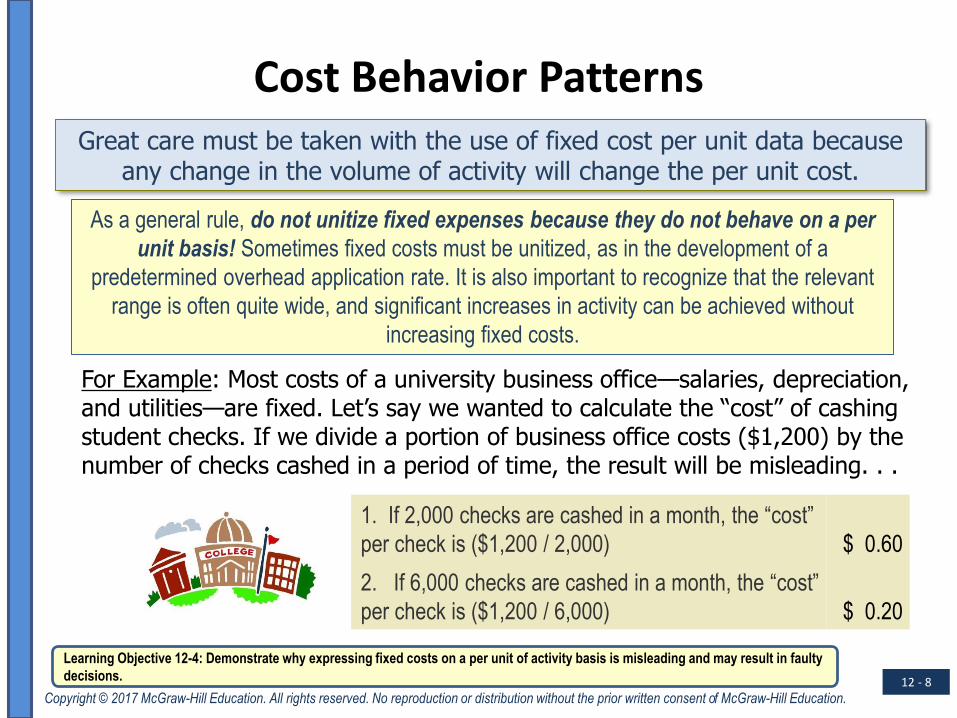
Cost Behavior PatternsGreat care must be taken with the use of fixed cost per unit data because
any change in the volume of activity will change the per unit cost.
Learning Objective 12-4: Demonstrate why expressing fixed costs on a per unit of activity basis is misleading and may result in faulty
decisions.
As a general rule, do not unitize fixed expenses because they do not behave on a per
unit basis! Sometimes fixed costs must be unitized, as in the development of a
predetermined overhead application rate. It is also important to recognize that the relevant
range is often quite wide, and significant increases in activity can be achieved without
increasing fixed costs.
For Example: Most costs of a university business office—salaries, depreciation, and utilities—are fixed. Let’s say we wanted to calculate the “cost” of cashing student checks. If we divide a portion of business office costs ($1,200) by the number of checks cashed in a period of time, the result will be misleading. . .
1. If 2,000 checks are cashed in a month, the “cost”
per check is ($1,200 / 2,000) $ 0.60
2. If 6,000 checks are cashed in a month, the “cost”
per check is ($1,200 / 6,000) $ 0.20

12 - 9
Copyright © 2017 McGraw-Hill Education. All rights reserved. No reproduction or distribution without the prior written consent of McGraw-Hill Education.
Cost Behavior Pattern: The Key
9
Recall the two simplifying assumptions that are made in connection with the determination of cost
behavior patterns:
First, the behavior pattern is true only within a relevant range of activity; if activity moves out of the relevant range, the cost will change.
Second, the cost behavior pattern identified is assumed to be linear within the relevant range, not curvilinear.
Learning Objective 12-4: Demonstrate why expressing fixed costs on a per unit of activity basis is misleading and may result in faulty
decisions.
Let’s look at an example…
12 - 10
Copyright © 2017 McGraw-Hill Education. All rights reserved. No reproduction or distribution without the prior written consent of McGraw-Hill Education.
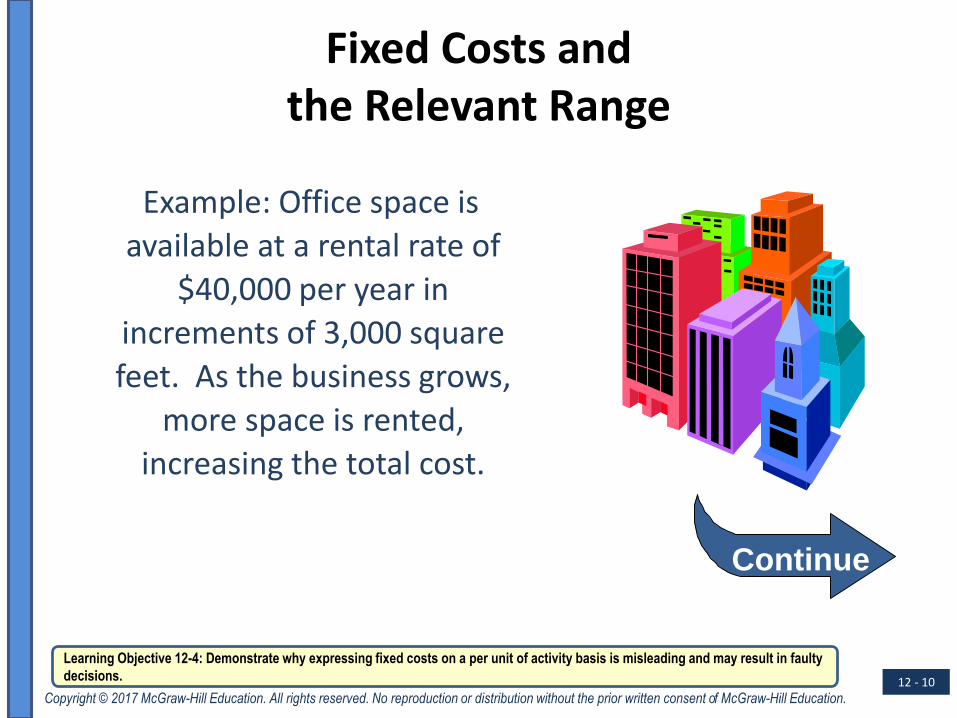
Fixed Costs andthe Relevant Range
Example: Office space is
available at a rental rate of
$40,000 per year in
increments of 3,000 square
feet. As the business grows,
more space is rented,
increasing the total cost.
Continue
Learning Objective 12-4: Demonstrate why expressing fixed costs on a per unit of activity basis is misleading and may result in faulty
decisions.

12 - 11
Copyright © 2017 McGraw-Hill Education. All rights reserved. No reproduction or distribution without the prior written consent of McGraw-Hill Education.
Fixed Costs andthe Relevant Range
**
**00 omitted
*
*000 omitted
Learning Objective 12-4: Demonstrate why expressing fixed costs on a per unit of activity basis is misleading and may result in faulty
decisions.
Examining fixed costs and the relevant range indicates that total cost doesn't change for a wide range of activity, but then jumps to a new higher cost for the next higher
range of activity.
Square feet
Tota
l Cost
$

12 - 12
Copyright © 2017 McGraw-Hill Education. All rights reserved. No reproduction or distribution without the prior written consent of McGraw-Hill Education.
Relationship of Total Costto Volume of Activity
Typical variable costs
• Raw materials
• Direct labor
• Factory utilities
• Sales commissions
• Shipping costs
Typical fixed costs
• Real estate taxes
• Insurance
• Supervisory salaries
• Depreciation
• Advertising
Learning Objective 12-5: Explain what types of costs are likely to have a variable cost behavior pattern and what types of costs are
likely to have a fixed cost behavior pattern.

12 - 13
Copyright © 2017 McGraw-Hill Education. All rights reserved. No reproduction or distribution without the prior written consent of McGraw-Hill Education.
Estimating Cost Behavior Patterns
The high-low method is
used to determine the fixed
and variable components
of a semivariable cost.
Learning Objective 12-6: Use the high-low method to determine the cost formula for a cost that has a mixed behavior pattern.

12 - 14
Copyright © 2017 McGraw-Hill Education. All rights reserved. No reproduction or distribution without the prior written consent of McGraw-Hill Education.
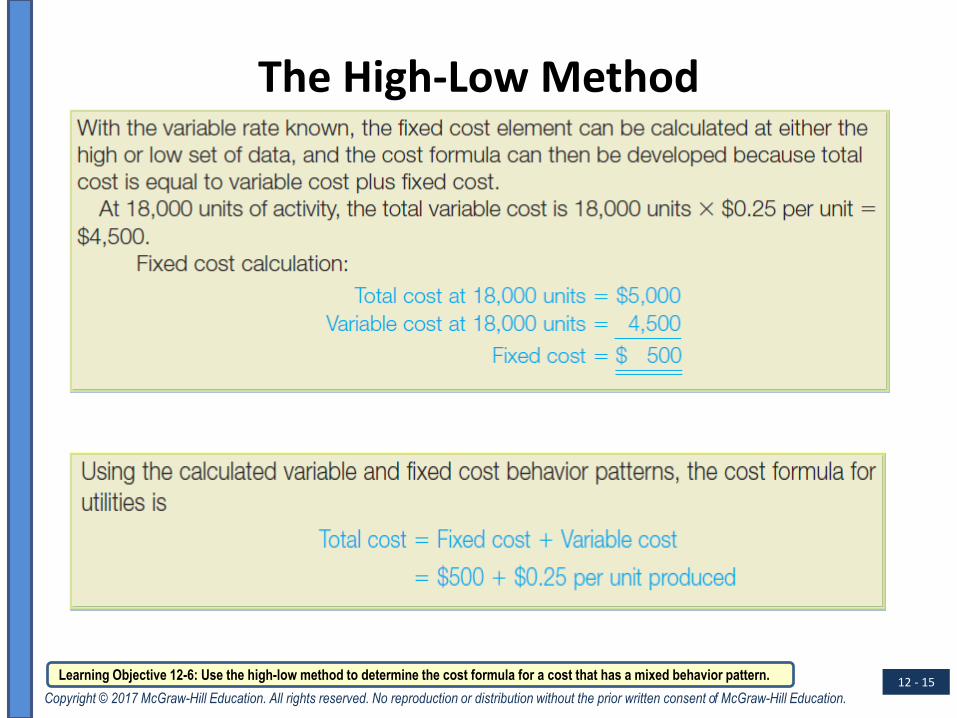
The High-Low Method
Learning Objective 12-6: Use the high-low method to determine the cost formula for a cost that has a mixed behavior pattern.
12 - 15
Copyright © 2017 McGraw-Hill Education. All rights reserved. No reproduction or distribution without the prior written consent of McGraw-Hill Education.
The High-Low Method
Learning Objective 12-6: Use the high-low method to determine the cost formula for a cost that has a mixed behavior pattern.

12 - 16
Copyright © 2017 McGraw-Hill Education. All rights reserved. No reproduction or distribution without the prior written consent of McGraw-Hill Education.
A Modified IncomeStatement Format
Let’s put our
knowledge of cost
behavior to work by
preparing a
contribution margin
format income
statement.
Learning Objective 12-7: Explain and illustrate the difference between the traditional income statement format and the
contribution margin income statement format.

12 - 17
Copyright © 2017 McGraw-Hill Education. All rights reserved. No reproduction or distribution without the prior written consent of McGraw-Hill Education.
The Contribution Margin Format
Used primarily for
external reporting.
Used primarily by
management.
Both formats report the same operating income!
Learning Objective 12-7: Explain and illustrate the difference between the traditional income statement format and the
contribution margin income statement format.
12 - 18
Copyright © 2017 McGraw-Hill Education. All rights reserved. No reproduction or distribution without the prior written consent of McGraw-Hill Education.
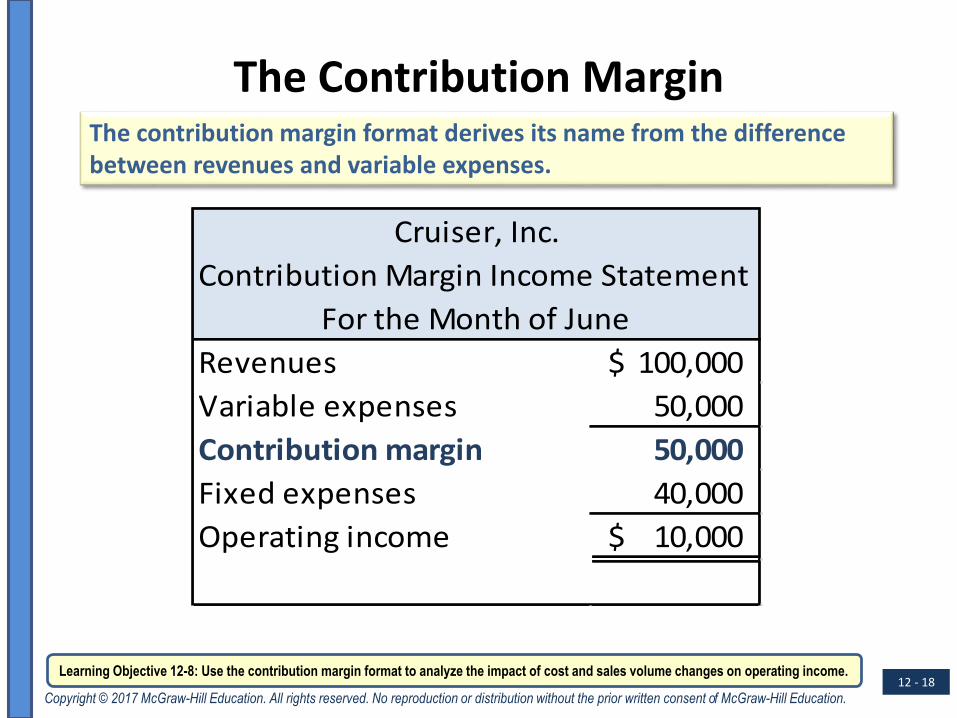
The Contribution MarginThe contribution margin format derives its name from the difference between revenues and variable expenses.
Contribution Margin Income Statement
Revenues 100,000$
Variable expenses 50,000
Contribution margin 50,000
Fixed expenses 40,000
Operating income 10,000$
Cruiser, Inc.
For the Month of June
Learning Objective 12-8: Use the contribution margin format to analyze the impact of cost and sales volume changes on operating income.

12 - 19
Copyright © 2017 McGraw-Hill Education. All rights reserved. No reproduction or distribution without the prior written consent of McGraw-Hill Education.
The Contribution Margin Format
Contribution margin means that this amount is the contribution to fixed expenses and operating income from the sale of products or provision of services.
• As revenues increase as a result of selling more products or providing more services, variable expenses will increase proportionately, and so will contribution margin.
• However, fixed expenses will not increase because they are not a function of the level of revenue-generating activity.
12-19
Learning Objective 12-9: Calculate the contribution margin ratio and explain how it can be used in CVP analysis.

12 - 20
Copyright © 2017 McGraw-Hill Education. All rights reserved. No reproduction or distribution without the prior written consent of McGraw-Hill Education.
Contribution Margin Model
To illustrate the use of the model, assume management wants to know the operating income from a product that has the following revenue, cost, and volume characteristics:
Learning Objective 12-9: Calculate the contribution margin ratio and explain how it can be used in CVP analysis.

12 - 21
Copyright © 2017 McGraw-Hill Education. All rights reserved. No reproduction or distribution without the prior written consent of McGraw-Hill Education.
Contribution Margin ModelNow suppose management wants to know what would happen to
operating income if a $3 per unit price cut were to result in a volume increase of 5,000 units, to a total of 13,000 units. Let’s see what will
happen to operating income.
Learning Objective 12-9: Calculate the contribution margin ratio and explain how it can be used in CVP analysis.
12 - 22
Copyright © 2017 McGraw-Hill Education. All rights reserved. No reproduction or distribution without the prior written consent of McGraw-Hill Education.
Contribution Margin Model
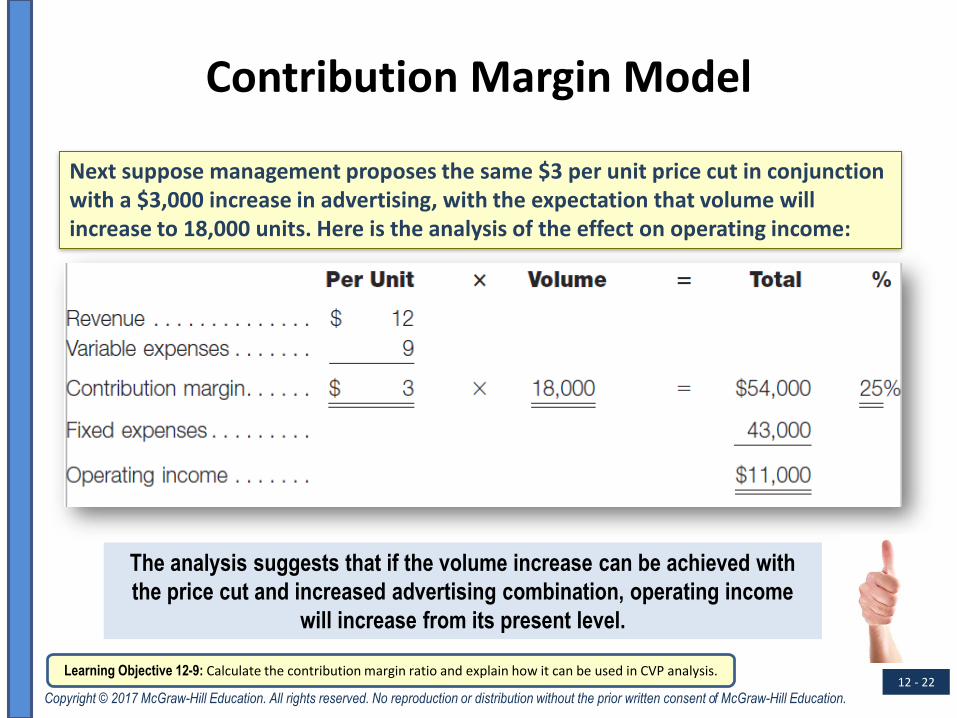
Next suppose management proposes the same $3 per unit price cut in conjunction with a $3,000 increase in advertising, with the expectation that volume will increase to 18,000 units. Here is the analysis of the effect on operating income:
Learning Objective 12-9: Calculate the contribution margin ratio and explain how it can be used in CVP analysis.
The analysis suggests that if the volume increase can be achieved with
the price cut and increased advertising combination, operating income
will increase from its present level.
12 - 23
Copyright © 2017 McGraw-Hill Education. All rights reserved. No reproduction or distribution without the prior written consent of McGraw-Hill Education.
Contribution Margin Ratio in Action
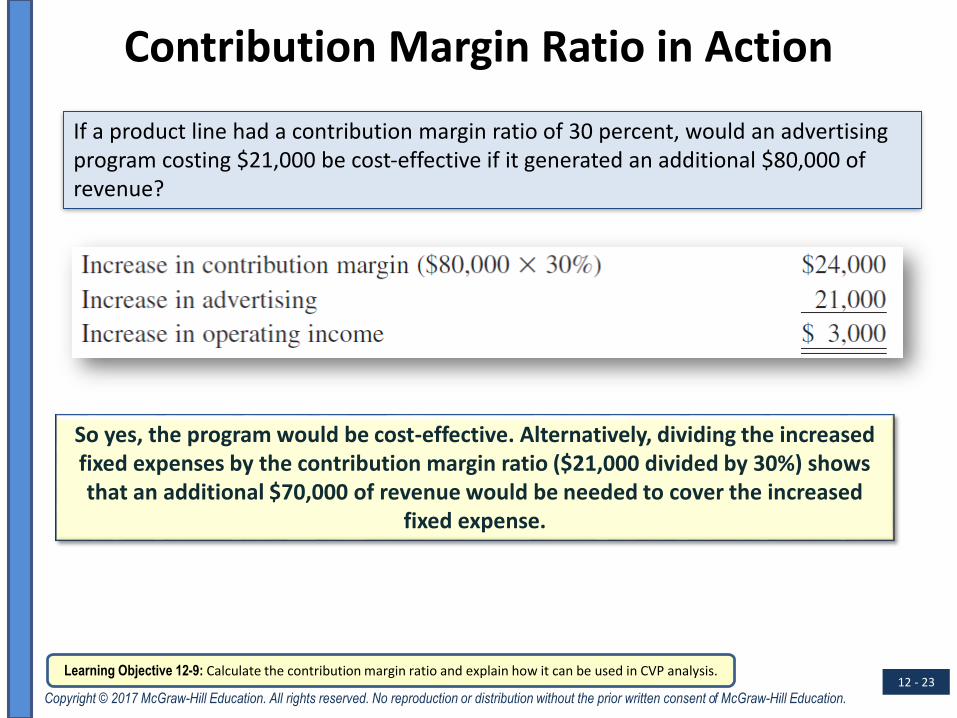
If a product line had a contribution margin ratio of 30 percent, would an advertising program costing $21,000 be cost-effective if it generated an additional $80,000 of revenue?
So yes, the program would be cost-effective. Alternatively, dividing the increased fixed expenses by the contribution margin ratio ($21,000 divided by 30%) shows that an additional $70,000 of revenue would be needed to cover the increased
fixed expense.
Learning Objective 12-9: Calculate the contribution margin ratio and explain how it can be used in CVP analysis.

12 - 24
Copyright © 2017 McGraw-Hill Education. All rights reserved. No reproduction or distribution without the prior written consent of McGraw-Hill Education.
Multiple Product Mix Consideration
Sales mix is the relative combination in whicha company’s different products are sold.Different products have different selling prices, costs, and contribution margins.
A change in the sales mix will result in a
different contribution margin ratio.
Learning Objective 12-10: Analyze how changes in the sales mix can affect projections using CVP analysis.

12 - 25
Copyright © 2017 McGraw-Hill Education. All rights reserved. No reproduction or distribution without the prior written consent of McGraw-Hill Education.
Multiple Product Mix Consideration
YardCare Inc. provides us
with the following information:
Lawnmowers Total
Sales 250,000$ 100% 300,000$ 100% 550,000$ 100%
Variable expense 150,000 60% 135,000 45% 285,000 52%
Contribution margin 100,000$ 40% 165,000$ 55% 265,000$ 48%
Fixed expense 170,000
Operating income 95,000$
Lawn tractors
Both products have the same sales volume of 1,000 units.
However, each product has a different contribution margin ratio.
Learning Objective 12-10: Analyze how changes in the sales mix can affect projections using CVP analysis.

12 - 26
Copyright © 2017 McGraw-Hill Education. All rights reserved. No reproduction or distribution without the prior written consent of McGraw-Hill Education.
Multiple Product Mix Consideration
Lawnmowers Total
Sales 250,000$ 100% 300,000$ 100% 550,000$ 100%
Variable expense 150,000 60% 135,000 45% 285,000 52%
Contribution margin 100,000$ 40% 165,000$ 55% 265,000$ 48%
Fixed expense 170,000
Operating income 95,000$
Lawn tractors
$265,000
$550,000= 48% (rounded)
Average total contribution margin ratio provided from all products:
How will average total contribution margin change if Jones sold
1,500 lawn tractors, all other factors held constant?
YardCare Inc. provides us
with the following information:
Learning Objective 12-10: Analyze how changes in the sales mix can affect projections using CVP analysis.
12 - 27
Copyright © 2017 McGraw-Hill Education. All rights reserved. No reproduction or distribution without the prior written consent of McGraw-Hill Education.
Multiple Product Mix Consideration
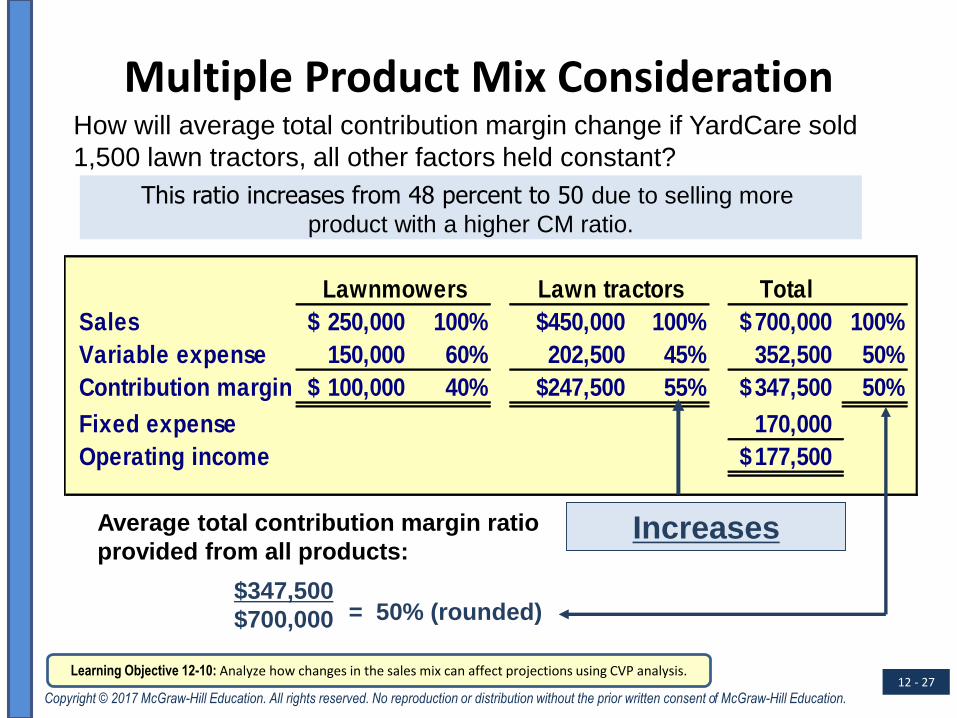
Lawnmowers Total
Sales 250,000$ 100% $450,000 100% 700,000$ 100%
Variable expense 150,000 60% 202,500 45% 352,500 50%
Contribution margin 100,000$ 40% $247,500 55% 347,500$ 50%
Fixed expense 170,000
Operating income 177,500$
Lawn tractors
$347,500
$700,000 = 50% (rounded)
Average total contribution margin ratio
provided from all products:
How will average total contribution margin change if YardCare sold
1,500 lawn tractors, all other factors held constant?
This ratio increases from 48 percent to 50 due to selling more
product with a higher CM ratio.
Increases
Learning Objective 12-10: Analyze how changes in the sales mix can affect projections using CVP analysis.
12 - 28
Copyright © 2017 McGraw-Hill Education. All rights reserved. No reproduction or distribution without the prior written consent of McGraw-Hill Education.
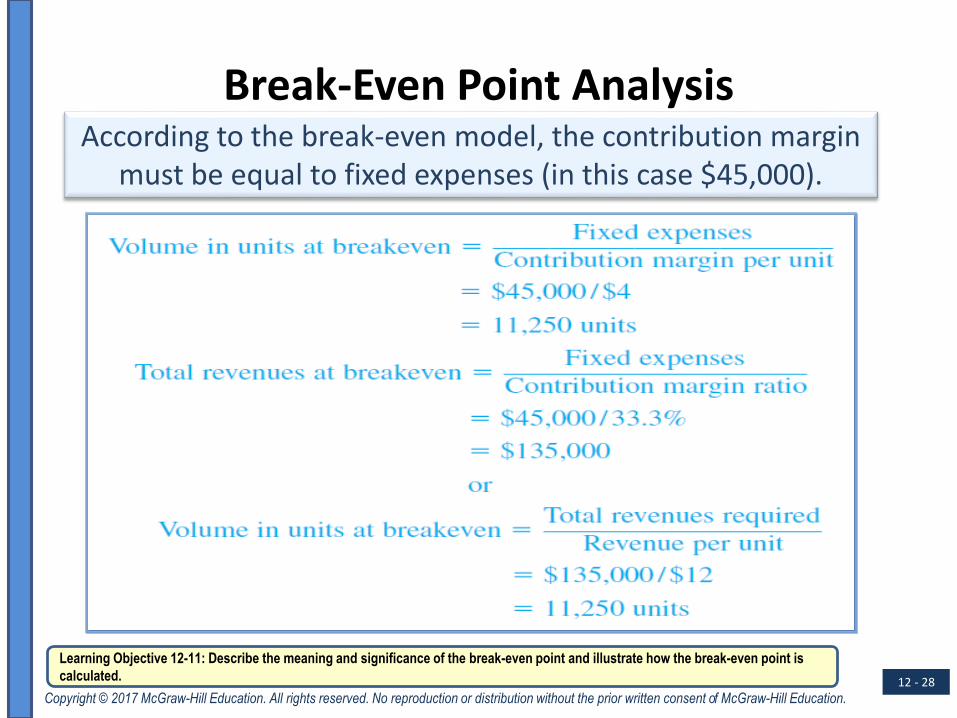
Break-Even Point AnalysisAccording to the break-even model, the contribution margin
must be equal to fixed expenses (in this case $45,000).
Learning Objective 12-11: Describe the meaning and significance of the break-even point and illustrate how the break-even point is
calculated.

12 - 29
Copyright © 2017 McGraw-Hill Education. All rights reserved. No reproduction or distribution without the prior written consent of McGraw-Hill Education.
Break-Even Point Analysis
The break-even formula also can be easily modified to determine these amounts by adding the desired operating income to the numerator. To illustrate, assume the same information and a desired operating income of $10,000:
Learning Objective 12-11: Describe the meaning and significance of the break-even point and illustrate how the break-even point is
calculated.

12 - 30
Copyright © 2017 McGraw-Hill Education. All rights reserved. No reproduction or distribution without the prior written consent of McGraw-Hill Education.
Break-Even Graph
Learning Objective 12-11: Describe the meaning and significance of the break-even point and illustrate how the break-even point is
calculated.
The company must sell
approximately 11,250 units to
break even.
The horizontal line represents fixed expenses of $45,000, and variable expenses of $8 per unit are added to fixed expenses to produce the total expense line. Revenues start at the origin and rise at the rate of $12 per
unit in proportion to the sales volume in units.

12 - 31
Copyright © 2017 McGraw-Hill Education. All rights reserved. No reproduction or distribution without the prior written consent of McGraw-Hill Education.
Operating Leverage
When an entity’s revenues change because the volume of activity changes, variable expenses and contribution margin will change
proportionately. But the presence of fixed expenses, which do not change as the volume of activity changes, means that operating
income will change proportionately more than the change in revenues.
Learning Objective 12-12: Use operating leverage to evaluate cost structures.
This magnification of the effect on operating income resulting from a change in
revenue is called “operating leverage.” The higher a firm’s contribution margin ratio, the
greater its operating leverage.
12 - 32
Copyright © 2017 McGraw-Hill Education. All rights reserved. No reproduction or distribution without the prior written consent of McGraw-Hill Education.
Operating Leverage
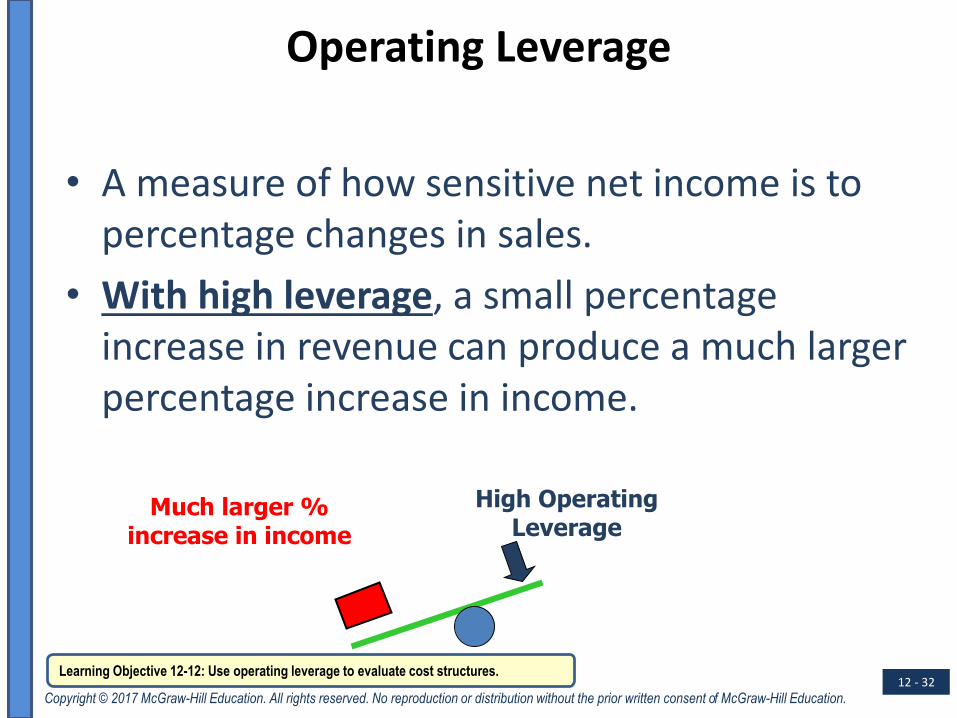
• A measure of how sensitive net income is to percentage changes in sales.
• With high leverage, a small percentage increase in revenue can produce a much larger percentage increase in income.
Learning Objective 12-12: Use operating leverage to evaluate cost structures.
High Operating Leverage
Much larger % increase in income

12 - 33
Copyright © 2017 McGraw-Hill Education. All rights reserved. No reproduction or distribution without the prior written consent of McGraw-Hill Education.
Operating Leverage
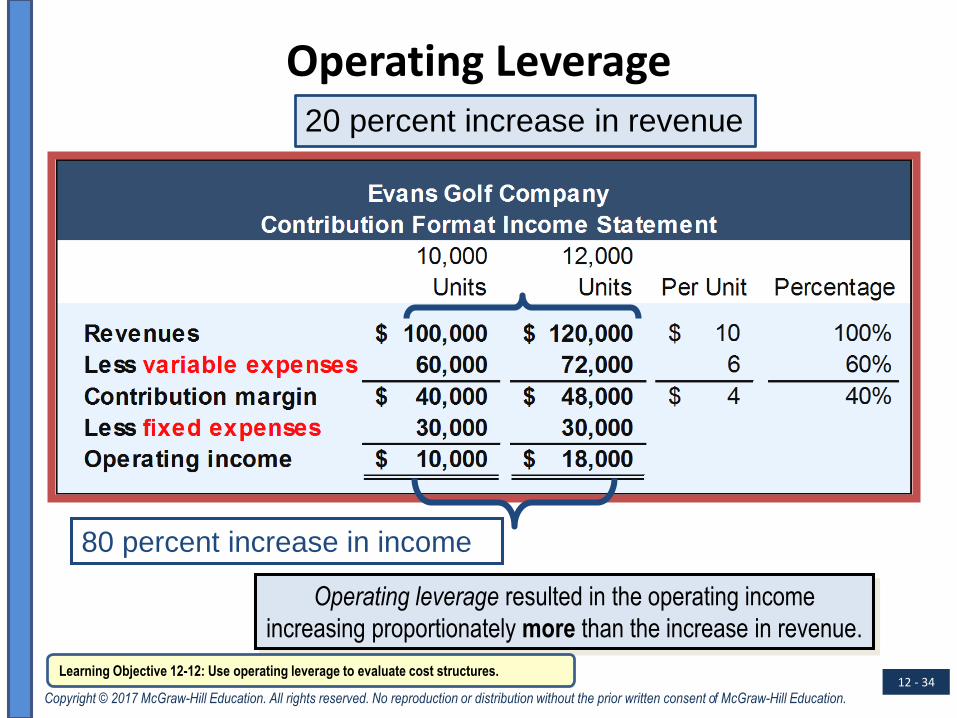
If revenues increase by 20 percent,
what is the percentage increase in income?
Learning Objective 12-12: Use operating leverage to evaluate cost structures.
12 - 34
Copyright © 2017 McGraw-Hill Education. All rights reserved. No reproduction or distribution without the prior written consent of McGraw-Hill Education.
Operating Leverage
80 percent increase in income
Operating leverage resulted in the operating income
increasing proportionately more than the increase in revenue.
20 percent increase in revenue
Learning Objective 12-12: Use operating leverage to evaluate cost structures.
12 - 35
Copyright © 2017 McGraw-Hill Education. All rights reserved. No reproduction or distribution without the prior written consent of McGraw-Hill Education.
End of Chapter 12