Accounting principles and notes - SAES Getters · PDF file27 draw up the individual financial...
44
Accounting principles and notes
-
Upload
hoangkhanh -
Category
Documents
-
view
219 -
download
0
Transcript of Accounting principles and notes - SAES Getters · PDF file27 draw up the individual financial...

25
Accounting principles and notes

26
1. Group profile
Saes Getters S.p.A., the parent company, and its subsidiaries operate both in Italy and abroad inthe development, production and marketing of getters and other components for cathode raytubes and flat panel displays as well as getters and other components for industrial applications,and in the gas purification industry. The Group also operates in the field of advanced materials,particularly in the development of getters for microelectronic and micromechanical systems,optical crystals, shape memory alloys and metalorganic precursors.
The parent company Saes Getters S.p.A. is controlled by S.G.G. Holding S.p.A.
There are no changes in the scope of consolidation to report since December 31, 2004.The structure of the Saes Getters Group and the scope of consolidation are shown in note no. 39.
2. Summary of main accounting principles
Following the entry into force of EC Regulation no. 1606/2002, the Saes Getters Group adoptedIAS/IFRS accounting standards as from 1 January 2005. This half year report was preparedaccording to these new standards and, in particular, according to IAS 34 "Interim FinancialReporting".
These standards were adopted in preparing the comparative balance sheets, income statementsand cash flow statements, with the exception of the measurement and recognition of financialinstruments, particularly with regard to exchange risk hedges and the recognition of treasuryshares. The Company in fact exercised the option specified in IFRS 1 to define the date oftransition as January 1, 2005 for IAS 32 and 39. Please refer to the section on accountingprinciples and notes for further details.
As part of the first-time adoption, IFRS 1 "First-time adoption of International Financial ReportingStandards" was applied. For a description of the effects arising from the transition to InternationalFinancial Reporting Standards (IAS/IFRS), please refer to note no. 39, containing a reconciliationbetween shareholders' equity and net income for the period according to Italian AccountingPrinciples and according to International Financial Reporting Standards (IAS/IFRS), both withreference to the previous comparable interim period (ended June 30, 2004) and to December 31,2004, the reporting date for the last financial statements prepared in accordance with theaccounting principles previously utilized.
The standards adopted in this half year report and in the reconciliations presented may be differentfrom the IFRS standards effective as at December 31, 2005, as a result of the EuropeanCommission's future guidance on the approval of the standards or the subsequent issue of newaccounting standards, interpretations or implementation guidelines issued by the InternationalAccounting Standards Board (IASB) or the International Financial Reporting InterpretationCommittee (IFRIC).
It should be taken into consideration that the half-year report does not include all the informationrequired to prepare full annual financial statements. However, as a result of the first-time adoptionof international financial reporting standards, these are more extensive than those requiredpursuant to IAS 34 and comparable with those contained in annual financial statements. Having exercised the option specified in Article 4, sub-section 2 of Legislative Decree no. 38/2005on the exercising of the options provided for in EC Regulation no. 1606/2002 on accountingstandards, the parent company and the subsidiary Saes Advanced Technologies S.p.A. intend to
Accounting principles and notes

27
draw up the individual financial statements for the year ended December 31, 2005 according tointernational accounting standards.
The main accounting standards applied are described below.
Consolidation principles
The main consolidation principles adopted in drawing up the consolidated financial statements areas follows:
- The book value of investments in share capital is eliminated against the respective proportionof shareholders' equity in respect of the assumption of assets and liabilities, according to thefull consolidation method.
- In accordance with IAS 31, the book value of investments in jointly controlled companiesincluded in the consolidated financial statements according to the proportionat consolidationmethod is eliminated against the respective fraction of shareholders' equity pertaining to theGroup in respect of the assumption of assets and liabilities for the amount corresponding tothe Group's percentage investment. Each item of the income statement is also entered in theconsolidated financial statements for the amount corresponding to the Group's percentageinvestment. Debit and credit items and all other transactions between the jointly controlledcompany and the subsidiaries are eliminated according to the Group's percentage ownership.Residual balances are recognized in the balance sheet and in the income statement togetherwith third party transactions.
- Any positive difference between the cost of acquisition and the subsidiaries' equity share,expressed at the fair value at the time of acquiring the investment, if the necessaryrequirements are met, is posted as "Goodwill".
- Profits and losses not yet realized arising from transactions between consolidated companiesare eliminated as are debit and credit items and all other transactions between the companiesincluded in the scope of consolidation.
- The financial statements of foreign subsidiaries are converted into the currency of account(euro) by applying the current year-end exchange rate to assets and liabilities and the averageexchange rate for the year to income statement entries. The difference between net incomefor the period obtained from converting at average exchange rates and net income for theperiod obtained from converting at year-end rates is entered in a special sub-item of theshareholders' equity "Currency translation reserve" included in the item "Sundry reserves andretained earnings". The same item also considers the effect on shareholders' equity of changesin exchange rates between the end of the previous financial year and the end of the currentfinancial year.
Details of the exchange rates applied in the conversion of financial statements expressed in aforeign currency are given in note no. 40.
Accounting schemes
The balance sheet layout conforms to the minimum content required by international accountingstandards and is based on a distinction between current and non-current assets and liabilitiesdepending on whether these items are realized within or after twelve months of the balance sheetdate. The income statement is based on a cost allocation structure.The accounting schemes are consistent with the reports prepared for the internal organizationaland management structure.
Property, plant and equipment
These are stated at cost or deemed cost, less accumulated depreciation and impairment losses.
28
The cost includes additional charges and direct and indirect production costs in the amountreasonably attributable to the asset.Maintenance costs incurred after first recognition are capitalized only if they bring about anincrease in the future economic benefits of the assets to which they relate.Some fixed assets were measured at fair value on the date of transition to International FinancialReporting Standards (IAS/IFRS) and are measured at deemed cost, which consists of the amountadjusted by the Group's Italian companies in accordance with the specific monetary revaluationlaws at the time of these revaluations.
Depreciation is calculated on a straight-line basis according to the expected useful life of the fixedassets, using the following rates:
Buildings 2.5%-3%Machinery and equipment 10%-25%Industrial and commercial equipment 20%-25%Other assets 7%-25%
Finance leases are classified as those which transfer to the lessee substantially all the risks andrewards incidental to ownership. Fixed assets acquired under finance leases are recognized at thelower of fair value and the present value of the minimum lease payments owed, according to thecontracts, and are depreciated on the basis of their expected useful life. The liability to the lessoris classified amongst financial liabilities in the balance sheet. Interest included in the leasepayments is charged to the income statement for the period as financial expenses.Other leases are considered as operating leases and the respective costs are recognized on thebasis of the conditions stipulated in the respective contracts.
Intangible assets
In accordance with IAS 38, intangible assets are recognized only if they are identifiable, if futureeconomic benefits will probably flow from their use and if their cost can be reliably measured.
Intangible assets are amortized according to their estimated useful life, if finite, as follows: Industrial and other patent rights 3-5 years/duration of the contractConcessions, licenses, trademarks and similar rights 3-50 years/duration of the contractOther 3-8 years/duration of the contract
Intangible assets with an indefinite useful life are not amortized but are assessed for impairmentat least annually or according to the frequency determined by impairment risk indications.
Subsequent expenditure is only recognized if it increases the economic benefits expected fromthe use of the intangible assets to which it relates.
GoodwillAny positive difference between the cost of acquisition of a business combination and the fairvalue of the assets and liabilities acquired is stated amongst intangible assets as goodwill. Anynegative difference is charged to the income statement at the time of acquisition.Goodwill is not amortized but must be tested for impairment in accordance with IAS 36Impairment of assets, at least annually or according to the frequency determined by impairmentrisk indications. After initial recognition, goodwill is stated at cost less any impairmentsrecognized.During the first-time adoption of International Financial Reporting Standards, the Group tookadvantage of the specific exemption allowed under IFRS 1 which makes it possible to avoid theretrospective application of IFRS 3 Business combinations for acquisitions made prior to the dateof transition to IFRS. Therefore, the goodwill generated by acquisitions prior to January 1, 2004 is

29
stated at the value determined according to the accounting principles previously applied, aftermeasuring and recognizing any lasting impairments.
Research and development expensesThe expenses incurred in research activities undertaken to acquire new scientific or technicalknowledge or to broaden existing knowledge are charged to the income statement.The expenses incurred in development activities where research findings are applied to new orsubstantially improved products and processes are capitalized if all of the following conditions aremet:
technical feasibility, intention to complete the asset for use or sale, ability to use or sell theasset;likely to generate future economic benefits from the expenditure incurred (in particular bydemonstrating the existence of a market for the asset being developed);availability of technical and financial resources to complete the development of the asset;expenditure measured reliably.
Impairment
The recoverable amount of property, plant and equipment and intangible assets is verified at leastannually if there is an indication of impairment. An impairment loss should be recognizedwhenever the carrying amount of an asset exceeds its recoverable amount. Intangible assets withan indefinite useful life are tested for impairment annually or according to the frequencydetermined by impairment risk indications.If it is not possible to determine the recoverable amount for an individual asset, the Groupestimates the recoverable value of the related cash generating unit. The recoverable amount is the higher of an asset's fair value less costs to sell and its value in use.Value in use is determined from estimated future cash flows based on a pre-tax discount rate thatreflects the time value of money and the risks specific to the asset. Impairment loss is equal to the part of carrying amount exceeding recoverable amount. If,subsequently, an impairment loss on an asset other than goodwill is reversed or reduced, thecarrying amount of the asset is increased based on its estimated recoverable amount, but not toexceed the amount that the asset would have had if no impairment loss had ever beenrecognized. Impairment loss and reversal of an impairment loss are recognized in the incomestatement
Investments in share capital and other financial assets
These belong to the categories "available-for-sale financial assets" or "held-to-maturity investments"defined by IAS 39. Assets in the first category are measured at fair value if a market price isavailable or at cost if it is not possible to determine the fair value. Assets in the second categoryare valued at amortized cost.
Inventory and construction contracts
Inventory is stated at the lower of purchase or production cost, calculated according to the FIFOmethod, and the market value. Production cost includes the direct costs of materials and labor and indirect production costs(variable and fixed). Obsolete and slow-moving stock is written down in relation to its possible use or realization.Construction contracts are measured on the basis of the stage of completion, net of any advancesinvoiced to customers. The production cost includes the direct costs of materials and labor andthe indirect production costs (variable and fixed) reasonably attributable to them. Losses onconstruction contracts, if any, are charged to the income statement if it is likely that the totalestimated expenses will exceed the total revenues expected.

30
Trade and other receivables
These are stated at nominal value less appropriate allowances for estimated irrecoverableamounts.
Assets and liabilities held for sale
These are assets and liabilities whose value will be recovered through sale rather than throughuse, insofar as they are subject to disposal. This specific classification is adopted when the saleoccurs or when the assets and liabilities meet the criteria of "held for sale", if known previously. These are measured at the lower of carrying value and fair value, less their costs to sell. Impairments at the time of classification of assets and liabilities as held for sale are charged tothe income statement, together with subsequent income and expenses arising from themeasurement of these items.
Derivative financial instruments
In accordance with IAS 39, at the end of the period derivative financial instruments aremeasured at fair value and hedge accounting is applied if all requirements set out by thestandard are met, i.e.:
there is formal designation and documentation of a hedging relationship at inception;the hedge is expected to be highly effective;hedge effectiveness is reliably measurable;the hedge has been highly effective throughout the reporting periods for which it wasdesignated;
If all conditions for the application of hedge accounting are met, derivative financial instrumentsare treated according to the cash flow hedge model, which is applied to hedges against changesin cash flows arising from highly probable future transactions that may produce effects on theincome statement. According to the cash flow hedge model, the effective portion of the gain orloss on derivative financial instruments is recognized in an equity reserve. Cumulative gains orlosses recognized in equity are charged to the income statement for the period in which thehedged transaction is recognized. The ineffective portion of the gain or loss on financialinstruments is charged directly to the income statement. Cumulative gains or losses related toforecasted hedged transactions that are no longer expected to occur are also charged to theincome statement.If a hedging instrument or relationship is terminated and the forecasted hedged transaction hasnot yet occurred, the cumulative gains or losses recognized in equity at that time are charged tothe income statement when the related transaction occurs.
Accrued income/liabilities, prepaid expenses and deferred income
These items include portions of costs and revenues which are common to two or more financialyears, in accordance with accrual basis accounting.
Shareholders' Equity
The dividends distributed by the parent company are booked as liabilities at the time of thedistribution decision. Transactions involving the purchase and sale of treasury shares arerecognized directly as movements in shareholders' equity, without going through the incomestatement.

31
Financial liabilities
These are initially stated at cost, i.e. the resources received net of the additional charges to payoff the liability. Subsequently, financial liabilities are valued at amortized cost, i.e. the amount ofthe initial liability net of capital repayments and additional charges amortized.
Staff leaving indemnity and other employee benefits
This item includes staff leaving indemnity and other employee benefits, set aside to cover theaccrued liabilities payable to employees according to the laws, national collective agreements andsupplementary company agreements in force in the countries in which the consolidatedcompanies operate. Both defined contribution and defined benefit plans are included. Under defined contributionplans, obligations are recorded as expenses on an accrual basis. Under defined benefit plans,obligations are valued by independent actuarial consultants according to the Projected Unit CreditMethod, separately applied to each plan. As part of the first-time adoption of International Financial Reporting Standards (IAS/IFRS), allactuarial gains and losses existing on January 1, 2004 were recognized in the special equityreserve, together with the other impacts arising from the transition. After the date of transition toIFRS, the corridor approach is applied in respect of actuarial gains and losses, which arerecognized for the cumulative part exceeding 10% of the present value of the defined benefitobligation at the end of the previous period. The liabilities arising from defined benefit plans are made up of the present value of the obligationtowards employees, adjusted by unrecognized actuarial gains or losses and past service costs notyet recorded.Payments under defined contribution plans are charged to the income statement as costs whenincurred
Provisions for contingencies and obligations
Provisions for contingencies and obligations are set aside to cover legal or constructiveobligations, arising from past events and their settlement will require a probable outflow ofresources, the amount of which can be reliably estimated. Changes of estimate are recognized in the income statement for the period in which the changeoccurs.
If the effect is significant, provisions for contingencies and obligations have to be stated at thepresent value.
Trade and other payables
These relate respectively to trade or miscellaneous relations and are stated at nominal value.
Treasury shares
Treasury shares are deducted from equity. The original cost and the items generated from theirsubsequent sale are recognized as changes in shareholders' equity.
Revenue recognition
Revenues are recognized to the extent that it is probable that economic benefits will flow to theGroup and the amount of revenue can be measured reliably. Revenues are stated net ofdiscounts, allowances and returns.

32
Revenues from the sale of goods are recognized when the transfer to the buyer of the risks andrewards of ownership takes place. Revenues generated from the rendering of services are recognized in the period in which theservice was rendered.
Grants
Grants are recognized in the income statement where there is reasonable assurance that thesewill be obtained and that all the conditions for their recognition will be met. Capital grants, in the amount pertaining to the year, are charged to the income statement on thebasis of the useful life of the assets to which the grants relate. The proportion of the capital grantthat relates to future financial years is entered under the item "Accrued liabilities". Operating grants are recognized according to the accrual method of accounting in the sameperiod in which the associated costs are incurred, shown net of these grants.
Cost of sales
The cost of sales represents the cost of buying or producing the products and goods that havebeen sold and includes the cost of raw materials, goods and direct and indirect production costs.The cost of sales also includes margins on construction contracts recognized by reference to thestage of completion (percentage of completion method).
Research and development expenses
All research expenses are charged to the income statement for the year in which they areincurred. Development expenses must be capitalized if the conditions set out in IAS 38 are metas already described in the notes on intangible assets. If the requirements for the mandatorycapitalization of development expenses are not met, the expenses are charged to the incomestatement for the year in which they are incurred.
Selling expenses
These include the expenses that are incurred during the year as a result of selling products.
General and administrative expenses
These include the expenses that are incurred during the year in relation to the administrativestructure.
Financial items
These include interest income and expense, exchange gains and losses (both realized andunrealized) and any adjustments to securities. Interest expense of any kind is charged to the income statement for the year in which it isincurred.
Income taxes
Income taxes for the period include both current and deferred taxes and are charged to theincome statement for the year, except those relating to items directly debited or credited in an
33
item of shareholders' equity for which the tax effect is recognized in equity.Current taxes are recognized on the basis of estimated taxable income in accordance with theprovisions in force, taking account of the applicable exemptions and tax credits due.Deferred taxes are recognized for temporary differences between the carrying amount of anasset or liability and its value for tax purposes. Deferred tax assets, including those arising fromtax losses carried forward and unused tax credits, are recognized to the extent that it is probablethat future taxable income will be available to allow for their recovery. Deferred tax assets and liabilities are determined according to the tax rates that are applicable inthe years during which the temporary differences are realized or settled in the respectivecountries in which the Group's companies operate. The consolidated financial statements recognize provisions for taxes owed in the event of thedistribution of profits and reserves by subsidiaries, excluding those relating to profits and reservesthat are not considered likely to be distributed in the foreseeable future.
Earnings per share
Earnings per share are calculated by dividing the net income for the period attributable to holdersof ordinary and savings shares by the weighted average number of shares in issue during theperiod.
Business segments
A business segment is a separately identifiable business component whose function is to providean individual product or service or series of products and services and which is subject to differentrisks and returns from those of other business segments.

34
Notes to the financial statements
All amounts stated in the notes and in the financial statements are expressed in thousands ofeuro unless otherwise specified.
3. Net sales
Consolidated net sales for the first half of 2005 were c66,447 thousand, down by 8.8% onthe figure of c72,847 thousand posted in the first half of 2004. The drop in sales net of theexchange rate effect was 6.7% whilst the strengthening of the euro against the major foreigncurrencies caused a further fall of 2.1%. In particular, the Cathode Ray Tubes and SemiconductorsBusiness Areas achieved lower sales, only partially offset by the growth in sales in the Flat PanelDisplays Business Area. It should be recalled that in the first half of 2004, some assets relatingto the semiconductor market were disposed of as part of a plan aimed at recovering efficiencyand focusing on profitable businesses. Net of the assets disposed of, the drop in sales wouldhave been 5.7%.
A breakdown of net sales according to Business Unit and Business Area is given below:
Business Unit and Business Area 1st Half 1st Half Difference2005 2004
Cathode Ray Tubes 16,176 22,715 (6,539) -28.8%Flat Panel Displays 23,490 19,948 3,542 17.8%Subtotal Information Displays 39,666 42,663 (2,997) -7.0%Lamps 5,661 5,721 (60) -1.0%Electronic Devices 6,240 5,869 371 6.3%Vacuum Systems and Thermal Insulation 3,222 3,045 177 5.8%Semiconductors 11,370 15,549 (4,179) -26.9%Subtotal Industrial Applications 26,493 30,184 (3,691) -12.2%Subtotal Advanced Materials 288 0 288 n.a.Total Net Sales 66,447 72,847 (6,400) -8.8%
Legenda:Information Displays Business UnitCathode Ray Tubes Barium getters for cathode ray tubesFlat Panel Displays Getters and metal dispensers for flat panel displays
Industrial Applications Business UnitLamps Getters and metal dispensers used in discharge
lamps and fluorescent lampsElectronic Devices Getters and metal dispensers for electron vacuum
devicesVacuum Systems and Thermal Insulation Pumps for vacuum systems and products for
thermal insulationSemiconductors Gas purifier systems for semiconductor industry
and other industries and installations for the telecommunications industry
Advanced Materials Business Development UnitAdvanced Materials Getters for microelectronic and micromechanical
systems, optical crystals, shape memory alloys and metalorganic precursors

35
4. Cost of sales
The amount stated in the income statement in the first half 2005 was c31,768 thousand, downby c4,483 thousand on the figure of c36,251 thousand posted in the first half 2004.
A breakdown of the cost of sales according to Business Unit is given below:
1st Half 1st Half Difference2005 2004
Information Displays 14,766 16,688 (1,922)Industrial Applications 16,422 19,306 (2,884)Advanced Materials & Corporate Costs 580 257 323Cost of sales 31,768 36,251 (4,483)
Both Business Units saw a sharp fall in the cost of sales, mainly as a result of lower net salesand of the positive effects arising from the restructuring operations and disposals implementedin the previous period, particularly in terms of personnel costs.
A breakdown of the cost of sales according to category is given below:
1st Half 1st Half Difference2005 2004
Raw Materials 9,291 9,784 (493)Direct labor 5,965 7,212 (1,247)Manufacturing overhead 16,923 18,596 (1,673)(Increase) decrease in inventory (411) 659 (1,070)Cost of sales 31,768 36,251 (4,483)
The reduction in the cost of direct labor and manufacturing overheads was chiefly due to theaforementioned restructuring operations and disposals.
5. Operating expenses
Operating expenses totaled c21,857 thousand (c21,168 thousand in the first half of 2004),broken down by destination as follow:
1st Half 1st Half Difference2005 2004
Research and development expenses 7,188 6,525 663Selling expenses 7,770 8,063 (293)General and administrative expenses 6,899 6,580 319Totale operating expenses 21,857 21,168 689
Operating expenses increased by c689 thousand, principally as a result of increased research anddevelopment expenses and the inclusion, in the general and administrative expenses, of non-recurring consultancy expenses in relation to the voluntary conversion of savings shares intoordinary shares which took place in January 2005.

36
A breakdown of total expenses by nature included in the cost of sales and in operating expensesis given below:
Total costs by nature 1st Half 1st Half Difference2005 2004
Personnel cost 21,309 23,503 (2,194)Travel expenses 1,151 1,145 6Maintenance and repairs 2,247 2,203 44Depreciation 5,217 5,411 (194)Amortization 520 575 (55)Material and office material 2,448 2,590 (142)Insurance services 502 558 (56)Promotion and advertising 182 230 (48)Provision for bad debts 107 61 46Consultant fees 2,725 2,653 72Rent office 288 507 (219)Licenses and patents 597 772 (175)Post, telephone, telex, fax 394 492 (98)Transport, insurance, freight 630 615 15Recovery of insurance, transport, freight (200) (44) (156)Other recovery (414) (979) 565Other expenses 7,042 6,684 358Total 44,745 46,976 (2,231)
The item Consultant fees includes, inter alia, the costs associated with the voluntary conversionof savings shares into ordinary shares.
The total labor cost was c21,309 thousand, down on the same period last year (c23,503thousand), mainly reflecting the decrease in the number of Group employees resulting from theaforementioned restructuring operations and the disposal of the assets relating to theSemiconductors Business Area.
It should also be recalled that the item Other expenses includes the fees owed to the Directors(which rose from c715 thousand in the first half of 2004 to c1,080 thousand for the period endedJune 30, 2005) and to the Board of Statutory Auditors (which rose from c43 thousand in the firsthalf of 2004 to c44 thousand for the period ended June 30, 2005).
6. Other income (expenses) net
The item Other income (expenses), net shows a year-on-year decrease of c566 thousand. Itshould be recalled that in the last period a capital gain (of c803 thousand) was made from thedisposal of the assets relating to gas impurity analyzers based on IMS technology relating to thesubsidiary New Trace Analytical, Inc. (formerly Molecular Analytics, Inc.).
The item is broken down as follows.

37
1st Half 1st Half Difference2005 2004
Capital gains on disposal of assets 113 838 (725)Gains from financial instruments evaluated at fair value 356 0 356Other income 375 502 (127)Total Other Income 844 1,340 (496)
Losses on disposal of assets (5) (43) 38Writedowns of intangible fixed assets (103) 0 (103)Other expenses (890) (885) (5)Total Other Expenses (998) (928) (70)
Other income (expenses), net (154) 412 (566)
Other Income recorded in the first half of 2005 shows a year-on-year decrease of c496 thousand,again principally due to the aforementioned capital gain made in 2004. The item Gains from financial instruments evaluated at fair value includes the income arising fromthe fair value measurement of the hedges taken out to protect against changes in cash flowsexpected from foreign currency sale transactions (US dollars and Japanese yen). These hedges arerecognized according to the cash flow hedge model.
The comparative figures relating to last period do not include the effect of IAS 32 Financialinstruments: Disclosure and presentation and IAS 39 Financial instruments: Recognition andmeasurement, after defining January 1, 2005 as the transition date for their application. If IAS 32 andIAS 39 had been applied for the period under comparison, the value of these financial componentswould have been determined by reference to the effect of the hedges existing at the end of the firsthalf of 2004.
The costs included in the item Other Expenses are overall in line with the last period. During the firsthalf of 2005, intangible assets were written down by the Japanese subsidiary in the amount ofapproximately c100 thousand.
7. Interest and other financial income, net
This item shows a total year-on-year increase of c165 thousand, which is mainly due to the higherinterest income on bank deposits resulting from a higher average level of cash and cashequivalents in the six months than in the previous period and lower interest expense as a resultof reduced bank borrowing.
1st Half 1st Half Difference2005 2004
Bank interest, net 739 531 208Other financial income (expenses) (118) (75) (43)Interest and other financial income, net 621 456 165

38
8. Foreign exchange gains (losses), net
This item shows a total year-on-year increase of c778 thousand and is broken down as follows:
1st Half 1st Half Difference2005 2004
Foreign exchange gains 1,543 1,170 373Foreign exchange losses (697) (1,102) 405Total 846 68 778
The change reflects the trend of exchange rates during 2005 compared with the correspondingperiod in 2004.
9. Income taxes
This item shows a total year-on-year decrease of c159 thousand.
1st Half 1st Half Difference2005 2004
Current income taxes 3,974 4,915 (941)Deferred taxes 2,153 1,371 782Total 6,127 6,286 (159)
This item includes current taxes and provisions for deferred taxes which include, inter alia,the tax effect of consolidation adjustments.
The breakdown shows a reduction in current taxes from c4,915 thousand in the first half of2004 to c3,974 thousand in the first half of 2005. This reduction is due to lower taxableincome for the Group's companies. The item also includes positive adjustments made inrelation to current taxes in the previous year totaling c346 thousand.
The net amount of deferred taxes developed from a negative balance of c1,371 thousand inthe first half of 2004 to a negative balance of c2,153 thousand in the first half of 2005. Thechange is mainly due to the utilization by the parent company Saes Getters S.p.A. of deferredtax assets due to previous write down of investments in share capital, in addition to theeffect of the provisions for the taxes owed, if any, in the event of the distribution of theaccumulated profits of the subsidiaries as at June 30, 2005.
Income taxes increased from 38.4% of pre-tax profits in the first half of 2004 to 43.3% inthe period ended June 30, 2005, mainly as a result of the greater impact of the provisionsfor the taxes owed, if any, in the event of the distribution of the accumulated profits andreserves of the subsidiaries as at June 30, 2005, partially offset by the different contributionof the profit making companies located in countries with different taxation and through theeffect of the aforementioned tax adjustments.
The differential between the theoretical tax liability on the basis of the tax rates applied inItaly for IRES (33%) and IRAP (4.25%) and the actual consolidated tax liability for the first half

39
of 2005 (43.3%) is mainly due to the effect of the aforementioned provisions for taxes owed,if any, in the event of the distribution of the accumulated profits and reserves of thesubsidiaries and to the adjustments to the dividends as a result of their effect on theconsolidated pre-tax income. These effects are partially offset by the impact of the varioustax rates applicable to the Group's individual companies.
It should be noted that, with effect from May 12, 2005, the parent company Saes GettersS.p.A. and the subsidiary Saes Advanced Technologies S.p.A. signed an agreement for taxconsolidation with S.G.G. Holding S.p.A., the company that controls Saes Getters S.p.A.,thus exercising the group taxation option offered in Article 117 of the Income Tax Act (TUIR),with the effects set out in Article 118 of the same Act.
10. Earnings per share
The earnings per share ratio was calculated by dividing the period income of the Saes GettersGroup by the average outstanding number of shares in issue in the first six months of 2005.
Earnings per share 1st Half 2005 1st Half 2004
Number of ordinary shares : 15,271,350 13,874,930Number of savings shares : 7,460,619 9,625,070Total number of shares : 22,731,969 23,500,000
Average number of ordinary treasury shares : 302,028 191,128Average number of savings treasury shares : 3,757 173,306Average number of treasury shares : 305,785 364,434
Average number of outstanding ordinary shares : 14,969,322 13,683,802Average number of outstanding savings shares : 7,456,862 9,451,764Average number of outstanding shares : 22,426,184 23,135,566
Earnings attributable to ordinary shares : 5,265 5,961Earnings attributable to savings shares : 2,743 4,117Earnings attributable to shareholders (s/000) : 8,008 10,078
Earnings per share (s) :- ordinary shares 0.3517 0.4356 - savings shares 0.3678 0.4356

Information Displays Industrial Applications Not allocated Total
1st Half 1st Half 1st Half 1st Half 1st Half 1st Half 1st Half 1st Half2005 2004 2005 2004 2005 2004 2005 2004
Total Net Sales 39,666 42,663 26,493 30,184 288 - 66,447 72,847 Gross Profit (Loss) 24,900 25,975 10,071 10,878 (292) (257) 34,679 36,596
% on net sales 62.8% 60.9% 38.0% 36.0% -101.4% n.a. 52.2% 50.2%
Total operating expenses (8,019) (7,115) (8,742) (10,825) (5,096) (3,228) (21,857) (21,168)
Other income (expenses), net 222 (362) (372) 774 (4) - (154) 412
Operating Income (Loss) 17,103 18,498 957 827 (5,392) (3,485) 12,668 15,840
% on net sales 43.1% 43.4% 3.6% 2.7% -1872.2% n.a. 19.1% 21.7%Interest and other financial income, net 621 456
Foreign exchange gains(losses), net 846 68
Income before taxes 14,135 16,364
Income taxes (6,127) (6,286)
Net Income 8,008 10,078
The main balance sheet figures relating to the primary business segments are as follows:
11. Segment information
The income statement and balance sheet values shown in the following analytical statements aredescribed for primary business segments in accordance with IAS 14.There are two primary business segments identified on the basis of the products developed andsold: Information Displays and Industrial Applications. The column "Not allocated" includescorporate income statement and balance sheet values and income statement and balance sheetvalues relating to research and development projects undertaken to achieve diversification in thearea of advanced materials, as well as any other income statement and balance sheet values thatcannot be allocated to primary segments. The presentation shown reflects the Group'sorganizational structure and the internal reporting structure. The main income statement figures relating to the primary business segments identified are asfollows:
40
Information Displays Industrial Applications Not allocated Total
June 30, December 31, June 30, December 31, June 30, December 31, June 30, December 31,2005 2004 2005 2004 2005 2004 2005 2004
Non current assets 32,810 32,525 22,175 22,080 17,967 18,813 72,952 73,418
Current assets 26,810 24,928 21,764 22,429 82,029 94,903 130,603 142,260
Total assets 59,620 57,453 43,939 44,509 99,996 113,716 203,555 215,678
Non current liabilities 5,232 5,147 4,825 4,111 7,431 7,235 17,488 16,493
Current liabilities 11,413 10,270 8,616 8,796 9,861 10,869 29,890 29,935
Total liabilities 16,645 15,417 13,441 12,907 17,292 18,104 47,378 46,428
Other segment information
Capital expenditure 2,375 3,885 1,136 2,331 846 2,419 4,357 8,635 Depreciation and Amortization 2,762 5,598 1,957 4,920 1,018 1,594 5,737 12,112 Non-cash expenses otherthan Depreciation and Amortization 510 1,559 777 2,522 86 197 1,373 4,278

41
The following table shows an analysis of net sales by geographical location of customers:
Revenues by geographical 1st Half 1st Half Differencelocation of customers 2005 2004
Italy 371 696 (325)Other EU and Europe 10,163 11,291 (1,128)North America 11,551 12,789 (1,238)Japan 17,839 17,098 741Asia (excl. Japan) 25,231 29,563 (4,332)Other 1,292 1,410 (118)Total Net Sales 66,447 72,847 (6,400)
This shows, in particular, a drop in net sales in Asian countries except for Japan which has had4.3% growth on the same period last year. The downturn in sales on the Asian market is mainlydue to weaker demand for getters on the traditional cathode ray tubes market, only partially offsetby the growth of demand for mercury dispensers used in cold cathode lamps (Flat Panel DisplaysBusiness Area). Sales were also down on the North American and European market, due, in part,to lower sales of getters for cathode ray tubes and, in part, to the disposal, in the first half of 2004,of the assets relating to gas impurity analyzers (previously Analytical Technologies Business Area)and of the assets relating to quality assurance and quality control services for the semiconductormarket (previously Facilities Technologies Business Area).
(1) Direct sales to unaffiliated customers comprise sales by Group companies from that geographical segment.(2) Inter-segment sales include sales to Group companies located in other geographical areas. Inter-segment sales are generally priced at
cost plus an appropriate mark-up for profit.(3) This refers to the operating income (loss) posted by Group companies belonging to the geographical area in question, net of
adjustments made for consolidation purposes in respect of transactions carried out between Group companies belonging to the samegeographical area.
(4) This refers to total assets as carried in the balance sheet of Group companies belonging to the geographical area in question, net ofadjustments made for consolidation purposes in respect of transactions carried out between Group companies belonging to the samegeographical area.
(5) This includes the total investments made by Group companies belonging to the segment, net of adjustments made for consolidationpurposes in respect of transactions carried out between Group companies belonging to the same geographical area.
(6) This refers to adjustments made for consolidation purposes in respect of transactions carried out between Group companies belongingto different geographical areas.
Geographical Areas
Europe United AsiaOther EU States Consolidated
June 30, 2005 Italy and Europe of America Japan Rest of Asia Adjustments (6)(6) ConsolidatoDirect sales (1) 13,530 34 15,466 22,006 15,411 0 66,447
Inter-segment sales (2) 23,708 737 780 382 640 (26,247) 0
Total sales 37,238 771 16,246 22,388 16,051 (26,247) 66,447
Operating income (loss) (3) 3,707 (482) 1,566 2,343 5,317 217 12,668
Total assets (4) 178,115 16,046 20,685 15,878 43,144 (70,313) 203,555
Capital expenditure (5) 3,948 2 150 0 257 0 4,357
June 30, 2004
Direct sales (1) 15,296 0 16,618 23,398 17,535 0 72,847
Inter-segment sales (2) 25,378 1,071 4,274 255 1,345 (32,324) 0
Total sales 40,674 1,071 20,892 23,653 18,880 (32,324) 72,847
Operating income (loss) (3) 6,454 20 2,011 2,767 4,769 (181) 15,840
Total assets (4) 176,197 39,156 26,399 15,097 45,669 (84,542) 217,976
Capital expenditure (5) 1,958 10 57 0 44 1 2,070

42
Non current assets
12. Property, plant and equipment, net
Total property, plant and equipment, less accumulated depreciation, was c60,726 thousand andc59,769 thousand as at June 30, 2005 and December 31, 2004 respectively. The changes are shown below:
Land Plant and Assets under Totaland buildings machinery construction
and advancesNet book valueBalance at December 31, 2004 27,340 29,507 2,922 59,769Additions 155 2,294 1,785 4,234Disposals (14) (14)Reclassifications 39 858 (897) 0Depreciation (597) (4,620) (5,217)Writedowns 0Conversion differences 1,024 907 23 1,954Balance at June 30, 2005 27,961 28,932 3,833 60,726
Balance at December 31, 2004Historical cost 38,055 98,450 2,922 139,427Accumulated depreciation (10,715) (68,943) 0 (79,658)Net book value 27,340 29,507 2,922 59,769
Balance at June 30, 2005Historical cost 39,967 103,142 3,833 146,942 Accumulated depreciation (12,006) (74,210) 0 (86,216)Net book value 27,961 28,932 3,833 60,726
The item Land and buildings and the item Plant and machinery include assets redeemed by theGroup's Italian companies at the end of finance leases with a net book value of c4,532 thousandand c142 thousand respectively as at June 30, 2005 (compared with c4,626 thousand and c207thousand respectively as at December 31, 2004). There are no finance leases currently inprogress.
The increases in the item Plant and machinery and in the item Assets under construction andadvances are mainly due to the investments made by the Group's Italian companies to purchasespecial machinery and equipment for the building of new production lines and for improving anddeveloping those already existing.
With regard to the assets belonging to the Group's Italian companies previously affected by theapplication of specific monetary revaluation laws, the Group decided to exercise the exemptionallowed under IFRS 1 First-time Adoption of International Financial Reporting Standards in relationto the possibility of the selective adoption of fair value on the date of transition to IFRS. Therefore,these assets are measured on the basis of the deemed cost, which is the restated amount at thetime of making these revaluations. The net carrying amount of the revaluations made, net of theamortized portion, on the transition date was c137 thousand and c963 thousand for the assets inthe category of Land and buildings and in the category of Plant and machinery respectively.
43
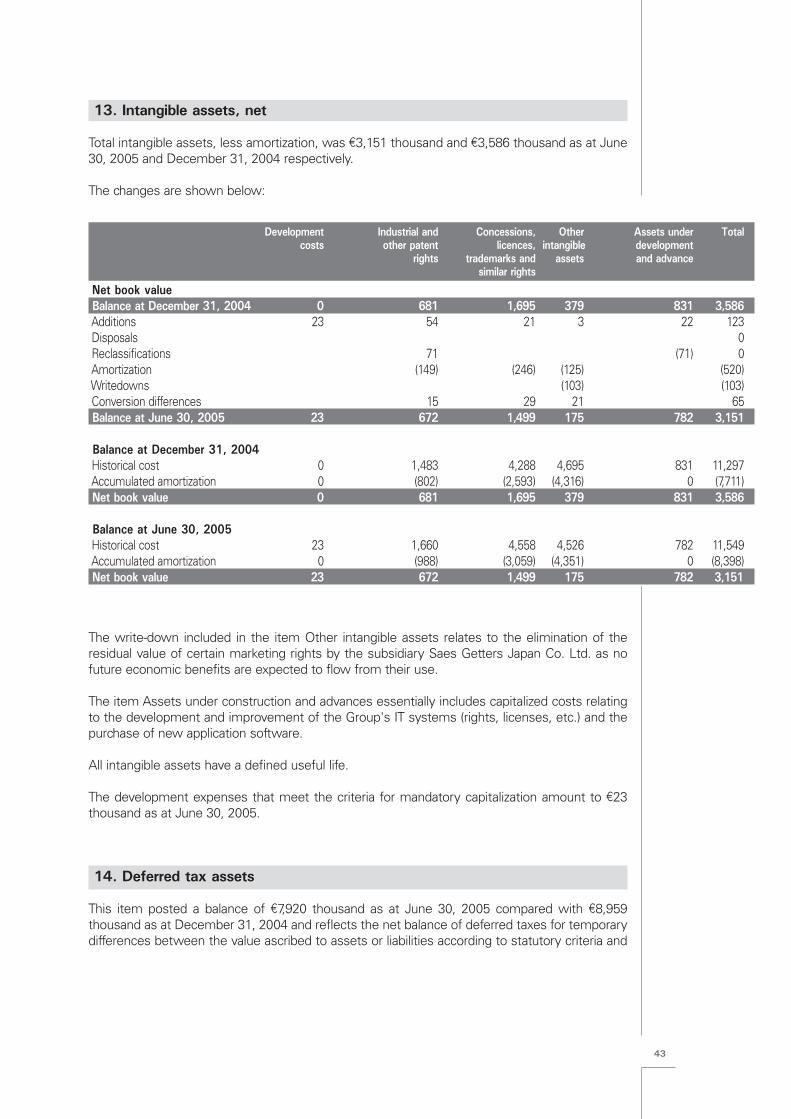
13. Intangible assets, net
Total intangible assets, less amortization, was c3,151 thousand and c3,586 thousand as at June30, 2005 and December 31, 2004 respectively.
The changes are shown below:
The write-down included in the item Other intangible assets relates to the elimination of theresidual value of certain marketing rights by the subsidiary Saes Getters Japan Co. Ltd. as nofuture economic benefits are expected to flow from their use.
The item Assets under construction and advances essentially includes capitalized costs relatingto the development and improvement of the Group's IT systems (rights, licenses, etc.) and thepurchase of new application software.
All intangible assets have a defined useful life.
The development expenses that meet the criteria for mandatory capitalization amount to c23thousand as at June 30, 2005.
14. Deferred tax assets
This item posted a balance of c7,920 thousand as at June 30, 2005 compared with c8,959thousand as at December 31, 2004 and reflects the net balance of deferred taxes for temporarydifferences between the value ascribed to assets or liabilities according to statutory criteria and
Development Industrial and Concessions, Other Assets under Totalcosts other patent licences, intangible development
rights trademarks and assets and advancesimilar rights
Net book valueBalance at December 31, 2004 0 681 1,695 379 831 3,586Additions 23 54 21 3 22 123Disposals 0Reclassifications 71 (71) 0Amortization (149) (246) (125) (520)Writedowns (103) (103)Conversion differences 15 29 21 65Balance at June 30, 2005 23 672 1,499 175 782 3,151
Balance at December 31, 2004Historical cost 0 1,483 4,288 4,695 831 11,297Accumulated amortization 0 (802) (2,593) (4,316) 0 (7,711)Net book value 0 681 1,695 379 831 3,586
Balance at June 30, 2005Historical cost 23 1,660 4,558 4,526 782 11,549Accumulated amortization 0 (988) (3,059) (4,351) 0 (8,398)Net book value 23 672 1,499 175 782 3,151

44
the value ascribed for tax purposes, as well as the effect of tax losses that may be carried forwardand consolidation adjustments.The item includes the deferred tax effect (positive effect of c185 thousand) associated with therecognition of a special reserve (negative balance as at June 30, 2005) in the shareholders' equityfollowing the application of the cash flow hedge model to hedges against changes in cash flowsarising from highly probable future transactions.
Tax losses that may be used to reduce the future taxable income of the Group's companies thatgenerated them amounted to c48,927 thousand (of which c30,975 thousand can be carriedforward without time limit) as at June 30, 2005. The potential deferred tax assets (c13,827thousand as at June 30, 2005) are not recognized in view of the uncertainties about theirrecoverability.
15. Other long term assets
These are broken down as follows:
June 30, 2005 December 31, 2004 DifferenceGuarantee deposits 559 531 28Other 596 573 23Total 1,155 1,104 51
The item Other mainly consists of investments made by the US subsidiaries in relation to theagreements for supplementary pension allowances agreed locally with employees.
Current assets
16. Inventory
The item in question is broken down as follows:
June 30, 2005 December 31, 2004 DifferenceRaw materials, auxiliary materials and spare parts 4,186 4,313 (127)Work in progress and semi-finished goods 3,687 3,330 357Finished products and goods 8,635 8,093 542Total 16,508 15,736 772
Inventory values are expressed net of the inventory allowance (c3,556 thousand as at June30, 2005 compared with c3,790 thousand as at December 31, 2004) in order to bring theseinto line with their estimated realizable value.During the period, inventory write downs of c158 thousand were charged to the incomestatement.
The overall increase in inventory compared with December 31, 2004 is essentially due tocontingent production plans and to the effect of translation gains resulting from the trend ofthe euro against the major foreign currencies.
The item Work in progress and semi-finished goods includes the measurement according tothe percentage of completion method for construction contracts undertaken by the parent

45
company, whose accrued margin amounted to c10 thousand as at June 30, 2005 comparedwith c252 thousand as at December 31, 2004.
17. Trade receivables
As at June 30, 2005, the item in question is broken down as follows:
Gross value Bad debt provision Net value Net value DifferenceJune 30, June 30, June 30, December 31,
2005 2005 2005 2004Trade receivables 30,833 (714) 30,119 28,581 1,538
Trade receivables (all due within one year) relate to ordinary sales transactions.
The bad debt provision shown above reflects an adjustment made to bring the value ofreceivables in line with their estimated realizable value.
The net increase in trade receivables since December 31, 2004 is primarily due to the positiveeffect of the translation gains arising from the conversion of financial statements expressed ina foreign currency resulting from the trend of the euro against the main currencies and to thehigh level of net sales achieved in the month of June.
18. Prepaid expenses, accrued income and other
This item, which includes current non-trade receivables from third parties, along withprepaid expenses and accrued income, showed a balance of c8,342 thousand as at June 30,2005 compared with c7,926 thousand as at December 31, 2004.
The balances are broken down as follows:
June 30, 2005 December 31, 2004 DifferenceIncome taxes receivable 60 734 (674)VAT receivables 2,946 4,203 (1,257)Other tax receivables 71 53 18Social security receivables 104 93 11Personnel 219 170 49Short-term guarantee deposits 9 80 (71)Parent company receivables for consolidated taxation 3,238 0 3,238Other 989 1,681 (692)Total other receivables 7,636 7,014 622
Interest receivable 0 10 (10)Other accrued income 43 137 (94)Total accrued income 43 147 (104)
Rents payable 15 18 (3)Insurance premiums 77 296 (219)Other 571 451 120Total prepaid expenses 663 765 (102)Total prepaid expenses, accrued income and other 8,342 7,926 416

46
The item Income taxes receivables as at December 31, 2004 related primarily to amountsreceivable for corporation tax (IRES) and amounts paid in advance, carried mainly in theaccounts of the parent company. The lower balance as at June 30, 2005 compared toDecember 31, 2004 is due to the use of these receivables for the taxes owed (IRES) inrelation to the taxable income produced by the Italian companies in the first half of 2005.
The item Parent company receivables for consolidated taxation included the amountreceivable as a result of the Group's Italian companies subscribing to the national taxconsolidation with the parent company S.G.G. Holding S.p.A.
The item Other, which falls under the category of other receivables, included the amountsreceivable as public grants accrued as at June 30, 2005 by the parent company (c487thousand compared with c1,138 thousand as at December 31, 2004) principally in terms ofgrants for operating expenses for research projects in progress, and the residual receivablesclaimed by the subsidiary Saes Advanced Technologies S.p.A. from the Ministry of Treasury,Budget and Economic Planning (c276 thousand, unchanged since December 31, 2004) forthe incentives outlined in the "Territorial Agreement for the Marsica Area". The decrease sinceDecember 31, 2004 is mainly due to the collection of part of these receivables in respect ofpublic grants by the parent company.
19. Investments in share capital and other financial assets
As at December 31, 2004, this item included the book value of treasury shares in the amountof c2,505 thousand, reclassified as a negative amount in shareholders' equity by changingthe opening balances as a result of January 1, 2005 being defined as the transition date forthe application of IAS 32 (Financial instruments: Disclosure and presentation) and IAS 39(Financial instruments: Recognition and measurement). The comparative figures relating tolast year do not therefore include the effect of the aforementioned standards. If IAS 32 andIAS 39 had been applied for the period under comparison, the reclassification of the bookvalue of treasury shares as a negative amount in shareholders' equity would have beenbased on the values existing as at December 31, 2004.In accordance with the resolution adopted pursuant to Articles 2357 and 2357ter of the CivilCode, during the year the parent company sold and bought treasury shares as shown in thefollowing table:
Book valuesOrdinary shares Number of shares Unit values (euro) Total values (thousands of euro)Balances at December 31, 2004 191,128 8.36 1,598 AdditionsDisposalsConversion 110,900 8.11 899 Balances at June 30, 2005 302,028 8.27 2,497
Book valuesSavings shares Number of shares Unit values (euro) Total values (thousands of euro)Balances at December 31, 2004 173,306 5.23 907 Additions 10,013 12.10 121Disposals (1,411) 5.23 (8)Conversion (171,895) 5.23 (899)Balances at June 30, 2005 10,013 12.10 121
Total treasury shares 2,618 Balances at June 30, 2005 10,01otale azioni proprie
As a result of the voluntary conversion of savings shares into ordinary shares, which tookplace in January 2005, the parent company submitted for conversion 171,895 savingstreasury shares remaining after the sale of 1,392 shares in order to allow shareholders tohold entire multiples for conversion, and sold the remaining 19 shares on the market. The

47
conversion ratio was 20 ordinary shares for every 31 savings shares.
SAES Getters ordinary shares held in the company's portfolio as at June 30, 2005 had a parbook value of c162 thousand and represented 1.33% of the capital stock (1.98% of ordinaryshares).SAES Getters savings shares held in the company's portfolio as at June 30, 2005 had a parbook value of c5 thousand and represented 0.04% of the capital stock (0.13% of savingsshares).
20. Cash and cash equivalents
The balances are broken down as follows:
June 30, 2005 December 31, 2004 DifferenceBank deposits 75,563 87,480 (11,917)Cash on hand 32 31 1Total 75,595 87,511 (11,916)
The decrease in the item Bank deposits since December 31, 2004 is mainly due to thegreater outlays for payment of dividends, partially offset by the cash generated by day-to-daybusiness.
The item Bank deposits mainly consists of short-term deposits held by the parent companyand by the subsidiary Saes Getters International Luxembourg S.A. at leading creditinstitutions.
The item Bank deposits includes time deposits made by the parent company in the amountof c58,000 thousand, all maturing within the first fifteen days of July 2005.
The cash and cash equivalents held by the Group as at June 30, 2005 were mainlyexpressed in euro.
Shareholders equity
21. Shareholders’ equity
As at June 30, 2005, shareholders' equity amounted to c156,177 thousand, down byc13,073 thousand on December 31, 2004. The changes that occurred during the period aredescribed in the statement of changes in shareholders' equity.
The consolidated financial statements include provisions for any taxes owed in the event ofthe distribution of the profits accumulated in previous years by the subsidiaries, excludingthose associated with taxable temporary differences which are not expected to be settledin the foreseeable future in the form of a dividend distribution.
48
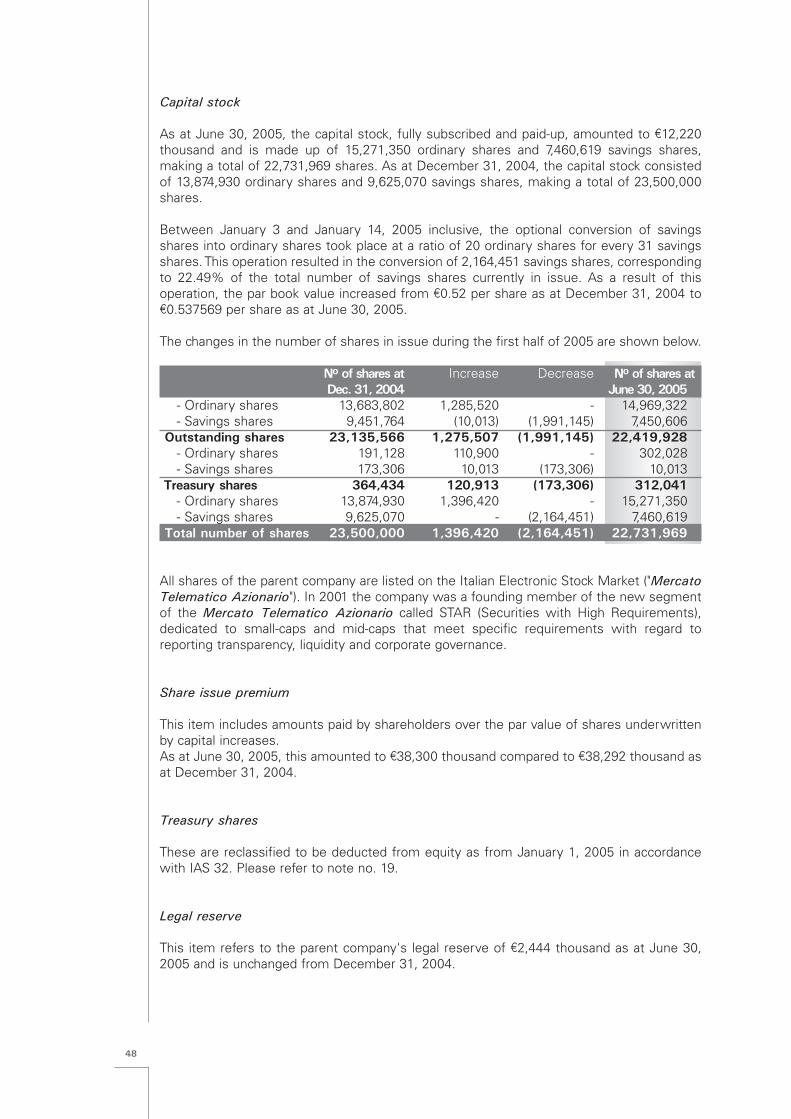
Capital stock
As at June 30, 2005, the capital stock, fully subscribed and paid-up, amounted to c12,220thousand and is made up of 15,271,350 ordinary shares and 7,460,619 savings shares,making a total of 22,731,969 shares. As at December 31, 2004, the capital stock consistedof 13,874,930 ordinary shares and 9,625,070 savings shares, making a total of 23,500,000shares.
Between January 3 and January 14, 2005 inclusive, the optional conversion of savingsshares into ordinary shares took place at a ratio of 20 ordinary shares for every 31 savingsshares. This operation resulted in the conversion of 2,164,451 savings shares, correspondingto 22.49% of the total number of savings shares currently in issue. As a result of thisoperation, the par book value increased from c0.52 per share as at December 31, 2004 toc0.537569 per share as at June 30, 2005.
The changes in the number of shares in issue during the first half of 2005 are shown below.
No of shares at Increase Decrease No of shares atDec. 31, 2004 June 30, 2005
- Ordinary shares 13,683,802 1,285,520 - 14,969,322- Savings shares 9,451,764 (10,013) (1,991,145) 7,450,606
Outstanding shares 23,135,566 1,275,507 (1,991,145) 22,419,928- Ordinary shares 191,128 110,900 - 302,028- Savings shares 173,306 10,013 (173,306) 10,013
Treasury shares 364,434 120,913 (173,306) 312,041- Ordinary shares 13,874,930 1,396,420 - 15,271,350- Savings shares 9,625,070 - (2,164,451) 7,460,619
Total number of shares 23,500,000 1,396,420 (2,164,451) 22,731,969
All shares of the parent company are listed on the Italian Electronic Stock Market ("MercatoTelematico Azionario"). In 2001 the company was a founding member of the new segmentof the Mercato Telematico Azionario called STAR (Securities with High Requirements),dedicated to small-caps and mid-caps that meet specific requirements with regard toreporting transparency, liquidity and corporate governance.
Share issue premium
This item includes amounts paid by shareholders over the par value of shares underwrittenby capital increases.As at June 30, 2005, this amounted to c38,300 thousand compared to c38,292 thousand asat December 31, 2004.
Treasury shares
These are reclassified to be deducted from equity as from January 1, 2005 in accordancewith IAS 32. Please refer to note no. 19.
Legal reserve
This item refers to the parent company's legal reserve of c2,444 thousand as at June 30,2005 and is unchanged from December 31, 2004.

49
Sundry reserves, retained earnings and accumulated losses
This item includes:- the reserve for treasury shares, which showed a balance of c2,618 thousand as at June 30,
2005, equal to the book value of Saes Getters ordinary and savings shares at the end of theperiod;
- the cash flow hedge reserve (which has a negative balance of c414 thousand as at June30, 2005), generated by the fair value measurement of hedges taken out by the Group'sItalian companies to protect against changes in cash flows expected from foreign currencysale transactions (US dollars and Japanese yen), which are mainly inter-company in nature.Following the definition of January 1, 2005 as being the transition date for the applicationof IAS 32 and IAS 39 both relating to financial instruments, this reserve was set up in 2005by restating the opening balances for the year, according to the treatment prescribed by IAS8 in the case of a change in accounting policies. The comparative figures relating to last yeardo not include the effect of IAS 32 Financial instruments: Disclosure and presentationand IAS 39 Financial instruments: Recognition and measurement, after defining January1, 2005 as being the transition date for their application. If IAS 32 and IAS 39 had beenapplied for the period under comparison, the value of this reserve as at December 31, 2004would have been determined by reference to the effect of the hedges existing at the endof the previous year;
- the reserves (totaling c3,026 thousand) formed from the credit balances of monetaryrevaluation resulting from the application of Law 72 of March 19, 1983 (c574 thousand), Law413 of December 30, 1991 (c762 thousand) and Law 342 of November 21, 2000 (c1,690thousand) by the Group's Italian Companies. The revaluation reserves, pursuant to Law413/1991 and Law 342/2000, are shown net of substitute tax amounting to c166 thousandand c397 thousand respectively. Please refer to note no. 12 for further details;
- the reserve for purchase of treasury shares that has been decided but not yet utilized,totaling c10,379 thousand as at June 30, 2005, compared with c10,500 thousand as atDecember 31, 2004;
- the other reserves of subsidiaries, retained earnings, other equity items related to theGroup's companies not eliminated as part of the consolidation process and the exchangegains or losses arising from the conversion of financial statements expressed in foreigncurrencies. The translation reserve had a positive balance of c3,163 thousand as at June 30,2005, an increase of c4,425 thousand on the negative balance of c1,262 thousand recordedas the end of last year. This variation is due to the overall impact on consolidatedshareholders' equity caused by converting the financial statements of foreign subsidiariesexpressed in foreign currencies into euro, as well as by the respective consolidationadjustments.
The Group exercised the exemption allowed under IFRS 1 First-time Adoption ofInternational Financial Reporting Standards regarding the possibility of resetting to zero theaccumulated gains or losses generated by the consolidation of foreign subsidiaries as atJanuary 1, 2004 and therefore the translation reserve only includes the translation gains orlosses generated after the date of transition to IFRS.
The following table shows the income and expenses recognized directly in the shareholders'equity in the first half of 2005:
Gain on sale of treasury shares 9Cash flow hedge reserve movements (1,511)Exchange rate differences from conversion of financial statements denominated in foreign currency 4,425Total income (expenses) recognised directly in the equity 2,923
The reconciliation between the net income and shareholders' equity of Saes Getters S.p.A.and the consolidated net income and consolidated shareholders' equity as at June 30, 2005
50
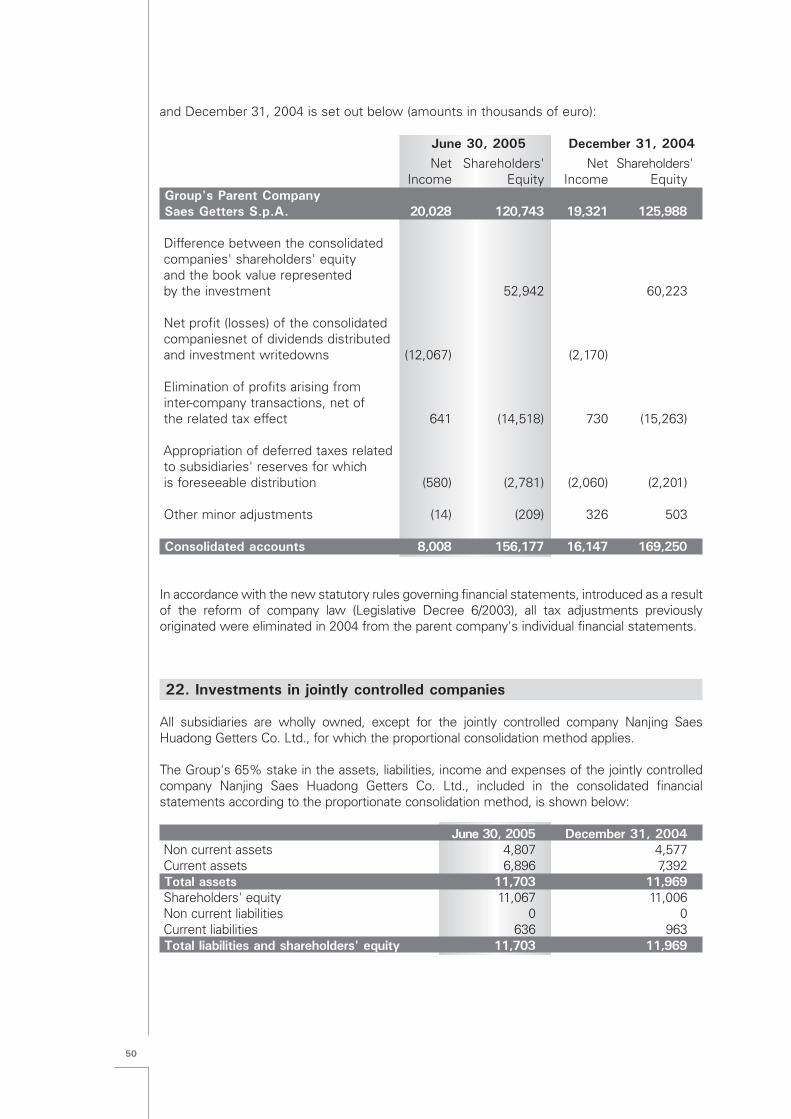
and December 31, 2004 is set out below (amounts in thousands of euro):
June 30, 2005 December 31, 2004Net Shareholders' Net Shareholders'
Income Equity Income EquityGroup's Parent Company Saes Getters S.p.A. 20,028 120,743 19,321 125,988
Difference between the consolidated companies' shareholders' equity and the book value represented by the investment 52,942 60,223
Net profit (losses) of the consolidated companiesnet of dividends distributed and investment writedowns (12,067) (2,170)
Elimination of profits arising from inter-company transactions, net of the related tax effect 641 (14,518) 730 (15,263)
Appropriation of deferred taxes related to subsidiaries' reserves for which is foreseeable distribution (580) (2,781) (2,060) (2,201)
Other minor adjustments (14) (209) 326 503
Consolidated accounts 8,008 156,177 16,147 169,250
In accordance with the new statutory rules governing financial statements, introduced as a resultof the reform of company law (Legislative Decree 6/2003), all tax adjustments previouslyoriginated were eliminated in 2004 from the parent company's individual financial statements.
22. Investments in jointly controlled companies
All subsidiaries are wholly owned, except for the jointly controlled company Nanjing SaesHuadong Getters Co. Ltd., for which the proportional consolidation method applies.
The Group's 65% stake in the assets, liabilities, income and expenses of the jointly controlledcompany Nanjing Saes Huadong Getters Co. Ltd., included in the consolidated financialstatements according to the proportionate consolidation method, is shown below:
June 30, 2005 December 31, 2004Non current assets 4,807 4,577Current assets 6,896 7,392Total assets 11,703 11,969Shareholders' equity 11,067 11,006Non current liabilities 0 0Current liabilities 636 963Total liabilities and shareholders' equity 11,703 11,969

51
June 30, 2005 June 30, 2004Net sales 2,696 3,489Cost of sales (1,598) (1,716)Operating expenses (377) (376)Other income (expenses), net 2 1Non operating income (expenses) net 12 9Income before taxes 735 1,407Income taxes (96) (109)Net income 639 1,298
Non current liabilities
23. Non current financial liabilities
This item consists of subsidized credits from the special applied research fund granted to theparent company by the Ministry of Productive Activities through the bank SanPaolo IMI.
The maturities of the loans are shown below:
June 30, 2005 December 31, 2004 DifferenceLess than 1 year 254 255 (1)Between 1 and 5 years 2,475 2,352 123Over 5 years 1,089 1,339 (250)Total 3,818 3,946 (128)
The average rate on June 30, 2005 was 1.20%.
24. Deferred tax liabilities
This item consists of the provision for deferred taxes owed in the event of the distribution of theprofits and reserves of the subsidiaries, excluding those relating to profits and reserves that arenot considered likely to be distributed in the foreseeable future.
The increase since December 31, 2004 was due to the higher profits accumulated by thesubsidiaries as a consequence of the results of the period, partially offset by their use in respectof taxes and withholdings recorded upon receipt of the dividends collected during 2005 by theparent company and by Saes Getters International Luxembourg S.A.
25. Staff leaving indemnity and similar obligations
It should be noted that this item includes liabilities to employees under both definedcontribution and defined benefits plans existing in certain Group companies in accordance withthe contractual and legal obligations existing in Italy, Japan and Korea.
52
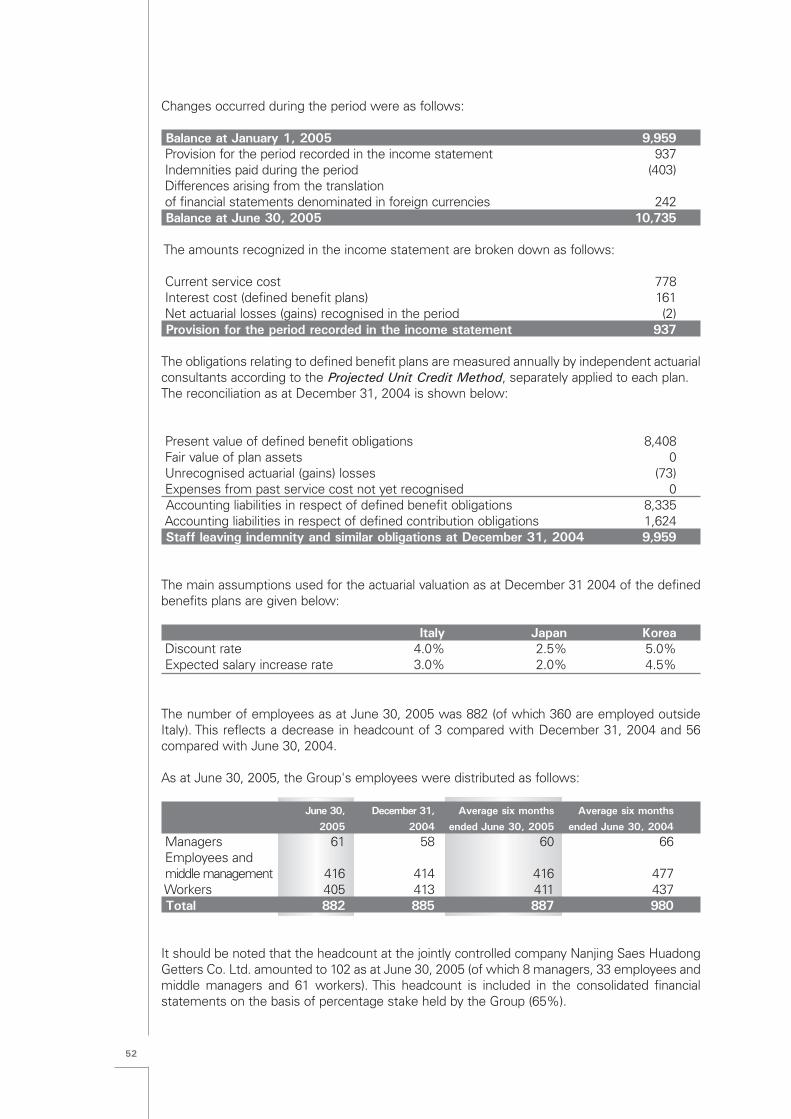
Changes occurred during the period were as follows:
Balance at January 1, 2005 9,959Provision for the period recorded in the income statement 937Indemnities paid during the period (403)Differences arising from the translation of financial statements denominated in foreign currencies 242Balance at June 30, 2005 10,735
The amounts recognized in the income statement are broken down as follows:
Current service cost 778Interest cost (defined benefit plans) 161Net actuarial losses (gains) recognised in the period (2)Provision for the period recorded in the income statement 937
The obligations relating to defined benefit plans are measured annually by independent actuarialconsultants according to the Projected Unit Credit Method, separately applied to each plan. The reconciliation as at December 31, 2004 is shown below:
Present value of defined benefit obligations 8,408Fair value of plan assets 0Unrecognised actuarial (gains) losses (73)Expenses from past service cost not yet recognised 0Accounting liabilities in respect of defined benefit obligations 8,335Accounting liabilities in respect of defined contribution obligations 1,624Staff leaving indemnity and similar obligations at December 31, 2004 9,959
The main assumptions used for the actuarial valuation as at December 31 2004 of the definedbenefits plans are given below:
Italy Japan KoreaDiscount rate 4.0% 2.5% 5.0%Expected salary increase rate 3.0% 2.0% 4.5%
The number of employees as at June 30, 2005 was 882 (of which 360 are employed outsideItaly). This reflects a decrease in headcount of 3 compared with December 31, 2004 and 56compared with June 30, 2004.
As at June 30, 2005, the Group's employees were distributed as follows:
June 30, December 31, Average six months Average six months2005 2004 ended June 30, 2005 ended June 30, 2004
Managers 61 58 60 66Employees andmiddle management 416 414 416 477Workers 405 413 411 437Total 882 885 887 980
It should be noted that the headcount at the jointly controlled company Nanjing Saes HuadongGetters Co. Ltd. amounted to 102 as at June 30, 2005 (of which 8 managers, 33 employees andmiddle managers and 61 workers). This headcount is included in the consolidated financialstatements on the basis of percentage stake held by the Group (65%).

53
26. Provisions
The composition of these provisions and the related changes are set out below:
January 1, Provisions Uses Conversion June 30, 2005 differences 2005
Provision for warranty on products sold 185 77 (32) 26 256Provision for penalties 80 11 91Other provisions 817 (793) 29 53Total 1,082 77 (825) 66 400
The decrease in the item Other provisions was mainly due to the use of the provision (totalingc443 thousand as at December 31, 2004 and c21 thousand as at June 30, 2005 respectively)set aside for the liabilities expected in the liquidation of the residual assets of the indirectlycontrolled subsidiary New Trace Analytical, Inc. (formerly Molecular Analytics, Inc.).
The table below distinguishes between provisions included amongst current and non-currentliabilities:
June 30, 2005 December 31, 2004 DifferenceCurrent provisions 114 867 (753)Non current provisions 286 215 71Total 400 1,082 (682)
Current liabilities
27. Trade payables
These amounted to c9,661 thousand for the period ended June 30, 2005, down by c242thousand compared with December 31, 2004.
There are no trade payables represented by bills. All trade payables fall due within one year andarise from commercial transactions.
28. Other payables
The item Other payables included amounts that are not strictly of trade nature and amountedto c10,063 as at June 30, 2005 compared with c10,428 thousand as at December 31, 2004.
These may be broken down as follows:
June 30, 2005 December 31, 2004 DifferencePayables to employee (holidays, wages and staff leaving) 4,947 4,412 535Insurance premiums payable 50 72 (22)Social security payables 1,757 1,886 (129)Tax payables (excluding income taxes) 1,029 2,124 (1,095)Other 2,280 1,934 346Total 10,063 10,428 (365)
54
The item Payables to employees includes accruals made during the year for holidays, extramonthly wages and, for Italian companies, wages and salaries for the month of June.
The increase in the item Payables to employees as at June 30, 2005 compared with the end oflast year is mainly due to the recognition of the accrued quota of the extra monthly salaries bythe Group's Italian companies and to the higher amount of provisions for holidays, partially offsetby the settlement of the amounts payable in respect of staff leaving indemnity by the parentcompany.
The item Social security payables mainly consists of amounts payable by the Group's Italiancompanies to the INPS (Italian social security system) as employer's contributions.
The item Tax payables (excluding income taxes) as at December 31, 2004 included theappropriation (of c745 thousand) for withholding taxes on the dividends distributed in December2004 by the subsidiary Saes Getters Korea Corporation. These withholding taxes were paidduring the first half of 2005.
These payables are all due within one year.
29. Accrued income taxes
As at June 30, 2005, this item amounted to c4,239 thousand, down by c1,328 thousand on thefigure for the end of last year.
The balance is expressed net of income tax advances of c1,628 thousand, paid by the subsidiarySaes Advanced Technologies S.p.A. to the parent company S.G.G. Holding S.p.A. as part of thesubscription to the national tax consolidation system.
Tax payables are all payable within one year.
30. Derivative financial instruments evaluated at fair value (cash flow hedge)
This item includes the liabilities arising from the fair value measurement of hedges againstchanges in cash flows originated by future foreign exchange sale transactions, which are mainlyinter-company in nature, expected during the current and following year. These hedges arerecognized according to the cash flow hedge model.
The comparative figures relating to last year do not include the effect of IAS 32 Financialinstruments: Disclosure and presentation and IAS 39 Financial instruments: Recognition andmeasurement, after defining January 1, 2005 as being the transition date for their application. IfIAS 32 and IAS 39 had been applied for the period under comparison, the value of thereceivables or payables as at December 31, 2004 arising from the fair value measurement ofhedges to protect from changes in cash flows originated by future foreign exchange saletransactions existing at the end of last year would have been determined. .
31. Bank overdraft
This item consists of liabilities arising from overdrafts on transfer accounts held with banks. The lower amount compared with December 31, 2004 is mainly due to the repayment offinancial payables by the US subsidiaries FST Consulting International, Inc. and Saes Pure Gas,

55
Inc., partially offset by the greater level of bank borrowing by the Japanese subsidiary and bythe depreciation of the euro against the major foreign currencies.
Bank overdraft was expressed in US dollars and Japanese yen.
32. Accrued liabilities
These can be broken down as follows:
June 30, 2005 December 31, 2004 DifferenceAccrued expenses:- Interest payables 1 3 (2)- Other accrued expenses 692 497 195 Total accrued expenses 693 500 193Deferred income 1,750 1,960 (210)Total accrued expenses and deferred income 2,443 2,460 (17)
The item Deferred income included the part relating to future years (c1,322 thousand) of thecapital grant allowed by the Ministry of the Treasury, Budget and Economic Planning to SaesAdvanced Technologies S.p.A. in relation to investments made in previous years. The decrease in this item since December 31, 2004 was due to the reduction in the abovedeferred income on grants in relation to the amount pertaining to the first half of 2005.
33. Fair value of financial assets and liabilities
As prescribed in IAS 32, a comparison is given between the value entered in the balance sheetas at June 30, 2005 and the fair value of financial assets and liabilities, as follows:
Book FairValue Value
Financial assetsOther long term assets 1,155 1,155Trade receivables 30,119 30,119Financial receivables 39 39Prepaid expenses, accrued income and other 8,342 8,342Cash and cash equivalents 75,595 75,595
Financial liabilitiesNon current financial liabilities 3,564 3,564Other payables (non current and current) 10,185 10,185Trade payables 9,661 9,661Derivative financial instruments evaluated at fair value (cash flow hedge) 602 602Bank overdraft 2,514 2,514Current portion of long term debt 254 254
56
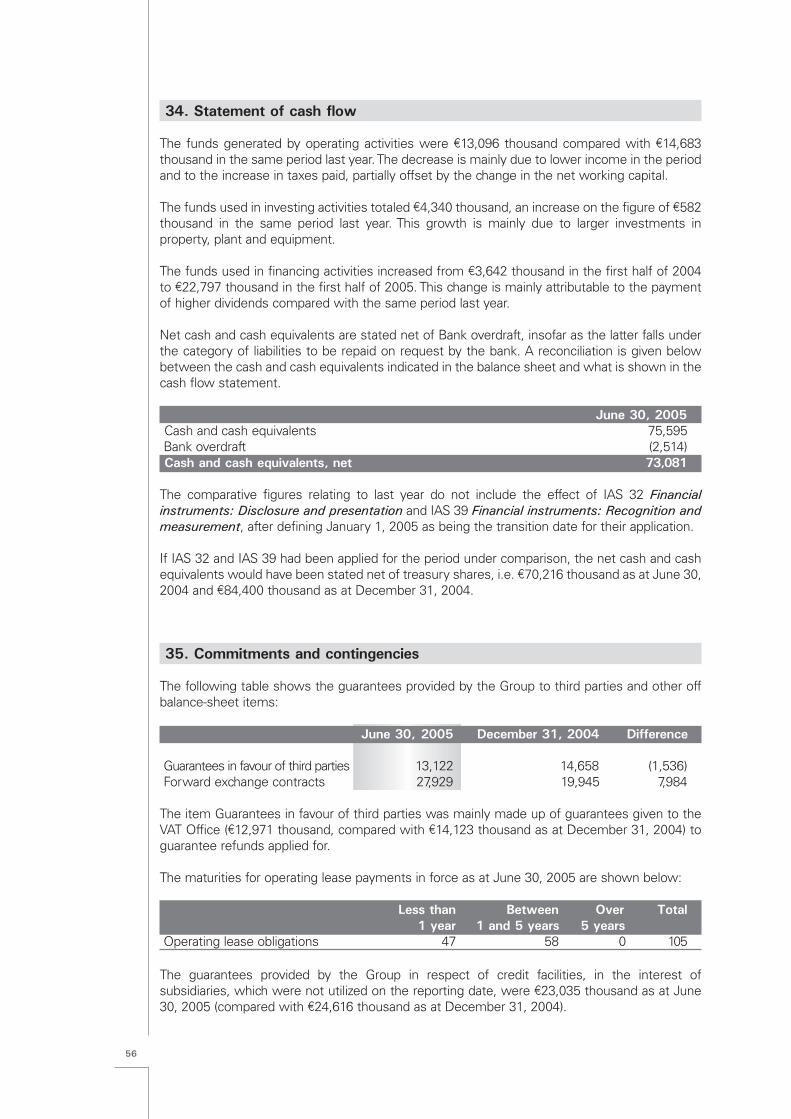
34. Statement of cash flow
The funds generated by operating activities were c13,096 thousand compared with c14,683thousand in the same period last year. The decrease is mainly due to lower income in the periodand to the increase in taxes paid, partially offset by the change in the net working capital.
The funds used in investing activities totaled c4,340 thousand, an increase on the figure of c582thousand in the same period last year. This growth is mainly due to larger investments inproperty, plant and equipment.
The funds used in financing activities increased from c3,642 thousand in the first half of 2004to c22,797 thousand in the first half of 2005. This change is mainly attributable to the paymentof higher dividends compared with the same period last year.
Net cash and cash equivalents are stated net of Bank overdraft, insofar as the latter falls underthe category of liabilities to be repaid on request by the bank. A reconciliation is given belowbetween the cash and cash equivalents indicated in the balance sheet and what is shown in thecash flow statement.
June 30, 2005Cash and cash equivalents 75,595 Bank overdraft (2,514)Cash and cash equivalents, net 73,081
The comparative figures relating to last year do not include the effect of IAS 32 Financialinstruments: Disclosure and presentation and IAS 39 Financial instruments: Recognition andmeasurement, after defining January 1, 2005 as being the transition date for their application.
If IAS 32 and IAS 39 had been applied for the period under comparison, the net cash and cashequivalents would have been stated net of treasury shares, i.e. c70,216 thousand as at June 30,2004 and c84,400 thousand as at December 31, 2004.
35. Commitments and contingencies
The following table shows the guarantees provided by the Group to third parties and other offbalance-sheet items:
June 30, 2005 December 31, 2004 Difference
Guarantees in favour of third parties 13,122 14,658 (1,536) Forward exchange contracts 27,929 19,945 7,984
The item Guarantees in favour of third parties was mainly made up of guarantees given to theVAT Office (c12,971 thousand, compared with c14,123 thousand as at December 31, 2004) toguarantee refunds applied for.
The maturities for operating lease payments in force as at June 30, 2005 are shown below:
Less than Between Over Total1 year 1 and 5 years 5 years
Operating lease obligations 47 58 0 105
The guarantees provided by the Group in respect of credit facilities, in the interest ofsubsidiaries, which were not utilized on the reporting date, were c23,035 thousand as at June30, 2005 (compared with c24,616 thousand as at December 31, 2004).
57
The item Forward exchange contracts included the counter-value of transactions performed tohedge against the risks of fluctuation in the exchange rates in effect on the balance-sheet date.These transactions, implemented by the parent company and by the subsidiary Saes AdvancedTechnologies S.p.A., consist of forward contracts on the US dollar and on the Japanese yen,associated with credits outstanding on the reporting date and with future credits, relating tosales in US dollars and Japanese yen. These contracts will extend to the 2005 and 2006 financialyear. As regards contracts on the US dollar, the spot exchange rate fixed with credit institutionsis 1.2329 to the euro and 1.2565 to the euro for transactions respectively implemented in theperiods 2005 and 2006. As regards contracts on the Japanese yen, the spot exchange rate fixedis 135.47 to the euro.
36. Related party disclosures
As regards transactions with Related Parties, consultancy services were provided in fiscal, legaland corporate matters by K Studio Associato for a total cost of c84 thousand in the first half of2005. The above relationship was entered into under economic and financial conditions in linewith market conditions.
Following the subscription to the national tax consolidation system by the Group's Italiancompanies with the parent company S.G.G. Holding S.p.A., Saes Getters S.p.A. and itssubsidiary Saes Advanced Technologies S.p.A. as at June 30, 2005 have receivables from S.G.G.Holding S.p.A. of c3,238 thousand and c1,628 thousand respectively.The above reveals that the directors have complied with the requirements laid down by Consobin its Communications of February 20, 1997, February 27, 1998, March 2, 1998 and September30, 2002.
37. Events after the balance sheet date and business performance outlook
On July 18, 2005, a preliminary contract was signed to acquire a 30% investment in thecompany Scientific Materials Europe S.r.l., based in Tortolì, Nuoro, Italy. This company is engagedin the production, manufacturing and marketing of synthetic crystals for industrial and researchlaser applications. The purchase price is approximately c0.5 million and will be paid in cash. Thecompany posted net sales of c0.6 million in 2004.As part of the strategy of ditching non-synergic businesses and focusing on profitable activities,the Group sold the subsidiary FST Consulting International, Inc. (hereinafter FST) based in SanLuis Obispo, California (USA) to Mr. David Ladd with effect from July 29, 2005. The company isengaged in the installation of towers for the telecommunications sector. It should be recalledthat FST was also engaged in providing quality control and certification services for thesemiconductor market, and the respective assets were sold on April 1, 2004. The selling price,after a partial reduction and distribution of capital stock to the parent company Saes GettersInternational Luxembourg S.A. in the amount of $2.1 million, was $0.3 million in cash. The capitalloss arising from the sale was c328 thousand. In 2004, FST posted gross sales of $10,867thousand (c8,743 thousand) and a net loss of $667 thousand (c537 thousand). In 2005, until thetransfer date, the company posted gross sales of $4,819 thousand (c3,786 thousand at theaverage progressive exchange rate on the transfer date) whereas the net loss on the transferdate was $313 thousand (c245 thousand).
The Group's economic result will continue to be influenced by exchange rates of the Euroagainst the major currencies. Transactions were also concluded to hedge against the exchange
58
rate risk vis-à-vis the US dollar and the Japanese yen, with a view to protecting the Group'smargins against fluctuations in exchange rates.
The company is confident about the prospects for the second half of 2005. In particular,compared with the second half of 2004, the forecast is for growth in sales of products for liquidcrystal displays but a drop in sales of getters for cathode ray tubes owing to the maturity of themarket. Other relevant industrial markets in which the Group operates should confirm overallstability or growth. Activities will also continue to develop new products in the area of advancedmaterials, some of which are already being launched onto the market.
38. Transition to the IFRS international accounting standards
The reconciliations are given below for the balance sheet and income statement as required byIFRS 1 First-time Adoption of International Financial Reporting Standards, accompanied byexplanatory notes on the principles adopted and the items that appear in the reconciliations.
The balance sheet and income statement prepared according to the layouts required by theLegislative Decree No. 127/1991 have been restated in short form to comply with thepresentation criteria which will be adopted to prepare IFRS financial statements. The standards adopted in the reconciliations presented may be different from the IFRSstandards effective as at December 31, 2005, as a result of the European Commission's futureguidance on the approval of the standards or the subsequent issue of new accountingstandards, interpretations or implementation guidelines issued by the International AccountingStandards Board (IASB) or the International Financial Reporting Interpretation Committee(IFRIC).
The auditing firm Reconta Ernst & Young S.p.A. completed the audits on the abovereconciliations as of the transition date and as of December 31, 2004 and issued a report, onJuly 27, 2005, certifying the conformity of the IFRS reconciliation statements with the criteriaand principles defined in Article 82-bis of the Regulations for Issuers.

59
Consolidated balance sheet reconciliation table as of the date of transition to IFRS (January 1, 2004)
January 1, 2004 Facultative Accounting January 1, 2004Notes Italian exemptions standards IFRS
Gaap and mandatory differencesexceptions on net equity
ASSETS
Non current assetsProperty, plant and equipment, net 1 59,261 5,151 64,412Intangible assets, net 2 4,369 (30) 4,339Investments in share capital and other financial assets 0 0Deferred tax assets 3 11,735 (1,925) 9,810Other long term assets 1,181 1,181Total non current assets 76,546 0 3,196 79,742
Current assetsInventory 4 18,518 (3) 18,515Trade receivables 26,744 26,744Financial receivables 0 0Prepaid expenses, accrued income and other 14,128 14,128Investments in share capital and other financial assets 5,192 5,192Cash and cash equivalents 70,404 70,404Total current assets 134,986 0 (3) 134,983Total assets 211,532 0 3,193 214,725
SHAREHOLDERS' EQUITY AND LIABILITIES
Capital stock 12,220 12,220Conversion reserve (2,003) 2,003 0Other reserves 150,059 (2,003) 3,057 151,113Net income (loss) (5,498) (5,498)Total shareholders' equity 5 154,778 0 3,057 157,835
Non current liabilitiesNon current financial liabilities 2,574 2,574Deferred tax liabilities 6 0 298 298Staff leaving indemnity and similar obligations 7 10,190 (162) 10,028Non current provisions 0 0Other payables 98 98Total non current liabilities 12,862 0 136 12,998Tota Total shareholders' equity 5 154,778 0 3,057 157,835 Total Current liabilitiesTrade payables 10,594 10,594Other payables 9,516 9,516Accrued income taxes 3,922 3,922Current provisions 1,655 1,655Derivative financial instruments evaluated at fair value (cash flow hedge) 0 0Bank overdraft 14,410 14,410Current portion of long term debt 172 172Accrued liabilities 3,623 3,623Total current liabilities 43,892 0 0 43,892Total liabilities and shareholders' equity 211,532 0 3,193 214,725
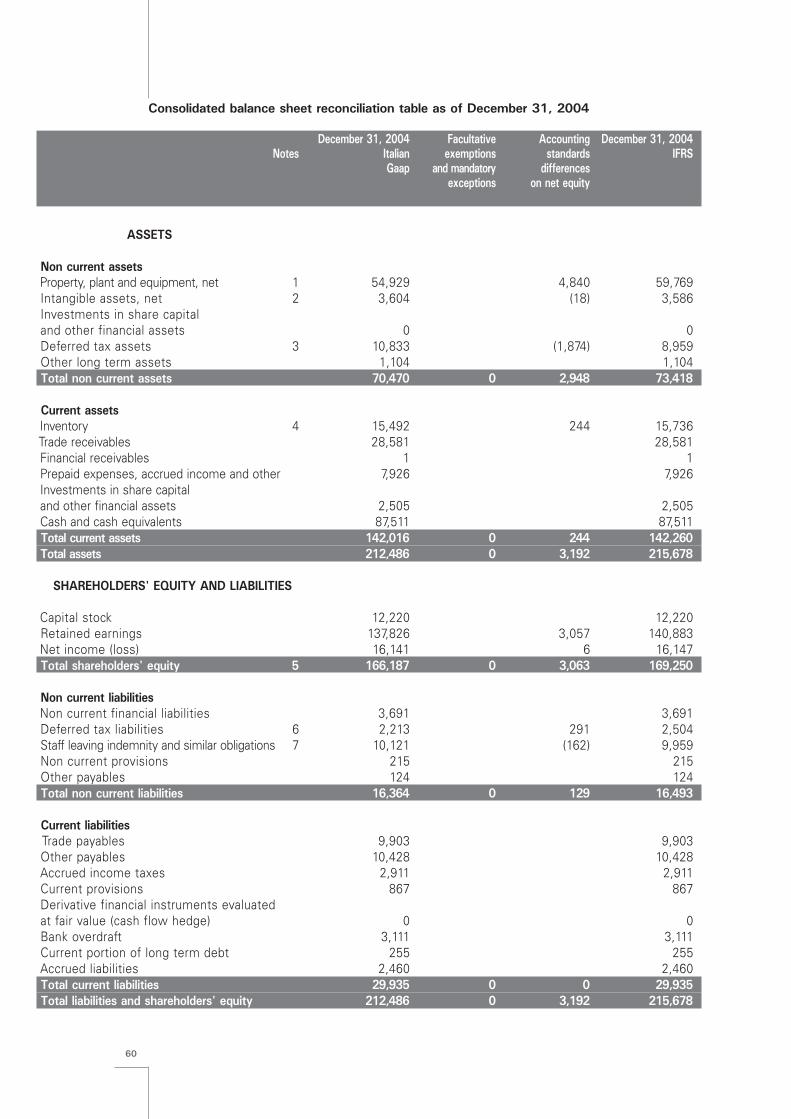
60
Consolidated balance sheet reconciliation table as of December 31, 2004
December 31, 2004 Facultative Accounting December 31, 2004Notes Italian exemptions standards IFRS
Gaap and mandatory differencesexceptions on net equity
ASSETS
Non current assetsProperty, plant and equipment, net 1 54,929 4,840 59,769Intangible assets, net 2 3,604 (18) 3,586Investments in share capital and other financial assets 0 0Deferred tax assets 3 10,833 (1,874) 8,959Other long term assets 1,104 1,104Total non current assets 70,470 0 2,948 73,418
Current assetsInventory 4 15,492 244 15,736Trade receivables 28,581 28,581Financial receivables 1 1Prepaid expenses, accrued income and other 7,926 7,926Investments in share capital and other financial assets 2,505 2,505Cash and cash equivalents 87,511 87,511Total current assets 142,016 0 244 142,260Total assets 212,486 0 3,192 215,678
SHAREHOLDERS' EQUITY AND LIABILITIES
Capital stock 12,220 12,220Retained earnings 137,826 3,057 140,883Net income (loss) 16,141 6 16,147Total shareholders' equity 5 166,187 0 3,063 169,250
Non current liabilitiesNon current financial liabilities 3,691 3,691Deferred tax liabilities 6 2,213 291 2,504Staff leaving indemnity and similar obligations 7 10,121 (162) 9,959Non current provisions 215 215Other payables 124 124Total non current liabilities 16,364 0 129 16,493
Current liabilitiesTrade payables 9,903 9,903Other payables 10,428 10,428Accrued income taxes 2,911 2,911Current provisions 867 867Derivative financial instruments evaluated at fair value (cash flow hedge) 0 0Bank overdraft 3,111 3,111Current portion of long term debt 255 255Accrued liabilities 2,460 2,460Total current liabilities 29,935 0 0 29,935Total liabilities and shareholders' equity 212,486 0 3,192 215,678
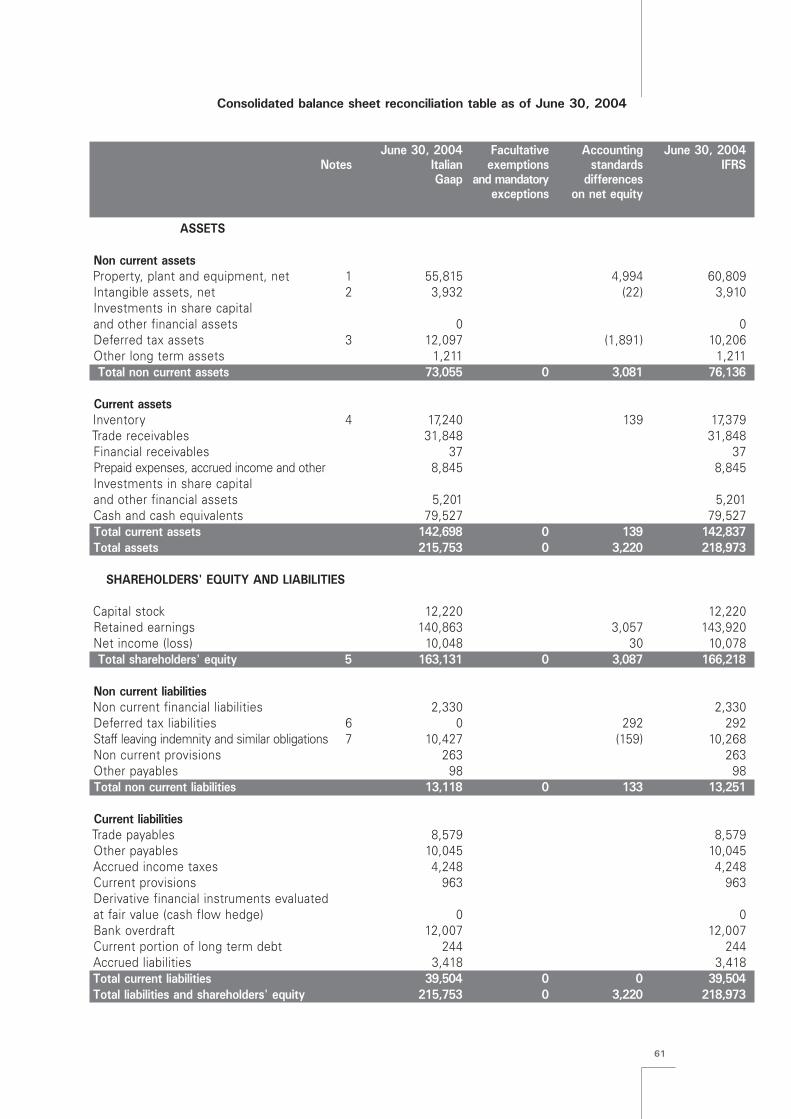
61
Consolidated balance sheet reconciliation table as of June 30, 2004
June 30, 2004 Facultative Accounting June 30, 2004Notes Italian exemptions standards IFRS
Gaap and mandatory differencesexceptions on net equity
ASSETS
Non current assetsProperty, plant and equipment, net 1 55,815 4,994 60,809Intangible assets, net 2 3,932 (22) 3,910Investments in share capital and other financial assets 0 0Deferred tax assets 3 12,097 (1,891) 10,206Other long term assets 1,211 1,211Total non current assets 73,055 0 3,081 76,136
Current assetsInventory 4 17,240 139 17,379Trade receivables 31,848 31,848Financial receivables 37 37Prepaid expenses, accrued income and other 8,845 8,845Investments in share capital and other financial assets 5,201 5,201Cash and cash equivalents 79,527 79,527Total current assets 142,698 0 139 142,837Total assets 215,753 0 3,220 218,973
SHAREHOLDERS' EQUITY AND LIABILITIES
Capital stock 12,220 12,220Retained earnings 140,863 3,057 143,920Net income (loss) 10,048 30 10,078Total shareholders' equity 5 163,131 0 3,087 166,218
Non current liabilitiesNon current financial liabilities 2,330 2,330Deferred tax liabilities 6 0 292 292Staff leaving indemnity and similar obligations 7 10,427 (159) 10,268Non current provisions 263 263Other payables 98 98Total non current liabilities 13,118 0 133 13,251
Current liabilitiesTrade payables 8,579 8,579Other payables 10,045 10,045Accrued income taxes 4,248 4,248Current provisions 963 963Derivative financial instruments evaluated at fair value (cash flow hedge) 0 0Bank overdraft 12,007 12,007Current portion of long term debt 244 244Accrued liabilities 3,418 3,418Total current liabilities 39,504 0 0 39,504Total liabilities and shareholders' equity 215,753 0 3,220 218,973

62
Notes to the balance sheet reconciliations
1. Property, plant and equipment: by applying the finance method to leasing transactions, asprescribed by IAS 17, the net book value of property, plant and equipment acquired underleases by the Group's Italian companies was recognized in opening equity according toIFRS.As at December 31, 2003, all leases were terminated, financial liabilities were settled andassets redeemed.
The difference between the values of property, plant and equipment recognized accordingto Italian accounting principles and those determined according to internationalaccounting standards on the dates of December 31, 2004 and June 30, 2004 consists ofthe net book value of the assets recognized on the date of transition to IFRS, lessdepreciation for the year 2004 and for the first half of 2004 respectively.
Under Italian accounting principles, no asset was recognized until the moment ofredemption in respect of finance leases, while disclosure on the effects of the financemethod was given in the accompanying notes.
2. Intangible assets: in accordance with IAS 38, some categories of costs such as start-upand expansion did not meet the conditions to be recognized as an intangible asset. Theresidual values on the date of transition to IFRS were therefore eliminated. The differencebetween the values of intangible assets on the dates of December 31, 2004 and June 30,2004 respectively also reflected depreciation for the year 2004 and for the first half of2004 respectively according to Italian accounting principles
3. Deferred tax assets: the difference on the dates of January 1, 2004, December 31, 2004and June 30, 2004 included the tax effect generated by restatements for the applicationof IFRS on the respective dates
4. Inventory: the difference in relation to Italian accounting principles included the effect ofthe measurement based on the percentage of completion method for constructioncontracts in force at the parent company, in accordance with IAS 11, totaling c1 thousandon the date of transition to IFRS, compared with c252 thousand as at December 31, 2004and c151 thousand as at June 30, 2004. This positive effect was partially offset by thewrite down of the value of spare parts entered as stock and not capitalizable inaccordance with IAS 2
5. Shareholders' equity: the total amount of adjustments owing to different accountingprinciples on the transition date of January 1, 2004 was c3,057 thousand and was postedto a reserve, in accordance with IFRS 1. The differences generated after the date oftransition to IFRS have had an effect on the income for the period.
It should be noted that there was a reclassification from the translation reserve to otherreserves in the negative amount of c2,003 thousand, as a result of the Group's decisionto elect the optional exemption contained in IFRS 1, which allows the possibility ofresetting to zero the accumulated gains or losses generated by the consolidation offoreign subsidiaries on the date of transition to IFRS. Gains or losses relating to possibledisposals of foreign subsidiaries after January 1, 2004 will only include the translationdifferences generated after the date of transition to IFRS.
6. Deferred tax liabilities: the restatement was due to the tax effect generated by theapplication of IAS 17 by one of the Group's Italian companies.
7. Staff leaving indemnity and other employee benefits: in accordance with IAS 19, thebenefits for employees in the category of defined benefit plans were treated according tothe actuarial methodology. Such measurement reduced the opening liability by c162thousand at Group level, whereas the impact on the income for 2004 was not significant.

63
Consolidated income statement reconciliation table as of December 31, 2004
2004 Accounting 2004Italian standards IFRS Gaap differences
Net sales 141,649 141,649Cost of sales (69,913) 155 (69,758)Gross profit 71,736 155 71,891
R&D expenses (13,428) (129) (13,557)Selling expenses (15,966) (3) (15,969)
G&A expenses (13,255) (72) (13,327)Total operating expenses (42,649) (204) (42,853)Other income (expenses), net (387) (387)Operating income 28,700 (49) 28,651Interest and other financial income, net 1,473 1,473Foreign exchange gains (losses), net (1,133) (1,133)Income before taxes 29,040 (49) 28,991Income taxes (12,899) 55 (12,844)Net income 16,141 6 16,147
Consolidated income statement reconciliation table as of June 30, 2004
2004 Accounting 20041st Half standards 1st Half
Italian Gaap differences IFRS
Net sales 72,847 72,847Cost of sales (36,344) 93 (36,251)Gross profit 36,503 93 36,596
R&D expenses (6,459) (66) (6,525)Selling expenses (8,061) (2) (8,063)
G&A expenses (6,543) (37) (6,580)Total operating expenses (21,063) (105) (21,168)Other income (expenses), net 412 412Operating income 15,852 (12) 15,840Interest and other financial income, net 456 456Foreign exchange gains (losses), net 68 68Income before taxes 16,376 (12) 16,364Income taxes (6,328) 42 (6,286)Net income 10,048 30 10,078

64
Notes to the income statement reconciliations
A summary is given below of the accounting differences applicable to the income statement inrelation to the year 2004 and to the first half of 2004 respectively.
2004 1 2 3 4 5 6 2004Italian FinancialConstuction Employee Intangible Spare Tax eff. Total IFRS Gaap lease contracts benefits assets parts consolid. diff.
(IAS 17) (IAS 11) (IAS 19) writedown writedown adj(IAS 38) (IAS 2) (IAS 12)
Net sales 141,649 141,649Cost of sales (69,913) (110) 251 4 10 0 155 (69,758)Gross profit 71,736 (110) 251 4 10 0 0 155 71,891
R&D expenses (13,428) (129) (129) (13,557)Selling expenses (15,966) (3) (3) (15,969)
G&A expenses (13,255) (78) 6 (72) (13,327)Total operating expenses (42,649) (207) 0 (3) 6 0 0 (204) (42,853)Other income (expenses), net (387) (387)Operating income 28,700 (317) 251 1 16 0 0 (49) 28,651Interest and other financial income, net 1,473 1,473Foreign exchange gains(losses), net (1,133) (1,133)Income before taxes 29,040 (317) 251 1 16 0 0 (49) 28,991Income taxes (12,899) 117 (92) (2) 32 55 (12,844)Net income 16,141 (200) 159 1 14 0 32 6 16,147
2004 1 2 3 4 5 6 20041st Half FinancialConstuction Employee Intangible Spare Tax eff. Total 1st Half
Italian Gaap lease contracts benefits assets parts consolid. diff. IFRS(IAS 17) (IAS 11) (IAS 19) writedown writedown adj
(IAS 38) (IAS 2) (IAS 12)
Net sales 72,847 72,847Cost of sales (36,344) (57) 150 6 (6) 93 (36,251)Gross profit 36,503 (57) 150 0 6 (6) 0 93 36,596
R&D expenses (6,459) (66) (66) (6,525)Selling expenses (8,061) (2) (2) (8,063)
G&A expenses (6,543) (39) 2 (37) (6,580)Total operating expenses (21,063) (105) 0 (2) 2 0 0 (105) (21,168)Other income (expenses), net 412 412Operating income 15,852 (162) 150 (2) 8 (6) 0 (12) 15,840Interest and other financial income, net 456 456Foreign exchange gains (losses), net 68 68Income before taxes 16,376 (162) 150 (2) 8 (6) 0 (12) 16,364Income taxes (6,328) 59 (56) 1 (1) 1 38 42 (6,286)Net income 10,048 (103) 94 (1) 7 (5) 38 30 10,078

65
1. By applying the finance method to leasing transactions, as prescribed by IAS 17, thedepreciation of property, plant and equipment was recognized according to the respectivedepreciation schedules. According to Italian accounting principles, the lease payment wasbooked for the quota attributable to the period.
On the date of transition to IFRS (December 31, 2003), all lease contracts were terminated.Consequently, no other economic impacts arising from the transition to IFRS were recorded.
2. In accordance with IAS 11, construction contracts specifically for the production of tangibleassets for certain customers are measured according to the percentage of completionmethod. The respective margin was therefore recognized.
According to Italian accounting principles, the construction contracts undertaken by theparent company were measured at cost and the margin was recognized when invoiced.
3. In accordance with IAS 19, the benefits for employees in the category of defined benefitplans were treated according to the actuarial methodology. The effects on the incomestatement of the various Group companies affected are not significant.
4. Amortization of start-up and expansion costs recorded according to Italian accountingprinciples which do not meet the requirements for recognition as an intangible assetaccording to IAS 38 was eliminated.
5. Spare parts entered as stock and not capitalizable according to IAS 2 were written down.
6. In accordance with IAS 12, the rate applied in the calculation of deferred tax assetsassociated with consolidation adjustments for the elimination of the unrealized margin in theinventories acquired by Group companies, is that of the purchasing company, whereas underItalian accounting principles, the rate in force in the seller's country was applied.
The reconciliation between net income according to Italian accounting principles and netincome according to IFRS is shown in the following table:
2004 1st Half 2004
Net income according Italian Gaap 16,141 10,048
Depreciation of tangible fixed assets acquired by means of finance leases contracts (IAS 17) (317) (162)Evaluation of construction contracts on the basis of the percentage of completion (IAS 11) 251 150Elimination of amortization of intangible assets written down (IAS 38) 16 8Actuarial evaluation of defined benefit plans in favour of employees (IAS 19) 1 (2)Write down of spare parts in inventory (IAS 2) 0 (6)Tax effects on the above adjustments 23 4Different calculation of tax effects on adjusments to eliminate intercompany profit on inventory acquired from Group companies (IAS 12) 32 38
Net income according IFRS 16,147 10,078
There is no significant impact on the cash flow statement for the year 2004 owing to IFRStransition.

66
39. Scope of consolidation
The following table shows the companies included in the scope of consolidation according tothe full consolidation method:
Currency Capital % OwnershipCompany Stock Direct Indirect
Directly-Controlled subsidiaries:Saes Advanced Technologies S.p.A.Avezzano, L’Aquila (Italy) Euro 2,600,000 100,00 -
Saes Getters Usa, Inc.Colorado Springs (Colorado - USA) $ USA 9,250,000 100.00 -
Saes Getters Japan Co. Ltd.Shinagawa - Tokyo (Japan) Yen 20,000,000 100.00 -
Saes Getters (GB) Ltd.Daventry (UK) GBP 20,000 100.00 -
Saes Getters (Deutschland) GmbHCologne (Germany) Euro 52,000 100.00 -
Saes Getters Singapore Pte Ltd.Singapore $Sing. 300,000 100.00 -
Saes Getters International Luxembourg S.A.Luxembourg Euro 11,312,777 99.92 0.08*
Indirectly-controlled subsidiaries:Through Saes Getters Usa, Inc.:
Saes Pure Gas, Inc.San Luis Obispo (California - USA) $ USA 7,612,661 - 100.00
Through Saes Getters International Luxembourg S.A.:Saes Getters Korea Corporation
Seoul (Korea) Won 10,497,900,000 37.48 62.52Saes Getters Technical Service (Shanghai) Co., Ltd.
Shanghai (People’s Repubblic of China) $ USA 4,100,000 - 100.00New Trace Analytical, Inc.
Baltimore (Maryland - USA) $ USA 22,000,000 - 100.00FST Consulting International, Inc.
San Luis Obispo (California - USA)** $ USA 10,500,000 - 100.00Saes Getters Ireland Limited
Dublin (Ireland)*** Euro - - 100.00
* % held by Saes Advanced Technologies S.p.A.** sold on July 29, 2005*** put into liquidation procedure

67
The following table shows the company included in the scope of consolidation according to theproportionate consolidation method:
Company Currency Capital % OwnershipStock Direct Indirect
Nanjing Saes Huadong Getters Co. Ltd.Nanjing (People’s Repubblic of China) $ USA 13,570,000 65.00 -
40. Exchange rates used in the conversion of financial statements expressed in foreign currency
The following table shows the exchange rates applied in converting foreign financial statements:
Expressed in foreign currency (per 1 euro)
June 30, 2005 December 31, 2004 June 30, 2004Currency Average Final Average Final Average Final
rate rate rate rate rate rateUS Dollars 1.284 1.209 1.243 1.362 1.227 1.216JPY 136.189 133.950 134.381 139.650 133.051 132.400Korean Won 1,303.726 1,239.850 1,422.549 1,410.050 1,432.407 1,404.450Renminbi (People's Republic of China) 10.633 10.008 10.292 11.278 10.162 10.064Singapore Dollars 2.116 2.038 2.100 2.226 2.085 2.090New Taiwan Dollars 39.674 38.211 41.472 43.954 40.872 40.979UK Pounds 0.686 0.674 0.678 0.705 0.674 0.671
Lainate (Milan), September 28, 2005
On behalf of the Board of DirectorsThe Chairman
Paolo della Porta

68