Accounting for Value - DiVA portal539650/FULLTEXT01.pdfstakeholders are adapted to capture corporate...
64
Stockholm Resilience Centre Research for Governance of Social-Ecological Systems Master’s Thesis, 30 ECTS Sustainable Enterprising Master’s programme, 120 ECTS Accounting for Value Using Social Return on Investment (SROI) to measure the value created by CSR initiatives Thomas Taliaferro
Transcript of Accounting for Value - DiVA portal539650/FULLTEXT01.pdfstakeholders are adapted to capture corporate...

Stockholm Resilience CentreResearch for Governance of Social-Ecological Systems
Master’s Thesis, 30 ECTS
Sustainable Enterprising Master’s programme, 120 ECTS
Accounting for Value
Using Social Return on Investment (SROI) to measure the value created
by CSR initiatives
Thomas Taliaferro

Abstract The role of the corporation is shifting from an entity focused on making monetary profits to
an organization focused on creating value for all of its stakeholders. Despite of this many of
the guidelines, standards and reporting frameworks that have been developed to take into
account the increasing stakeholder expectations only capture corporate inputs and outputs
relating to social initiatives. By not understanding the value created by social initiatives
information is missed that could be useful to the organization and its stakeholders. The
purpose of this study has therefore been to see if the Social Return on Investment (SROI)
methodology can be a viable tool for companies to use for measuring the value created by
CSR activities. This has been accomplished via a case study of a CSR initiative funded by a
multinational wind power company in India, and more specifically the building and use of a
traditional water harvesting structure called a taanka. Having gone through the six steps of
SROI, including monetization of all non-market social, environmental and economic values,
the results show that for every Indian Rupee (INR) invested into the studied CSR initiative 29
INR of social value have been created for the stakeholders. The results also show the relation
between different inputs and outcomes for the stakeholders affected by the initiative. By
analyzing the results several lessons for the construction of future taankas can be learnt. Each
taanka should for instance be constructed for as many households as possible and ownership
should be shared by the users. More resources should also be allocated to following up the
outcomes created by CSR initiatives to help to maximize the efficiency of the resources used
to create social value. The methodology can also be used to understand the shared corporate
and societal values created by measuring the value created for both the company and the
stakeholders, which in turn is useful when deciding on the allocation of corporate resources.
Key terms: Corporate social responsibility, social return on investment, creating shared value

Acknowledgements Firstly, I would like to thank my supervisor Erik Nilsson for our many constructive dialogues,
your insightful comments and helpful feedback on my work. You have gone far beyond what
I think can be expected in your role as a supervisor.
I would also like to thank Seemantinee Khot and Jasmine Gogia and everyone else at Suzlon
for the support, enthusiasm and encouragement you have shown for my work during my time
in India. Except for this I would like to thank Praveen Kumar Bera and Aman Singh Bhati at
GRAVIS for taking time in your busy schedule to aid me in the data collection for my case
study.

Contents
1 Introduction ............................................................................................................................. 1
1.1 Problem Statement ............................................................................................................ 1
1.2 Aim of the Thesis and Research Questions ...................................................................... 2
2 Theoretical Framework ........................................................................................................... 3
2.1 Social Responsibility from an Organizational Perspective .............................................. 3
2.2 Methods used to Track Social Impact .............................................................................. 5
2.2.1 Global Reporting Initiative ........................................................................................ 6
2.2.2 Social Accounting and Auditing ................................................................................ 7
2.3 Social Return on Investment ............................................................................................. 8
2.3.1 A brief History ........................................................................................................... 8
2.3.2 The Methodology ....................................................................................................... 9
3 Case study description ........................................................................................................... 12
4 Methods ................................................................................................................................. 14
4.1 Presentation of Data Sources Used ................................................................................. 14
4.1.1 Secondary data analysis ........................................................................................... 14
4.1.2 Semi Structured Qualitative Interviews ................................................................... 14
4.3 Conducting the case study .............................................................................................. 16
4.3.1 Identifying Key Stakeholders .................................................................................. 16
4.3.2 Identifying inputs and giving them a value .............................................................. 20
4.3.3 Mapping outcomes, evidencing them and giving them a value ............................... 22
4.3.4 Establishing Impact .................................................................................................. 28
4.3.5 Projecting into the future and Calculating Net Present Value ................................. 31
5 Results ................................................................................................................................... 32
6 Discussion ............................................................................................................................. 36
6.1 Sensitivity analysis ......................................................................................................... 36
6.2 Potential areas of improvement for future studies .......................................................... 37

6.3 Implications of findings for the construction of future taankas ...................................... 38
7 Conclusions ........................................................................................................................... 39
References ................................................................................................................................ 41
Appendix 1 - Glossary .............................................................................................................. 45
Appendix 2 – Impact Map ........................................................................................................ 47
Figures Figure 1: Model of the economic logic within organizations (Söderbaum 2008)...................... 4
Figure 2: SROI compared to other quality and impact tools (Angier Griffin 2009) ................ 11
Figure 3: Net present value created for each stakeholder ........................................................ 34
Figure 4: Value of inputs that each stakeholder has contributed with ..................................... 35
Tables Table 1: Stakeholder map ......................................................................................................... 16
Table 2: Identifying and valuing inputs ................................................................................... 20
Table 3: Identifying and valuing outcomes .............................................................................. 23
Table 4: Deadweight, drop-off and benefit period used for the outcomes ............................... 29
Table 5: Total and net present value created ............................................................................ 31
Table 6: Inputs, net present value of outcomes and the SROI ratio ......................................... 32

1
1 Introduction This chapter begins with a problem statement providing a background to why the thesis is
being undertaken. It is then followed by aim of the thesis and research questions where the
purpose of the thesis and the questions that need to be answered in order to fulfill the purpose
are presented.
1.1 Problem Statement Increasing expectations from stakeholders are changing the role of the corporation from an
entity focused on making monetary profits to an organization aimed at creating value for all
stakeholders affected by its operations. The concept of corporate social responsibility (CSR)
has been developing rapidly during the past decades (May, Cheney and Roper 2007). As a
result of this stakeholders are now accepted as important for organizational success and its
sustainability (May, Cheney and Roper 2007; ISO 26000:2010 2010). The challenge from a
corporate perspective is how to how to deal with the increased stakeholder expectations in a
way that creates value for the own organization and the stakeholders.
In the academia the corporate performance in relation to its social performance has been
extensively studied because this is well aligned with the traditional way to view value creation
within corporations, which is profit maximization. Corporate value creation beyond financial
values is in conflict with this view of the role of the corporation and studying corporations
from this perspective is not consistent with the wealth maximization ideology. Understanding
how corporations control, monitor and discipline their social initiatives is however important
in order to understand how corporations live up to their social responsibilities to their
stakeholders (Margolis and Walsh 2003). Measuring social value from a stakeholder
perspective is however much more difficult then measuring financial return on investment on
projects or organizations due to the lack of infrastructure to do this. The infrastructure to
measure return on investment (e.g. the accounting profession, brokers, financial analysts,
financial reporting, financial concept development) has taken centuries to develop and it is
still debated how economic value should be measured. Many of the guidelines, standards and
reporting frameworks that have been developed to focus increasing expectations from
stakeholders are adapted to capture corporate inputs in respect to their social initiatives. The
result of this is that money spent or employees’ time in volunteering is emphasized instead of
outcomes for the intended stakeholder, a particular social initiative or for the intended
community (Zappalà and Lyons 2009). At the moment companies do not tend to apply the
2
same quality measurements on their relationship with the community as they would to other
aspects of their business. The social impact of a corporation is an issue that very few
companies are able to define and report on (Global Reporting Initiative 2008). By only
understanding the inputs that go into initiatives that are aimed to create value for stakeholders
a lot of information is missed that could be useful for the corporation and its stakeholders
(Peloza and Shang 2010).
In the social sector there is however a tradition of measuring the social value created for the
stakeholders affected. By applying a tool primarily developed for the social sector in a
corporate context several insights into the social value creation process can potentially be
gained which can be useful both from a corporate and a stakeholder perspective.
1.2 Aim of the Thesis and Research Questions The aim of this thesis is to understand if the Social Return on Investment1 (SROI)
methodology can be a viable tool to evaluate the value created by CSR initiatives by testing
the methodology on a real case study. The thesis can also help to facilitate strategic
discussions to help the case study organization maximize the social value created by the
particular type of CSR initiative studied.
In order to conduct the SROI analysis the following research questions need to be answered:
• What material outcomes are created for the stakeholders as a result of the CSR
initiative?
• Which positive and negative social, ecological and economic values does the CSR
initiative create for the stakeholders?
1 SROI is a framework for measuring and accounting for social impacts made by projects or an organization by
measuring change in ways that are relevant to the people or organizations that experience or contribute to it.
SROI describes how change is being created by measuring social, environmental and economic outcomes and
then uses monetary values to represent this change (Nicholls et al. 2009).

3
2 Theoretical Framework The chapter begins with an introduction to social responsibility from an organizational
perspective to provide a broad background to the area in which the thesis is being undertaken.
It then presents a general overview of other studies undertaken where the use of social impact
methodologies in practice has been evaluated. After this a couple of social impact
methodologies similar to SROI are introduced to show why SROI was chosen as a
methodology to evaluate the outcomes created by the studied CSR initiative. Finally SROI as
a methodology is presented.
2.1 Social Responsibility from an Organizational Perspective Despite the fact that social responsibility (SR) which is also known as corporate social
responsibility (CSR) is widely practiced among organizations today there is no single
definition of the concept and organizational practices are continually developing (May,
Cheney and Roper 2007). According to the international standard for guidance on social
responsibility ISO 26 000:2010 (2010, 3) the definition of SR is:
“responsibility of an organization for the impacts of its decisions and activities on society
and the environment, through transparent and ethical behavior that
• contributes to sustainable development, including health and the welfare of
society;
• takes into account the expectations of stakeholders;
• is in compliance with applicable law and consistent with international norms of
behavior; and
• is integrated throughout the organization and practiced in its relationships”
Another definition of the social responsibility of the organization is “the legal, ethical and
discretionary expectations that a society has of organizations at a given point in time” (May,
Cheney and Roper 2007, 6). What can be expressed generally about social responsibility is
that it is about a contrast to the classical neoliberal view of the organization were the
organization’s purpose is to make a profit for its shareholders and operate according to the
law. Social responsibility implies a responsibility for the wider impacts of an organization’s
activities on its stakeholders going beyond legal compliance (May, Cheney and Roper 2007).
One challenge for organizations working with CSR is that they need to follow interests from
several stakeholders and are expected to be two systems at the same time. In one system laws,
customers and coworkers for example expect that the organization should work as a machine

4
which does exactly what it was constructed to do. In the other system the same stakeholders
expect the organization to function as an adaptable organism. Principally the economic
dynamics of an organization is an interplay between the organization and its resource base in
order to achieve certain values. Between the organization and the resource base resources are
being exchanged (Söderbaum 2008). This is illustrated in figure 1 below.
Figure 1: Model of the economic logic within organizations (Söderbaum 2008)
All the resources which go into an organization will in one form or the other leave it. In order
to obtain resources it is important to receive an income for that which leaves the operations.
As long as those in charge of the operations feel that value is created this continues
(Söderbaum 2008). Sustainability from an organizational perspective is a value creation crisis.
The concept of value needs to be rethought (Porter and Kramer 2011).
Porter and Kramer (2011) argue that corporations instead of focusing on their social
responsibility should be thinking about opportunities to create value for both the company and
society at large. Many companies have taken initiatives to mitigate the impacts of their
environmental and social consequences that have not been as productive and successful as
they could be. The reason for this is that business interests are being pitted against society,
when they in reality are interdependent (Porter and Kramer 2011). Corporate social
responsibility is also often seen as a standardized concept which is not adapted to the
circumstances of the specific organization (Porter and Kramer 2006). In order for a CSR
initiative to be successful it is therefore important that it creates value for those in charge of
the organizations operations and its external stakeholders (Peloza and Shang 2010), called the
resource base by Söderbaum (2008). In a systematic review of other studies done by Peloza
and Shang (2010) of which CSR activities create the most value their study found that the
most successful initiatives created the most value for specific stakeholders. In their review
they did however also notice a limited ability in other studies to predict which CSR activities
will create the greatest value (Peloza and Shang 2010). Not being able to quantify the benefit

5
of CSR programs often leads to corporate resources being placed elsewhere. For a CSR
initiative to be successful it needs to create shared value for society and the company. Shared
value is not about personal values or sharing value created by firms as a redistribution
approach, but it is about expanding the total pool of economic and societal value created. In
practice creating shared value is about “policies and operating practices that enhance the
competitiveness of a company while simultaneously advancing the economic and social
conditions in the communities in which it operates” (Porter and Kramer 2011, 6). Value is
defined as benefits relative to costs and not just benefits alone. Some companies have begun
to track various social impacts, but few have tied them to their economic interests at the
business level. By clearly linking the social impacts to outcomes connected to all stakeholders
and tracking this using clear metrics it is possible to go from CSR to creating shared value
(Porter and Kramer 2011).
2.2 Methods used to Track Social Impact The social impact methods mentioned in this section are primarily developed for
organizations whose main goal is to create social value such as non governmental
organizations and third sector organizations. This focus was chosen because these types of
organizations are specifically designed to create social value. They are also often a part of an
environment where they are competing for scarce financial resources which is similar to the
environment of the CSR initiatives managed by the case study organization.
There is a large amount of fragmented ways of measuring the social value created by
organizations. In 2005 new economics foundation conducted a study where they mapped the
most used tools to measure social value created within the third sector in Britain comparing
the advantages and disadvantages of the methodologies used. They identified 22 separate
models being used. Some of the models focused on environmental impact or sustainability
while others were designed for specific users such as small businesses or social enterprises.
The models they studied included as diverse models as Key Social and Co-operative
Performance Indicators, GRI guidelines and “Look back, move forward” models (Wood and
Leighton 2010). Several studies have drawn the conclusion that there seems to be a general
lack of maturity when it comes to the evaluation of social programs (Wood and Leighton
2010, Tuan 2008, Karoly 2008). In a study conducted by the McArthur Foundation
commissioned by the RAND corporation 39 social programs in the USA were evaluated
which were using scientific methods for measuring the social value created. 22 of these used
some sort of cost-benefit analysis. Some of the conclusions from that study were that many

6
important benefits are not monetized, shadow prices used do not capture value in a good way
and predictions for future outcomes are often based on early outcomes without any
standardized approach (Karoly 2008). A study conducted in the USA by Tuan (2008) funded
by the Bill and Melinda Gates Foundation also found severe discrepancies when it came to
valuing the social value created by projects. Of the eight methodologies studied six were
named after the organizations which had created and developed them leading to a “bottom
up” fragmented way to measure social value. In the methodologies studied there was a lack of
common language, common purpose for evaluation and common method for measuring the
value created. Despite the lack of consistency in measuring social value Tuan (2008) argues
that by evaluating social value created tradeoffs are faced explicably rather then passively,
both in time spent evaluating benefits achieved and in choosing between projects to invest in.
In the past there seems to be a considerable amount of ways used by organizations during the
recent years to measure social value created. Many organizations have used some form of
cost-benefit analysis, but due to the large variation in frameworks there has been a lack of
consistency in measuring social value.
Some of the more established ways to measure social impacts are described below in order to
create a broader understanding of methodologies used for measuring organizational social
impacts. The global reporting initiative (GRI) guidelines was chosen because it represents the
only real standard for sustainability reporting (Henriques 2010) and because it is one of the
most common ways to measure social impact in the commercial sector (Wood and Leighton
2010). Social accounting and auditing (SAA) has been chosen due to it’s similarities with
SROI. The descriptions provide background information to why the SROI framework was
used to measure social value created in this study.
2.2.1 Global Reporting Initiative One of the most common tools to attempt to measure social impact within the commercial
sector is using the GRI guidelines. The cornerstone of the framework is the sustainability
reporting guidelines, which include (Wood and Leighton 2010):
• “principles to define report content: materiality, stakeholder inclusiveness,
sustainability context and completeness
• principles to define report quality: balance, comparability, accuracy, timelines,
reliability and clarity ·
• guidance on how to set the report boundary” (Wood and Leighton 2010, 50)
7
The framework also includes national annexes with country level information and sector
supplements covering unique indicators for different industrial sectors (Wood and Leighton
2010). Many of the best sustainability reports today make use of GRI. It has gained its
legitimacy because it was developed through a genuine multi stakeholder process, and partly
because it represents the only real standard for sustainability reporting (Henriques 2010).
The GRI guidelines do not however focus on outcomes, but instead focuses on processes and
outputs such as how much money was spent on them. This allows an insight into
organizational commitments to social and environmental goals, but the impact or social value
created in regard to for instance human rights is left out. The framework also does not provide
qualitative information such as specific studies conducted or stakeholder feedback. What it
instead does is to provide a complement to commercial organizations daily activities so that
social and environmental issues are taken into account (Wood and Leighton 2010).
2.2.2 Social Accounting and Auditing Social Accounting came into existence in the 1970s as a way to broaden the focus of
traditional financial accounting on shareholders to a wider range of stakeholders so that
organizational social impacts could be accounted for (Zappalà and Lyons 2009). Social
accounting can be defined as “the systematic analysis of the effects of an organization on its
communities of interest or stakeholders, with stakeholder input as part of the data that are
analyzed for the accounting statement ‟ (Zappalà and Lyons 2009, 8). It is one of the most
common approaches to measure social value created in the third sector in Britain (Wood and
Leighton 2010). Some of the early social accounting frameworks tried to incorporate the
social account with the financial framework, but more recent methodologies have moved
more towards providing qualitative and descriptive data to assess the organizational mission
and how well stakeholders expectations are fulfilled. The model developed by the Social
Audit Network (SAN) is the framework which is most used by organizations in Britain
(Zappalà and Lyons 2009). The model developed by SAN uses eight principles that
organizations undertaking social accounting and audit should follow:
“1. Clarity of purpose: Organizations should be clear as to why they are undertaking the social
accounting process;
2. Scope: Organizations should acknowledge and articulate all their values, objectives and
stakeholders before agreeing which aspects their social accounting will include;

8
3. Stakeholder engagement: Social accounting should engage with and reflect the opinions of
a wide variety of key stakeholders affected by and able to affect the organization;
4. Materiality: Organizations should determine what must be included in the social accounts
so that stakeholders and others can draw conclusions about the organization’s impact and
performance
5. Comparative: Organizations should make comparisons of performance and impact using
appropriate benchmarks, targets and external standards
6. Transparency: Organizations should demonstrate the basis on which the findings can be
considered accurate and honest
7. Verification: The social accounts should be independently verified by a social audit panel
8. Embedded: Organizations should ensure that the process of social accounting and audit
becomes embedded in its life cycle and practices.” (Zappalà and Lyons 2009, 10)
An important feature of this model is that organizations can use information which they
already have for monitoring, reporting and evaluation and build on that using the SAN model.
By doing this it is also the organization itself that identify values and social objectives and
then reports how they meet these objectives based on stakeholder views (Zappalà and Lyons
2009). The framework can be used by any organization in the public or private sector of any
size (Social Audit Network 2011). SAA is very similar to SROI because both methodologies
aim to understand the social impacts of a project, organization or policy and are based on
stakeholder engagement to understand these impacts. What makes SROI different is that it
tries to indentify market values for the impacts experienced by the stakeholders (Gibbon and
Dey 2011).
2.3 Social Return on Investment
2.3.1 A brief History The term SROI was first used in the 1990s by a USA based philanthropy organization
supporting employment for former homeless individuals through investments in local third
sector organizations which operate different social enterprises. The method used was based on
a traditional cost-benefit analysis (Gibbon and Dey 2011). Since then the methodology has
developed substantially by for instance adding features such as the integration of stakeholder
engagement into the process (Scholten et al. 2006). In 2007 a report funded by the EU and the

9
Scottish Government was published favoring SROI over it’s rival impact methodology SAA
because it had “demonstrated the ability of SROI to combine ‘softer’ qualitative reporting
(telling the story of the impact of given projects) with the accessibility of headline financial
ratios (calculations showing the cost against the overall return on investment of given
projects)” (Scottish Centre for Regeneration 2010, 6). The methodology has also become the
favored model to show social value created from third sector organizations by the British
government after an investigation running in between 2008-2011 due to its ability to combine
economic and social efficiency (Wood and Leighton 2010).
A British guide for SROI was in 2008 financed by the Cabinet Office and published in 2009
(Nicholls et al. 2009). This guide was in 2010 translated into Swedish by SERUS and is the
first Swedish SROI guide (SERUS 2010). Due to the fact that the SROI guide financed by the
Cabinet Office in Britain is the official recommended guide to use by a government (Arvidson
and Lyon 2010) and because its translation is the first Swedish SROI guide (SERUS 2010)
this is the SROI guide used in this thesis. Here in after this guide will be referred to as ‘the
guide’.
An updated SROI guide was published during the course of this study by the British Cabinet
Office with language changes so that the guide can be more relevant for international
audiences, different sectors and organizations. No changes have been made to the
methodological framework (Nicholls et al. 2012).
2.3.2 The Methodology SROI has been developed to help organizations to understand the value created through
activities. It does this by measuring change for those people, organizations or entities that are
affected by the activity in a positive or a negative way. By monetizing this change an SROI
ratio of benefits relative to costs to be calculated. A ratio of 3:1 means that 3 units of currency
of social value have been created for every unit of currency spent. An SROI study can be
either evaluative (being conducted after outcomes have taken place) or forecast (predicting
social value created if activities meet goals of outcomes) (Nicholls et al. 2009).
Conducting an SROI according to the guide involves seven principles:
• Involve stakeholders - Stakeholders in SROI are “people or organizations that
experience change, whether positive or negative, as a result of the activity being

10
analyzed” (Nicholls et al. 2009, 20) and are therefore best placed to describe the
change that has occurred to them.
• Understand what changes - Theories of how positive, negative, intended and
unintended change is created should be supported by evidence.
• Value the things that matter - Many outcomes are not traded in markets and can
therefore be forgotten. It is however important to value these using financial proxies.
• Include only what is material - In order to give a fair picture information that might
cause a stakeholder to make a different decision about an activity should be included.
This is done so that stakeholders can draw reasonable conclusions about the impact.
• Do not over-claim - An organization should only claim the value that it is responsible
for creating.
• Be transparent - It should be demonstrated why the analysis should be considered
accurate and honest and how it will be reported and discussed with stakeholders.
• Verify the result - Independent assurance will help to understand if choices made
when conducting an SROI were reasonable (Nicholls et al. 2009).
The level of detail of the information needed in an SROI analysis depends on the reasons of
why the analysis is been conducted. A short analysis done for internal purposes is less time
consuming then a full scale report written for external audiences that can be verified (Nicholls
et al. 2009).
An SROI study can help an organization in its social value creation by:
- facilitating strategic discussions to aid the understanding and enhance the social value
created by an activity
- allocating resources to manage unexpected outcomes, both positive and negative
- showing the importance in collaborating with other organizations and people that also
create change
- finding a common ground between organizational and stakeholder objectives
- creating a formal dialogue with stakeholders that lets them hold the service that has
been given to them to account and involve them in the service design (Nicholls et al.
2009)

11
Comparing social value created between organizations based on the SROI ratio only is not
recommended. In the same way the investors need more information then the financial return
on investment to make investment decisions, social investors need to read all the information
in an SROI report. Organizations that work with different stakeholders can also make
different judgments when it comes to analyzing the social value created. Changes can
however be compared within the organization itself over time to see how the social return on
investment changes (Nicholls et al. 2009).
Compared to other methodologies to measure social value created conducting a full scale
SROI is one of the most resource intensive. Angier Griffin mapped some of the most common
tools for estimating organizational social value creation in the UK as part of a program called
Even More for Your Money (Wood and Leighton 2010). The result of this work can be found
in figure 2 below.
Figure 2: SROI compared to other quality and impact tools (Angier Griffin 2009)

12
3 Case study description The project studied in this thesis is funded by Suzlon Foundation which leads corporate social
responsibility initiatives for the India based Suzlon group of companies (Suzlon Foundation
website a). The Suzlon group is a wind power company with 13000 employees operating in
32 countries (Suzlon website). They are a highly vertically integrated wind turbine
manufacturer constructing everything from components to complete wind turbine systems
(Suzlon Foundation 2010). Suzlon is a market leader in India and has worldwide market share
of 8 %, making it the 5th largest wind turbine manufacturing group in the world (Suzlon
website). The mission of Suzlon Foundation is to ensure that the Suzlon group of companies
has a minimal impact on the natural environment, enable local communities where the
company operates to develop to their potential, empower employees to be responsible civil
society members and that they commit to ethical business practices that are fair to all
stakeholders (Suzlon Foundation website b).
The focus of this thesis is a project located in proximity to Jodhpur city in Rajasthan, India.
The Jodhpur area is the location of one of Suzlon’s major clusters of wind turbines, and
because of this Suzlon Foundation has a presence in the communities surrounding these
(Suzlon Foundation 2011). Jodhpur and its surroundings are characterized by the Thar Desert
which covers 60 % of Rajasthan’s surface. It is an area of low socio-economic status in India
and is very arid. The Thar Desert is the world’s most densely populated desert and recent
increases in human and livestock populations have lead to a deteriorating ecosystem. The
region suffers from acute water shortages and frequent crop failures which occur every second
or third year (Government of India Planning Commission 2011). Suzlon Foundation have
been active in Rajasthan since 2007 and have so far implemented projects empowering
women, enhancing sustainable livelihood, improving peoples health, promoting soil and water
conservation and improvement of agricultural practices for example in the communities in
which they operate (Suzlon Foundation 2011).
The CSR project chosen for this study is a traditional water harvesting structure common in
the Thar Desert in Rajasthan called a taanka. It can be simply described as a cylindrical
underground rainwater storage cistern, where rainwater from an artificially prepared
catchment area flows into the underground storage area through a filtered inlet which is there
to keep birds, rodents and objects out. Taankas are built to provide water to families which do
not have access other nearby water sources. During years when the monsoon fails or when the

13
rainwater has been exhausted it is refilled by water brought to the taanka, and the structure
thus also serves as a water storage facility (GRAVIS 2003a).
No documents have been found within Suzlon Foundation of benefits which can be expected
from a taanka. GRAVIS the NGO which Suzlon did partner with for this CSR initiative has
tried to identify benefits achieved from a taanka, but this analysis has not conducted in a
systematic way. GRAVIS has been working together with Suzlon foundation implementing
CSR initiatives in the region since 2008 (Ranveer Singh, April 14, 2012, e-mail message to
author), but has been active in working with rural development in Rajasthan since 1983
(GRAVIS website a). Taankas can in the same document be referred to a structure which
provides drinking water only to humans, provides drinking water to humans and livestock and
provides water for baths for children (GRAVIS 2003a). In one book from GRAVIS published
in 2003 a suggestion for further studies regarding waterborne diseases that might be found in
taankas is asked for (GRAVIS 2003b) while in another book from GRAVIS in 2003 an
identified “significant gain” from a taanka is that it “ensures taste, cleanliness and quality of
water and thus prevents waterborne diseases” (GRAVIS 2003a, 31). No further explanation is
given regarding how the taanka prevents waterborne diseases or which waterborne diseases
the taanka prevents (GRAVIS 2003a).
The taanka studied in this SROI is used by 30 persons living in six different households
(Household who owns taanka 2012; Neighboring households to taanka 2012) and can store
about 18000 liters of water (Praveen Kumar Bera, February 13, 2012, e-mail message to
author). It was built in June of 2009 (Household who owns taanka 2012), and the analysis will
cover the entire social value created by the taanka from construction up until the end of
January 2012. Before the taanka was built all of the families used a government tube well
located four km away as their only water source for all of their water used except for one
household which used a private well occasionally. Walking to the tube well and back took an
average of 2,5 hours, a trip done up to three times a day by children, women and men living in
the households. As a result of the taanka being built almost all of the families use it as their
only water source throughout the year since water is being transported from the government
tube well with a tractor when the taanka is not refilled by rainwater (Household who owns
taanka 2012; Neighboring households to taanka 2012).

14
4 Methods The chapter begins with a presentation of the data sources used to conduct the study. After
this the process of undertaking the case study is described.
4.1 Presentation of Data Sources Used
4.1.1 Secondary data analysis Secondary data can roughly be categorized into three different levels of sources called
primary, secondary and tertiary. Primary source data can be found in the publications that first
published them. Primary sources can be obtained in scholarly journals and government and
commercial databases. Secondary sources are books and articles that analyze primary sources,
typically written by and for other researchers. Tertiary sources are based on secondary
sources, usually written for non-specialists. Examples are Time magazine or Wikipedia
(Booth, Colomb and Williams 2008).
Different types of sources have been utilized for different purposes in this thesis. Tertiary
sources have been used in the beginning of the research in order get introductory overviews.
Examples of tertiary sources used are Wikipedia and websites found through Google. These
have been used to gain an introduction to concepts such as SROI or what a taanka is and what
it does. No tertiary sources have been cited. Secondary sources have been used to understand
current research and in the literature review. One example of secondary sources used is the
book Social Impact – Measuring and Managing Your Social Footprint by Henriques (2010). It
was used to gain an understanding of how social impact is measured in the corporate sector
today and has been cited in the literature review. Primary sources are the type of sources most
cited in this thesis in order to ensure a high information quality. Examples of primary sources
used are the international standard for guidance on social responsibility ISO 26000:2010
(2010) and Measuring and/or Estimating Social Value Creation: Insights into Eight Different
Cost Approaches by Tuan (2008). Both of the sources were used in the literature review.
4.1.2 Semi Structured Qualitative Interviews The main challenge with obtaining information through qualitative interview as a research
method is to construct the interview in a way so that it produces the type of information which
the interviewee is interested in. The qualitative research interview tries to understand the
world from the studied subjects’ point of view. In the research interview knowledge is
constructed through the interaction between the interviewer and the interviewee. The
knowledge produced through interviews thus depends on the social relationship between the
interviewer and the interviewee. The interviewer needs to create a stage where the subject
15
feels safe to talk about private events which are recorded for public use. A badly performed
interview can reproduce common opinions and prejudices if the interview itself has been very
ill prepared, and a well prepared interview can contribute to substantial new knowledge to a
field (Kvale and Brinkmann 2009).
A total of 15 semi structured qualitative interviews have been conducted in between the 3rd of
February and the 16th of February of 2012 using a translator from Suzlon. The first interview
conducted was with the husband of a taanka different then the one studied. This interview was
conducted to test questions and to gain an understanding of the possible changes that occur as
a result of taankas being constructed. 12 of the interviews have been done with the users of
the taanka. At least one interview has been conducted with either the husband or the wife of
the each of the six households included in the study and sometimes up to three interviews has
been conducted with one household when additional information was required or when there
the information given was considered unreliable. Information was considered unreliable at
times due to inconsistencies in the data given by the households who used the taanka. These
inconsistencies were mostly a result of difficulties in translation and were in one case a result
of a husband of a household claiming to carry water before the taanka was constructed while
his wife claimed that he didn’t. The later source was considered to be the most reliable
because she had fewer reasons to distort information. Several questioners have been used
during the interviews with the users of the taanka because no systematic analysis of what
changes for the stakeholders as a result of the taanka being built had been conducted
previously. Because of this new knowledge gained continually helped develop the
questioners. One interview was done with a government school teacher to get information
about the total cost for sending on child to school for a year. During the final interview an
employee from GRAVIS who had been responsible for the construction of the taanka was
interviewed about the studied taanka and information about the surrounding area. E-mail
correspondence has also been used as a way to gain information about the total cost of a
taanka and the average salary paid by GRAVIS to particular types of employees for instance.
Other common techniques within SROI to collect data from stakeholders are record keeping,
focus groups, questioners and workshops and seminars (Nicholls et al. 2009). Questioners
were not used because many of the users of the taanka were not literate and because
interviews allows for a more personal communication where questions and misunderstandings
can be explained. Any form of group method for interviewing the users of the taanka was

16
excluded because peer pressures might arise and that some persons might be heard more then
others.
4.3 Conducting the case study The section below describes the process of identifying what material inputs and outcomes the
stakeholders experience and the process of monetizing the positive and negative values
created by the CSR initiative.
For a complete understanding of how to use the guide used in the study it is recommended to
read through the original guide. Definitions of important concepts in SROI can be found both
in the text when an explanation was considered to be necessary and in Appendix 1.
4.3.1 Identifying Key Stakeholders Identifying key stakeholders consists of two steps. The first step is to make a list of all the
people affected by the activities within the scope of the study. The next step is to decide
which stakeholders are relevant. Stakeholders that are relevant are those which experience a
significant change as a result of the activities (Nicholls et al. 2009).
The stakeholder identification process was done together with a representative from GRAVIS
and with three representatives from Suzlon Foundation through a workshop. The results from
this workshop were later complemented during one interview with a household that uses
water from a different taanka then the one studied in order to create a broader understanding
of stakeholders which might be effect by a taanka. The final part of identifying stakeholders
was done with the household who owns the studied taanka. Table 1 shows the results of the
entire process of identifying key stakeholders. A total of six stakeholder groups have been
included in the analysis and six groups have been excluded. A more detailed presentation of
the stakeholders and why they were included or excluded in the study can be found below
table 1.
Table 1: Stakeholder map
Stakeholder Include/exclude and reason for
decision
Method of involvement
Household who owns taanka Include – Target group of taanka One to one interviews with husband, wife
and eldest son of household
Neighboring households to
taanka
Include – The neighboring
households altogether use more
water from taanka then
One to one interviews with husband and/or
wife of household depending on
information needs and availability of

17
household who owns taanka persons
Suzlon Include – Responsible for
financial contribution for
construction of taanka and has
received a better relationship
with those who use the taanka
One to one interviews with husband or
wife of households who use taanka
Environment Include – Has not been impacted
significantly, but is included to
highlight how the environmental
impact can be measured
Interview with husband and wife of
household who owns taanka
Mason and laborers Include – Has been a central
partner in constructing the taanka
Interview with husband of household who
owns taanka
Government school Include – Several children which
previously used to carry water
now attend school
Interviews with households who use taanka
and teacher at government school attended
by children of households who use taanka
GRAVIS Exclude – No material outcomes
have been identified for
stakeholder
E-mail correspondence and interviews with
GRAVIS
Public Health and Engineering
Department (in charge of
government tube well)
Exclude – Users of taanka still
use water from the government
tube well and because of this the
stakeholder does not experience
any significant change
Interviews with households who use taanka
Panchayat raj2 Exclude – Users of taanka did
not receive any support from the
panchayat raj that they do not
receive now
Interviews with households who use taanka
Livestock Exclude – Impact on livestock is
measured through users of taanka
Interviews with households who use taanka
Community based
organization
Exclude – The number of hours
spent by stakeholder choosing
who should receive the taanka is
insignificant
Interview with GRAVIS
Hospital Exclude – Users of taanka have
not used any type of medical aid
before construction of taanka that
they do not use now
Interviews with users of taanka
2 Legislated rule by village council system practiced in the state of Rajasthan in India (Encyclopedia Britannica 2012)
18
Household who owns taanka: The household consists of 8 persons. Before the construction
of the taanka an average of 25 hours every day were spent carrying water from the
government tube well by the household (Household who owns taanka 2012). The family was
chosen as the beneficiary of the taanka because they where the ones most in need of it
according to the community based organization that on Suzlon’s behalf decide who receives
which projects. GRAVIS did not expect taanka to be used by more then one family (GRAVIS
2012).
Neighboring households to taanka: There are a total of 5 neighboring households which are
using or have used the taanka. These consist of 22 individuals located in households where
the amount of persons affected by the taanka range from 9 to 1. Altogether these households
together used to spend an average of 53 hours every day carrying water. One of the
households moved eight months before the study took place, but is included in the study
because it was affected by the taanka. In another household there is only one person that has
been affected by the taanka because the only change that occurred to this household is that
drinking water does no longer have to be carried once a day by one person from the
government tube well. In this household they only use drinking water from the taanka, while
the remaining water is taken from a private well which is not considered fit to drink from
(Neighboring households to taanka 2012).
Suzlon: The company has indirectly contributed to the funding of the taanka by supporting
GRAVIS to implement projects in Govindpura village. By funding the project relations that
were previously considered “very bad” (1 of 5) by the users of the taanka have significantly
improved to an average of “very good” (5 of 5) (Household who owns taanka 2012;
Neighboring households to taanka 2012).
Environment: The construction of the taanka has lead to an increased environmental impact
from the users of taanka’s water consumption. Because water is being transported from the
government tube well to the taanka when rains do not occur greenhouse gases are being
released from the tractor transporting the water. Before the taanka was constructed water
could not be transported by tractor because there was no place to store large quantities of
water (Household who owns taanka 2012). Due to the increased water source proximity the
users of the taanka have increased their water consumption. This aspect has not been included
in the study due to resource constraints for studying if the current level of water usage is
sustainable or not. A GRAVIS employee responsible for planning the construction of the

19
taanka stated that he believed that the increased water usage was sustainable however,
(GRAVIS 2012) and the household who owns the taanka (2012) said that the government
tube well had never in the past ceased to be operational due to excessive water usage.
Mason and laborers: The taanka was constructed by one qualified mason and two unskilled
laborers paid by the owner of taanka (Household who owns taanka 2012). These are included
because they were responsible for the construction of the taanka.
Government school: The government school in the study was attended by the children of the
households who use the taanka as a result of them not having to carry water anymore from the
government tube well. It was included in the study because the opportunity by the children to
attend school does create increased costs for the school.
GRAVIS: They were not included in the analysis because no material change has occurred to
them as a result of the taanka being constructed. Their inputs into the taanka have however
been highlighted to show the resources spent on planning and following up the social value
created by the taanka.
Public Health and Engineering Department: The organization is responsible for the
government tube well which the users of the taanka received most of their water from prior to
the construction of the taanka. The increased water usage which is a result of the taanka being
constructed (Neighboring households to taanka 2012; Household who owns taanka 2012)
could possibly affect the maintenance costs of the tube well, but because the study only
focused on one taanka this change should not be significant.
Panchayat raj: The panchayat raj was identified as a stakeholder because it is possible that
some stakeholders received support from the panchayat raj before the construction of the
taanka. If this would have been true then the construction of the taanka might have lead to
financial savings. Interviews did however confirm that none of the households received any
financial support from the panchayat raj that they didn’t receive after the construction of the
taanka (Neighboring households to taanka 2012; Household who owns taanka 2012).
Livestock: Livestock was identified as a stakeholder because they might experience change
as a result of the taanka being constructed if they use the taanka. The effects on livestock are
however measured through benefits for the households who use the taanka.

20
Community based organization: These types of organizations are set up by GRAVIS in
order to empower communities in which they operate and create community ownership for
development issues addressed. Community based organizations consist of members from the
community to represent their voice (GRAVIS website b). They were excluded in the analysis
since their part in planning the construction of this taanka is only represented by about five to
six meetings lasting approximately two hours where the taanka was one of several topics
discussed (GRAVIS 2012).
Hospital: The hospital was identified as a stakeholder because it would be possible that some
of the households that were affected by the taanka did experience health problems that they
sought medical aid for before the construction of the taanka. Since they did not seek any
medical aid for either water quality issues or any symptoms from carrying water from the
government tube well before the construction of the taanka the hospital was excluded as a
stakeholder (Neighboring households to taanka 2012; Household who owns taanka 2012).
4.3.2 Identifying inputs and giving them a value In order for the taanka to be built and continue to deliver value several stakeholders have
contributed with inputs. The process of identifying these inputs is described below.
The contribution made by each stakeholder in order for the activity to happen is the input.
Examples of inputs are money and time. After inputs have been indentified the value of these
inputs need to be monetized (Nicholls et al. 2009). The inputs used during the period of
analysis of the taanka are either financial expenses or contributions in the form of time which
have been monetized. Table 2 shows the result of the process of identifying and valuing
inputs during the entire study period.
Table 2: Identifying and valuing inputs
Stakeholder Type of input Value of input (x1000) Total percentage of
input
Household who owns
taanka
Value of time for
construction of taanka
2,6 INR 7 %
Household who owns
taanka
Value of time for
maintenance of taanka
1,4 INR 4 %
Household who owns
taanka
Money paid for
construction of taanka
4,5 INR 11 %
Household who owns
taanka
Money paid for refilling
of taanka
2,5 INR 6 %

21
Neighboring households
to taanka
Money paid for refilling
of taanka
7,3 INR 18 %
Suzlon Financial contribution for
construction of taanka
15,2 INR 38 %
GRAVIS Time spent planning
construction of taanka
0,4 INR 1 %
Mason and laborers Value of time spent
constructing the taanka
6,4 INR
16 %
Total value of inputs 40 INR
The household who owns the taanka has contributed with time for both the construction and
the maintenance of the taanka (Household who owns taanka 2012). This time has been
monetized using the wage of 175 INR/day which GRAVIS typically pays unskilled workers
(Praveen Kumar Bera, February 13, 2012, e-mail message to author). The unskilled workers
wage used to value the time is higher then the minimum wage in Rajasthan for unskilled
workers in the cement prostrated project industry (135 INR/DAY) (Paycheck.in website), but
is lower then the daily wage that most of the users of the taanka make during stone mining
(Household who owns taanka 2012; Neighboring households to taanka 2012). The money
paid for the construction of the taanka was paid to the mason and two laborers to help the
family in the construction. In order to refill the taanka the family pays an entrepreneur. The
money paid for refilling the taanka represents an estimate of how many times the household
who owns the taanka pays for refilling the taanka in one year (Household who owns taanka
2012).
Four out of five of the neighboring households to the taanka give a monthly contribution to
the owner of the taanka to have the taanka refilled. Their estimated average financial
contribution is represented by the input money paid for refilling of taanka by the neighboring
households to the taanka (Neighboring households to taanka 2012).
Suzlon has indirectly been funding the taanka construction through GRAVIS. The financial
contribution made by Suzlon has been calculated by adding the estimated costs of the
materials used to construct a taanka (Praveen Kumar Bera, February 13, 2012, e-mail message
to author).
GRAVIS contribution in the form of time spent constructing the taanka has been calculated
by adding average time used by GRAVIS to plan the construction of one taanka with an
average GRAVIS salary (GRAVIS 2012).
22
The mason and laborers received a salary from the owner of the taanka which was more of a
reflection of the available money that the owner could spare then what an actual market wage
should be (Household who owns taanka 2012). Therefore their time which exceeds the
financial contribution given to them has been valued according to a typical salary paid by
GRAVIS to a mason and to two unskilled workers for their time.
4.3.3 Mapping outcomes, evidencing them and giving them a value The construction of the taanka has lead to outcomes for many of the stakeholders which are
represented by positive and negative social, ecological and economic values. The process of
identifying these outcomes, evidencing them and valuing them is described below.
SROI as a measurement tool is outcome based because the only way to make sure that a
change is taking place is to measure outcomes. Within a training program that is supposed to
create jobs for people the training can be described as an output, and getting a job is an
outcome. In deciding outcomes both the organizational objectives and the stakeholders’
opinions are to be taken into account. SROI as a methodology is therefore described as
stakeholder informed rather then stakeholder lead (Nicholls et al. 2009).
The first part of identifying outputs and outcomes was done during the same workshop
mentioned above where stakeholders were identified. Information from this workshop
regarding possible outputs and outcomes was then complemented during interviews with the
household which used a different taanka then the one studied. The users of the studied taanka
were also asked open ended questions throughout the whole interviewing process so that they
themselves would be given the opportunity to describe the change that they did experience.
In order to make sure that an outcome has taken place indicators are used. In order to establish
values to things that do not have a market price proxies are used in SROI. A proxy is a
subjective estimation of the value created by an outcome (Nicholls et al. 2009). Indicators to
measure the amount of stakeholders experiencing the outcome and proxies used to value the
outcomes were tested during the pilot interview mentioned above and complemented during
the interviews with the interviews with the users of the taanka. Different proxies to use have
throughout the whole study been discussed with co-workers from Suzlon and GRAVIS.
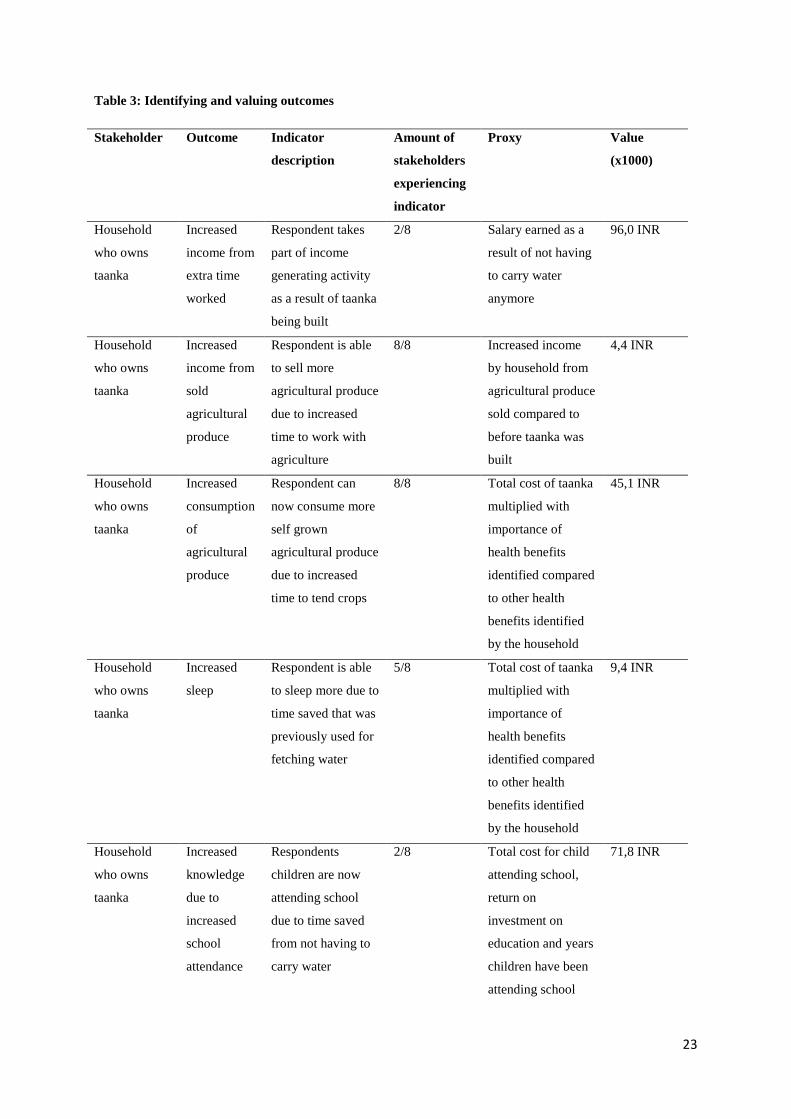
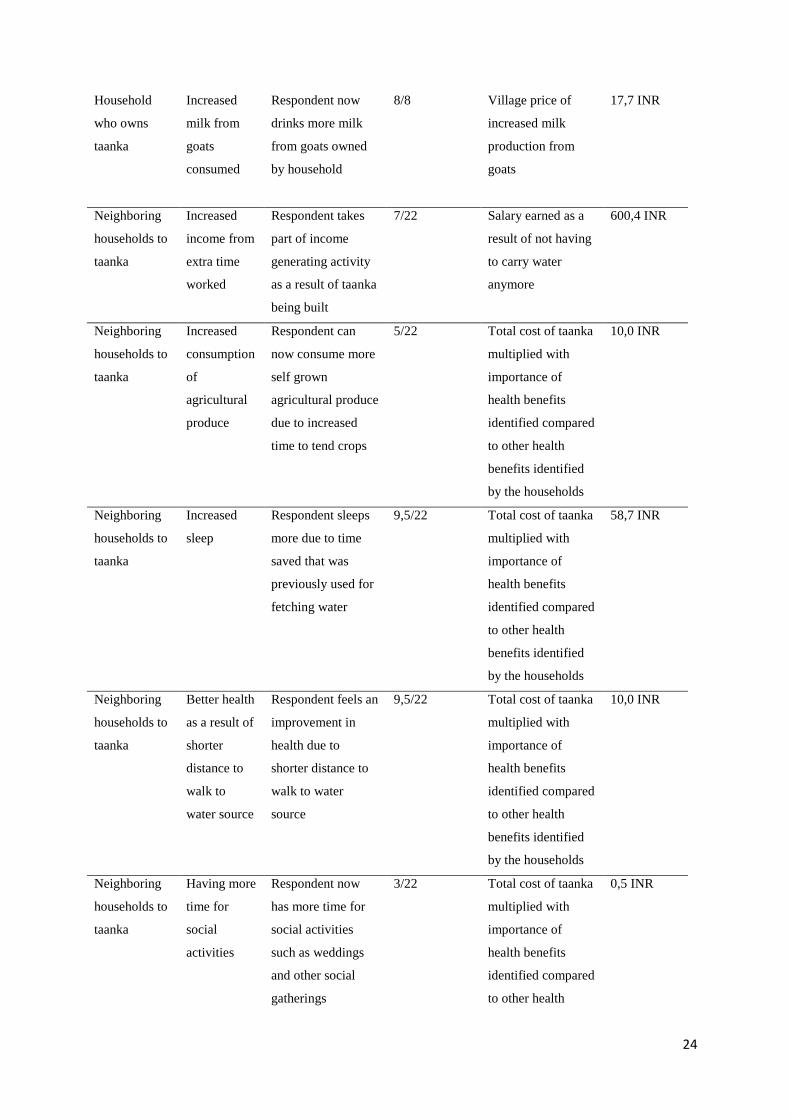
Table 3 shows the result of the process identifying outcomes, indicators to measure the
outcomes, outcome incidences, proxies to used to monetize the outcomes and value created by
the outcomes. The values given in the table represent the total value creation during the study
period. An explanation for the proxies used is given below the table.
23
Table 3: Identifying and valuing outcomes
Stakeholder Outcome Indicator
description
Amount of
stakeholders
experiencing
indicator
Proxy Value
(x1000)
Household
who owns
taanka
Increased
income from
extra time
worked
Respondent takes
part of income
generating activity
as a result of taanka
being built
2/8
Salary earned as a
result of not having
to carry water
anymore
96,0 INR
Household
who owns
taanka
Increased
income from
sold
agricultural
produce
Respondent is able
to sell more
agricultural produce
due to increased
time to work with
agriculture
8/8 Increased income
by household from
agricultural produce
sold compared to
before taanka was
built
4,4 INR
Household
who owns
taanka
Increased
consumption
of
agricultural
produce
Respondent can
now consume more
self grown
agricultural produce
due to increased
time to tend crops
8/8
Total cost of taanka
multiplied with
importance of
health benefits
identified compared
to other health
benefits identified
by the household
45,1 INR
Household
who owns
taanka
Increased
sleep
Respondent is able
to sleep more due to
time saved that was
previously used for
fetching water
5/8 Total cost of taanka
multiplied with
importance of
health benefits
identified compared
to other health
benefits identified
by the household
9,4 INR
Household
who owns
taanka
Increased
knowledge
due to
increased
school
attendance
Respondents
children are now
attending school
due to time saved
from not having to
carry water
2/8 Total cost for child
attending school,
return on
investment on
education and years
children have been
attending school
71,8 INR
24
Household
who owns
taanka
Increased
milk from
goats
consumed
Respondent now
drinks more milk
from goats owned
by household
8/8 Village price of
increased milk
production from
goats
17,7 INR
Neighboring
households to
taanka
Increased
income from
extra time
worked
Respondent takes
part of income
generating activity
as a result of taanka
being built
7/22 Salary earned as a
result of not having
to carry water
anymore
600,4 INR
Neighboring
households to
taanka
Increased
consumption
of
agricultural
produce
Respondent can
now consume more
self grown
agricultural produce
due to increased
time to tend crops
5/22
Total cost of taanka
multiplied with
importance of
health benefits
identified compared
to other health
benefits identified
by the households
10,0 INR
Neighboring
households to
taanka
Increased
sleep
Respondent sleeps
more due to time
saved that was
previously used for
fetching water
9,5/22 Total cost of taanka
multiplied with
importance of
health benefits
identified compared
to other health
benefits identified
by the households
58,7 INR
Neighboring
households to
taanka
Better health
as a result of
shorter
distance to
walk to
water source
Respondent feels an
improvement in
health due to
shorter distance to
walk to water
source
9,5/22
Total cost of taanka
multiplied with
importance of
health benefits
identified compared
to other health
benefits identified
by the households
10,0 INR
Neighboring
households to
taanka
Having more
time for
social
activities
Respondent now
has more time for
social activities
such as weddings
and other social
gatherings
3/22 Total cost of taanka
multiplied with
importance of
health benefits
identified compared
to other health
0,5 INR

25
benefits identified
by the households
Neighboring
households to
taanka
Increased
milk from
goats
consumed
Respondent now
drinks more milk
from goats owned
by household
21/22 Village price of
increased milk
production from
goats
110,0 INR
Neighboring
households to
taanka
Increased
personal
hygiene
Respondent uses
more water due to
closer proximity to
water source to
shower and to clean
clothes and utensils
19/22 Total cost of taanka
multiplied with
importance of
health benefits
identified compared
to other health
benefits valued by
the households
10,3 INR
Neighboring
households to
taanka
Increased
knowledge
due to
increased
school
attendance
Respondents
children are now
attending school
due to time saved
from not having to
carry water
2/22 Total cost for child
attending school,
return on
investment on
education and years
children have been
attending school
71,8 INR
Suzlon Increased
reputation
Users of taanka
have indicated that
their relationship
with Suzlon has
changed in a
positive way due to
CSR project
undertaken
1/1 Suzlon's indirect
financial
contribution to the
construction of the
taanka through
GRAVIS
15,2 INR
Environment Increased
CO2
emissions
into the
atmosphere
Greenhouse gases
have been released
into the
environment
1/1 Value of
greenhouse gas
emissions from
tractor transporting
water from
government tube
well
-0,4 INR
Mason and
laborers
Salary
received for
time spent
Owner of taanka
has stated that
taanka was
3/3 Money paid by
owner of taanka
4,5 INR

26
constructing
the taanka
constructed by one
mason and two
laborers and that
money has been
paid to them
The household who owns the taanka experiences six outcomes as a result of the taanka being
constructed. Of the outcomes experienced five have been calculated by monetizing a value.
These are increased consumption of agricultural produce, increased sleep, better health as a
result of shorter distance to walk to water source, increased milk from goats consumed and
increased knowledge due to increased school attendance. The three first mentioned have been
identified as health benefits and have been monetized by using the total cost of the taanka as a
proxy to represent their annual cumulative value and then asking household who owns the
taanka to indicate the importance of the health benefits in between each other. After this the
relative importance of the health benefits has then been multiplied with the total cost to get
the proxy for each health benefit. Using the total cost of the taanka as a proxy is a reasonable
way to measure the value of the health benefits because it is the cost to achieve these, and
using it on an annual basis is also reasonable because the value of the benefits is experienced
continuously. Willingness to pay for the health benefits achieved from the taanka was first
identified as the most appropriate method, but was abandoned because all of the households
lack of financial resources and their stated low willingness to pay (4000-10000 INR/year)
compared to the benefits achieved (Household who owns taanka 2012; Neighboring
households to taanka 2012). In another case where the stakeholder’s income level is higher
using willingness to pay is a more appropriate method because it represents the actual value
given to the outcomes by the stakeholders.
Increased milk from goats consumed has been monetized using an average village price for
goat milk of 17,5 INR/liter. The average market price for goat milk is 20-25 INR/liter
(GRAVIS 2012). Using the average village price for goat milk is more representative in this
case because the milk is consumed in the village and not sold in the market.
Increased knowledge due to increased school attendance has been monetized using the total
cost for sending one child to school in the government school attended by the users of the
taanka (Government school teacher 2012) and then adding a societal return on investment
ratio of 16,2 % for primary schooling in non-OECD Asian countries (Psacharopoulus and
Patrinos 2004). It is reasonable to use as a proxy because it shows the value given by the

27
government of India to increased education and it also highlights the extra societal value that
the increased education should produce.
The increased income due to extra time worked has been calculated by adding the stated
amount of days worked by members of households and their stated salary. All of those
interviewed said that they only worked with income generating activities for 8 months a year,
while 4 months was used to work in agriculture producing food mostly for the own household
(Household who owns taanka 2012; Neighboring households to taanka 2012).
The neighboring households to the taanka experience two health related outcomes which were
not identified or given a value compared to other health benefits by the household who owns
the taanka. These are having more time for social activities and increased personal hygiene
(Interview with neighboring households to taanka 2012). These two outcomes have been
measured and monetized in the same way as the other health benefits identified by the
household who owns the taanka. More time for social activities was identified as a benefit
from the taanka by the household who owns the taanka but not given a value compared to
other health benefits. Increased personal hygiene was not identified as a benefit from the
taanka by the owner of the taanka. Due to the low value given to the benefit by the
neighboring households to the taanka it is possible that the household who owns the taanka
did not think of this as a benefit worth mentioning.
The increased reputation experienced by Suzlon has been measured by using the total cost of
the material used for constructing the taanka (Praveen Kumar Bera, February 13, 2012, e-mail
message to author). This proxy should be considered reasonable because it reflects Suzlon’s
cost for achieving the outcome increased reputation by indirectly paying for the material used
for the construction.
Increased CO2 emissions into the atmosphere has been measured by using emission data from
a transportation of 17 tons of gravel on a Swedish country and village road (Swedish Institute
of Agricultural and Environmental Engineering 2002) using a less powerful tractor then the
one used according to the household who owns the taanka (Household who owns taanka
2012). The estimation is that the transportation takes 2 h. The emission of CO2 has been
monetized using the price of certified emission reductions on the European climate exchange
(4.83 €/ton) (Intercontinental Exchange website 2012) and have been converted from € to
INR using the Valuta.se website.
28
4.3.4 Establishing Impact The process of establishing impact in SROI is done in order to reduce the risk of over
claiming the results from the studied activity. This consists of calculating deadweight,
displacement, attribution, and drop-off rates for the outcomes identified (Nicholls et al. 2009).
Deadweight is a way to understand how much of an outcome would have happened regardless
if the activity would have taken place or not (Nicholls et al. 2009). In three areas of outcomes
deadweight has been identified. One was the likeliness that the users of the taanka would be
given another taanka or water harvesting structure by another organization then Suzlon. This
deadweight has been used for the outcomes that would occur if the users of the taanka would
be given another taanka. In Govindpura village where the studied taanka was located a total of
nine taankas had been built of which one of these where built through public funding and
eight by Suzlon. The one built through public funding was built for a family below the Indian
poverty line. Since the beneficiary of the studied taanka was not below the Indian poverty line
the household did not qualify for a government funded taanka (GRAVIS 2012). Despite of
this deadweight has been calculated as 1/9 (11%) to show that there could have been a
possibility that the beneficiaries would have received the same benefits from another
organization. No other types water harvesting structures exist in Govindpura village
(GRAVIS 2012). The second area of outcomes where deadweight has been identified is
increased reputation for Suzlon. Some of the users of the taanka have been affected by one or
several other CSR initiatives lead by Suzlon. Because of this the 4 % deadweight used for
increased reputation is based on the amount of increased relationship to Suzlon that was
attributed by stakeholders to the taanka compared to other CSR initiatives that had an impact
on them (Household who owns taanka 2012; Neighboring households to taanka 2012). The
third area where deadweight has been identified is regarding the outcome salary received for
time spent constructing the taanka by the mason and the laborers. The 55 % deadweight used
reflects the possibility that the mason and the laborers could have been employed elsewhere.
It is based on the employment level during the last census in India for the Jodhpur district
(Census of India 2001).
Displacement is a part of the impact where it is assessed how much of the outcomes have
displaced other outcomes (Nicholls et al. 2009). No displacement has been identified in this
study. The increased water usage from the users of the taanka has not resulted in decreased
water usage for other households which take water from the government tube well used for
instance.

29
Attribution is an estimate of how much of the outcomes were caused by other people or
organizations (Nicholls et al. 2009). It has been included in the study through the questioners
used during interviews, and because of this the answers given by those interviewed include a
value of attribution. An example of this is that persons who did not used to carry water before
the construction of the taanka were not asked about if they did have more time to do any type
of income generating activity as a result of the taanka being constructed because the
construction of the taanka did not create any time savings for them.
An outcome can continue to create value for a shorter or longer period of time. This is called
the benefit period. The value created by an outcome will also decrease as time goes by
because other factors will be more important then the activity done by the studied
organization. This is represented by a drop-off rate (Nicholls et al. 2009). Benefit periods
extending beyond the study period of 2,5 years have been identified for outcomes increased
knowledge due to increased school attendance and increased reputation. The 33 % drop-off
rate used for increased knowledge due to increased school attendance reflects an attribution
drop-off to show that knowledge needs to be practiced to be maintained and should after a
certain period of time not be attributed its original source. The same drop-off rate was used by
an SROI study by SERUS to reflect the value created by a course in the SROI methodology
which lasted for 6 months (Nilsson 2012). The drop-off rate regarding reputation reflects total
benefits achieved during each year compared to total benefits achieved on a yearly basis
during the first 2,5 years for the users of the taanka. In practice it has been calculated by
dividing the value created by the increased school attendance after year 2,5 with the annual
value of all the outcomes created during the first 2,5 years. This drop-off rate has been used
because there seems to be a very strong correlation between the users of the taanka’s relation
with Suzlon and the social value created by Suzlon for them.
Table 4 shows deadweight, drop-off rates and benefit periods for all of the outcomes
experienced by stakeholders. Drop-off rates showed in table 4 are linear unless otherwise
specified.
Table 4: Deadweight, drop-off and benefit period used for the outcomes
Stakeholder Outcome Deadweight Drop-off rate
after year 2,5
Benefit
period
Household who owns
taanka
Increased income from extra
time worked
11 % 100 % 2,5 years

30
Household who owns
taanka
Increased consumption of
agricultural produce
11 % 100 % 2,5 years
Household who owns
taanka
Increased sleep 11 % 100 % 2,5 years
Household who owns
taanka
Increased income from sold
agricultural produce
11% 100 % 2,5 years
Household who owns
taanka
Increased knowledge due to
increased school attendance
11 % 33 % 4,5 years
Household who owns
taanka
Increased milk from goats
consumed
11 % 100 % 2,5 years
Neighboring households
to taanka
Increased income from extra
time worked
11 % 100 % 2,5 years
Neighboring households
to taanka
Increased sleep
11 % 100 % 2,5 years
Neighboring households
to taanka
Better health as a result of
shorter distance to walk to water
source
11 % 100 % 2,5 years
Neighboring households
to taanka
Increased knowledge due to
increased school attendance
11 % 33 % 4,5 years
Neighboring households
to taanka
Increased consumption of
agricultural produce
11 % 100 % 2,5 years
Neighboring households
to taanka
Having more time for social
activities
11 % 100 % 2,5 years
Neighboring households
to taanka
Increased milk from goats
consumed
11 % 100 % 2,5 years
Neighboring households
to taanka
Increased personal hygiene
11 % 100 % 2,5 years
Suzlon Increased reputation 4 % 96% year 3,5 and
98% year 4,5
4,5 years
Environment Increased CO2 emissions into
the atmosphere
11 % 100 % 2,5 years
Mason and laborers Salary received for constructing
the taanka
55 % 100 % 2,5 years
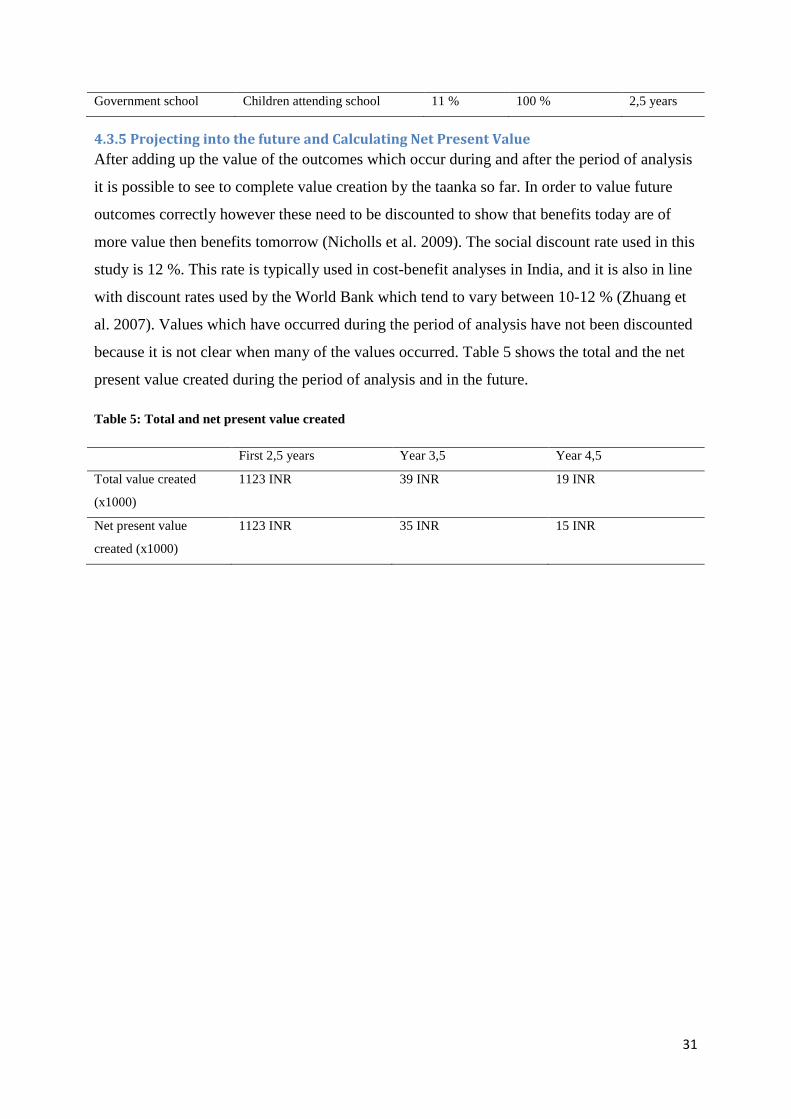
31
Government school Children attending school 11 % 100 % 2,5 years
4.3.5 Projecting into the future and Calculating Net Present Value After adding up the value of the outcomes which occur during and after the period of analysis
it is possible to see to complete value creation by the taanka so far. In order to value future
outcomes correctly however these need to be discounted to show that benefits today are of
more value then benefits tomorrow (Nicholls et al. 2009). The social discount rate used in this
study is 12 %. This rate is typically used in cost-benefit analyses in India, and it is also in line
with discount rates used by the World Bank which tend to vary between 10-12 % (Zhuang et
al. 2007). Values which have occurred during the period of analysis have not been discounted
because it is not clear when many of the values occurred. Table 5 shows the total and the net
present value created during the period of analysis and in the future.
Table 5: Total and net present value created
First 2,5 years Year 3,5 Year 4,5
Total value created
(x1000)
1123 INR 39 INR 19 INR
Net present value
created (x1000)
1123 INR 35 INR 15 INR

32
5 Results The social impact of the studied taanka can be understood by understanding the relation
between the inputs and the net present value of the outcomes created. The SROI ratio shows
how many INR of social value have been created for every INR of social value invested. In
order for the SROI ratio to be meaningful it is however important to have an understanding of
all of the choices made that were described in chapter 4 to calculate this ratio. Table 6 shows
the inputs previously described, the net present value of the outcomes and the SROI ratio.
Table 6: Inputs, net present value of outcomes and the SROI ratio
Stakeholder Description
Input
Input in
thousands
Description Outcome Net Present Value
of Outcome in
thousands
Household who owns
taanka
Value of time for
construction of
taanka
2,6 INR
Increased income from
extra time worked
96,0 INR
Household who owns
taanka
Value of time for
maintenance of
taanka
1,4 INR
Increased consumption
of agricultural produce
45,1 INR
Household who owns
taanka
Money paid for
construction of
taanka
4,5 INR
Increased sleep
9,4 INR
Household who owns
taanka
Money paid for
refilling of taanka
2,5 INR
Increased income from
sold agricultural produce
4,4 INR
Household who owns
taanka
Increased knowledge due
to increased school
attendance
96,5 INR
Household who owns
taanka
Increased milk from
goats consumed
17,7 INR
Neighboring
Households to taanka
Money paid for
refilling of taanka
7,3 INR
Increased income from
extra time worked
600,4 INR
Neighboring Increased sleep 58,7 INR
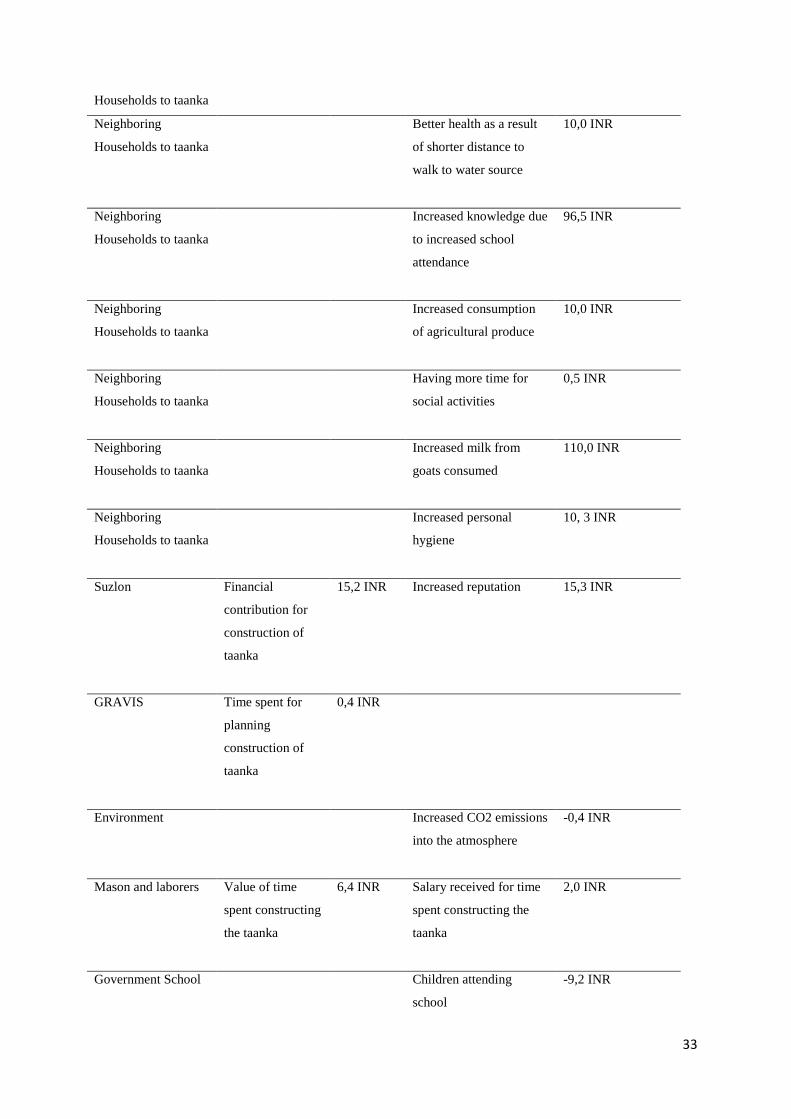
33
Households to taanka
Neighboring
Households to taanka
Better health as a result
of shorter distance to
walk to water source
10,0 INR
Neighboring
Households to taanka
Increased knowledge due
to increased school
attendance
96,5 INR
Neighboring
Households to taanka
Increased consumption
of agricultural produce
10,0 INR
Neighboring
Households to taanka
Having more time for
social activities
0,5 INR
Neighboring
Households to taanka
Increased milk from
goats consumed
110,0 INR
Neighboring
Households to taanka
Increased personal
hygiene
10, 3 INR
Suzlon Financial
contribution for
construction of
taanka
15,2 INR
Increased reputation
15,3 INR
GRAVIS Time spent for
planning
construction of
taanka
0,4 INR
Environment Increased CO2 emissions
into the atmosphere
-0,4 INR
Mason and laborers Value of time
spent constructing
the taanka
6,4 INR
Salary received for time
spent constructing the
taanka
2,0 INR
Government School Children attending
school
-9,2 INR

34
Total net present value
of outcomes
1173,1 INR
Total value of inputs 40,3 INR
SROI ratio 29:1
Except for understanding the relationship between the inputs that go into the CSR initiative
and the outcomes which the initiative have resulted in SROI can also be used to understand
the relationship between the value of outcomes and inputs which different stakeholders
experience. There are two stakeholders which experience a positive or a negative outcome
which is greater then 1 % of the total net present value of outcomes. These are the household
who owns the taanka and the neighboring household to the taanka. Figure 3 shows the relation
between the values of the outcomes experienced by all stakeholders.
Figure 3: Net present value created for each stakeholder
The relationship between inputs is more evenly distributed then the relationship between
outcomes as figure 4 shows. Interesting findings regarding the inputs is that the household
who owns the taanka is responsible for a larger share of the inputs then the neighboring
households to taanka even though it experiences about 1/4 of the benefits derived from the
taanka. Another interesting finding is that the mason and laborers contribute with almost as
Neighboring households to
taanka 896 147 INR
75%
Suzlon 15 256 INR
1%
Environment -444 INR
0%
Household who owns taanka 269 290 INR
23%
Mason and laborers
2 008 INR 0%
Government school -9 194 INR
-1%

35
much of the inputs as the neighboring households to the taanka without experiencing
outcomes which match their inputs in value.
Figure 4: Value of inputs that each stakeholder has contributed with
Neighboring households to
taanka; 7 318 INR; 18%
Household who owns taanka;
11 047 INR; 27%
Suzlon; 15 200 INR; 38%
GRAVIS; 438 INR; 1%
Environment; 0 INR; 0%
Mason and laborers; 6 375 INR;
16%
Government school; 0 INR; 0%

36
6 Discussion In this chapter the findings of the study are discussed. The chapter begins with a sensitivity
analysis discussing the monetization of the inputs and outcomes which the taanka has resulted
in. After this potential areas of improvement are brought up to highlight how future SROI
studies of taankas can be improved. The final part of the discussion is about the lessons that
can be learnt from the study undertaken for the construction of future taankas.
6.1 Sensitivity analysis A sensitivity analysis has been conducted for a number of variables used in the analysis in
order to understand the sensitivity of the SROI ratio in relation to the variables used. In the
guide it is recommended to see how much estimates made in the analysis need to be changed
in order for the SROI ratio to be 1:1. Because an SROI ratio of 1:1 would require unrealistic
changes to the findings of this study a sensitivity analysis has instead been conducted by using
an approach inspired by an SROI study by Nilsson (2012) where a number of the variables
used in the analysis were changed by 50 %. Doing this shows the importance of specific
values to the results. If one value has a big importance to the SROI ratio then it is important to
make sure that this value is reasonable in order for the study to be credible. The following
areas have been changed 50 % in a negative direction:
• Monetized inputs
• Monetized outcomes
• Quantity of outcomes
The most significant change when altering the monetized inputs is regarding value of time
spent constructing the taanka by the mason and the laborers. By changing their salaries by 50
% the SROI ratio increases by 13 %. The current value of the salary is however reasonable
because it is the typical salary paid by GRAVIS through negotiation for similar types of jobs
(GRAVIS 2012).
The most significant change when altering the monetization of outcomes is increased
knowledge due to increased school attendance which affects both the household who owns the
taanka and the neighboring households to the taanka. By changing the proxy used which is the
cost for sending one child to school for one year by 50 % the SROI ratio decreases by 8 %. To
use the total cost for sending one child to school is however a reasonable proxy because it
shows the value which the government has given to education.

37
The single largest change in the SROI ratio comes when changing the quantity of the outcome
increased income from extra time worked for the household who owns the taanka and the
neighboring households to the taanka. By deducing 50 % off the amount of extra time worked
the SROI ratio decreases with 30 %. The amount of time worked was measured using first-
and second hand estimates and it is possible that the lack of information quality has had an
impact on the study even though questions regarding time worked have been double-checked
with other members of interviewed households when this was possible.
The sensitivity analysis shows that the SROI ratio which the total value of the outcomes
divided by the inputs has resulted in should be considered reasonable. It is however important
to note that the current ratio relies heavily on the value created by the increased income from
the extra time worked by the users of the taanka. If the construction of the taanka would not
have lead to increased employment the value created would have been substantially reduced.
6.2 Potential areas of improvement for future studies There are two primary areas which have been identified as interesting to study further during
the next study.
1. Measuring how the increased water usage impacts groundwater supplies in the government
tube well in the long term is important to understand to see if the increased water usage is
sustainable. The household which owns the taanka have increased their water usage 3 times
since the construction of the taanka (Interview household who owns taanka 2012). If the water
usage is not sustainable then the value created by the taanka would change dramatically in a
negative direction.
2. Improving the relation in between the outcomes so that they are monetized in a way that
reflects the value given to them by each stakeholder is an important aspect to study further so
that the values given reflect the importance of the outcomes in between each other. The focus
of this study has been to identify outcomes experienced by the stakeholders and then finding
relevant proxies to monetize these. The relationship in between these proxies has not been
tested except for the health related outcomes experienced by the users of the taanka. This
could be useful to do in order to see how well the values used are aligned with the value given
to different outcomes by the stakeholders. By reporting back to each of the stakeholders about
the study that has been undertaken and the monetization process future studies can be
improved by using values that are in line with the stakeholders opinions. An outcome of
particular interest is to give a definition to what level of increased stakeholder relationship

38
should be considered increased reputation for Suzlon. An important stakeholder to report back
to is the users of the taanka to see if the values given to outcomes in this report are in line with
the values given to outcomes by them.
6.3 Implications of findings for the construction of future taankas The results of this study have shown that several lessons can be learnt regarding construction
of future taankas in order to optimize the social value created.
1. Each taanka should be used by as many households as possible and owned by all of those
who use it. The majority of the benefits experienced through the construction of the taanka
were felt by the neighboring households to the taanka and not by the owners of the taanka
who were intended to be the beneficiaries of the project. If they would have not been given
access to the taanka by the owners of the taanka 75 % of the total social value created would
have been lost. The inputs to the taanka have also been disproportionally carried by the
household who owns the taanka. By having a shared ownership it is more likely that the
inputs will be shared to a higher degree.
2. Suzlon should systematically follow up the positive and negative values created by taankas
built in order to learn how to use resources in the most efficient way. This study has identified
several inputs and outcomes that were not mentioned in the GRAVIS documents reviewed.
GRAVIS allocated a total of 438 INR to plan the construction of the taanka, but no resources
were used for following up the social value created. By not understanding what changes for
the stakeholders as a result of the construction of a taanka information important for
organizational learning and development is missed.
3. Persons responsible for inputs in a project should be given fair compensation for the work
that they are conducting if they are not experiencing any outcomes which are of more value
then their inputs. The mason and the laborers were responsible for the 16 % of the inputs to
the taanka without experiencing outcomes that compensated their inputs.

39
7 Conclusions In the context of this particular case study it has been proven that SROI can be a viable tool to
evaluate the performance of CSR initiatives, but some challenges with using the methodology
have been identified.
The main challenge with the methodology is that it is resource intensive in terms of time it
takes to collect information and analyze it. It is resource intensive because it looks at actual
changes taking place for the stakeholders that are experiencing them and then in some cases
uses non market proxies to represent the value of the change experienced by the stakeholders.
Measuring this is difficult to standardize beyond a certain point because value experienced
will differ from case to case even for similar CSR initiatives. Because it is a resource
intensive tool it is important to be aware of the trade-offs faced in terms of resources devoted
following up social value created and creating social value.
The results of this study do however show that SROI can be a viable tool to use when
measuring the performance of CSR initiatives. Using SROI the evaluate the social value
created by constructing the studied taanka has not only lead to an increased understanding of
social values created by this particular project, but the results of the study can also be used
when planning any future taankas. The main strength of SROI as a methodology in this study
has been that it measures the actual changes for the stakeholders which experience the change
and that the changes are monetized. Because SROI measures what actually changes for the
stakeholders affected by the CSR initiative and not organizational objectives for a certain
project it provides several opportunities for organizational learning about social value
creation. The monetization process in SROI enables comparisons to be made in between
outcomes and inputs or in between outcomes experienced by different stakeholders which
would not be possible if the outcomes would not be monetized. By understanding the relation
in between inputs and outcomes the efficiency of the resources used can be understood, and
by understanding the value of outcomes in between each other it becomes easier to understand
which type of change is more important to create.
Finally the methodology provides information about shared corporate and societal values
created. It can be used to understand the corporate inputs into a CSR initiative compared to
the outcomes created for the corporation and the other stakeholders affected. SROI therefore
helps to visualize the interdependence of business and society. The methodology also helps to
create an understanding of how the benefits from the studied CSR initiative can be tied to
40
economic interests at a business level which in turn can be useful when deciding on the
allocation of corporate resources.

41
References Angier Griffin. 2009. Measuring social value: an overview. Angier Griffin.
Arvidson, Malin, Fergus Lyon, Stephen Mckay and Domenico Moro. 2010. The ambitions
and challenges of SROI. Third Sector Research Centre.
Booth, Wayne C, Gregory G. Colomb and Josepth M. Williams. 2008. The craft of research.
London: The University of Chicago Press.
Boardman, Anthony E., David H. Greenberg, Aidan R. Vining, David L. Weimer. 2006. Cost-
benefit analysis: Concepts and practice. New Jersey: Pearson Prentice Hall.
Census of India. 2001. Basic data sheet: District Jodhpur (15), Rajasthan (08). Office of the
Registrar General & Census Commissioner.
Flick, Uwe. 2009. An introduction to qualitative research. London: SAGE Publication.
Gibbon, Jane and Colin Dey. 2011. Developments in social impact in the third sector: scaling
up or dumbing down? Social and Environmental Accountability Journal 31, no. 1: 63-72.
Global Reporting Initiative. 2008. Reporting on community impacts. Global Reporting
Initiative.
Government of India Planning Commission. 2011. Report of the task force on grasslands and
deserts. New Delhi: Government of India Planning Commission.
Government school teacher. 2012. Interview by author. Govindpura, Rajasthan, India.
February 16.
GRAVIS. 2003a. Harvesting the rains in the Thar. Jodhpur: GRAVIS.
GRAVIS. 2003b. Traditional agricultural and water technologies of the Thar. Jodhpur:
GRAVIS.
GRAVIS 2012. Interview by author. Govindpura, Rajasthan, India. February 16.
GRAVIS website a. About us.
http://www.gravis.org.in/index.php?option=com_content&task=view&id=37&Itemid=27
(accessed April 18, 2012).
GRAVIS website b. Strategic focus.
http://www.gravis.org.in/index.php?option=com_content&task=view&id=58&Itemid=64
(accessed April 18, 2012).

42
Henriques, Adrian. 2010. Corporate impact: measuring and managing your social footprint.
London: Earthscan.
Household who owns the taanka. 2012. Interview by author. Govindpura, Rajasthan, India.
February 3, February 8 and February 16.
Intercontinental Exchange website. Emissions.
https://www.theice.com/productguide/ProductGroupHierarchy.shtml?groupDetail=&group.gr
oupId=19 (accessed February 12, 2012).
ISO 26000:2010. 2010. Guidance on social responsibility. Swedish Standards Institute.
Karoly, Lynn A. 2008. Valuing benefits in cost-benefit studies of social programs. RAND
Corporation.
Kvale, Steinar and Svend Brinkmann. 2009. Interviews: Learning the craft of qualitative
research interviewing. United States of America: SAGE Publications.
Lindgren, Magnus, Ola Petterson, Per-Anders Hansson, Olle Norén. 2002. Engine load
pattern and engine exhaust gas emissions from off-road vehicles and methods to reduce fuel-
consumption and engine exhaust gas emissions. Swedish Institute of Agricultural and
Environmental Engineering.
Margolis, Joshua D. and James P. Walsh. 2003. Misery loves companies: Rethinking social
initiatives by business. Administrative Science Quarterly 48: 268-305.
May, Steve, George Cheney and Juliet Roper. 2007. The debate over corporate social
responsibility. New York: Oxford University Press.
Neighboring households to the taanka. 2012. Interview by author. Govindpura, Rajasthan,
India. February 3, February 8 and February 16.
Nicholls, Jeremy, Eilis Lawlor, Eva Neizert and Tim Goodspeed. 2009. A guide to social
return on investment. Ed. Sally Cupitt. Cabinet Office: Office of the Third Sector.
Nicholls, Jeremy, Eilis Lawlor, Eva Neizert and Tim Goodspeed. 2012. A guide to social
return on investment. Ed. Sally Cupitt. Cabinet Office: Office of the Third Sector.
Nilsson, Erik. 2012. The outcomes and value of SOUL’s advanced SROI training course.
SERUS.
Paycheck.in website. Minimum wages in Rajasthan. Indian Institute of Management in
Ahmedabad and Wageindicator.org.

43
http://www.paycheck.in/main/salary/officialminimumwages/rajasthan (accessed April 18,
2012).
Peloza, John and Jingzhi Shang. 2010. How can corporate social responsibility activities
create value for stakeholders? A systematic review. Academy of Marketing and Science 39:
117-135.
Porter, Michael E and Mark R. Kramer. 2006. Strategy and society: The link between
competitive advantage and corporate social responsibility. Harvard Business Review
December.
Porter, Michael E and Mark R. Kramer. 2011. Creating shared value: How to reinvent
capitalism – and unleash a new wave of innovation and growth. Harvard Business Review
January-February.
Psacharopoulus, George and Harry Anthony Patrinos. 2004. Returns to investment in
education: A further update. Education Economics 12, no. 2 [August].
Scholten, Peter, Jeremy Nicholls, Sara Olsen and Brett Galimidi. 2006. Social Return on
Investment: A guide to SROI analysis. Amsterdam: Lenthe Publishers
Scottish Centre for Regeneration. 2010. Briefing paper 13: Embracing Social Return on
Investment. The Scottish Government.
SERUS. 2010. SROI: Social return on investment. SERUS.
Social Audit Network. What is social accounting and audit.
http://www.socialauditnetwork.org.uk/getting-started/what-is-social-accounting-and-audit/
(accessed April 18, 2012).
Suzlon. Company profile. http://www.suzlon.com/about_suzlon/l2.aspx?l1=1&l2=1 (accessed
April 18, 2012).
Suzlon Foundation. 2010. CSR annual report 2009-2010. Suzlon Foundation.
Suzlon Foundation. 2011. CSR story Rajasthan, 2007-2010. Suzlon Foundation.
Suzlon Foundation website a. About us.
http://www.suzlonfoundation.org/suzlon_foundation.html (accessed April 18, 2012).
Suzlon Foundation website b. Mission. http://www.suzlonfoundation.org/mission.html
(accessed April 18, 2012).
44
Söderbaum, Peter. 2008. Understanding sustainability economics: Towards pluralism in
economics. Cornwall: Earthscan.
Tuan, Melinda T. 2008. Measuring and/or estimating social value creation: Insights into eight
integrated cost approaches. Bill & Melinda Gates foundation.
Valuta.se. Omvandlare. Euroinvestor. http://www.valuta.se/ (accessed February 12, 2012).
Wood, Claudia and Daniel Leighton. 2010. Measuring social value: the gap between policy
and practice. London: Demos.
Zappalà, Gianni and Mark Lyons. 2009. Recent approaches to measuring value in the third
sector: An overview. The Centre for Social Impact.
Zhuang, Juzhong, Zhihong Liang, Tun Lin, and Franklin de Guzman. 2007. Theory and
practice in choice of social discount rate for cost-benefit analysis: a survey. Manila: Asian
Development Bank.

45
Appendix 1 - Glossary Unless mentioned the definitions below have been taken from the guide used (Nicholls et al.
2009) to conduct the SROI study
Attribution - An assessment of how much of the outcome was caused by the contribution of
other organizations or people
Deadweight - A measure of the amount of outcome that would have happened even if the
activity had not taken place
Discounting - The process by which future financial costs and benefits are recalculated to
present-day values
Discount rate - The interest rate used to discount future costs and benefits to a present value
Displacement - An assessment of how much of the outcome has displaced other outcomes
Drop-off - The deterioration of an outcome over time
Impact - The difference between the outcome for participants, taking into account what would
have happened anyway, the contribution of others and the length of time the outcomes last
Inputs – The contributions made by each stakeholder that are necessary for the activity to
happen
Materiality – Information is material if its omission has the potential the affect the readers or
stakeholders decisions
Monetize – To assign a financial value to something
Net present value – The value in today’s currency of money minus the investment required to
generate the activity
Outcome – The changes resulting from an activity. The main types of change from the
perspective of the stakeholder are unintended (unexpected) and intended (expected), positive
and negative change
Outputs – A way of describing the activity in relation to each stakeholder
Outcome indicator – Well-defined measure of an outcome

46
Panchayat raj – Legislated rule by village council system practiced in the state of Rajasthan in
India (Encyclopedia Britannica 2012)
Proxy – An approximation of value where an exact measure is impossible to obtain
Scope – The activities, timescales and type of SROI analysis
Sensitivity analysis – Process of which the sensitivity of an SROI model to changes in
different variable is assessed
SROI ratio – The present value of the impact divided by total investment
Stakeholders (when mentioned in relation to SROI) – People, organizations or entities that
experience change, whether positive or negative, as a result of the activity being analyzed
Stakeholders – People or organizations affected by an organization's activities
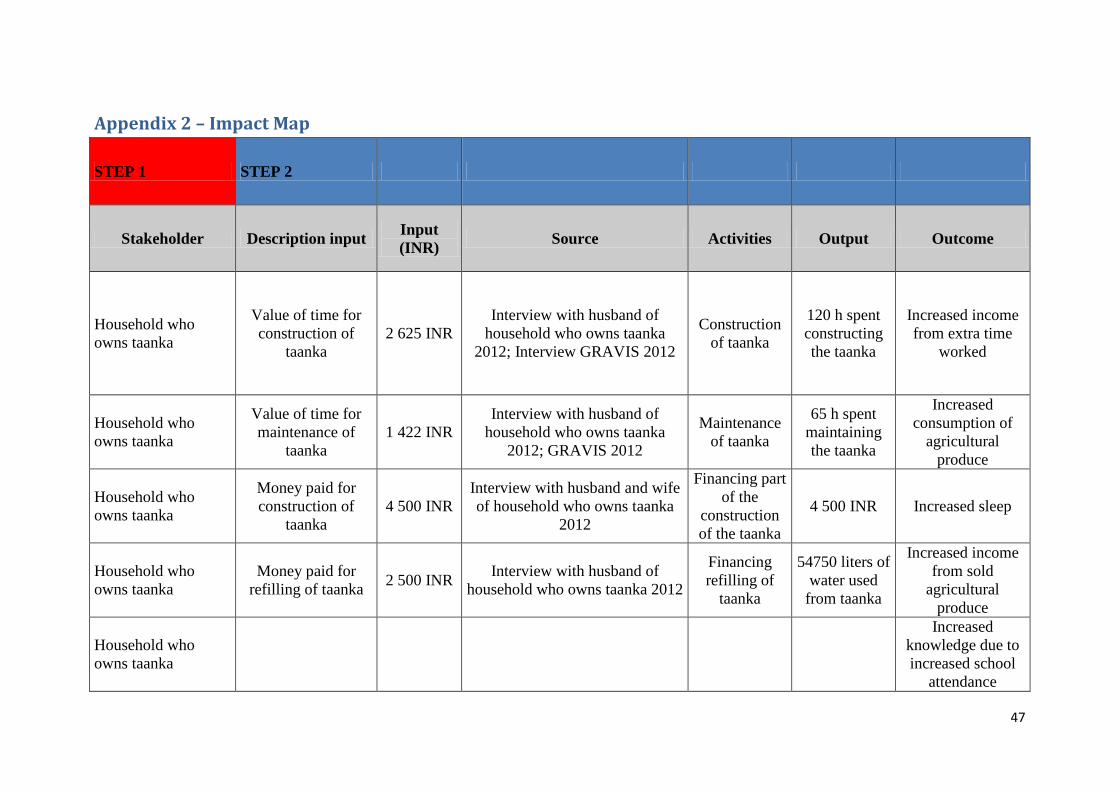
47
Appendix 2 – Impact Map
STEP 1 STEP 2
Stakeholder Description input Input (INR) Source Activities Output Outcome
Household who owns taanka
Value of time for construction of
taanka 2 625 INR
Interview with husband of household who owns taanka
2012; Interview GRAVIS 2012
Construction of taanka
120 h spent constructing the taanka
Increased income from extra time
worked
Household who owns taanka
Value of time for maintenance of
taanka 1 422 INR
Interview with husband of household who owns taanka
2012; GRAVIS 2012
Maintenance of taanka
65 h spent maintaining the taanka
Increased consumption of
agricultural produce
Household who owns taanka
Money paid for construction of
taanka 4 500 INR
Interview with husband and wife of household who owns taanka
2012
Financing part of the
construction of the taanka
4 500 INR Increased sleep
Household who owns taanka
Money paid for refilling of taanka 2 500 INR Interview with husband of
household who owns taanka 2012
Financing refilling of
taanka
54750 liters of water used
from taanka
Increased income from sold
agricultural produce
Household who owns taanka
Increased knowledge due to increased school
attendance

48
Household who owns taanka
Increased milk from goats consumed
Neighboring households to taanka
Money paid for refilling of taanka 7 318 INR
Interview with husband and/or wife of each of the neighboring
households to taanka 2012
Financing refilling of
taanka
71175 liters of water used
from taanka
Increased income from extra time
worked
Neighboring households to taanka Increased sleep
Neighboring households to taanka
Better health as a result of shorter
distance to walk to water source
Neighboring households to taanka
Increased knowledge due to increased school
attendance
Neighboring households to taanka
Increased consumption of
agricultural produce
Neighboring households to taanka Having more time
for social activities
Neighboring households to taanka
Increased milk from goats consumed
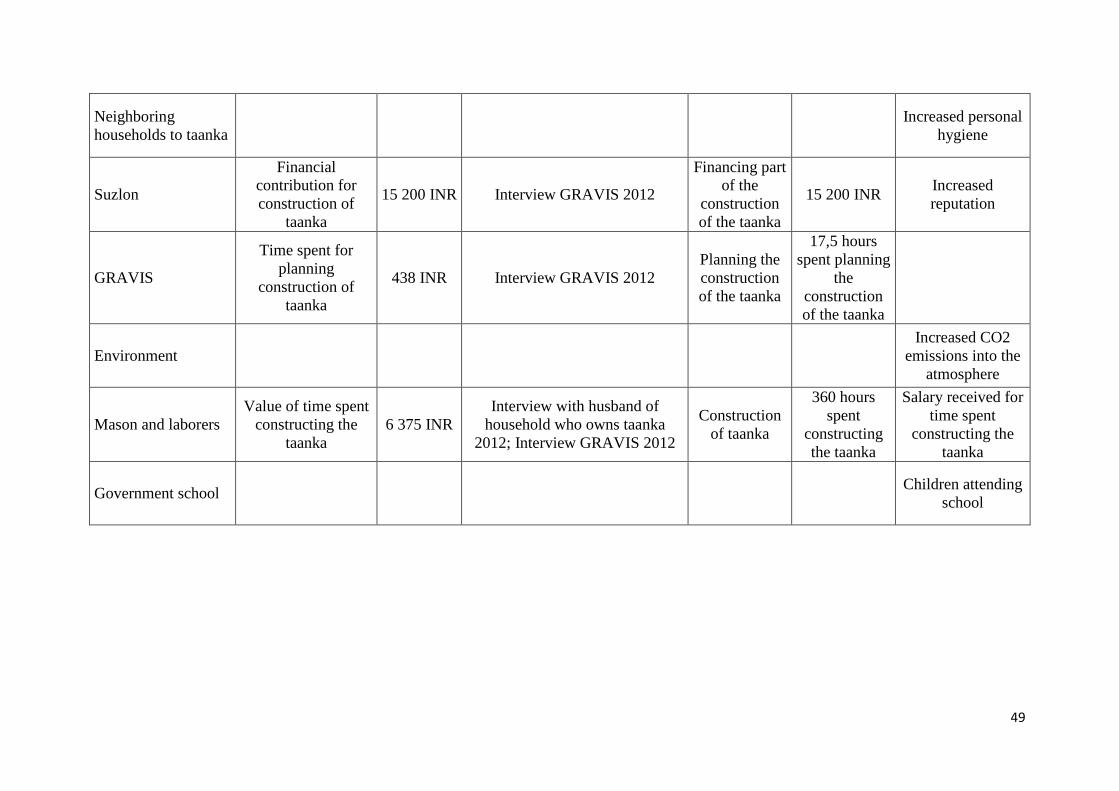
49
Neighboring households to taanka Increased personal
hygiene
Suzlon
Financial contribution for construction of
taanka
15 200 INR Interview GRAVIS 2012
Financing part of the
construction of the taanka
15 200 INR Increased reputation
GRAVIS
Time spent for planning
construction of taanka
438 INR Interview GRAVIS 2012 Planning the construction of the taanka
17,5 hours spent planning
the construction of the taanka
Environment Increased CO2
emissions into the atmosphere
Mason and laborers Value of time spent
constructing the taanka
6 375 INR Interview with husband of
household who owns taanka 2012; Interview GRAVIS 2012
Construction of taanka
360 hours spent
constructing the taanka
Salary received for time spent
constructing the taanka
Government school Children attending school

50
STEP 3
Indicator Source Quantity
of change
Benefit period
Drop off rate after the first 2,5 years
Description proxy Proxy (INR) Source
Stakeholder takes part of income
generating activity as a result of
taanka being built
Interview with husband and eldest son of household who owns taanka
2012
13% 2,5 years 100%
Calculated by adding actual salary, extra days worked in month
compared to before taanka, months worked in a year with total years that taanka has existed divided by persons
which have worked more
108 000 INR
Interview with husband and eldest son of household who owns taanka
2012
Stakeholder consumes more
self grown agricultural
produce due to increased time to
tend crops. Respondent has
also indicated that this health effect
has a value compared to other
health effects identified
Interview with husband and wife of household who owns taanka 2012
100% 2,5 years 100%
Total cost of taanka * importance of health benefits compared to other
health benefits * years used taanka / persons in household
6 349 INR
Interview with husband and wife of household who owns taanka 2012
Stakeholder sleeps more due to time saved that was previously used
Interview with husband and wife of household who owns taanka 2012
63% 2,5 years 100%
Total cost of taanka * importance of health benefits compared to other
health benefits * years used taanka / persons in household
2 116 INR
Interview with husband and wife of household who owns taanka 2012
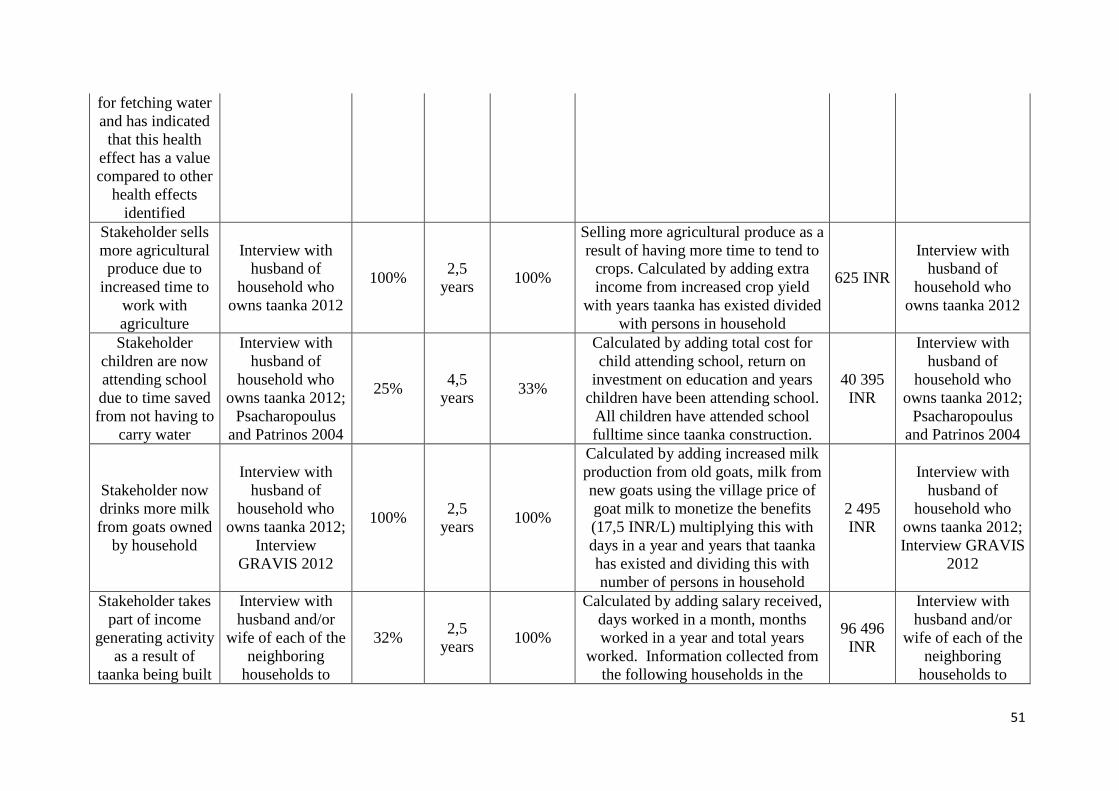
51
for fetching water and has indicated
that this health effect has a value compared to other
health effects identified
Stakeholder sells more agricultural produce due to
increased time to work with agriculture
Interview with husband of
household who owns taanka 2012
100% 2,5 years 100%
Selling more agricultural produce as a result of having more time to tend to
crops. Calculated by adding extra income from increased crop yield
with years taanka has existed divided with persons in household
625 INR
Interview with husband of
household who owns taanka 2012
Stakeholder children are now attending school due to time saved from not having to
carry water
Interview with husband of
household who owns taanka 2012;
Psacharopoulus and Patrinos 2004
25% 4,5 years 33%
Calculated by adding total cost for child attending school, return on
investment on education and years children have been attending school.
All children have attended school fulltime since taanka construction.
40 395 INR
Interview with husband of
household who owns taanka 2012;
Psacharopoulus and Patrinos 2004
Stakeholder now drinks more milk from goats owned
by household
Interview with husband of
household who owns taanka 2012;
Interview GRAVIS 2012
100% 2,5 years 100%
Calculated by adding increased milk production from old goats, milk from new goats using the village price of goat milk to monetize the benefits (17,5 INR/L) multiplying this with days in a year and years that taanka has existed and dividing this with number of persons in household
2 495 INR
Interview with husband of
household who owns taanka 2012; Interview GRAVIS
2012
Stakeholder takes part of income
generating activity as a result of
taanka being built
Interview with husband and/or
wife of each of the neighboring
households to
32% 2,5 years 100%
Calculated by adding salary received, days worked in a month, months worked in a year and total years
worked. Information collected from the following households in the
96 496 INR
Interview with husband and/or
wife of each of the neighboring
households to

52
taanka 2012 following order: Devaram, Durgaram, Vishnuram, Madanram
taanka 2012
Stakeholder sleeps more due to time saved that was previously used
for fetching water and has indicated
that this health effect has a value compared to other
health effects identified
Interview with husband and/or
wife of each of the neighboring
households to taanka 2012
43% 2,5 years 100%
Total cost of taanka * importance of health benefits compared to other
health benefits / number of individuals effected by taanka * total amount of years taanka has been used
for. Health benefits experienced by Vishnuram household have been multiplied by years used taanka
divided by total years taanka has been in use. Information collected from
the following households in the following order: Devaram, Durgaram,
Sohanram, Vishnuram
6 952 INR
Interview with husband and/or
wife of each of the neighboring
households to taanka 2012
Stakeholder feels an improvement in
health due to shorter distance to
walk to water source and has
indicated that this health effect has a value compared to
other health effects identified
Interview with husband and/or
wife of each of the neighboring
households to taanka 2012
43% 2,5 years 100%
Total cost of taanka * importance of health benefits compared to other
health benefits / number of individuals effected by taanka * total amount of years taanka has been used
for. Health benefits experienced by Vishnuram household have been multiplied by years used taanka
divided by total years taanka has been in use. Information collected from
the following households in the following order: Devaram, Durgaram,
Sohanram, Vishnuram
1 180 INR
Interview with husband and/or
wife of each of the neighboring
households to taanka 2012

53
Stakeholder is now attending
school due to time saved from not having to carry
water
Interview with husband of
household who owns taanka 2012;
Psacharopoulus and Patrinos 2004
9% 4,5 years 33%
Calculated by adding total cost for child attending school, return on
investment on education and years children have been attending school.
All children have attended school fulltime since taanka construction.
40 395 INR
Interview with husband of
household who owns taanka 2012;
Psacharopoulus and Patrinos 2004
Stakeholder can now consume
more self grown agricultural
produce due to increased time to
tend crops and has indicated that this health effect has a value compared to
other health effects identified
Interview with husband and/or
wife of each of the neighboring
households to taanka 2012
23% 2,5 years 100%
Total cost of taanka * importance of health benefits compared to other
health benefits / number of individuals effected by taanka * total amount of years taanka has been used
for. Health benefits experienced by Vishnuram household have been multiplied by years used taanka
divided by total years taanka has been in use. Information collected from the following households in the following
order: Durgaram, Sohanram, Vishnuram
2 239 INR
Interview with husband and/or
wife of each of the neighboring
households to taanka 2012
Stakeholder now has more time for social activities
such as weddings, meetings and
religious activities etc. and has
indicated that this health effect has a value compared to
other health effects identified
Interview with husband and/or
wife of each of the neighboring
households to taanka 2012
14% 2,5 years 100%
Total cost of taanka * importance of health benefits compared to other
health benefits / number of individuals effected by taanka. Health benefits experienced by Vishnuram household have been multiplied by years used taanka divided by total
years taanka has been in use. Information collected from the
following households in the following order: Sohanram, Vishnuram.
205 INR
Interview with husband and/or
wife of each of the neighboring
households to taanka 2012

54
Stakeholder now drinks more milk from goats owned
by household
Stakeholder now drinks more milk from goats owned
by household
95% 2,5 years 100%
Calculated by adding increased milk production from old goats, milk from new goats using the village price of 1
L of goat milk to monetize the benefits (17,5 INR/L) and dividing
this with the amount of persons living in the households multiplying this with amount of years taanka has existed for. Attribution (2,5/6)
included in one case where user (Devaram) did use water from other
water source then taanka. Information collected from the following
households in the following order: Devaram (attribution included),
Durgaram, Sohanram, Vishnuram
5 876 INR
Interview with husband and/or
wife of each of the neighboring
households to taanka 2012;
Interview GRAVIS 2012
Stakeholder uses more water due to closer proximity
to water source to shower, clean clothes and
utensils and has indicated that this health effect has a value compared to
other health effects identified
Stakeholder uses more water due to closer proximity to
water source to shower, clean clothes and
utensils and has indicated that this health effect has a value compared to other health effects
identified
100% 2,5 years 100%
Total cost of taanka * importance of health benefits compared to other
health benefits / number of individuals effected by taanka. Health benefits experienced by Vishnuram household have been multiplied by years used taanka divided by total
years taanka has been in use. Information collected from the
following households in the following order: Devaram, Sohanram, and
Vishnuram.
612 INR
Interview with husband and/or
wife of each of the neighboring
households to taanka 2012
Users of taanka have indicated that their relationship with Suzlon has
Interview with husband and/or
wife of each of the neighboring
100% 4,5 years
96 % year 3,5 and 98 % year 4,5
Calculated by adding Suzlon’s indirect financial contribution to the construction of the taanka through
GRAVIS. Stones for super structure
15 200 INR
Interview with husband and/or
wife of each of the neighboring

55
changed in a positive way due to CSR project
undertaken
households to taanka 2012
3200 INR. Stone slabs for taanka roof 3000 INR. Gravel 200 INR. 15
Cement bags including transportation 4500 INR. Lid 300. Mesh-2 INR.
Murrum/Soil for catchment area 3000 INR. Water 1000 INR.
households to taanka 2012
Greenhouse gases have been released
into the environment
Interview with husband of
household who owns taanka 2012
100% 2,5 years 100%
Emissions from Tractor of about 245 hp that transports water from
government tube well located 4 km away. Emission data from Tractor of
model Valtra 6650 during transportation of 17 ton of gravel on Swedish country and village road. Assumption is that transportation
takes 2 h. Calculation done by adding emissions per hour in ton, number of hours of transportation, number of
times in a year that transportation is done, the price of one ton of CO2
emissions according to the European Climate Exchange (20120224)
converted into INR through coinmill.com.
-499 INR
Interview with husband of
household who owns taanka 2012
Owner of taanka has stated that
taanka was constructed by one
mason and two laborers and that
Interview with wife of household who owns taanka 2012; Swedish
Institute of Agricultural and
100% 2,5 years 100%
Money paid by owner of taanka to mason and laborer for their time.
Amount paid was amount that owner of taanka could contribute with and
does not reflect what the wage should be for work conducted.
1 500 INR
Interview with husband of
household who owns taanka 2012; Interview GRAVIS
2012
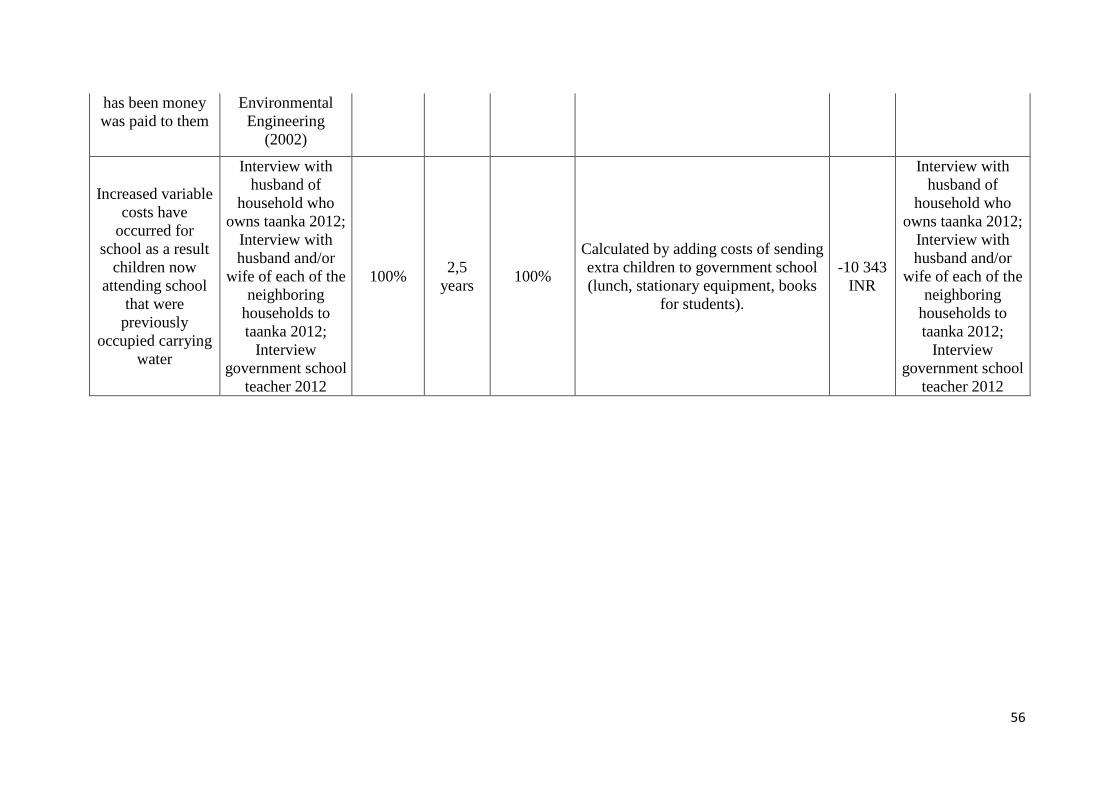
56
has been money was paid to them
Environmental Engineering
(2002)
Increased variable costs have
occurred for school as a result
children now attending school
that were previously
occupied carrying water
Interview with husband of
household who owns taanka 2012;
Interview with husband and/or
wife of each of the neighboring
households to taanka 2012;
Interview government school
teacher 2012
100% 2,5 years 100%
Calculated by adding costs of sending extra children to government school (lunch, stationary equipment, books
for students).
-10 343 INR
Interview with husband of
household who owns taanka 2012;
Interview with husband and/or
wife of each of the neighboring
households to taanka 2012;
Interview government school
teacher 2012
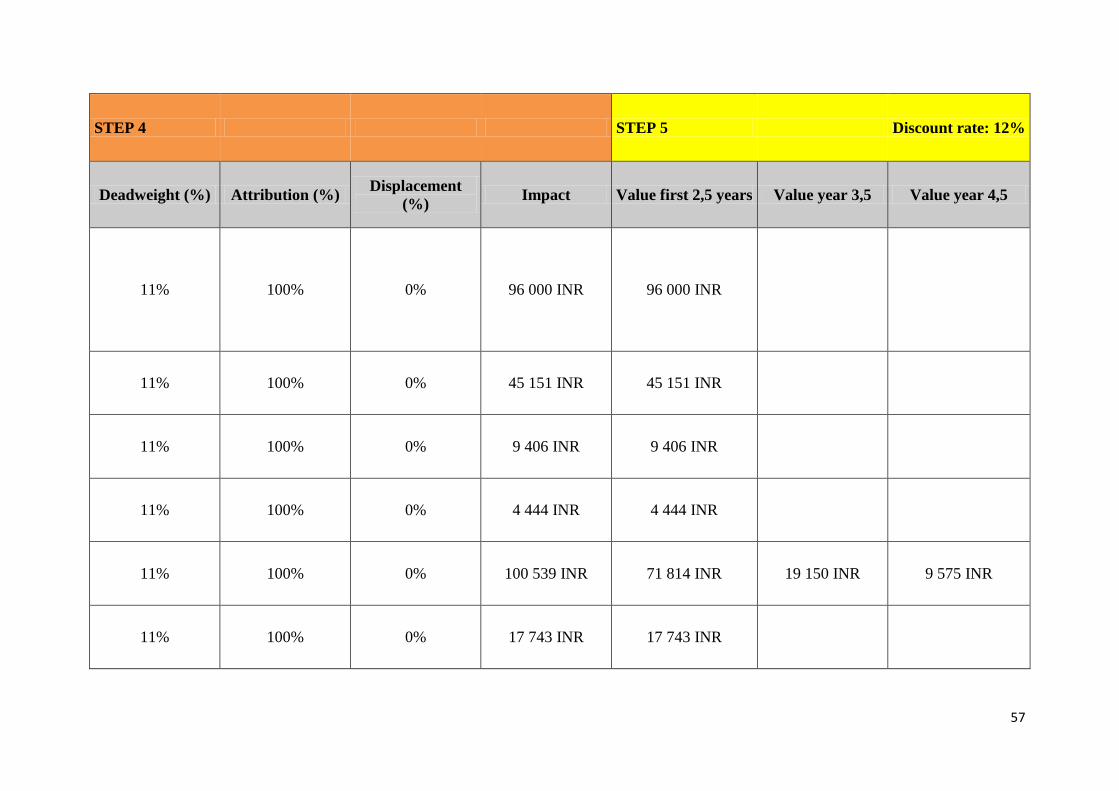
57
STEP 4 STEP 5 Discount rate: 12%
Deadweight (%) Attribution (%) Displacement (%) Impact Value first 2,5 years Value year 3,5 Value year 4,5
11% 100% 0% 96 000 INR 96 000 INR
11% 100% 0% 45 151 INR 45 151 INR
11% 100% 0% 9 406 INR 9 406 INR
11% 100% 0% 4 444 INR 4 444 INR
11% 100% 0% 100 539 INR 71 814 INR 19 150 INR 9 575 INR
11% 100% 0% 17 743 INR 17 743 INR

58
11% 100% 0% 600 420 INR 600 420 INR
11% 100% 0% 58 706 INR 58 706 INR
11% 100% 0% 9 965 INR 9 965 INR
11% 100% 0% 100 539 INR 71 814 INR 19 150 INR 9 575 INR
11% 100% 0% 9 951 INR 9 951 INR
11% 100% 0% 547 INR 547 INR
11% 100% 0% 109 677 INR 109 677 INR
11% 100% 0% 10 336 INR 10 336 INR
4% 100% 0% 15 363 INR 14 592 INR 514 INR 257 INR

59
11% 100% 0% -444 INR -444 INR
55% 100% 0% 2 008 INR 2 008 INR
11% 100% 0% -9 194 INR -9 194 INR
Net Present Value 1 122 937 INR 38 815 INR 19 407 INR
SROI Ratio 28:1