Accountability Program Update
40
CALIFORNIA DEPARTMENT OF EDUCATION Tom Torlakson, State Superintendent of Public Instruction Accountability Program Update
-
Upload
erica-monroe -
Category
Documents
-
view
27 -
download
0
description
Accountability Program Update. Overview. School Accountability Report Card (SARC) Safe Harbor Changes to the definition of continuous enrollment and the impact on the Academic Performance Index (API) and Adequate Yearly Progress (AYP) reports The reassignment of test scores (Senate Bill 219) - PowerPoint PPT Presentation
Transcript of Accountability Program Update

CALIFORNIA DEPARTMENT OF EDUCATIONTom Torlakson, State Superintendent of Public Instruction
Accountability
Program Update

TOM TORLAKSONState Superintendent of Public Instruction
Overview
• School Accountability Report Card (SARC)
• Safe Harbor
• Changes to the definition of continuous enrollment and the impact on the Academic Performance Index (API) and Adequate Yearly Progress (AYP) reports
• The reassignment of test scores (Senate Bill 219)
• Five-Year Cohort Graduation Rate
2

TOM TORLAKSONState Superintendent of Public Instruction
School Accountability Report Card (SARC)
3

TOM TORLAKSONState Superintendent of Public Instruction
SARCs for the 2011-12 School Year
• Prop. 98 requires that all public schools annually produce a SARC
• The State Board of Education (SBE) annually approves a template that identifies the data elements that are statutorily required, including:
– Information about the school (enrollment, grades offered, etc.)
– School Climate
– School Facilities
– Teacher and Support Staff Credentials and Assignments
– Curriculum and Instructional Materials
– School Finance
– Accountability and Assessment Results
– Postsecondary Preparation
4

TOM TORLAKSONState Superintendent of Public Instruction
SARCs for the 2011-12 School Year (cont.)SARC Template was approved by the SBE in July 2012
• Visit the link below for the most current SARC information http://www.cde.ca.gov/ta/ac/sa/
5

TOM TORLAKSONState Superintendent of Public Instruction
SARCs for the 2011-12 School Year (cont.)• Historically, CDE provided local educational
agencies (LEAs) with access to a partially populated SARCs
• In 2010, due to budget cuts, CDE stopped providing partially populated SARCs
6

TOM TORLAKSONState Superintendent of Public Instruction
SARCs for the 2011-12 School Year (cont.)
• In 2011, CDE leveraged the Ed-Data partnership to provide a partially populated SARC on the Ed-data Web site
• Ed-Data is an existing partnership between CSIS, EdSource and CDE
• The Ed-Data partnership will continue to produce partially populated SARCs
• We anticipate that the SARCs will be available on the Ed-Data Web site in late October for LEA use
7

TOM TORLAKSONState Superintendent of Public Instruction
SARCs for the 2011-12 School Year (cont.)• SARC template with all data collected by CDE
will be made available for download at the Ed-Data Web site: – Target date is November 1– http://www.ed-data.k12.ca.us/Pages/
Home.aspx
• The downloadable SARC templates are: – Approved as meeting the legal reporting
requirements specified by the SBE once a school’s local data has been added
– Provided in multiple languages
8

TOM TORLAKSONState Superintendent of Public Instruction
SARCs for the 2011-12 School Year (cont.)• At the July SBE meeting, the SBE discussed the
future of the SARC– Short Term Improvements
• Revise optional executive summary• Promulgation of SARC regulations
– Long Term Improvements• Develop a web application to collect LEA data• Revise/modernize SARC template• Develop a data dashboard with summary
information about schools
9

TOM TORLAKSONState Superintendent of Public Instruction
SARCs for the 2011-12 School Year (cont.)• Revise optional executive summary
– We do not anticipate any changes to the executive summary will be made this school year
– CDE will be electronically surveying accountability coordinators
– Putting together a workgroup of stakeholders to discuss necessary changes
10

TOM TORLAKSONState Superintendent of Public Instruction
SARCs for the 2011-12 School Year (cont.)• Development of SARC regulations
– CDE staff is working to determine the areas of focus for the regulations
– CDE anticipates bringing draft regulations to the January or March 2013 SBE meeting
– Opportunity for public comment
11

TOM TORLAKSONState Superintendent of Public Instruction
SARCs for the 2011-12 School Year (cont.)
• Develop a web application to collect LEA data– CDE is working with budget staff to
determine cost to develop this web application to collect LEA data
– Will be an optional data collection where LEAs can complete the LEA portion of the SARC and CDE would prepare a final SARC with LEA and CDE data
12

TOM TORLAKSONState Superintendent of Public Instruction
SARCs for the 2011-12 School Year (cont.)• Revise/modernize SARC template
– Longer term discussion– Foundational question for the revisions
• How best to display the data that is meaningful to parents and policy makers?
13

TOM TORLAKSONState Superintendent of Public Instruction
SARCs for the 2011-12 School Year (cont.)• Develop a summary report with rating
information about schools– Currently doing a survey of how other
states display school data– As this process commences, CDE will seek
public comment and stakeholder input
14

TOM TORLAKSONState Superintendent of Public Instruction
SARC
• The Analysis, Measurement, and Accountability Reporting Division will be bringing a board item to the SBE in January 2013 to discuss our progress on these improvements
15

TOM TORLAKSONState Superintendent of Public Instruction • New stand-alone report card in response to
federal monitoring visit findings
• The CDE will provide all of the data for the LEA Accountability Report Card and will host all on the CDE Web site
• 2011-12 version should be available in?
LEA Accountability Report Cards
16

TOM TORLAKSONState Superintendent of Public Instruction
Safe Harbor
17
TOM TORLAKSONState Superintendent of Public Instruction
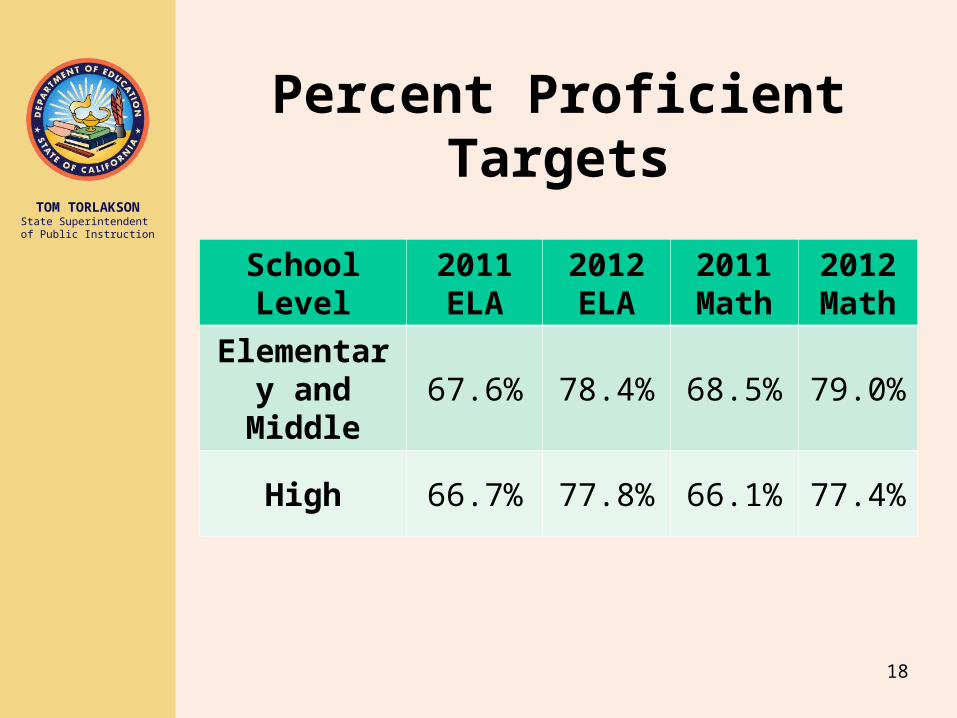
Percent Proficient Targets
School Level
2011ELA
2012ELA
2011Math
2012Math
Elementary and Middle
67.6% 78.4% 68.5% 79.0%
High 66.7% 77.8% 66.1% 77.4%
18

TOM TORLAKSONState Superintendent of Public Instruction
Impact of Safe Harbor
• Number of LEAs and schools that made their 2011 AYP through safe harbor
TypeMade AYP
Made AYP Through Safe
Harbor
Schools 3,398 1,511 (44.5%)
LEAs 212 102 (48%)
19

TOM TORLAKSONState Superintendent of Public Instruction
Continuous Enrollment
20

TOM TORLAKSONState Superintendent of Public Instruction
Title 5 Regulations
In January 2012, the SBE adopted regulations that define continuous enrollment for accountability purposes. These regulations do not, in any way, mandate local policies about enrolling or exiting students in the California Longitudinal Pupil Achievement Data System (CALPADS).
21

TOM TORLAKSONState Superintendent of Public Instruction
Title 5 Regulations (cont.)
California Code of Regulations (CCR), Title 5 Section 1039.2, specifies that a student is considered continuously enrolled if the student was enrolled in the same school or LEA from Fall Census Day to the first day of testing without a gap of enrollment of 30 or more consecutive calendar days. This definition was first applied with the 2011 Base API.
22

TOM TORLAKSONState Superintendent of Public Instruction
Continuous Enrollment
Continuous enrollment is determined by using enrollment and exit code data from CALPADS. For the October 2012 accountability release, data was extracted from CALPADS on August 15, 2012.
23

TOM TORLAKSONState Superintendent of Public Instruction
Continuous Enrollment (cont.)
• The CDE will extract CALPADS enrollment and exit code data on two more occasions. The tentative schedule is:– December 20, 2012 – February 26, 2013
• The CDE will use the extracted data, along with corrected demographic data, to update AYP and API Reports
24

TOM TORLAKSONState Superintendent of Public Instruction
Continuous Enrollment Data
Type No Change
1 to 5 point
change (+ & -)
More than 5 point change (+ & -)
LEAs 42% 53% 5%
Schools 55% 40% 5%
Impact of CALPADS Continuous Enrollment Data Compared to Student Answer Document (SAD) Data on the 2011 Base API
25

TOM TORLAKSONState Superintendent of Public Instruction
Continuous Enrollment Data
Type SAD CALPADSDifference
In CALPADS
LEAs 4,429,300 (92.5%)
4,542,141 (94.9%)
112,841
Schools 4,508,790 (94.2%)
4,447,207 (92.3%)
-61,583
2012 Standardized Testing and Reporting (STAR) Continuous Enrollment SAD Data
Compared to CALPADS Data (Total N = 4,785,444)
26

TOM TORLAKSONState Superintendent of Public Instruction
Continuous Enrollment Data
Type SAD CALPADSDifference
in CALPADS
LEAs 824,792 (85.6%)
812,882 (84.4%)
11,910
Schools 782,818 (81.3%)
758,786 (78.8%)
24,032
2012 California High School Exit Examination (CAHSEE) Continuous Enrollment SAD Data
Compared to CALPADS Data (Total N = 963,006)
27

TOM TORLAKSONState Superintendent of Public Instruction
Reassignment of Test Scores
• SB 219 requires assessment and other accountability results of some students enrolled in an Alternative Education Program (AEP) to be assigned back to a school or LEA of residence in the calculation of the API
28

TOM TORLAKSONState Superintendent of Public Instruction
Reassignment of Test Scores (cont.)
• In January 2012, the SBE adopted CCR, Title 5, Section 1039.3, which specifies how students’ STAR and CAHSEE test scores will be reassigned
29

TOM TORLAKSONState Superintendent of Public Instruction
Criteria for Reassignment of Test Scores
• STAR and CAHSEE results are assigned to a non-AEP school and/or a non-AEP LEA of residence if both of the student: – Was referred after Fall Census Day to an AEP
school (i.e., exited using student exit code T167 in the CALPADS) and
– Took the STAR and/or CAHSEE at the AEP school
30

TOM TORLAKSONState Superintendent of Public Instruction
Results of Test Score Reassignments
TestNumber of Scores Reassigned
STAR 3,028
CAHSEE 1,989
Number of 2012 Test Scores Reassigned from an AEP School to a Non-AEP School
31

TOM TORLAKSONState Superintendent of Public Instruction
Future Use of CALPADS for Accountability Reporting
• In coming years, the CDE will use additional CALPADS data for API and AYP reporting:– Race and Ethnicity– English Learner (EL) Status– Socioeconomically Disadvantaged – Special Education– Gender
32

TOM TORLAKSONState Superintendent of Public Instruction
Benefits of Using CALPADS for Accountability Reporting
• Reduced workload for assessment Pre-ID
• No costs for correcting demographic data in CALPADS
33

TOM TORLAKSONState Superintendent of Public Instruction
Five-Year Cohort Graduation Rate
• In January 2012, the SBE approved an amendment to California’s Consolidated State Application Accountability Workbook to add the use of a five-year cohort graduation rate for 2013 AYP determinations
• In February 2012, the SBE and CDE submitted the amendment to the U.S. Department of Education (ED) for approval
34

TOM TORLAKSONState Superintendent of Public Instruction
Five-Year Cohort Graduation Rate (cont.)
• The updated January 2013 AYP reports will include the 2012 five-year cohort graduation rates and growth targets for the 2013 AYP determinations
• Meeting the four-year or five-year cohort graduation rate will qualify as meeting the graduation rate criteria for AYP
35

TOM TORLAKSONState Superintendent of Public Instruction
Five-Year Cohort Graduation Rate (cont.)
• The five-year cohort graduation rate will be calculated using a similar formula as the four-year rate
• The five-year cohort graduation rate will be used as an alternative method for meeting the graduation rate criteria if the eligibility criterion is met
36

TOM TORLAKSONState Superintendent of Public Instruction
Five-Year Cohort Graduation Rate (cont.)
• The five-year cohort graduation rate criterion is:– The number of new graduates in the
fifth year cohort is equal to or greater than the number of students who transfer out, emigrate, or die during the fifth year
37

TOM TORLAKSONState Superintendent of Public Instruction
New API Indicators
• The CDE will convene the Public Schools Accountability Act (PSAA) Advisory Committee to discuss incorporating the following indicators into the API:– High school graduation rates– Middle school dropout rates (grade 8, and
grade 9 for schools where grade 9 is the highest grade offered)
38

TOM TORLAKSONState Superintendent of Public Instruction
Senate Bill 1458
• Senate Bill 1458 was sent to the Governor’s desk on August 29, 2012. If signed, the bill would require:– Assessments constitute 60% of a high
school API beginning with the 2016 API calculations
– New variables be incorporated into the API one full academic year after the state board approves the addition of a new variable
39

TOM TORLAKSONState Superintendent of Public Instruction
Contact Information (cont.)
Evaluation, Research, and Analysis Unit 916-319-0869
• AYP appeals• Continuous Enrollment• API test score rollbacks • PI identification [email protected]• SARC [email protected]
40