ACCION Presentation
23
ACCION ACCION International International Poverty Assessment T ool: Depth of Outreach SEEP Poverty Assessment Working Group May 6, 2004 Karen Horn Welch & Patty Lee Devaney
-
Upload
poverty-outreach-working-group-powg -
Category
Documents
-
view
222 -
download
0
Transcript of ACCION Presentation

8/7/2019 ACCION Presentation
http://slidepdf.com/reader/full/accion-presentation 1/23
ACCIONACCIONInternationalInternationalPoverty Assessment Tool:
Depth of Outreach
SEEP Poverty Assessment Working Group
May 6, 2004
Karen Horn Welch & Patty Lee Devaney

8/7/2019 ACCION Presentation
http://slidepdf.com/reader/full/accion-presentation 2/23
Introduction & ObjectivesIntroduction & Objectives
Brief review of ACCIONs poverty
assessment tool and methodology
Project update
Introduction
Time & cost
Data collection & analysis
Misreporting or data manipulation
Adaptation
Key findings from our poverty assessments
of Mibanco, Peru and SOGESOL, Haiti
Discussion

8/7/2019 ACCION Presentation
http://slidepdf.com/reader/full/accion-presentation 3/23
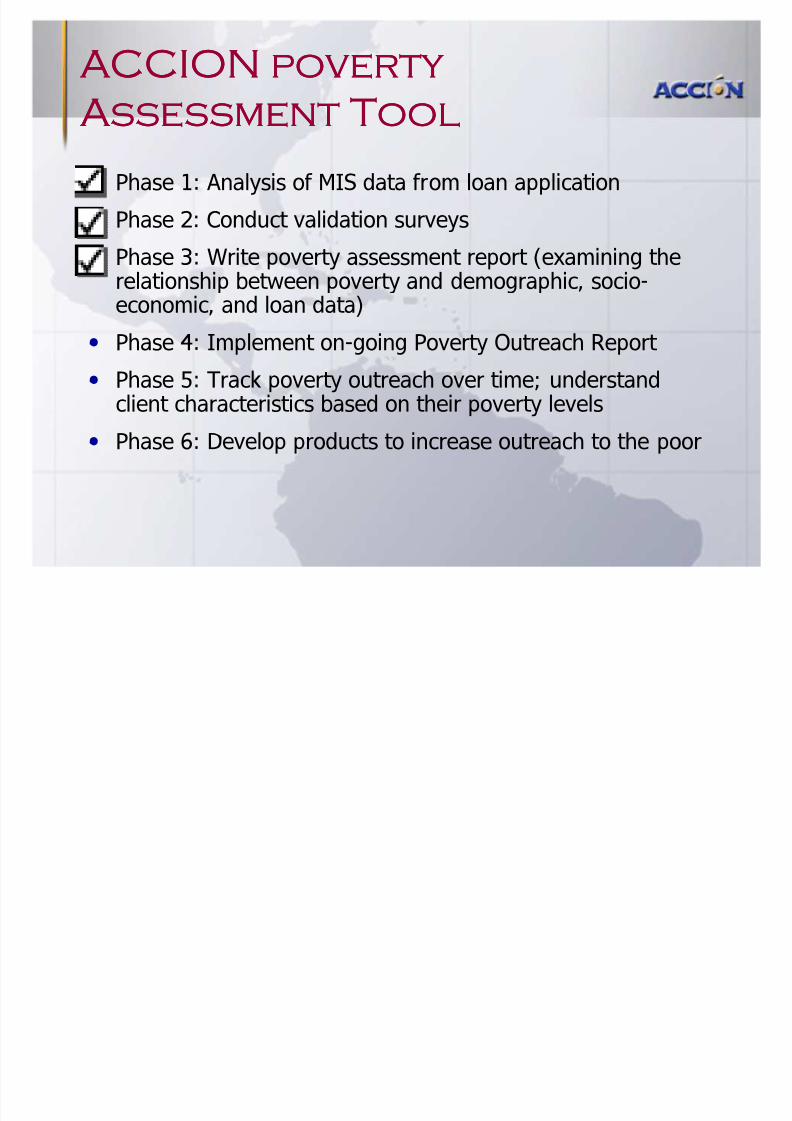
ACCION poverty ACCION poverty
Assessment ToolAssessment Tool
Based on household-level incomeand expenditure data
Evaluate the absolute poverty level
of MFI clients in comparison withthe national/regional populations.
Examine relationship betweenpoverty and demographic, socio-economic, and loan data
Conduct validation surveys
Monitor poverty on an on-goingbasis
8/7/2019 ACCION Presentation
http://slidepdf.com/reader/full/accion-presentation 4/23
ACCION poverty ACCION poverty
Assessment ToolAssessment Tool
Phase 1: Analysis of MIS data from loan application
Phase 2: Conduct validation surveys
Phase 3: Write poverty assessment report (examining therelationship between poverty and demographic, socio-economic, and loan data)
Phase 4: Implement on-going Poverty Outreach Report
Phase 5: Track poverty outreach over time; understand
client characteristics based on their poverty levels
Phase 6: Develop products to increase outreach to the poor

8/7/2019 ACCION Presentation
http://slidepdf.com/reader/full/accion-presentation 5/23
OnOn--Going Poverty Outreach ReportGoing Poverty Outreach Report
Institución: Mibanco
Fecha: (Ser completado trimestralmente)
Estadísticas Macroecon. y Ajuste a la
Línea de Pobreza PIB/Cápita
Tasa de
Inflación
Línea de Pobreza
(en 2002 nuevos
soles/cáp/anual)
Tasa de
Cambio
(nuevos soles
per US$)
Línea de
Pobreza (en
US$)
Tasa de
comparison
de pobreza
(ajustada)
3685 #DIV/0!
PARTEA:
Estadísticas R esumenes por Nivel de
Pobreza Número deClientes (1) % de Clientes Monto de Cartera % de Cartera
Número de
Clientes Nuevos (3)
% de Clientes Nuevos
Ingreso deHogar (media)
Ingreso de
Hogar/Cáp(media)
Monto
Desembolsado (media)
Saldo
Vigente del
Préstamo(media) (2)
Activos
Totales de
la Micro-empresa
# de clientes
al final de
periodoanterior
Nivel 1 (1er quintile de gastos del hogar) #DIV/0! #DIV/0! #DIV/0!
Nivel 2 (2o quintile de gastos del hogar) #DIV/0! #DIV/0! #DIV/0!
Nivel 3 (3er quintile de gastos del hogar) #DIV/0! #DIV/0! #DIV/0!
Nivel 4 (4o quintile de gastos del hogar) #DIV/0! #DIV/0! #DIV/0!
Nivel 5 (5o quintile de gastos del hogar) #DIV/0! #DIV/0! #DIV/0!
Población Total de Clientes 0 #DIV/0! 0 #DIV/0! 0 #DIV/0! 0
PARTEB:
Estadísticas R esumenes por Tamaño de
Préstamo
Número de
Clientes % de Clientes Monto de Cartera % de Cartera
Número de
Clientes
Nuevos (3)
% de Clientes
Nuevos
Ingreso de
Hogar (media)
Ingreso de
Hogar/Cáp
(media)
Monto
Desembolsa
do (media)
Saldo
Vigente del
Préstamo
(media) (2)
Activos
Totales de
la Micro-
empresa
# de clientes
al final de
periodo
anterior
Tamaño de Préstamo = $0-$200 #DIV/0! #DIV/0! #DIV/0!
$201-$400 #DIV/0! #DIV/0! #DIV/0!
$401-$1,000 #DIV/0! #DIV/0! #DIV/0!
$1,001-$3,000 #DIV/0! #DIV/0! #DIV/0!
más que $3,000 #DIV/0! #DIV/0! #DIV/0!
Total 0 #DIV/0! 0 #DIV/0! 0 #DIV/0! 0

8/7/2019 ACCION Presentation
http://slidepdf.com/reader/full/accion-presentation 6/23
Project Update:Project Update: What we¶ve been doing for the past year« What we¶ve been doing for the past year«
Additional Poverty Analyses & Developed Validation Framework
Household validation surveys at Mibanco
Poverty monitoring report at Mibanco (programming stage)
SOGESOL poverty analysis (published as ACCION InSight 8)
Household validation surveys at SOGESOL
BancoSol poverty analysis
Household validation surveys at BancoSol
Banco Solidario poverty analysis

8/7/2019 ACCION Presentation
http://slidepdf.com/reader/full/accion-presentation 7/23
IntroductionIntroduction
Why did ACCION pursue apoverty measurement tool?
MFI driven: Missions andcompetition
Legislation
Poverty distinctions:
Poor/ non-poor, based onpertinent poverty line
Poverty distribution (1-5)
5 NSE levels (A-E)

8/7/2019 ACCION Presentation
http://slidepdf.com/reader/full/accion-presentation 8/23
Time & CostTime & Cost
Phase 1: Analysis of MIS datafrom loan application
- ACCION Staff: 12 days
- MFI Staff: 5 days
- MFI Management: N/A
- Clients: N/A
Phase 2: Validation surveys
ACCION Staff: 15 days
MFI Staff: 4 days MFI Management: 1 day
Survey Firm: 30 days
Clients: 400 hours

8/7/2019 ACCION Presentation
http://slidepdf.com/reader/full/accion-presentation 9/23
Time & CostTime & Cost
Phase 3: Perform assessment & write report
- ACCION Staff: 20 days
- MFI Staff: 1 day
- MFI Management: 1 day
- Clients: N/A
Phase 4: Implement On-goingPoverty Outreach Report
ACCION Staff: 5 days
MFI Staff: 20 days
MFI Management: 2 days
Clients: N/A

8/7/2019 ACCION Presentation
http://slidepdf.com/reader/full/accion-presentation 10/23
Time & CostTime & Cost
Phase 5: Track MFI povertyoutreach over time
- ACCION Staff: 1 day perquarter
- MFI Staff: .5 days perquarter
- MFI Management: .5 daysper quarter
- Clients: N/A
Phase 6: Product development
ACCION Staff: variable
MFI Staff: variable MFI Management: variable
Clients: variable (may involvefocus groups)

8/7/2019 ACCION Presentation
http://slidepdf.com/reader/full/accion-presentation 11/23
Total BudgetTotal Budget
Costs:ACC ION Poverty Assessment Tool:
Estimated Costs of Adaption, Validation, Implementation, and O n-Going Use
Adaption V alidation Testing Implementation
On-Going Use
(Annual)
Cost Category
I. Personnel $6,400 $2,250 $19,350 $6,800
Including ACCION an d MFI staff
II. Travel, Transportation & Per Diem $2,400 $2,000 $2,400 -
III. Other
Validation survey firm - $10,000 - -
TOTAL ESTIMATED COST $8,800 $14,250 $21,750 6,800$
8/7/2019 ACCION Presentation
http://slidepdf.com/reader/full/accion-presentation 12/23
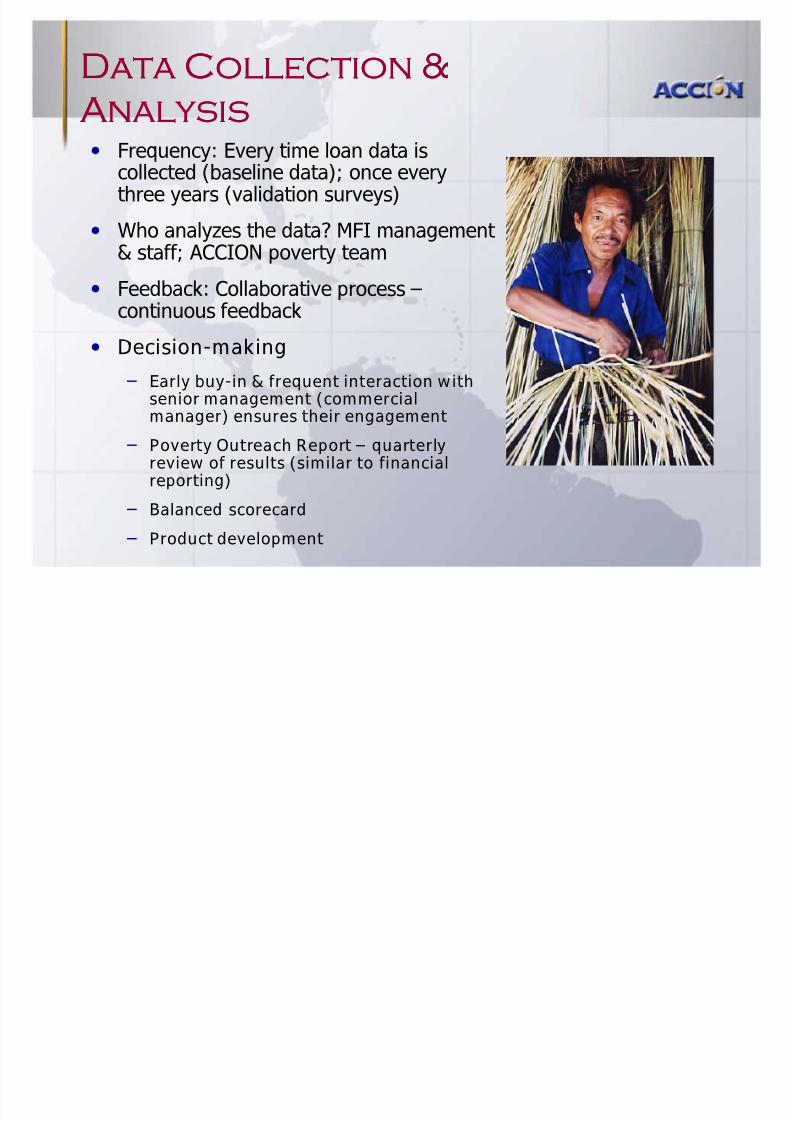
Frequency: Every time loan data iscollected (baseline data); once everythree years (validation surveys)
Who analyzes the data? MFI management & staff; ACCION poverty team
Feedback: Collaborative process continuous feedback
Decision-making
Early buy-in & frequent interaction with
senior management (commercialmanager) ensures their engagement
Poverty Outreach Report quarterlyreview of results (similar to financialreporting)
Balanced scorecard
Product development
Data Collection &Data Collection &
AnalysisAnalysis

8/7/2019 ACCION Presentation
http://slidepdf.com/reader/full/accion-presentation 13/23
The tool is based on standard loanapplication process
Asking for info pertaining directly to
microenterprise (hh size; income andexpenditure)
Bias clients wanting a bigger loan(overstate income & understateexpenditure)
Validation surveys were meant toovercome the risk of misreporting
Misreporting /Misreporting /
DataManipulationDataManipulation

8/7/2019 ACCION Presentation
http://slidepdf.com/reader/full/accion-presentation 14/23
Validation surveys revealed different results than the originalMIS data.
In asking questions for different purposes, were getting different
answers Loan application gathers information focusing on microenterprise
Validation survey gathers information focusing on entire household
How can we use the results?
We can use the original loan application data for tracking trends anddistribution of poverty (based on expenditure) within the client population
Harder to pinpoint where clients fall relative to the poverty linewithout making an adjustment to the original data
Misreporting /Misreporting /
DataManipulationDataManipulation
8/7/2019 ACCION Presentation
http://slidepdf.com/reader/full/accion-presentation 15/23
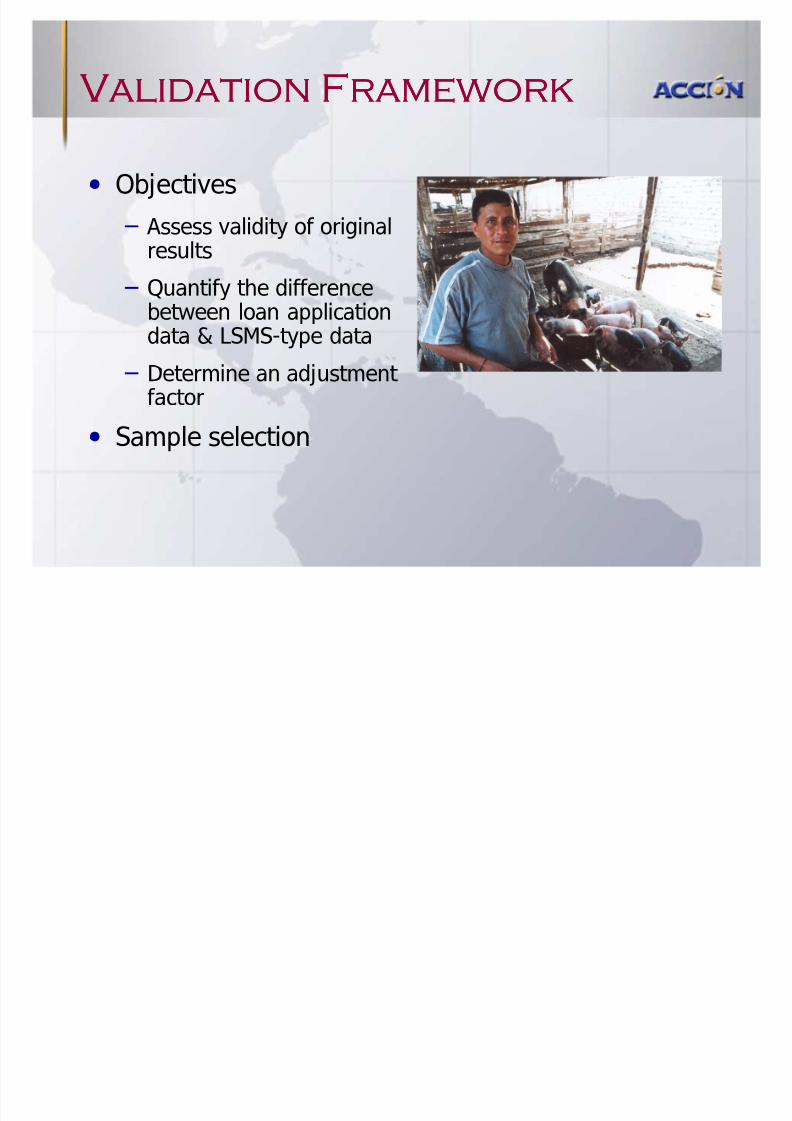
Validation FrameworkValidation Framework
Objectives
Assess validity of originalresults
Quantify the differencebetween loan applicationdata & LSMS-type data
Determine an adjustment
factor Sample selection

8/7/2019 ACCION Presentation
http://slidepdf.com/reader/full/accion-presentation 16/23
Data Comparison:Data Comparison:
Mibanco & Validation Survey Mibanco & Validation Survey
R atio of ali atio : iBa co ata Median Mean Median Mean Median Mean
Expenditure per Capita* 1.6 1.9 1.8 2.0 1.3 1.8
Per ima Provi ces
Data Compariso : Miba co Data a d Validatio S rvey
All figures in Soles per Year, $1/=S/3.5
Median Mean
Validation survey
Income per apita 7,069 16,735 xpenditure per apita 3,253 4,080
Mibanco MIS
Income per apita 3,755 5,391
xpenditure per apita 1,929 2,235

8/7/2019 ACCION Presentation
http://slidepdf.com/reader/full/accion-presentation 17/23
Data Comparison:Data Comparison:
SOGESOL & Validation Survey SOGESOL & Validation Survey Data Comparison: SOGESOL Data and Validation Survey
All figures are in Gourdes per Year, $1=43g
Median Mean
Validation Survey
Income per apita 103,880 146,358 xpenditure per apita 32,848 50,591
SOGESOL MIS
Income per apita 88,500 196,270
xpenditure per apita 12,000 15,393
Haiti-Port au Prince
Ratio of Validation:SOGESOL Data
Median Mean
Income per apita 1.1 1.9
xpenditure per apita 3.0 4.0

8/7/2019 ACCION Presentation
http://slidepdf.com/reader/full/accion-presentation 18/23
ConsiderationsConsiderations
Adjustment Methodology
Assumptions
Relatively small adjustment factor
Constant variance of adjustment factor across households
Findings
Larger than expected adjustment factor
Wider variance

8/7/2019 ACCION Presentation
http://slidepdf.com/reader/full/accion-presentation 19/23
Distribution of RatiosDistribution of Ratios
(adjustment Factors)(adjustment Factors)
F r
c t i
istrib ti f V lid ti : ib c x dit r R ti s
djf ct r_ x1 3 5 1
.1
.
.3
.
8/7/2019 ACCION Presentation
http://slidepdf.com/reader/full/accion-presentation 20/23
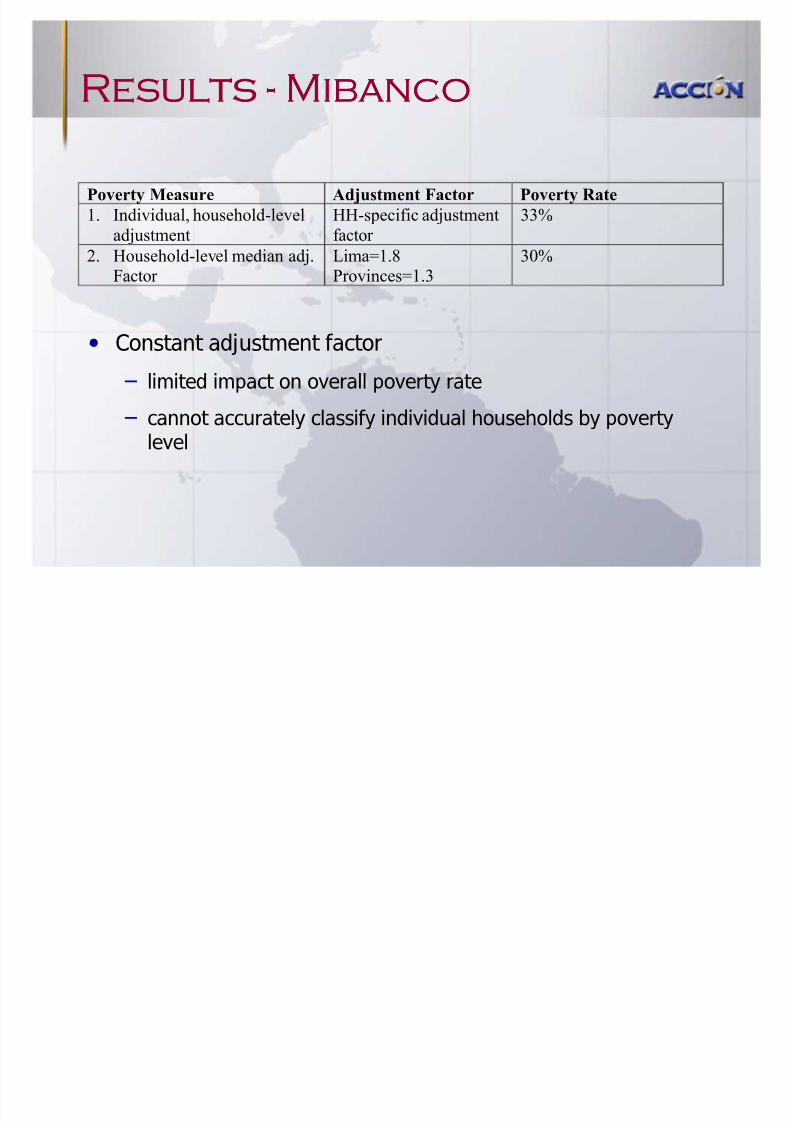
ResultsResults --MibancoMibanco
Poverty Measure Adjustment Factor Poverty Rate
1. Individual, household-leveladjustment
HH-specific adjustmentfactor
33%
2. Household-level median adj.
Factor
Lima=1.8
Provinces=1.3
30%
Constant adjustment factor
limited impact on overall poverty rate
cannot accurately classify individual households by povertylevel

8/7/2019 ACCION Presentation
http://slidepdf.com/reader/full/accion-presentation 21/23
Getting back to theGetting back to the
original question«original question«
Given data considerations, how can we accurately track and definethe poverty level of microfinance clients?
Use a constant adjustment factor to the household expenditures
for one portion of the Poverty Outreach Report We can estimate the percentage of the client population above and
below the poverty line with a good degree of certainty
Report unadjusted data for the remainder of the report
Maintains the true distribution of client expenditure and associatedcharacteristics for analysis within the MFI (practical for MFIs purposes)

8/7/2019 ACCION Presentation
http://slidepdf.com/reader/full/accion-presentation 22/23
OnOn--Going Poverty Outreach ReportGoing Poverty Outreach Report
Institución: Mibanco
Fecha: (Ser completado trimestralmente)
Estadísticas Macroecon. y Ajuste a la
Línea de Pobreza PIB/Cápita
Tasa de
Inflación
Línea de Pobreza
(en 2002 nuevos
soles/cáp/anual)
Tasa de
Cambio
(nuevos soles
per US$)
Línea de
Pobreza (en
US$)
Tasa de
comparison
de pobreza
(ajustada)
3685 #DIV/0!
PARTEA:
Estadísticas R esumenes por Nivel de Pobreza
Número deClientes (1) % de Clientes Monto de Cartera % de Cartera
Número de
Clientes Nuevos (3)
% de Clientes Nuevos
Ingreso deHogar (media)
Ingreso de
Hogar/Cáp(media)
Monto
Desembolsado (media)
Saldo
Vigente del
Préstamo(media) (2)
Activos
Totales de
la Micro-empresa
# de clientes
al final de
periodoanterior
Nivel 1 (1er quintile de gastos del hogar) #DIV/0! #DIV/0! #DIV/0!
Nivel 2 (2o quintile de gastos del hogar) #DIV/0! #DIV/0! #DIV/0!
Nivel 3 (3er quintile de gastos del hogar) #DIV/0! #DIV/0! #DIV/0!
Nivel 4 (4o quintile de gastos del hogar) #DIV/0! #DIV/0! #DIV/0!
Nivel 5 (5o quintile de gastos del hogar) #DIV/0! #DIV/0! #DIV/0!
Población Total de Clientes 0 #DIV/0! 0 #DIV/0! 0 #DIV/0! 0
PARTEB:
Estadísticas R esumenes por Tamaño de
Préstamo
Número de
Clientes % de Clientes Monto de Cartera % de Cartera
Número de
Clientes
Nuevos (3)
% de Clientes
Nuevos
Ingreso de
Hogar (media)
Ingreso de
Hogar/Cáp
(media)
Monto
Desembolsa
do (media)
Saldo
Vigente del
Préstamo
(media) (2)
Activos
Totales de
la Micro-
empresa
# de clientes
al final de
periodo
anterior Tamaño de Préstamo = $0-$200 #DIV/0! #DIV/0! #DIV/0!
$201-$400 #DIV/0! #DIV/0! #DIV/0!
$401-$1,000 #DIV/0! #DIV/0! #DIV/0!
$1,001-$3,000 #DIV/0! #DIV/0! #DIV/0!
más que $3,000 #DIV/0! #DIV/0! #DIV/0!
Total 0 #DIV/0! 0 #DIV/0! 0 #DIV/0! 0
8/7/2019 ACCION Presentation
http://slidepdf.com/reader/full/accion-presentation 23/23
DiscussionDiscussion