Access Services Survey 2005 - Home - Ofcom Services Survey 2005 July-Dec 2005 ... The second phase...
23
Access Services Survey 2005 July-Dec 2005 Technical Report, Marked-up Questionnaires and Computer Tables Research Study Conducted for Ofcom Publication date: March 2006
Transcript of Access Services Survey 2005 - Home - Ofcom Services Survey 2005 July-Dec 2005 ... The second phase...

Access Services Survey 2005
July-Dec 2005
Technical Report, Marked-up Questionnaires and Computer Tables
Research Study Conducted for
Ofcom
Publication date: March 2006
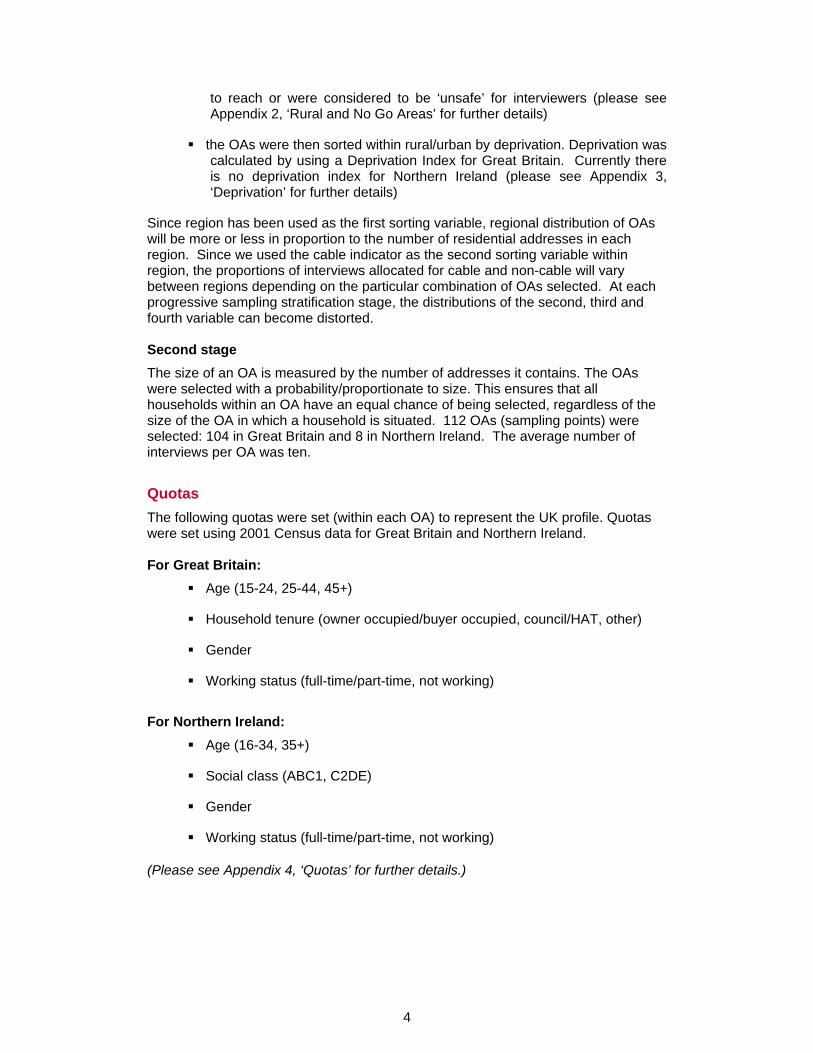
Contents Section Page 1 Preface 1
2 Sample Design – Audience measurement 3
3 Weighting – Audience Measurement 7
4 Population Estimates – Audience measurement 8
5 Case Study 10
6 Sampling – Case Studies 13
7 Appendix 1 – Cable Coverage – Audience Measurement 14
8 Appendix 2 – Rural and excluded Areas – Audience Measurement
15
9 Appendix 3 – Deprivation – Audience Measurement 17
10 Appendix 4 – Quotas – Audience Measurement 18
11. Appendix 5 – Quotas – Case Study 19
12. Appendix 6 - Guide to Statistical Reliability 20
1
Preface This volume contains the full computer tabulations both parts of the Ofcom Access Services Study. The objectives of the research were twofold: to measure the size of the audience currently using access services across the UK, and to understand the needs and preferences of users and potential users of these services across the hearing and visually impaired communities. These two strands of work will be referred as:
1. Audience Measurement 2. Case studies
One of the foremost decisions to be made in any research study is how best to conduct the interviewing, given constraints of timescale and budget, as well as other practical considerations. We detail our methodology and the reasoning behind it below. Audience measurement MORI interviewed a representative quota sample of 4,363 adults, aged 15+, in the UK; 4,040 interviews were conducted in Great Britain and 323 interviews were conducted in Northern Ireland. Interviews were carried out across 112 sampling points each month for six months in the UK, face-to-face, in-home, using CAPI. All interviews were conducted between 9th July 2005 and 13th January 2006. The data are weighted by age, gender, social class, working status, region and cable/non-cable to match the known population profile; the Northern Ireland results are down-weighted to their natural proportion of the national UK profile. Case Studies The second phase of research took a case study approach - quantitative interviews with two broad groups of interest, the hearing and visually impaired. These interviews did not aim to be representative of the hearing or visually impaired universe, but were instead designed to give an insight into the needs and preferences of a broad cross section of users and potential users of access services. A questionnaire was designed by MORI in conjunction with Ofcom to enable detailed exploration of respondents usage, views and experiences of access services, as well as their broader attitudes towards television.
The initial methodology involved enlisting the support of local specialist agencies to identify potential hearing and visually impaired respondents across 30 sampling points in Great Britain.
However, in response to difficulties recruiting sufficient respondents, our approach evolved to encompass telephone and postal techniques. MORI interviewed a total of 608 visually and hearing impaired respondents for the case study phase of the study.

2
The final sample breakdown was as follows:
• 233 face-to-face
• 148 telephone
• 227 postal
The face-to-face interviews were conducted in various locations Great Britain with an interviewer present to facilitate completion. If required, a signer was available to help those with severe hearing problems. The research methodology, sampling frame and weighting procedures are detailed in the following pages. A note on statistical reliability and marked-up copies of the questionnaire are also included. Publication of Data As with all our studies, there should be no publication of the data without the prior approval of Ipsos MORI. This would only be refused on the basis of inaccuracy and misinterpretation of the results. ©MORI/25293 Julian Misell March, 2006 Elizabeth Dike
A total of 381 interviewer led interviews

3
Sample Design – Audience measurement MORI has been conducting the Ofcom Communications Tracker since 2003. This provides trend information on the use of various communications and is conducted among a nationally representative sample. The Communications Tracker questionnaire covers the following areas: fixed telephony, mobile, Internet, multi-channel TV, and radio markets. In 2005, MORI began conducting the study on a continuous basis (previously it was run quarterly), achieving a minimum of 700 CAPI interviews per month. In order to meet audience measurement objectives questions were placed on the Communications Tracker for six successive months, from July to December 2005. For the Communications Tracker MORI contacts a representative quota sample of UK households, using Output Areas (OAs)1 as sampling points. The sample was stratified by the following variables:
geographically, by region
cabled and non-cabled areas, to ensure that the sample is representative of homes which are passed by cable
rurality to ensure that rural and urban areas, are adequately represented
deprivation level, to ensure that high deprivation areas are adequately represented
Because of its representative and robust structure the Ofcom Telecommunications Tracker provides an accurate picture of usage and attitudes towards a variety of issues across the UK. It also lends itself to measuring incidence of hearing and visual impairment, as well as awareness and usage of access services. Drawing the sample First Stage The OAs in the UK were stratified by region, cable, rural/urban and deprivation as follows:
firstly, all the OAs were sorted by region
the OAs were then sorted within region by cable (please see Appendix 1, ‘Cable Coverage’ for further details)
the OAs were then sorted within cable by rural/urban. There were some areas, which were not approached either because they were very difficult
1The 1991 Census Data was classified using Enumeration Districts (ED’s). The 2001 Census data has been classified using Output Areas (OAs). These areas are essentially the same, but with slightly different boundaries.
4
to reach or were considered to be ‘unsafe’ for interviewers (please see Appendix 2, ‘Rural and No Go Areas’ for further details)
the OAs were then sorted within rural/urban by deprivation. Deprivation was calculated by using a Deprivation Index for Great Britain. Currently there is no deprivation index for Northern Ireland (please see Appendix 3, ‘Deprivation’ for further details)
Since region has been used as the first sorting variable, regional distribution of OAs will be more or less in proportion to the number of residential addresses in each region. Since we used the cable indicator as the second sorting variable within region, the proportions of interviews allocated for cable and non-cable will vary between regions depending on the particular combination of OAs selected. At each progressive sampling stratification stage, the distributions of the second, third and fourth variable can become distorted. Second stage The size of an OA is measured by the number of addresses it contains. The OAs were selected with a probability/proportionate to size. This ensures that all households within an OA have an equal chance of being selected, regardless of the size of the OA in which a household is situated. 112 OAs (sampling points) were selected: 104 in Great Britain and 8 in Northern Ireland. The average number of interviews per OA was ten. Quotas The following quotas were set (within each OA) to represent the UK profile. Quotas were set using 2001 Census data for Great Britain and Northern Ireland. For Great Britain:
Age (15-24, 25-44, 45+)
Household tenure (owner occupied/buyer occupied, council/HAT, other)
Gender
Working status (full-time/part-time, not working) For Northern Ireland:
Age (16-34, 35+)
Social class (ABC1, C2DE)
Gender
Working status (full-time/part-time, not working)
(Please see Appendix 4, ‘Quotas’ for further details.)
5
Fieldwork Interviewers were provided with specific addresses. The average OA contains around 130 households in England and Wales and 160 households in Scotland, thus affording tight control over the addresses the interviewers called at. All interviews were conducted in the home, using CAPI (Computer Assisted Personal Interviewing). The table highlights how the materials provided to interviewers were amended to take the Access Services section of the study into account:
Provided to interviewers as standard
Additional materials provided to interviewers for the Access
Services section Standard Questionnaire A large font paper copy of the
questionnaire to ensure those with poor eyesight could read the questions if necessary
Standard Showcards Showcards in large font as well as in Braille for the sight impaired
Standard letter from Ofcom detailing the purpose of the tracker
An extended letter detailing the specific aims of the Access Services section of the study in large font
Knowledge of the specific aims of the tracking study as well as definitions of relevant terms
Knowledge of the specific aims of the whole study as well as the specific aims of the Access Services study, so as to encourage appropriate respondents to participate
A method to record non-response among all potential respondents but not detailing any information about disability as the cause for non response
A method to record non-response detailing disability (so that we assess whether disability, and specifically hearing/sight impairment, led to the non-response)
In addition, all interviewers had an extra briefing session led by the MORI research team specifically regarding the Access Services questions to ensure they were clear on the objectives of study and the terminology employed. In particular, interviewers were advised that if they discovered potential respondents with either a sight or hearing impairment within the specific addresses they were given, they were to encourage that individual to participate (while still only completing one interview per household). A detailed briefing was also conducted with telephone interviewers. Reporting The sample is drawn on the basis of households within OAs, while quotas are set on the basis of adult population profiles. The data is then weighted to the profile of UK adults, so the data is representative of adults aged 15+. Consequently, when reporting, it is necessary to state that the data represents the percentage of adults rather than the percentage of households.

6
Non response As noted above, during fieldwork we collected non-response information. This included the number of refusals, number of households where no contact could be made, number who refused as they had a disability (any) and the total number of properties called at in each of the 112 sample points selected every month. Of the non-response information received from interviewers the following number of people refused citing their disability as a reason for non-participation: Total refused due to Visually Hearing July 7 1 3 August 8 Not specified Not specified September 10 Not specified Not specified October 14 1 1 November 14 Not specified Not specified December 15 Not specified 1
(Please note: these figures are merely an indication of the level of refusal rates each month.)

7
Weighting – Audience Measurement The data are weighted to the national UK profile using target rim weights for age, gender, social class, working status, region and cable/non-cable.
Figures are based on household
% Weighted % Unweighted
Census profile Interviews achieved in July-Dec 2005:
Gender – Male 15+ 48% 47%
Gender – Female 15+ 52% 53%
Age – 15-34 32% 28%
Age – 35-54 35% 33%
Age – 55+ 33% 39%
Social Grade - AB 25% 23%
Social Grade – C1 29% 28%
Social Grade – C2 18% 21%
Social Grade - DE 27% 28%
Working Status – working 57% 49%
Working Status – not working 43% 51%
Region - London 12% 11%
Region – South East & Eastern 23% 20%
Region – South West 8% 8%
Region – W&E Midlands 16% 15%
Region – North East 13% 13%
Region – North West 11% 11%
Region - Scotland 9% 9%
Region - Wales 5% 7%
Region – Northern Ireland 3% 7%
Cable 52% 56%
Non-cable 48% 44%
Figures from the 2001 census data describing the UK Household profile and these figures were used to weight the data. Those percentages described as ‘unweighted,’ are the actual percentage of interviews achieved in Jul-Dec 2005 fieldwork.

8
Population Estimates – Audience measurement The audience measurement data was used to estimate the population sizes of those using Access Services. These exact estimates are detailed in the report. The audience measurement exercise was not a census and therefore population sizes were based on samples of the population. Therefore, each population estimate also has an upper and lower confidence level within which the true figure could fall. The percentages that we achieved for usage of access services in the audience measurement phase were used to calculate the population figures. All calculations were prepared on the basis that the UK population aged over 16 years totals 48,092,221 people.2 Confidence Intervals for these estimates were also calculated using the normal approximation to the binomial distribution*. To use the normal approximation the following equations have to hold true:
⇒ The sum of n*p > 30 and/or the sum of n*q > 30.
(In other words if the sample size multiplied by the proportion of people with the character of interest is < 30 or if the sample size multiplied by 1 - the proportion of people with the character of interest is < 30)
Where this didn't hold true we used the exact binomial calculation. The design factor due to weighting was also provided. (* The normal approximation to the binomial distribution CI calculation we used was: Y= N*p +/- (t*N*s) Y estimated total N population size p estimated proportion t t value (95%=1.96) s population variance estimate (in our case sqrt(pq/(n-1)) n effective sample size q 1 - estimated proportion For situations where n*p and/or n*q < 30 we used the following formula to find the upper and lower confidence intervals. We then went on to multiple PU and pL by the population size N. Solve the equation
for pU to obtain the upper 100(1 - )% limit for p.
2 This was calculated using the mid year 2004 Census for Great Britain estimate and the 2001 Census estimate for Northern Ireland

9
Next solve the equation
for pL to obtain the lower 100(1 - )% limit for p.)
10
Case Study Questionnaire construction and piloting As with all MORI studies, the methodology and questionnaire were designed to provide reliable data by minimising sources of error wherever possible. Both Ofcom and MORI felt that a self-completion questionnaire was appropriate for the Market sizing study provided it was carefully designed and, where possible, an interviewer was on hand to assist respondents if required. The questionnaire was designed by MORI in conjunction with Ofcom. A number of principles informed this process:
clear, user friendly layout (easily to read, large font)
short and clear instructions
easily understood wording
inclusion of ‘don't know’ options
exhaustive response categories that fit the question and were
MORI piloted a working draft of the questionnaire with both the visually and hearing impaired, who were approached to complete and review the questionnaire with members of the study team. This proved to be invaluable in informing questionnaire development, in particular it highlighted areas of confusion or inaccuracy, and flagged up other issues for consideration. Pilots were conducted at the following locations:
Southwark College – among students of Deaf Basic Skills
Bromley Blind Association
Methodology Given the relatively low incidence of the hearing and visually impaired within the UK population, a detailed quantitative study based on a truly representative random sample of these groups was ruled out as impractical and hugely costly. We would therefore highlight that the case study was not designed to be statistically representative of the UK hearing and visually impaired populations. It instead endeavoured to build a detailed picture of the patterns of usage and experiences of access services among these key target user groups. Additionally, we aimed to achieve sufficient interviews to facilitate data analysis at sub-group level, in particular to enable us to focus on those with profound or severe levels of impairment.

11
Our original case study design is illustrated below:
•300 interviews•Assisted Self-completion
•Option of offering interviewing by signer (c150 interviews)
Hearing Impairment
Visual Impairment
•300 interviews•Assisted Self-completion
•15 minutes each•Option of offering Braille
600 interviews:20 interviews in each of 30 sampling points.(Yielding robust data and also enabling us to pick up sufficient numbers of niche groups)
A case study approach focusing on two key groups
MORI planned to conduct 20 interviews in each of 30 sampling points in Great Britain (ten with hearing impaired and ten with visually impaired respondents). Within each sampling point, a maximum of 5 interviews were permitted at any one location; we thus required the involvement of at least 4 different organisations in each sampling point. This meant that it was necessary to for MORI to secure the assistance of around 120 local organisations/centres/community groups in total. These organisations included charities, drop-in centres, coffee mornings, information centres and meetings for those who are either deaf/hard or hearing or blind or partially sighted. However, during the course of fieldwork we found that there were simply too few organisations in some sampling points that were able or willing to assist the study (many were incapable of accommodating our interviewers within the required fieldwork period). Nevertheless, we were able to conduct at least some interviews in almost all of the 30 sampling points. Our methodology was therefore revised during fieldwork to include both telephone and postal techniques, which are detailed below. Interview completion process The mix of approaches used for the case study ensured a broad range of respondents both in terms of gender, region and degree of impairment. Arguably the resulting sample is more representative than if we had used a single approach only. a) Community groups/centres/local organisations Thirty eight percent of interviews were conducted with an interviewer present at various community groups/centres/local organisations around the country. These questionnaires were self-completed by respondents either one at a time or in group completion sessions.

12
The attendance of an interviewer enabled respondents ask for clarification of question wording if necessary. A signer was also available to aid those respondents who communicated with BSL as their first language. b) Telephone The sample3 interviewed via telephone largely consisted of those with sight problems. As with face-to-face methodology, the respondents interviewed via the telephone had the opportunity to clarify questions with the interviewer during the interview. c) Postal Questionnaires were sent to a mix of both those with a hearing or visual impairment. Stakeholders Key stakeholder groups – in particular RNID and RNIB - were involved in the development of the requirements of the research but were excluded from getting involved in the research itself (in particular we did not utilise their membership organisations to generate leads for the interviewing or to input into the questionnaire design). This was to ensure that research findings are impartial and unbiased. MORI’s reputation for excellence stems from our insistence on quality at every stage of a research project. We will not accept interference from clients who wish to bias results in any way. We are happy to confirm that at no stage in this project has the Ofcom or any other body attempted to impose leading questions, or seek anything other than a genuine representation of the views of respondents.
3 Sample for both the telephone and postal elements of this research was purchased from Experian, which has databases of people with both hearing and sight impairments.
13
Sampling – Case Studies Selection of the sample points for interviews MORI selected 40 LAs in GB randomly (30 of which were for the main sample and 10 were held in reserve). Islands were excluded from the frame / scheme. It would not be entirely appropriate to select the 40 LAs (from the 400 or thereabouts) with "equal probability" (i.e. that each LA is equally likely to occur in the sample as the next), where the intention would be to take an equal number of households from each LA. The implication would be that respondents from a small LA would have a greater chance of being selected than one from an LA with a larger population. To counteract this, the sampling of LAs was deliberately "skewed" in order to give those with the largest population a proportionately greater chance than those with the smallest. e.g. consider 2 LAs: LA1: Population 20,000 households (HH) LA2: Population 40,000 households If one selects 10 households from each, then a particular HH from LA1 has a 1 in 2,000 chance of being selected, and HH from LA2 has a 1 in 4,000 chance of being selected (ie only 1/2 as much). Therefore, we would need to select the LAs with probability (of selection) proportional to size, to balance this out. Thus, although LA2 would have a greater chance of selection, there is a much smaller chance that any one particular HH within LA2 would be of the 10 that would be chosen from it. Finally, in order to achieve an even spread of LAs across the country (i.e. counties and regions), MORI listed out the LAs in order of Government Office Region and County and select the LAs sequentially on a "1 in n" basis. This effectively amounts to stratification.
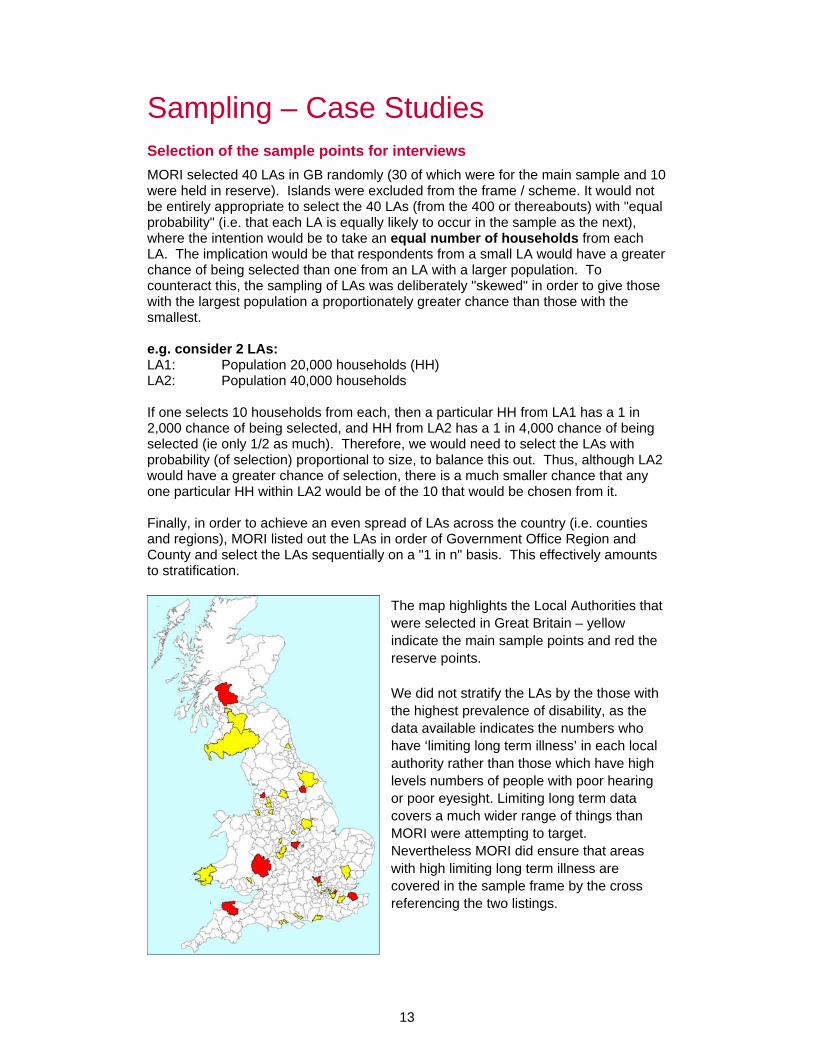
The map highlights the Local Authorities that were selected in Great Britain – yellow indicate the main sample points and red the reserve points. We did not stratify the LAs by the those with the highest prevalence of disability, as the data available indicates the numbers who have ‘limiting long term illness’ in each local authority rather than those which have high levels numbers of people with poor hearing or poor eyesight. Limiting long term data covers a much wider range of things than MORI were attempting to target. Nevertheless MORI did ensure that areas with high limiting long term illness are covered in the sample frame by the cross referencing the two listings.
14
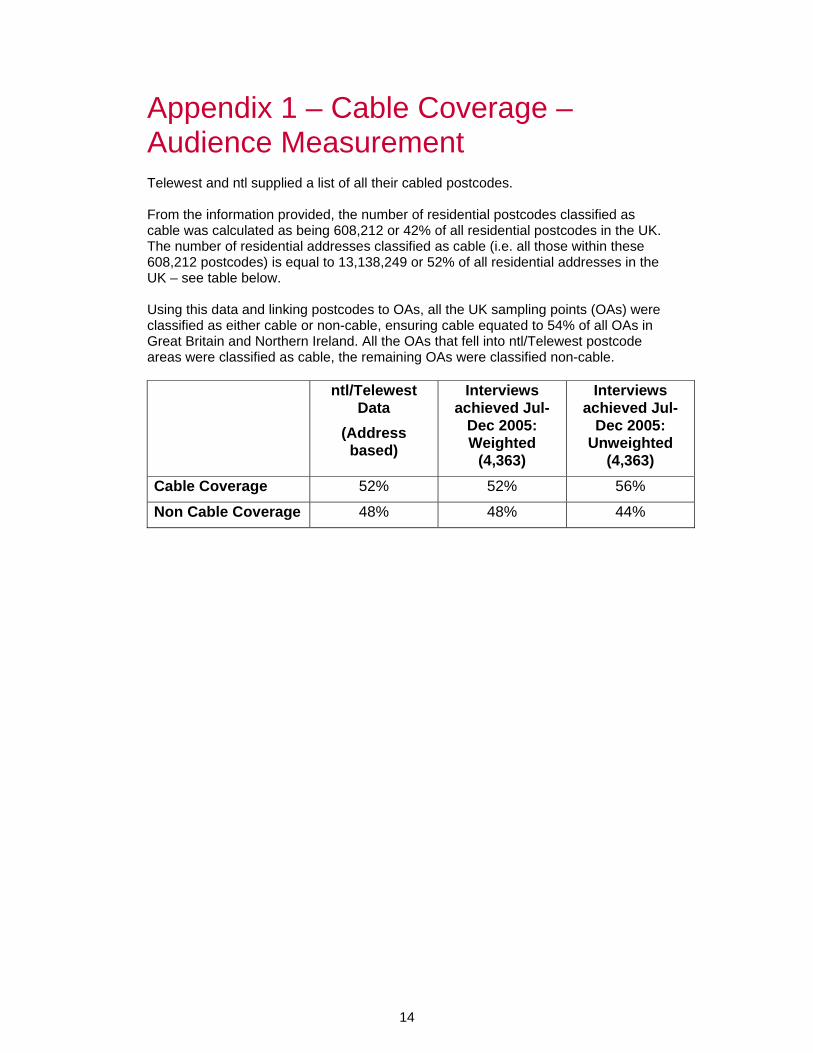
Appendix 1 – Cable Coverage – Audience Measurement Telewest and ntl supplied a list of all their cabled postcodes. From the information provided, the number of residential postcodes classified as cable was calculated as being 608,212 or 42% of all residential postcodes in the UK. The number of residential addresses classified as cable (i.e. all those within these 608,212 postcodes) is equal to 13,138,249 or 52% of all residential addresses in the UK – see table below. Using this data and linking postcodes to OAs, all the UK sampling points (OAs) were classified as either cable or non-cable, ensuring cable equated to 54% of all OAs in Great Britain and Northern Ireland. All the OAs that fell into ntl/Telewest postcode areas were classified as cable, the remaining OAs were classified non-cable. ntl/Telewest
Data (Address
based)
Interviews achieved Jul-
Dec 2005: Weighted
(4,363)
Interviews achieved Jul-
Dec 2005: Unweighted
(4,363) Cable Coverage 52% 52% 56%
Non Cable Coverage 48% 48% 44%
15
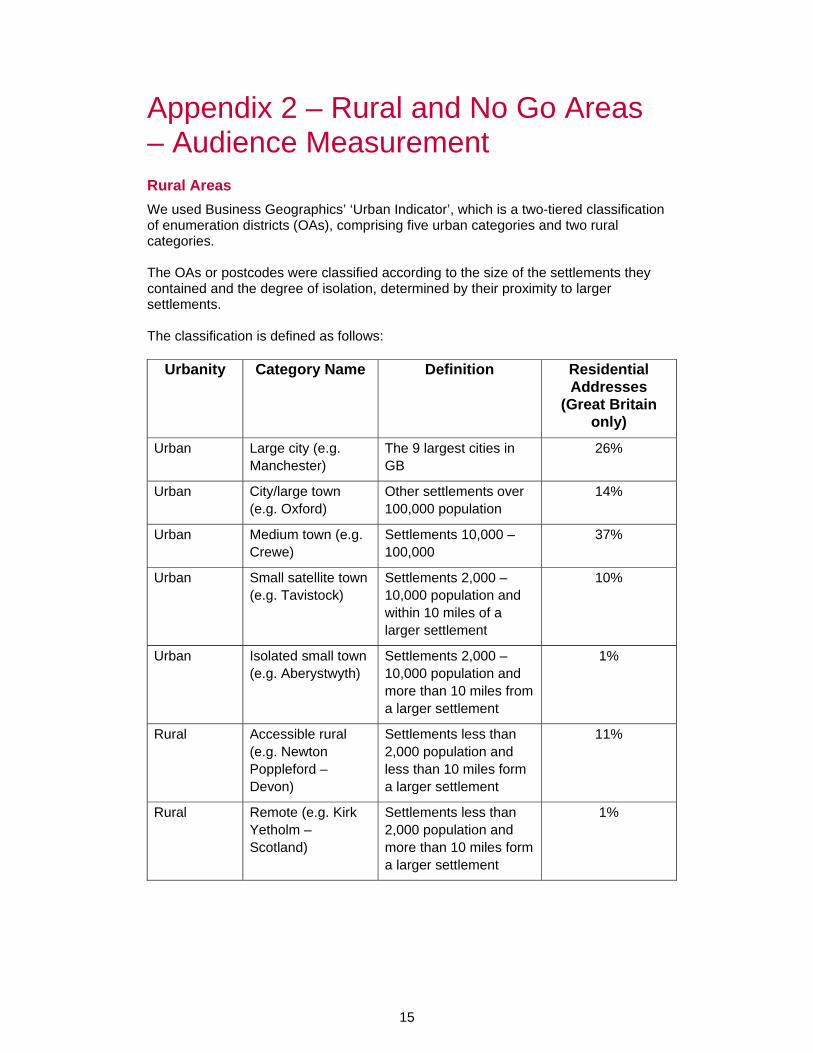
Appendix 2 – Rural and No Go Areas – Audience Measurement Rural Areas We used Business Geographics’ ‘Urban Indicator’, which is a two-tiered classification of enumeration districts (OAs), comprising five urban categories and two rural categories. The OAs or postcodes were classified according to the size of the settlements they contained and the degree of isolation, determined by their proximity to larger settlements. The classification is defined as follows:
Urbanity Category Name Definition Residential Addresses
(Great Britain only)
Urban Large city (e.g. Manchester)
The 9 largest cities in GB
26%
Urban City/large town (e.g. Oxford)
Other settlements over 100,000 population
14%
Urban Medium town (e.g. Crewe)
Settlements 10,000 – 100,000
37%
Urban Small satellite town (e.g. Tavistock)
Settlements 2,000 – 10,000 population and within 10 miles of a larger settlement
10%
Urban Isolated small town (e.g. Aberystwyth)
Settlements 2,000 – 10,000 population and more than 10 miles from a larger settlement
1%
Rural Accessible rural (e.g. Newton Poppleford – Devon)
Settlements less than 2,000 population and less than 10 miles form a larger settlement
11%
Rural Remote (e.g. Kirk Yetholm – Scotland)
Settlements less than 2,000 population and more than 10 miles form a larger settlement
1%

16
July-December 2005 fieldwork achieved the following interviews by urban/rural: GB Profile
(Address based)GB Interviews achieved Jul-
Dec 2005: Weighted
(4,040)
GB Interviews achieved Jul-
Dec 2005: Unweighted
(4,040) Cities/large towns - urban
38% 40% 41%
Medium size towns – urban
36% 36% 37%
Small towns – urban 13% 13% 12%
Rural 13% 11% 10%
NI Interviews achieved Jul-
Dec 2005: Weighted (121)
NI Interviews achieved Jul-
Dec 2005: Unweighted
(323) Urban 85% 86%
Rural 15% 14%
The following areas were excluded at the outset: 1. Northern Ireland
• West Belfast – Beechmount, Falls Park, Clonard
• North Belfast – Ardoyne
• Foyle – Creggan Shantallow
2. Scotland: The Highlands and Islands.
17
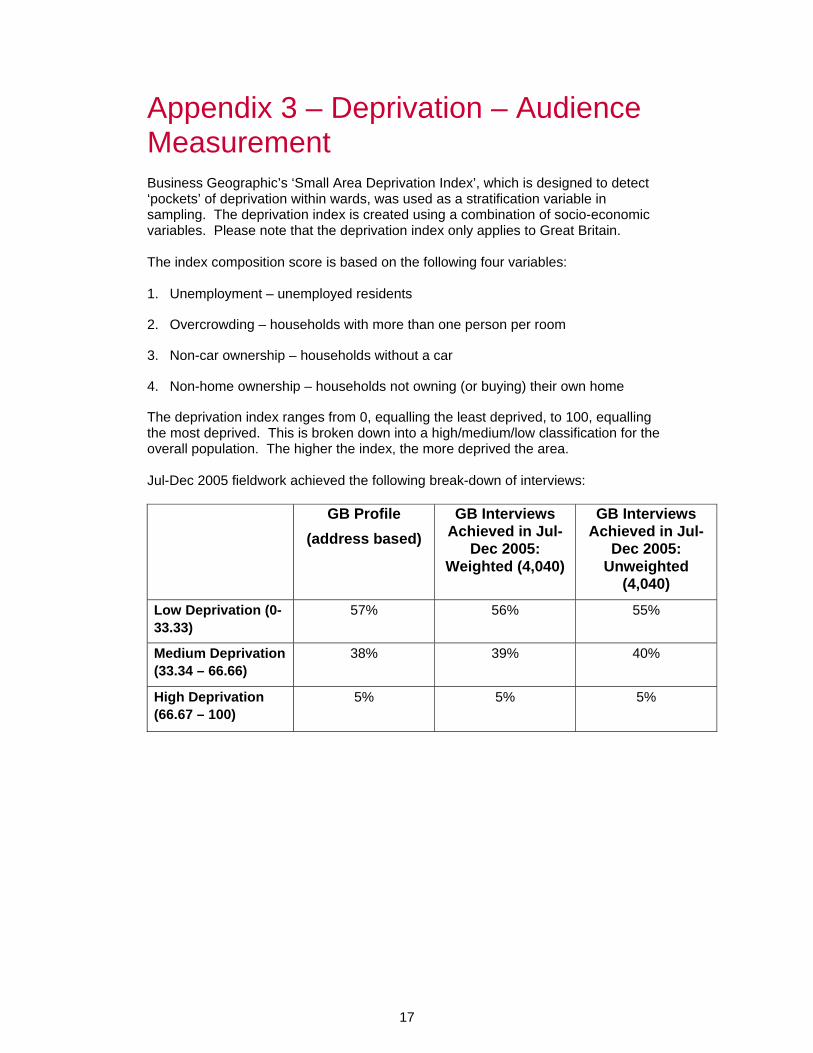
Appendix 3 – Deprivation – Audience Measurement Business Geographic’s ‘Small Area Deprivation Index’, which is designed to detect ‘pockets’ of deprivation within wards, was used as a stratification variable in sampling. The deprivation index is created using a combination of socio-economic variables. Please note that the deprivation index only applies to Great Britain. The index composition score is based on the following four variables: 1. Unemployment – unemployed residents
2. Overcrowding – households with more than one person per room
3. Non-car ownership – households without a car
4. Non-home ownership – households not owning (or buying) their own home
The deprivation index ranges from 0, equalling the least deprived, to 100, equalling the most deprived. This is broken down into a high/medium/low classification for the overall population. The higher the index, the more deprived the area. Jul-Dec 2005 fieldwork achieved the following break-down of interviews:
GB Profile (address based)
GB Interviews Achieved in Jul-
Dec 2005: Weighted (4,040)
GB Interviews Achieved in Jul-
Dec 2005: Unweighted
(4,040) Low Deprivation (0-33.33)
57% 56% 55%
Medium Deprivation (33.34 – 66.66)
38% 39% 40%
High Deprivation (66.67 – 100)
5% 5% 5%
18
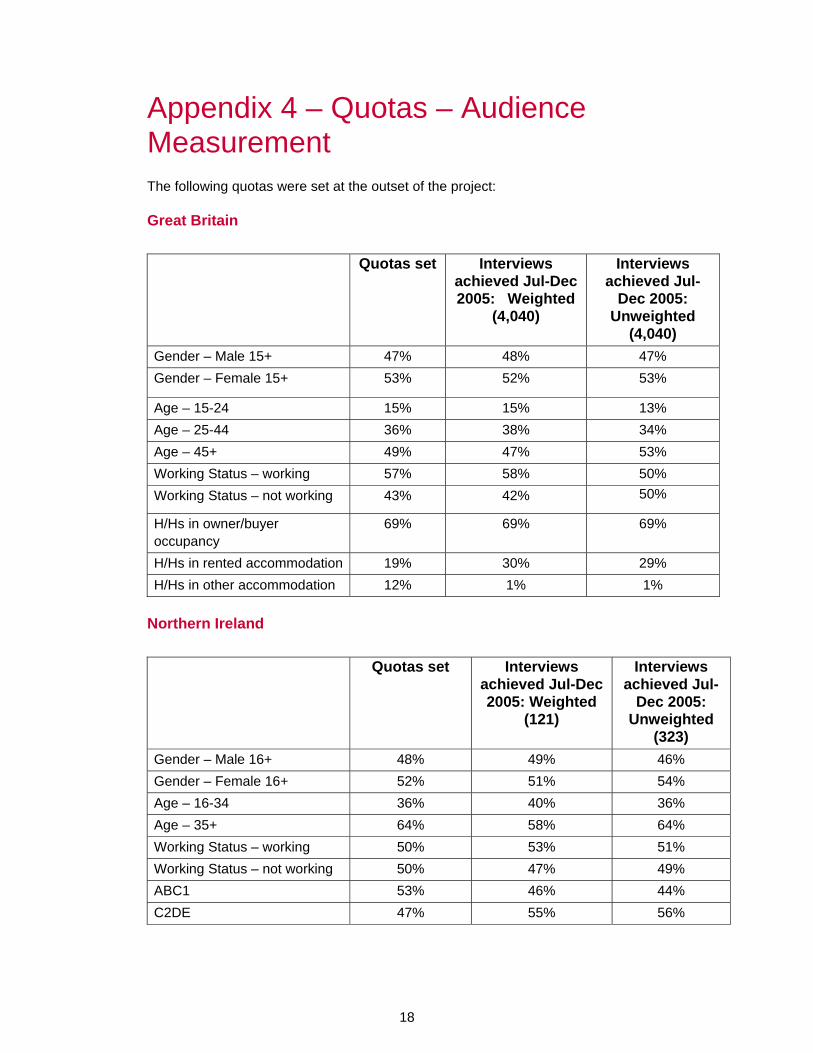
Appendix 4 – Quotas – Audience Measurement The following quotas were set at the outset of the project: Great Britain
Quotas set Interviews achieved Jul-Dec 2005: Weighted
(4,040)
Interviews achieved Jul-
Dec 2005: Unweighted
(4,040) Gender – Male 15+ 47% 48% 47% Gender – Female 15+ 53% 52% 53%
Age – 15-24 15% 15% 13% Age – 25-44 36% 38% 34% Age – 45+ 49% 47% 53% Working Status – working 57% 58% 50% Working Status – not working 43% 42% 50%
H/Hs in owner/buyer occupancy
69% 69% 69%
H/Hs in rented accommodation 19% 30% 29% H/Hs in other accommodation 12% 1% 1%
Northern Ireland Quotas set Interviews
achieved Jul-Dec 2005: Weighted
(121)
Interviews achieved Jul-
Dec 2005: Unweighted
(323) Gender – Male 16+ 48% 49% 46% Gender – Female 16+ 52% 51% 54% Age – 16-34 36% 40% 36% Age – 35+ 64% 58% 64% Working Status – working 50% 53% 51% Working Status – not working 50% 47% 49% ABC1 53% 46% 44% C2DE 47% 55% 56%

19
Appendix 5 – Quotas – Case Study As the case study element of the research was not intended to be representative of the hearing and sight impaired populations we did not set quotas on it. The objective was to sample a range of individuals with different levels of impairment in order to develop a richer picture of how access services are used among these audiences. The profile of the sample achieved was, however, fairly balanced, as follows:
Interviews achieved: Unweighted (608)
Gender – Male 50%
Gender – Female 49%
Age – 18-24 4%
Age – 25-44 11%
Age – 45 plus 85%
Interviews achieved: Unweighted
(464) Hearing impaired
Profound 8%
Severe 19%
Moderate 29%
Mild 45%
Interviews achieved: Unweighted
(244) Visually impaired
Profound 14%
Severe 26%
Moderate 22%
Mild 39%

20
Appendix 6 - Guide to Statistical Reliability The variation between the sample results and the “true” values (the findings that would have been obtained if everyone had been interviewed) can be predicted from the sample sizes on which the results are based, and on the number of times that a particular answer is given. The confidence with which we can make this prediction is usually chosen to be 95%, that is, the chances are 95 in 100 that the “true” values will fall within a specified range. The table below illustrates the required ranges for different sample sizes and percentage results at the “95% confidence interval”:
Approximate sampling tolerances applicable to percentages at or near these levels
Sample size – Audience Measurement sample size examples
10% or 90%
±
20% or 80%
±
30% or 70%
±
40% or 60%
±
50 ±
4,363 (All respondents) 0.9 1.2 1.4 1.5 1.5
404 (All with a any hearing impairment
2.9 3.9 4.5 4.8 4.9
267 (All with a any visual impairment
3.6 4.8 5.5 5.9 6.0
Source: MORI
For example, if 30% or 70% of a sample of 404 gives a particular answer, the chances are 95 in 100 that the “true” value will fall within the range of + 4.5 percentage points from the sample results. When results are compared between separate groups within a sample, different results may be obtained. The difference may be “real”, or it may occur by chance (because not everyone has been interviewed). To test if the difference is a real one – i.e. if it is “statistically significant” – we again have to know the size of the samples, the percentages giving a certain answer and the degree of confidence chosen. If we assume “95% confidence interval”, the difference between two sample results must be greater than the values given in the table below to be significant:

21
Differences required for significant at or near these percentages
Sample sizes being compared (sub-groups or trends)
10% or
90% ±
20% or
80% ±
30% or
70% ±
40% or
60% ±
50% ±
404 v 267 (hearing impaired v visual impaired)
4.6 6.2 7.1 7.6 7.7
Source: MORI