
Accelerator Reliability and AvailabilityNon-constant failure rates and survival function • There...
48
Accelerator Reliability and Availability F. Willeke Joint Accelerator School Newport Beach, Ca, 7 November 2014
Transcript of Accelerator Reliability and AvailabilityNon-constant failure rates and survival function • There...

Accelerator Reliability and Availability
F. Willeke Joint Accelerator School
Newport Beach, Ca, 7 November 2014

Overview
• Introduction
• Short summary of definitions and relationships
• Elements of high reliability design
• Achieving and maintaining high reliability in operations
• NSLS-II reliability estimate component reliability
• Availability simulations
2

Introduction • Accelerators of multiple user facilities are required to be highly
reliable and the beam is required to be available at scheduled times.
• Typical requirement of beam availability at scheduled times Availability > 95%
• The motivation for understanding reliability issues in accelerators is to
- design accelerators for high reliability
- develop (preventive) maintenance programs
- Predict performance
3

Understanding Reliability
4

Understanding Reliability
• Methods for assessing reliability have been developed in and for industry and are well suited to assess reliability and lifetime of mass-produced units.
• Basis of modeling are idealizing assumptions: such as that failures interpreted as statistical events
• Accelerator systems are complex and very heterogeneous but the number of components of a single type is not as large as industrial production numbers (<~1000). Due to number of components being relatively small and the number of samples for assessing reliability even smaller need to be careful to draw conclusions..
• In reality failures are not uncorrelated related and it is complicated to include such coupling into reliability modeling.
Reliability modeling is a powerful tool, but you need to be ware of the limitations of the modeling,
5

Short Summary of definitions and relationships
MTBF (mean time between failures)
Average time between two failures of a repairable system
MTTR (mean time to repair)
Average time to recover from a failure
AVAILABILITY = 1 – MTTR/ (MTBF+MTTR)
6

Failure of Composite System
In case of a system is composed of multiple systems labeled “i”
Availability of the entire system is
7

Statistical Model
Failures are considered statistical events
Which are uncorrelated to previous failures or failures of other components of subsystems
Obviously a simplification, has to remembered when analyzing failures
8

Failure Rate and Failure Density Distribution
p = l∙Dt:
probability for system to fail within any small time interval of length Dt
If l is constant in time, the failure density distribution function probability for system to fail within a certain time interval n of length Dt :
fn ∙Dt = (1-p)n-1p
fn is a normalized distribution function S fn Dt = 1
9
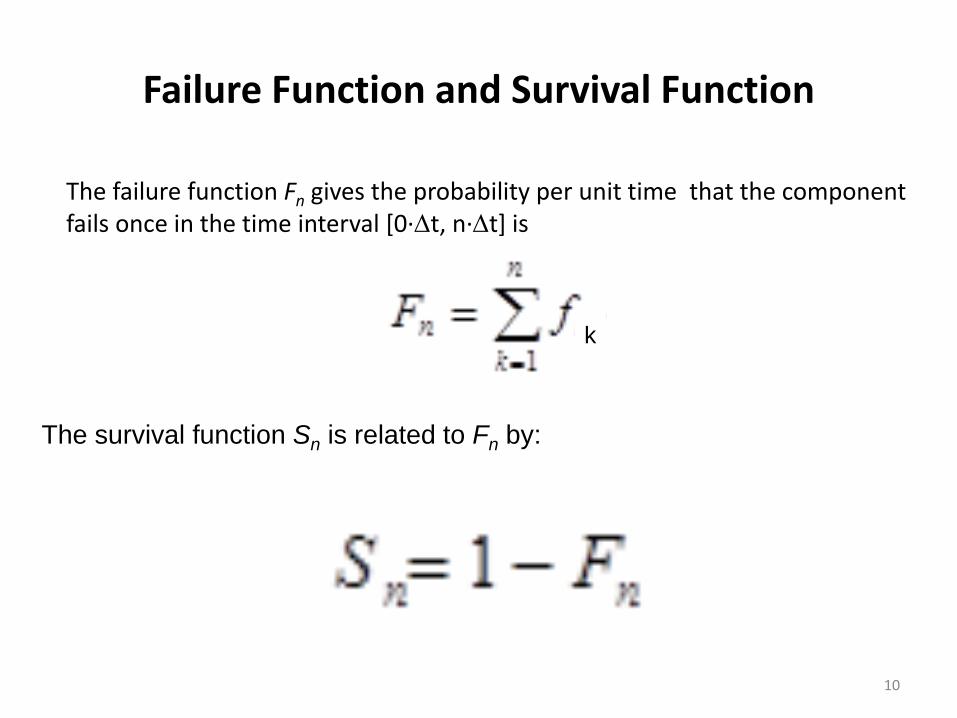
Failure Function and Survival Function
The failure function Fn gives the probability per unit time that the component fails once in the time interval [0∙Dt, n∙Dt] is
The survival function Sn is related to Fn by:
k
10
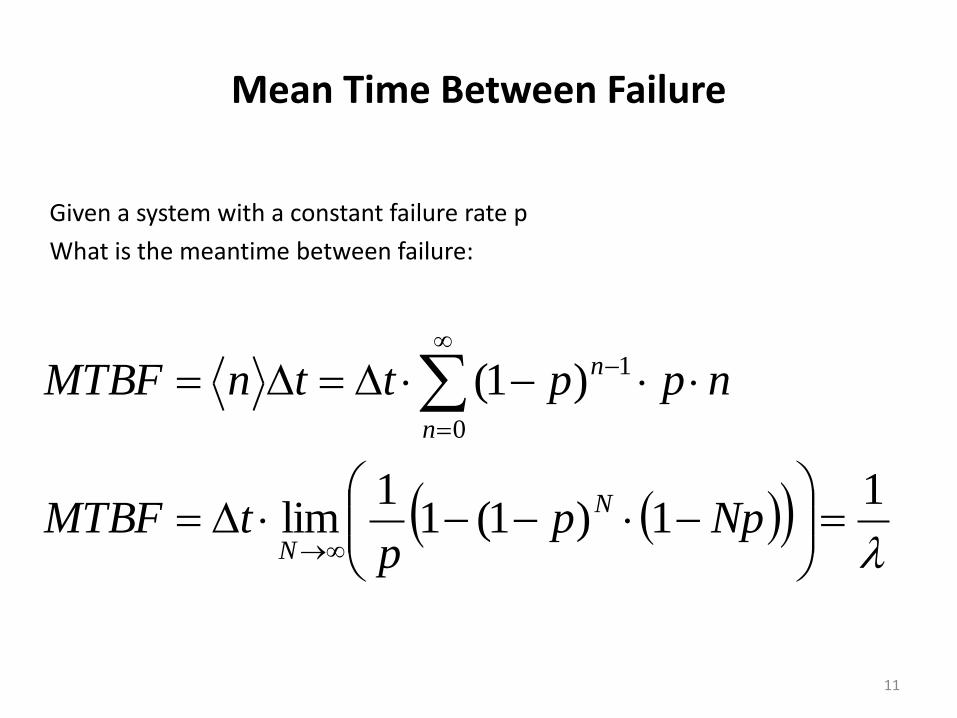
Mean Time Between Failure
Given a system with a constant failure rate p
What is the meantime between failure:
l
11)1(1
1lim
)1(0
1
D
DD
Nppp
tMTBF
nppttnMTBF
N
N
n
n
11

Given a system with M identical components, each having a constant failure probability p=lDt,
What is the probability for failure of n components in any interval of time Dt?
Systems with N identical components
mmM
mM ppm
MP
)1(,
What is the average numbers of failures to be expected in any time interval Dt
M
m nM pMmPm0 ,
MFBFM= Dt/(Mp) = 1/(Ml) 12

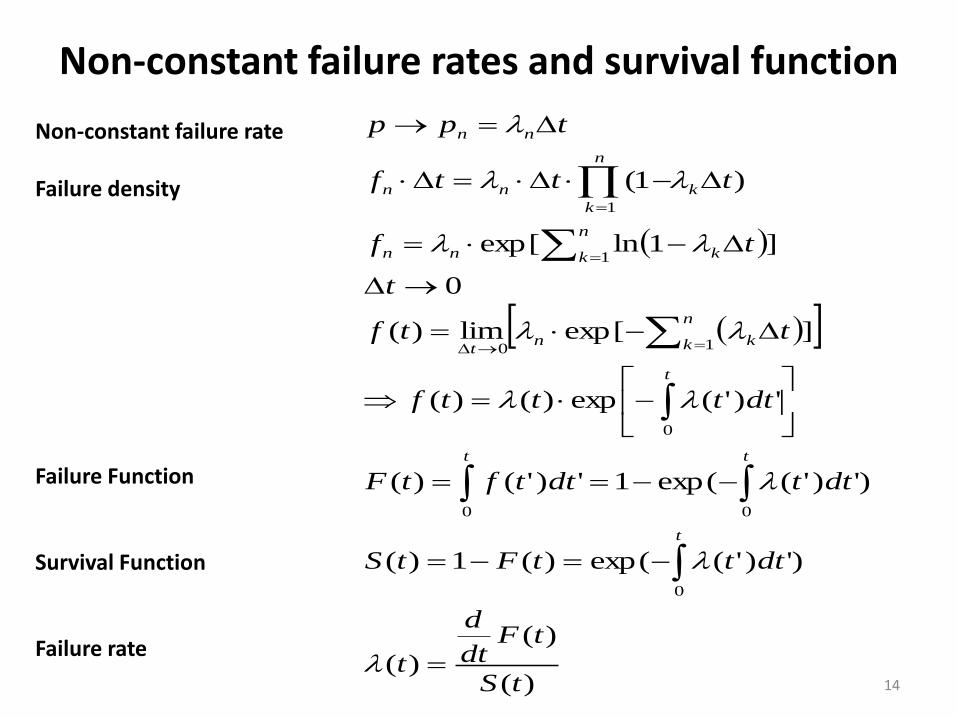
Non-constant failure rates and survival function
• There are many reasons why a constant failure rate is not describing sufficiently well the system reliability over an extended period:
• Enhanced early failure rates (early mortality)
• Replacement or repair of components which fail often
• Changing external conditions: temperature, humidity, thermal stress during start-up, shut-down
• Ageing
• Wear-out
The failure rate depends on time and in order to analyze failures and predict system behavior from sample behavior, the model must be extended to time dependent rates.
13
Non-constant failure rates and survival function
)(
)(
)(
)')'(exp()(1)(
)')'(exp(1')'()(
')'(exp)()(
]exp[lim)(
0
]1lnexp[
)1(
0
00
0
10
1
1
tS
tFdt
d
t
dtttFtS
dttdttftF
dttttf
ttf
t
tf
tttf
tpp
t
tt
t
n
k knt
n
k knn
k
n
k
nn
nn
D
D
D
DDD
D
D
l
l
l
ll
ll
ll
ll
lNon-constant failure rate Failure density Failure Function Survival Function Failure rate
14
)(
)(
)(
)(
)(exp)(explim
)(exp)(
)(
0
0
0 000
0 0
0
tS
tSd
tMRL
meSurvivalti
tSdtMTBF
ddtdtMTBF
dttdtMTBF
tftdtMTBF
tx
t
x
t
ll
ll
MTBF Non-constant Failure Rate
15

Exponentially Distributed Failures (l=constant)
0
0.002
0.004
0.006
0.008
0.01
0.012
0 50 100 150 200 250 300
time
f(t)
l
l
ll
l
/1
)exp()(
)exp()(
MTBF
ttS
ttf
const
16

Parameterizing Systems with time dependent
failure rate (Weibull Parameterization)
abMTBF
b
ttS
b
t
b
t
b
atf
b
t
b
at
a
aa
a
11
exp)(
exp)(
)(
1
1
l
17

0
0.2
0.4
0.6
0.8
1
1.2
1.4
0 100 200 300 400 500 600
Fail
ure
Ra
te
Time
Weibull Parameterization
SUM
a=0.8
a=1
a=5
a=2.27
18

Accelerator Design
COST
OPERATION
AL
EFFICIENCY
PEAK
PERFOR-
MANCE
19

Design for High Availability
Considerations: • Overall Complexity • Unavoidable Weakness • Subsystem Architecture • Fail Safe Design • Overrated Design • Environmental Impact • Error Prone Solutions • Build-in Redundancy and Hot Spares • Built-in Diagnostics • Repair and Maintenance Friendly
Design 20

Subsystem Architecture
Monolithic versus Modular Design
Case to Case Decision
Avoid coupling of the two types of architecture
DC “Mother”
PS
Switched Mode “Daughter” PS
21
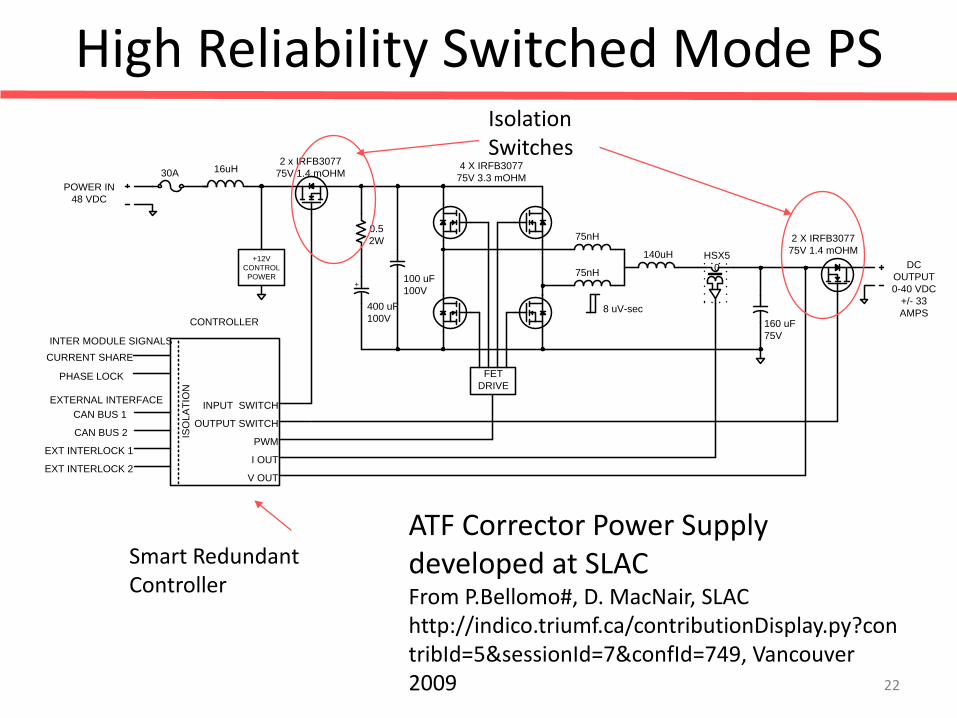
High Reliability Switched Mode PS
POWER IN
48 VDC
DC
OUTPUT
0-40 VDC
+/- 33
AMPS
FET
DRIVE
+12V
CONTROL
POWER
4 X IRFB3077
75V 3.3 mOHM
2 X IRFB3077
75V 1.4 mOHM
2 x IRFB3077
75V 1.4 mOHM
100 uF
100V
400 uF
100V
0.5
2W
160 uF
75V
HSX5
0
+
CAN BUS 1
CAN BUS 2
CURRENT SHARE
PHASE LOCK
EXT INTERLOCK 1
EXT INTERLOCK 2V OUT
OUTPUT SWITCH
PWM
I OUT
CONTROLLER
INTER MODULE SIGNALS
EXTERNAL INTERFACEINPUT SWITCH
ISO
LA
TIO
N
30A 16uH
75nH
75nH
8 uV-sec
140uH
Isolation Switches
Smart Redundant Controller
ATF Corrector Power Supply developed at SLAC From P.Bellomo#, D. MacNair, SLAC http://indico.triumf.ca/contributionDisplay.py?contribId=5&sessionId=7&confId=749, Vancouver 2009 22

NSLS-II Solution: Small AC/DC Supplies
Courtesy G. Ganetis, BNL
23
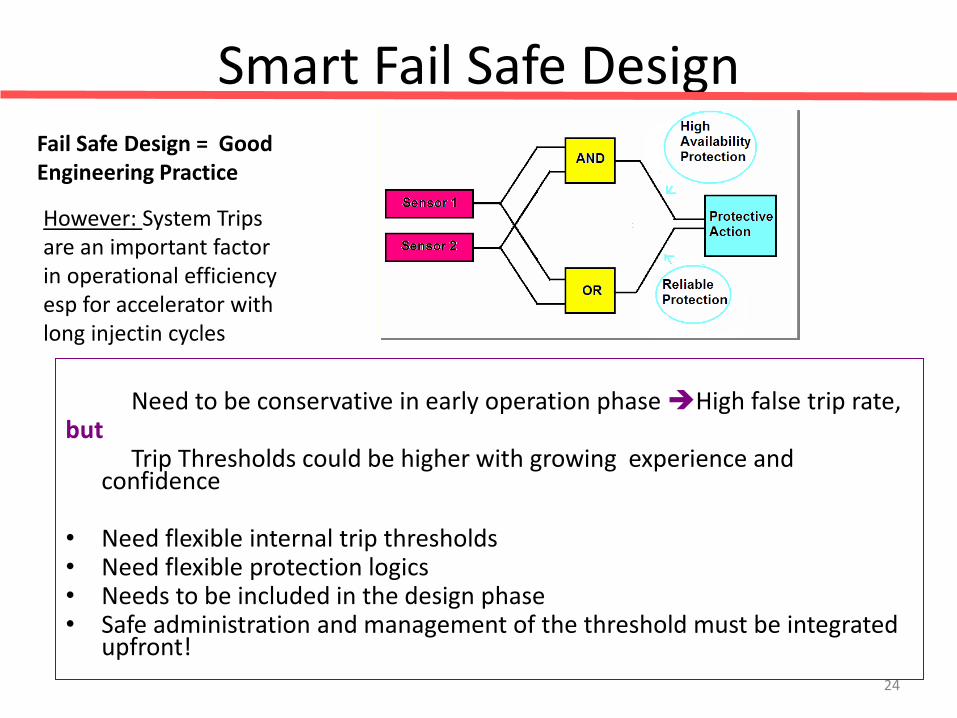
Smart Fail Safe Design
Need to be conservative in early operation phase High false trip rate, but Trip Thresholds could be higher with growing experience and
confidence • Need flexible internal trip thresholds • Need flexible protection logics • Needs to be included in the design phase • Safe administration and management of the threshold must be integrated
upfront!
Fail Safe Design = Good Engineering Practice
However: System Trips are an important factor in operational efficiency esp for accelerator with long injectin cycles
24

Overrated Design
Overrating of Power Components: • Reduced operating temperature -Reduced temperature change when switching on/off -Less mechanical and thermal stress on Components • Operating further away from internal trip thresholds Lower Failure Rate Difficult to optimize overrating For magnet power supply gain in reliability varies from vendor to vendor Example HERA Experience: Beam Current @ 1996 Limited by RF Trip Rate <1996 After RF power margin of ~30% was added by adding an 8th 1.5MW klystron
transmitter and fixing SC RF cavity problem Beam current increased from 35mA 50mA
D
D
0
2
00
11exp
TTk
E
T
T
l
l
Temperature Failure Enhancement Factor for Electronics
Thermal Cycling
Thermal Stress
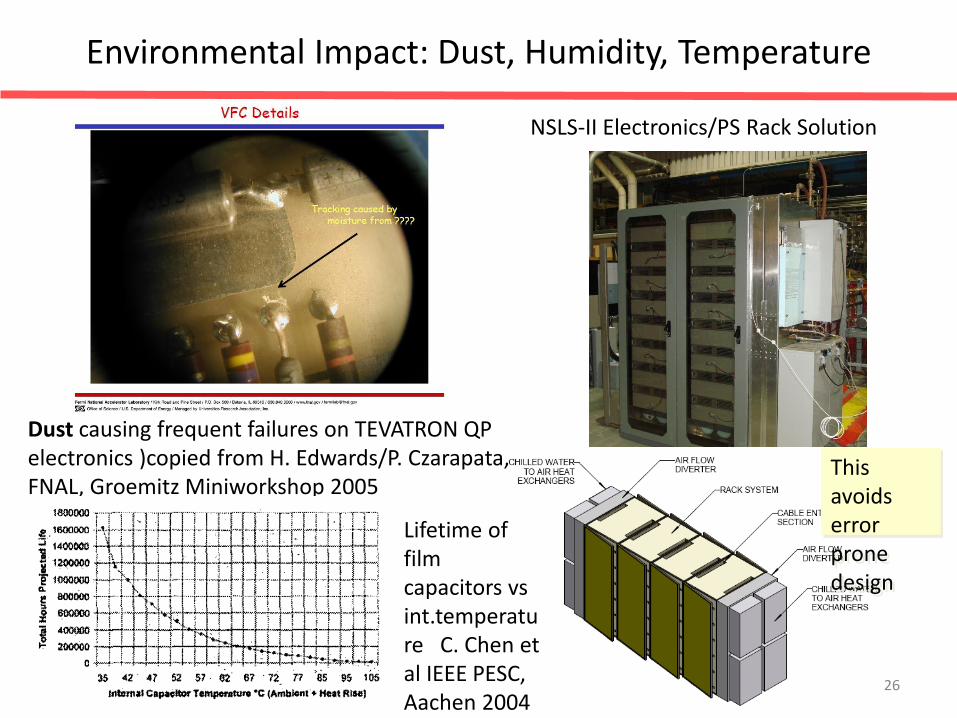
Environmental Impact: Dust, Humidity, Temperature
Dust causing frequent failures on TEVATRON QP electronics )copied from H. Edwards/P. Czarapata, FNAL, Groemitz Miniworkshop 2005
NSLS-II Electronics/PS Rack Solution
This avoids error prone design
Lifetime of film capacitors vs int.temperature C. Chen et al IEEE PESC, Aachen 2004
26

Error Prone Solutions • Water Cooling
• Electrical Connectors
Replace analog cable connections by serial digital links where ever feasible (gain reliability, save costs)
PID
PID
PID
TS TS TS
TS TS TS
TS
TS
TS
TS TS
Chilled Water Supply
Chilled Water Return
Air Flow
DiverterChilled Water to Air Heat
ExchangersNema 12 PS Enclosures
CV CV CV
Isolation Valves
TS
TS
Fan Fan Fan
Fan Fan Fan
TS = Temperature Sensor
PID = PID Temp. Controller
CV= Control Valve
TS, HU, & PID data goes to the control system
Fan
Equipment Enclosures Cooling Scheme
PS
&
Controls
PS
&
Controls
PS
&
Controls
HE HE HE
HE = Heat Exchanger
Cold Air = Warm Air =
HUHU
HU = Humidity Sensor
Lexan Door
Example of air-cooled PS design
at NSLS-II

Reliability of Redundant Safeguards
28

Build-in Redundancy and Hot Spares
TESLA/XFEL Switched Mode PS with Hot Spare Redundant Power Modules
Build in Redundancy will increase reliability significantly --If failed modules are replaced continuously needs access! “Hot Swap” Capability helps
Example:
29

Built-in Diagnostics
Built-in diagnostics - long term monitoring and onset of failure detection - trouble shooting -Cross correlations with external factors
30
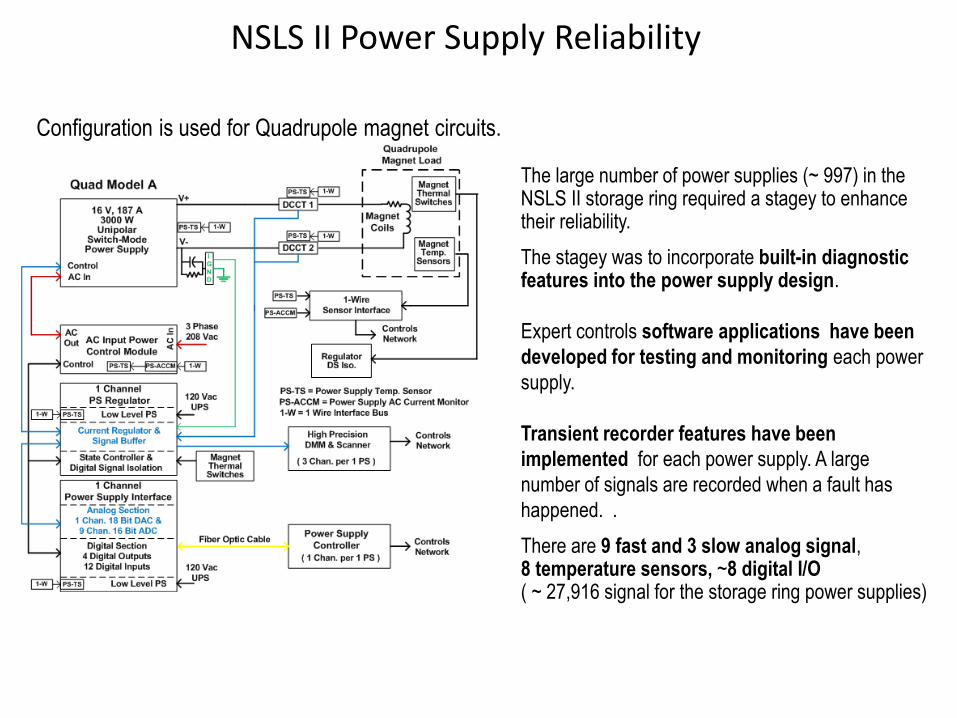
NSLS II Power Supply Reliability
The large number of power supplies (~ 997) in the NSLS II storage ring required a stagey to enhance their reliability.
The stagey was to incorporate built-in diagnostic features into the power supply design.
Expert controls software applications have been
developed for testing and monitoring each power
supply.
Transient recorder features have been
implemented for each power supply. A large
number of signals are recorded when a fault has
happened. .
There are 9 fast and 3 slow analog signal, 8 temperature sensors, ~8 digital I/O ( ~ 27,916 signal for the storage ring power supplies)
Configuration is used for Quadrupole magnet circuits.

Snapshot control/viewer panel
Date and time of the event
Analog signals at time of fault. Time of trigger is at center (5E4), capturing data 5 sec before and 5 sec after.
Digital signals at time of fault
NSLS II Power Supply Reliability Snapshot is a Transient Recorder Software Application
Snapshot was used to
determine a design flaw
in a commercial power
converter. The flaw
cause random shut offs
of the power
converters. Very
detailed data was
captured on many
different power
converter faults.
The root cause was
found by analyzing all
the different data sets
that were captured.
32

Repair and Maintenance Friendly Design
Power Supply Rack System with Docking System for fast replacement of the entire unit
Good accessibility of components important to minimize trouble shooting and repair. However, is often compromised
33
HIGH AVAILABILITY OPERATIONS
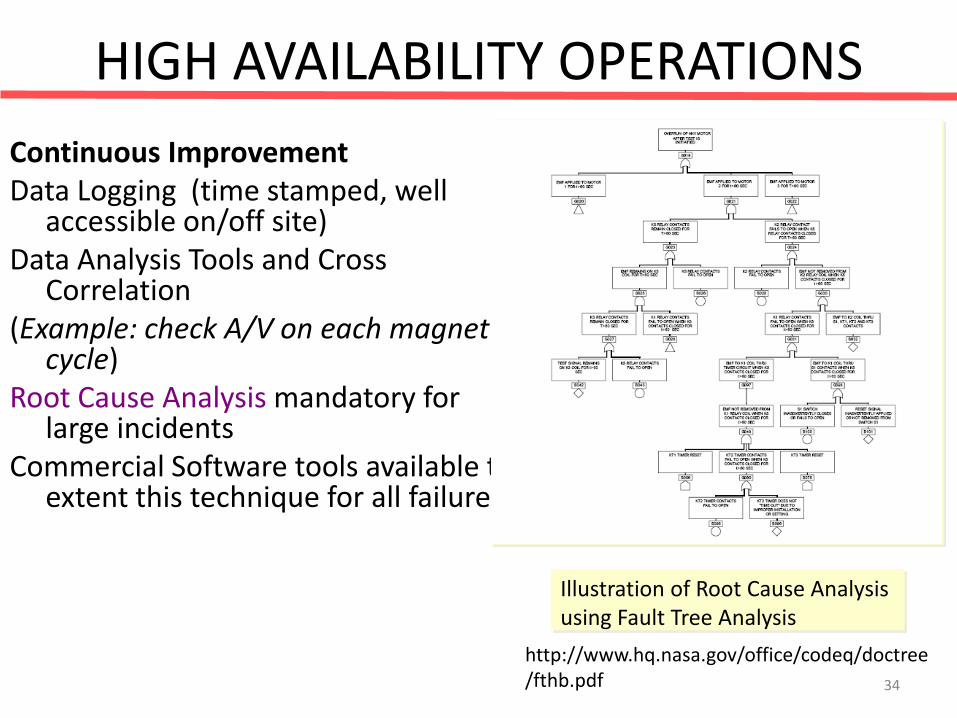
Continuous Improvement Data Logging (time stamped, well
accessible on/off site) Data Analysis Tools and Cross
Correlation (Example: check A/V on each magnet
cycle) Root Cause Analysis mandatory for
large incidents Commercial Software tools available to
extent this technique for all failures
Illustration of Root Cause Analysis using Fault Tree Analysis
http://www.hq.nasa.gov/office/codeq/doctree/fthb.pdf 34

High Availability Operations
Operational Strategy to mitigate Impact of Failure
• Scheduled Maintenance: Opportunity for repair and preventive maintenance
• Back-up programs to operate with limited performance
(accelerator studies)
• Management:
- Cleary defined roles and accountabilities
- Escalation strategy
- Experts On-call
35

HIGH AVAILABILITY OPERATIONS
• Preventive Maintenance
Necessary: Rotating machinery (compressors)
Air Filters
UPS-systems
Desirable: clamped, bolted support systems in PS)
Cooling Water Hoses
Difficult: Connectors
• Preventive Refurbishment
Fans, EL capacitors, small DC supplies, thyratrons,
Fix before Fail
Residual Lifetime Prediction
0
)'(')(
1ttSdt
tSMRL
Was used successful to improve HERA PS system Some supplies: MTBF 15000h50000h
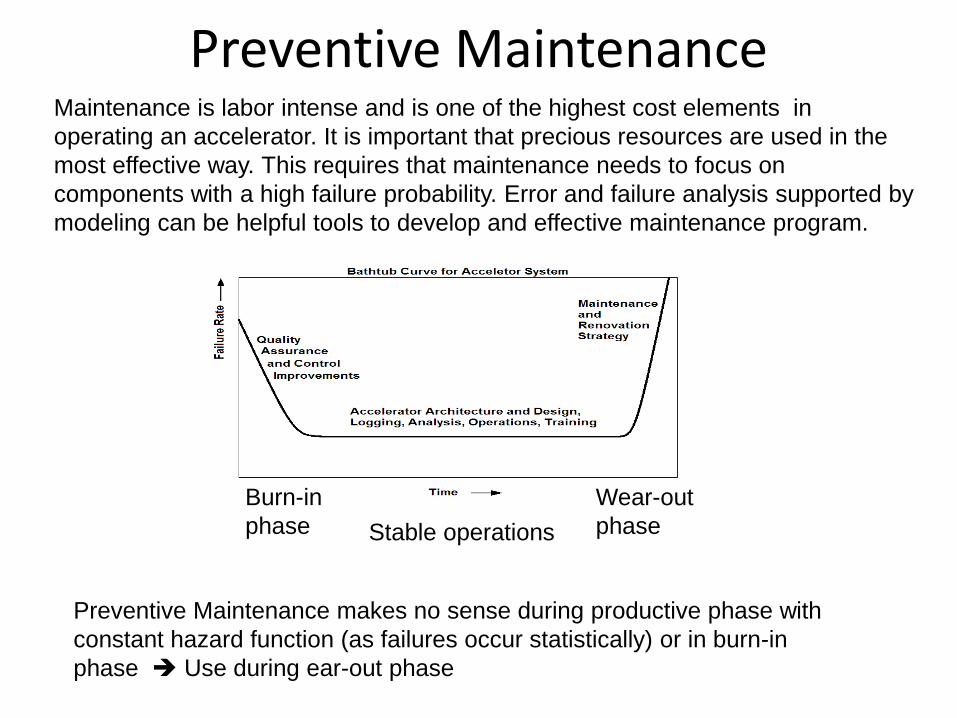
Preventive Maintenance
Preventive Maintenance makes no sense during productive phase with
constant hazard function (as failures occur statistically) or in burn-in
phase Use during ear-out phase
Burn-in
phase
Wear-out
phase Stable operations
Maintenance is labor intense and is one of the highest cost elements in
operating an accelerator. It is important that precious resources are used in the
most effective way. This requires that maintenance needs to focus on
components with a high failure probability. Error and failure analysis supported by
modeling can be helpful tools to develop and effective maintenance program.

Mean Residual Lifetime
38

Statistical Analysis to optimize Preventive Maintenance
Consider a system with 200
wearing-out constituents
Describe by 2-par Weibull
failure distribution
function
Fit the parameters b and h in a linear fit:
Calculate MRL
function
Failure
rate is
increasing
factor 2
In 8y

HIGH AVAILABILITY OPERATIONS
Speed Up Repair
• Transient Recording
• Integration of Operational Data Base and Asset Management
• Remote Access to Build-in Diagnostics
• Logged Data Analysis Tools
• Failure Scenario Data Base
• Start-up Check List
…
40

Human Factor
Human errors are unavoidable but can be minimized with reasonable effort • Clear line of command in operating and maintaining accelerator • Well defined roles and responsibilities • Distribution of information, operation briefings at shift change • Written, reviewed and approved instructions and procedures • Clearly defined line of command for routine/non-routine • Automation of operating procedures wherever safe and possible • Software Interlock System to prevent operator mistakes • Operator Training and Qualification, Motivation • On-line Technical and Procedural Information • Ergonomic Operation Software • Functional alarm system (limit false alarms) • Management of access to accelerator controls • Management of access to accelerator equipment • Unambiguous naming • HPI training
Well implemented conduct of operations
41
Operational Efficiency Simulation
…will allow to assess reliability using complex realistic
operation models
thereby
• helps to specify reliability of components
• helps to provide guidance and to decide on
operational strategies
• may validate simplified reliability assessment

Complementary Figure of Merit
Average Performance
Performance = Beam Current / Effective Beam Size
D: Relative Performance Reduction Due to Failure
D
N
n
n
n
DMTBF
TP
1 2
11
Maintenance Interval
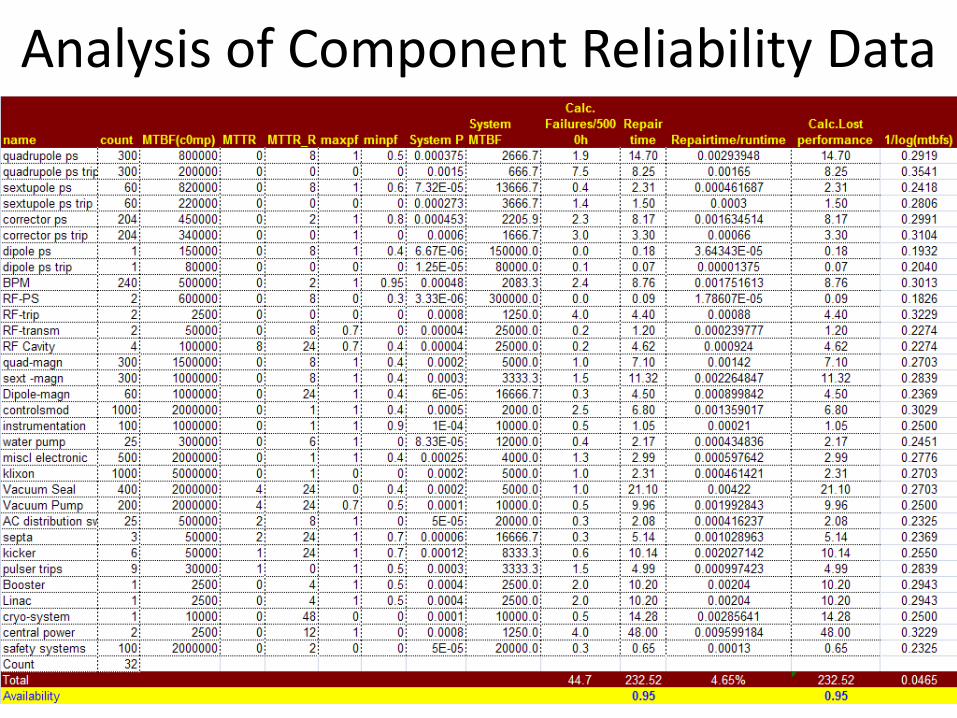
Analysis of Component Reliability Data
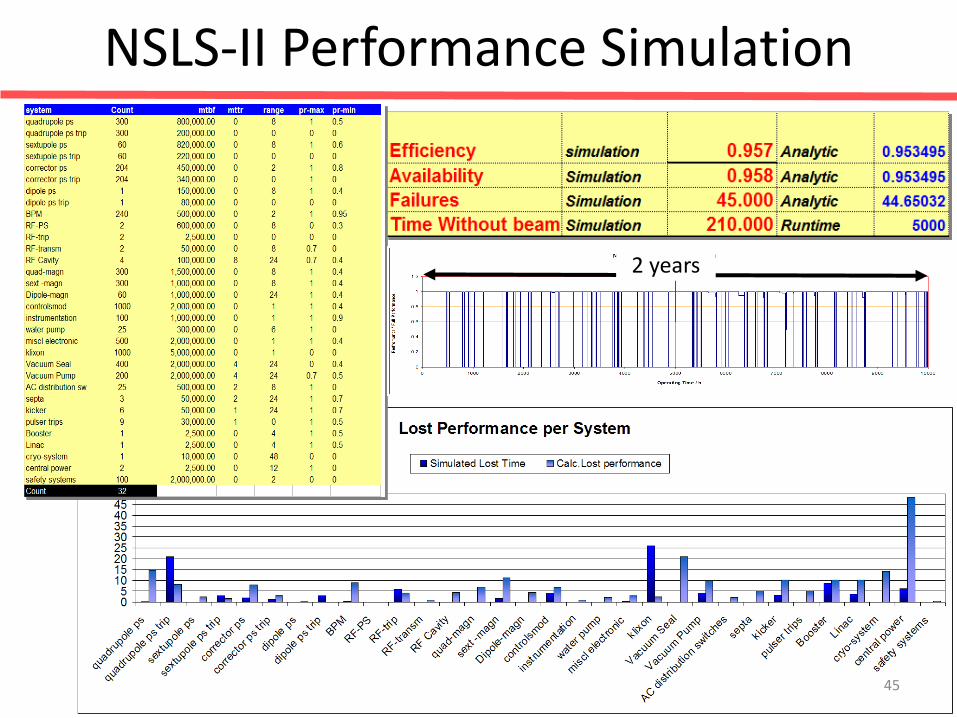
NSLS-II Performance Simulation
2 years
45

NSLS-II Performance Simulations
NSLS-II Performance Simulation
80.00%
82.00%
84.00%
86.00%
88.00%
90.00%
92.00%
94.00%
96.00%
98.00%
100.00%
50.00% 60.00% 70.00% 80.00% 90.00% 100.00%
Minimum Required Performance to keep Running
Perfo
rm
an
ce,
Avail
ab
ilit
y
Performance Availability Poly. (Performance) Poly. (Availability)
Question: Keep Running with Reduced Performance –OR- Break for Repair?
Answer (for NSLS-II assumptions): Don’t accept more than 10% reduction in performance, Don’t expect substantial increase in schedule safety by accepting running with reduced performance
46

Achieved Availabilities Synchrotron Light Sources, Example APS
http://www.aps.anl.gov/Accelerator_Systems_Division/Operations_Analysis/logging/MonitorDataReview.html 47

Conclusion • High operational reliability is for many
accelerator facilities of equal or even larger importance than high performance
• High Reliability needs t
• o be built into accelerator design. Same as high performance, high reliability comes with a cost tag which requires careful optimization
• Operational procedures and analysis is an extremely import factor in achieving reliable accelerator operation
48