Academic and Student Life February 8, 2018 · Retention Trends By HS GPA . 2015 2016 2017 HS GPA...
40
Academic and Student Life February 8, 2018 Katherine Frank, Provost and Vice President, Academic and Student Life Gail Mackin, Associate Provost, Undergraduate and Faculty Affairs Gayla Stoner, Associate Provost, Extended Learning and Outreach Bernadette Jungblut, Associate Provost, Accreditation, Academic Planning, and Assessment
Transcript of Academic and Student Life February 8, 2018 · Retention Trends By HS GPA . 2015 2016 2017 HS GPA...

Academic and Student Life February 8, 2018
Katherine Frank, Provost and Vice President, Academic and Student Life
Gail Mackin, Associate Provost, Undergraduate and Faculty Affairs Gayla Stoner, Associate Provost, Extended Learning and Outreach Bernadette Jungblut, Associate Provost, Accreditation, Academic
Planning, and Assessment

Extended Learning and Outreach: CWU-Sammamish & Transfer Student
Enrollment and Recruitment University-wide Collaborative Approach
Gayla Stoner, Associate Provost
Extended Learning and Outreach

CWU-Sammamish • Fall and Winter Offerings
– 27 General Education Courses • 130 Course Enrollments • 4 High Schools
– 4 English as a Second Language Courses • 17 Course Enrollments
– 7 Continuing Education Programs • 58 Enrollments
• Community Outreach – 2 Open Houses with Information Sessions
• 200 + Attendees – City of Sammamish, Skyline High School, & YMCA – February 10, Chinese New Year

Transfer Student Headcount
• Transfer Total – 4411 Fall 17
• University Centers – 873 Fall 17
• Online – 968 Fall 17

TheCIS Dashboard @ Census Fall 2017
Number of Online Undergrad Students Fall 2014 - 17
Top 5 Online Program Enrollments
Fall 2014
Fall 2015
Fall 2016
Fall 2017
BAS – ITAM 252 256 250 237
BS – ITAM 136 179 192 259
Law & Justice 110 129 127 93
Psychology 110 111 113 133 Sociology 45 43 49 53
Total of Top 5 653 728 701 775
Total of ALL (11) Online Programs
817 893 927 968

TheCIS Dashboard @ Census Fall 2017
Number of Majors Served at Centers Fall 2014 - 17
Fall 2014
Fall 2015
Fall 2016
Fall 2017
CWU-Des Moines 748 732 668 633
CWU-Lynnwood 515 496 464 519
CWU-Pierce County
226 276 318 352
CWU-Yakima 131 107 108 108
CWU-Wenatchee 89 75 49 55
CWU-Moses Lake 77 63 71 66
Total 1786 1749 1678 1733

Transfer Initiatives: University-wide Collaborative Approach • Extended Learning Strategic Plan • Transfer Student Workgroup • University Centers Workgroup • EM Recruitment Subcommittee • Public Affairs • Admissions Training • Advisory Councils

Discussion
LEARN. DO. LIVE.

Retention Update
Gail Mackin, Associate Provost
Undergraduate and Faculty Affairs

CWU 2017 Enrollment & Retention Report 01/15/2018
New Student Enrollment & Retention 2,500
2,000
1,500
1,000
2012 2013 2014 2015 2016 2017
Transfer
FTFTF
85% 80%
75% 70%
65%
2012 2013 2014 2015 2016
Transfer
FTFTF

CWU 2017 Enrollment & Retention Report 01/15/2018
FTFTF Cohort Trends • Fall 2013 to Fall 2016
• Increased by more than 400 students (27.0%)
• Retention rate decrease from 78.86% to 72.57%
• Identified areas of opportunity:
• Diverse (R/E) students
• Pell Eligible students
• First Generation students

2017 FTFTF Cohort Demographics
• 11.2% larger than 2016 Cohort
• 41.1% larger than 2013 Cohort
• 34.5% Diverse students (R/E)
• 38.4% Pell Eligible
• 48.8% First Generation
CWU 2017 Enrollment & Retention Report 01/15/2018

800
700
600
500
400
300
200
100
0
FTFTF Cohort by HS GPA
0-2 2-2.5 2.5-3 3-3.5 3.5-Inf No GPA Recorded
2015
2016
2017
| Murky Middle |
CWU 2017 Enrollment & Retention Report 01/15/2018

CWU 2017 Enrollment & Retention Report 01/15/2018
Retention Trends By HS GPA
2015 2016 2017 HS GPA
Enrolled
Retained
Enrolled
Retained
Enrolled
0-2 5 40.00% 2 0.00% 1
2-2.5 147 64.63% 101 51.49% 244
2.5-3 473 67.02% 622 63.67% 625
3-3.5 577 80.07% 669 75.19% 713
3.5-Inf 401 85.54% 472 86.02% 491

CWU 2017 Enrollment & Retention Report 01/15/2018
Retention Trends By HS GPA
2015 2016 2017 HS GPA
Enrolled
Retained
Enrolled
Retained
Enrolled
0-2 5 40.00% 2 0.00% 1
2-2.5 147 64.63% 101 51.49% 244
2.5-3 473 67.02% 622 63.67% 625
3-3.5 577 80.07% 669 75.19% 713
3.5-Inf 401 85.54% 472 86.02% 491

CWU 2017 Enrollment & Retention Report 01/15/2018
Retention Trends By HS GPA
2015 2016 2017 HS GPA
Enrolled
Retained
Enrolled
Retained
Enrolled
0-2 5 40.00% 2 0.00% 1
2-2.5 147 64.63% 101 51.49% 244
2.5-3 473 67.02% 622 63.67% 625
3-3.5 577 80.07% 669 75.19% 713
3.5-Inf 401 85.54% 472 86.02% 491

CWU 2017 Enrollment & Retention Report 01/15/2018
Retention Trends By HS GPA
2015 2016 2017 HS GPA
Enrolled
Retained
Enrolled
Retained
Enrolled
0-2 5 40.00% 2 0.00% 1
2-2.5 147 64.63% 101 51.49% 244 2.5-3 473 67.02% 622 63.67% 625
3-3.5 577 80.07% 669 75.19% 713
3.5-Inf 401 85.54% 472 86.02% 491

CWU 2017 Enrollment & Retention Report 01/15/2018
Retention Trends By HS GPA
2015 2016 2017 HS GPA
Enrolled
Retained
Enrolled
Retained
Enrolled
0-2 5 40.00% 2 0.00% 1
2-2.5 147 64.63% 101 51.49% 244 2.5-3 473 67.02% 622 63.67% 625 3-3.5 577 80.07% 669 75.19% 713
3.5-Inf 401 85.54% 472 86.02% 491

CWU 2017 Enrollment & Retention Report 01/15/2018
Retention Trends By HS GPA
2015 2016 2017 HS GPA
Enrolled
Retained
Enrolled
Retained
Enrolled
0-2 5 40.00% 2 0.00% 1
2-2.5 147 64.63% 101 51.49% 244 2.5-3 473 67.02% 622 63.67% 625 3-3.5 577 80.07% 669 75.19% 713
3.5-Inf 401 85.54% 472 86.02% 491
Applying 2016 Retention Rates to the 2017 Cohort yields a 71.3 % retention rate
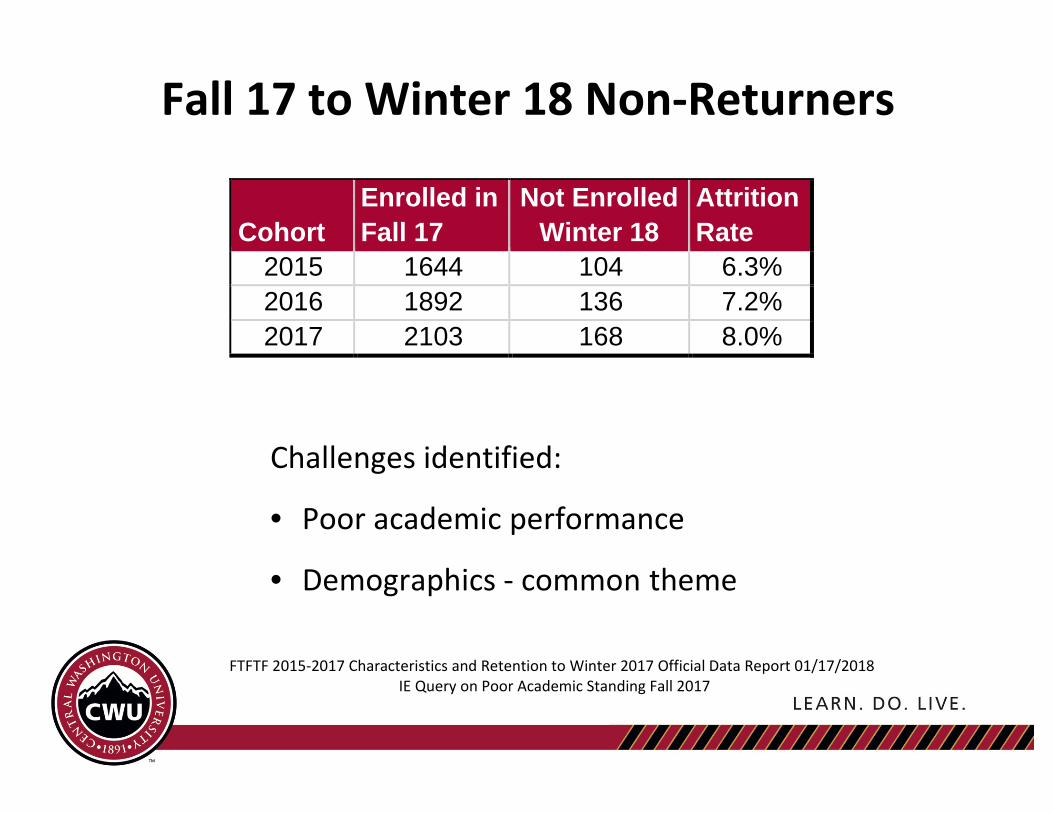
Fall 17 to Winter 18 Non-Returners
Cohort
Enrolled in Fall 17
Not Enrolled Winter 18
Attrition Rate
2015 1644 104 6.3% 2016 1892 136 7.2% 2017 2103 168 8.0%
Challenges identified:
• Poor academic performance
• Demographics - common theme
FTFTF 2015-2017 Characteristics and Retention to Winter 2017 Official Data Report 01/17/2018 IE Query on Poor Academic Standing Fall 2017

Current Initiatives
• Undergraduate Academic Advising Collaborative
• Summer Bridge Program for Developmental Math
• Remove Barriers to Student Success
• Retention Committee
• Samuelson: New Opportunities for Professional Development
and Student Learning

Moving Forward
• Require placement testing at orientation prior to registering
• Require developmental courses in first year
• Strongly encourage foundational courses in first year
• Expansion of the PALs program (supplemental instruction)
• Advising Syllabus
• Mandatory midterm grades
• Comprehensive longitudinal study on persistence to
graduation

Discussion
Reaffirmation of Accreditation, Strategic Planning, and General ASL Update
Bernadette Jungblut, Associate Provost
Accreditation, Academic Planning, and Assessment
Katherine P. Frank, Provost and Vice President Academic and Student Life

NWCCU Reaffirmation of Accreditation (RoA) • 22-24 October 2018 Site Visit • Demonstrate mission fulfillment:
o Teaching & Learning o Inclusiveness & Diversity o Scholarship & Creative Expression o Public Service & Community Engagement o Resource Development & Stewardship
• Self-Study development: o Build and brief teams o Compile evidence o Develop data dashboard o Construct narrative o Roll out communication plan – web presence o Produce and disseminate final version

NWCCU RoA Data Dashboard Goals • Provide static display for NWCCU external evaluators
• Design framework and build foundation for dynamic
data warehouse and new dashboards
• Enhance departmental and Student Success program reviews
• Support:
o Future institutional- & unit-level strategic planning o Retention and Baccalaureate Task Forces o Annual assessment planning and reporting o General Education assessment

NWCCU RoA Data Dashboard Access
Accessing this dashboard:
• Log on to MyCWU
• Click on “Analytics” tab
• Click on “CWU NWCCU Accreditation”

NWCCU RoA Data Dashboard Demonstration
Cohort-Based Enrollment & Retention by: • Admit Type
o First-Time, Full-Time Freshmen o First-Time, Full-Time Transfers o FTFT Transfers with and without DTAs
• Demographics
• Additional Characteristics
• Student Aid and Socioeconomic Status

NWCCU RoA Data Dashboard – Ongoing Enrollment Totals & Trends 2009-2018:
• Institution, College, Degree, Program, Major • Fall, Winter, Spring, Academic Year • Key groups (See Handout #X)
Retention, Persistence, Degree Completion 2009-2018:
• Institution, College, Degree, Program, Major • Fall-to: Fall, Winter, Spring • Key groups • Pipeline reports • Major migration analyses • Time-to-degree completion • Credit hours to degree completion

Discussion

NWCCU RoA Web Presence Mission Fulfillment
• Strategic Planning o Institutional o Unit-level o Historical development
• Accreditation
o About o Fall 2018 Evaluation Site Visit o The Self-Study Process o My Role in Accreditation o Specialized Accreditation o Evidence Room

Supporting Retention & Degree Completion
Baccalaureate Task Force • Academic Advising • Developmental Programs • Diversity and Inclusivity • Honors • Interdisciplinary Programs • Transfer Students • University Centers
General Education Redesign • Implementation Task Force • Faculty Senate Vote

CENTRAL WASHINGTON UNIVERSITY Board of Trustees February 8, 2018
EXECUTIVE SUMMARY – Extended Learning and Outreach
Extended Learning and Outreach is comprised of University Centers, Instructional Sites, Online Learning, Continuing Education, Running Start, Multimodal Learning, Distance Education, Multimodal Learning Center, and Dual Admission.
CWU University Centers and Instructional Sites include:
• CWU-Des Moines • CWU-Lynnwood • CWU-Moses Lake • CWU-Pierce • CWU-Wenatchee • CWU-Yakima • CWU-Sammamish • CWU-Joint Base Lewis-McChord
CWU’s newest instructional site is located in Sammamish and opened on September 20, 2017. CWU- Sammamish is an instructional site that provides general education undergraduate classes available to the public, including high school students. Continuing Education programs are also offered at the instructional site. These programs provide lifelong learning opportunities, education, and professional development programs.
CWU has a need to position itself to attract and serve transfer students in a high-quality manner. Currently, we have approximately 4400 transfer students in Ellensburg, University Centers, and online. We serve approximately 1700 majors through the University Centers. Additionally, we have nearly 1000 students enrolled in online undergraduate programs.
Over the fall 2017 quarter, we designed and pursued a University-wide collaborative approach engaging stakeholders across the campus and University Centers. Actively engaged stakeholders include, but are not limited to, University Center faculty and staff, Ellensburg faculty and staff, representatives of Student Services, Enrollment Management, Public Affairs, Alumni, and International Studies.
On February 8, we will review the strategic activities underway within Extended Learning and Outreach to reach and serve transfer students. Most specifically, we will discuss our collaborative approach for recruiting and serving the transfer student population, as well as the growth strategies and tactics underway across CWU.

Submitted,
Katherine P. Frank Provost/Vice President for Academic and Student Life
Approved for submittal:
James L. Gaudino President

CENTRAL WASHINGTON UNIVERSITY Board of Trustees February 8, 2018
EXECUTIVE SUMMARY – Mission Fulfillment Web Presence
The Mission Fulfillment web presence supports CWU’s Northwest Commission on Colleges and Universities (NWCCU) reaffirmation of accreditation and also communicates key information about strategic planning, the Baccalaureate Task Force, General Education redesign, and assessment and continuous improvement:
• Mission Fulfillment: http://www.cwu.edu/mission/ • Strategic Planning: http://www.cwu.edu/mission/strategic-planning • Baccalaureate Task Force: http://www.cwu.edu/mission/baccalaureate • Assessment and Improvement: http://www.cwu.edu/mission/assessment-improvement • Accreditation: http://www.cwu.edu/mission/accreditation/about
The Strategic Planning site presents CWU’s mission, vision, core values, core themes, objectives, outcomes, and indicators. Divisional strategic plans and initiatives will also be available – as will a history of strategic planning at CWU.
The Baccalaureate Task Force site has been used to post work group charges and first progress reports; collect feedback from faculty and staff; and to communicate next steps and updates.
The Assessment and Improvement site will house a collection of approximately 2500 documents demonstrating CWU’s commitment to asking – and answering – key questions about how well we are serving students, faculty, staff, alumni, and surrounding communities. The site also will also provide a series of peer comparisons and information about how we continuously strive to enhance our courses, programs, and services. The site construction is as follows:
• Mission Fulfillment (AY2009-10 to AY2017-18) • CWU Compared to Peers (ratings and rankings) • Academic Program Planning • Seven-Year Departmental Program Review • Assessment Plans – by college, department, and degree program • Assessment Reports and Feedback – by college, department, and degree program • General Education • Survey Findings (alumni surveys, National Survey of Student Engagement, Faculty
Survey of Student Engagement, Priorities Survey for Online Learners) • Course Evaluations (summaries) • Historical Reports
The Accreditation site provides general information about NWCCU reaffirmation of accreditation including the importance, purpose, and goals; the Fall 2018 evaluation site visit, and the self-study process.
The My Role in Accreditation site will become a particularly important space as it will include questions evaluators will likely ask of the following groups: students, staff, faculty, the Board of Trustees, the

Cabinet, other direct reports in the President’s Division, and direct reports in Academic and Student Life, Business and Financial Affairs, Diversity and Inclusivity, Strategic Enrollment Management, Operations, Public Affairs, and University Advancement. This page will become the primary vehicle for briefings of the university community in preparation for the site visit.
The Specialized Accreditation page will present all self-study reports, external evaluations, and follow-up reports for the following:
• Applied and Natural Science Accreditation Commission of ABET • Association to Advance Collegiate Schools of Business International (AACSB) • American Council for Construction Education (ACCE) • Accreditation Council for Education in Nutrition and Dietetics (ACEND) • American Chemical Society (Committee on Professional Training) • Commission on Accreditation of Allied Health Education Programs (CAAHEP) • Council for Accreditation of Counseling and Related Educational Programs (CACREP) • Engineering Technology Accreditation Commission of ABET • National Association of Schools of Music (NASM)
The Evidence Room will be a password-protected page available to the NWCCU site evaluation team members, NWCCU staff, and NWCCU Commissioners.
Submitted,
Katherine P. Frank Provost/Vice President for Academic and Student Life
Approved for submittal:
James L. Gaudino President

HANDOUT 2 NWCCU Reaffirmation of Accreditation Data Dashboard
The primary goals of the NWCCU Accreditation Dashboard are as follows:
• Provide a static display for the NWCCU site visit evaluation team • Design the framework and build the foundation for the creation of a data warehouse
and dynamic dashboards for a variety of institutional, divisional, college, departmental, unit, and individual needs
• Immediately enhance departmental and Student Success program reviews
In addition, this dashboard supports the following: • The Baccalaureate Task Force (BTF) and ongoing retention efforts including the following BTF
work groups: o Academic Advising o Developmental Programs o Diversity and Inclusivity o Honors o Interdisciplinary Programs o Transfer Students o University Centers
• General Education Assessment • Annual assessment planning and reporting – at the course, program, and department levels • Future institutional-level and unit-level strategic planning by establishing baseline information
that informs the setting of targets and thresholds that define mission fulfillment
To access the dashboard: • Log on to MyCWU • Click on the “Analytics” tab • Click on “CWU NWCCU Accreditation”
The following is a summary of completed NWCCU Reaffirmation of Accreditation Data Dashboard tasks. Please note each task entails the completion of the following:
• Data validation • Dataset construction • Data analyses • Data display construction • Dashboard components creation
Enrollment: • 2009-2017 Fall Census Enrollment by Admit Type (First-Time, Full-Time Freshmen; All Transfers;
Transfers with DTA and without DTA) • 2009-2017 Fall Census Enrollment by Admit Type and Gender; Race/Ethnicity; Gender and
Race/Ethnicity: Residence Status (WA state and non-WA); Last External GPA; ACT Score; SAT Score; FAFSA Filing Status; Pell Eligibility; and First Generation in College/First in the Family in College Status
February 8, 2018

Retention: • 2009-2017 Fall Census by Admit Type (First-Time, Full-Time Freshmen; All Transfers; Transfers with
DTA and without DTA); First-Year, Fall-to-Fall • 2009-2017 Fall Census by Admit Type and Gender; Race/Ethnicity; Gender and Race/Ethnicity:
Residence Status (WA state and non-WA); Last External GPA; ACT Score; SAT Score; FAFSA Filing Status; Pell Eligibility; and First Generation in College/First in the Family in College Status; First-Year, Fall-to-Fall
Persistence and Degree Completion: • Consortium for Student Retention Data Exchange (CSRDE) reports for:
o First-time, full-time freshmen o First-time transfer students (all) o First-time transfer students with Direct Transfer Agreements (DTA) o First-time transfer students without DTA
The following summarizes the prioritization of ongoing dashboard development. Please note the data validation and dataset construction steps have been completed for all items below. Data analyses have been largely completed. Data display construction and dashboard components creation have commenced for the completed data analyses and will continue to roll out as the remaining data analyses are finalized.
Enrollment • 2009-2017 Winter Census Enrollment by Admit Type (First-Time, Full-Time Freshmen; All Transfers;
Transfers with DTA and without DTA) • 2009-2017 Spring Census Enrollment by Admit Type (First-Time, Full-Time Freshmen; All Transfers;
Transfers with DTA and without DTA) • Historical and current total enrollment profiles by college, degree designation, degree/major, and
additional factors listed below • Enrollment predictions (for Standard Five – institutional adaptation and sustainability)
Retention: • Fall-to-Fall by additional factors listed below • Fall-to-Winter and Fall-to-Spring by Admit Type; by Admit Type Gender; Race/Ethnicity; Gender and
Race/Ethnicity: Residence Status (WA state and non-WA); Last External GPA; ACT Score; SAT Score; FAFSA Filing Status; Pell Eligibility; First Generation in College/First in the Family in College Status; and additional factors listed below
Persistence and Degree Completion: • Consortium for Student Retention Data Exchange (CSRDE) reports for:
o First-time, full-time freshmen (STEM majors – NSF CIP codes) o First-time, full-time freshmen (non-STEM majors) o First-time, full-time transfer students (STEM majors – NSF CIP codes) o First-time, full-time transfer students (non-STEM majors)
• Pipeline reports and major migration analyses for successful students (completed bachelor’s degree at CWU) and unsuccessful students (did not complete bachelor’s degree at CWU):
o First-time, full-time freshmen (within first AY at CWU; by term – Fall, Winter, Spring)
o First-time, full-time freshmen (who did not declare until second year at CWU – also by term – Fall, Winter, Spring)
o First-time transfer students (all) o First-time transfer students (with DTA) o First-time transfer students (without DTA)
• Time to degree completion (by admit type cohorts; institutional level, college, department, and major)
• Credit hours to degree completion (by admit type cohorts; institutional level, college, department, and major)
Additional Factors: • By residence based on address at time of application to CWU (international students; if in-state, by
county; if out-of-state, by state) • By residency as defined for tuition purposes (e.g., Western Undergraduate Exchange – WUE) • By additional socioeconomic status variables (Expected Family Contribution, Unmet Need) • By college, department, degree program, major • By housing status (on-campus, off-campus; if on-campus which residential community,
Living/Learning Communities) • By first, second, and third term academic performance (GPA; credit hours earned as a percentage of
credit hours attempted) and the “murky middle” by each term and then by first academic year at CWU; institutional, college, and department
• By probation status (placed on warning, placed on probation, continuing on probation, removed from probation, suspended/readmitted); institutional, college, department
• By specific program/intervention participation and eligible/non-participating comparison groups: o GEAR-UP participants who enroll at CWU o Upward Bound participants who enroll at CWU o TRiO Student Support Services (SSS) participants o CAMP participants o William O. Douglas Honors College students o STAR participants o STEP participants o SOLVER Scholars o Veterans; veteran dependents o Athletes o Placement test scores o Developmental math course participation (by level of developmental math – first, second,
and/or third course) o Developmental English Language Arts course participation o Timing of development courses (i.e., taken during first year at CWU versus delayed to a
subsequent year; if taken during first year at CWU, which term?) o Participation in other programming/interventions
• Psycho-social factors • By scholarship/waiver status (recipients versus non-recipients; types of scholarships/waivers)
These data – and related graphs and tables – enable us to evaluate the following CWU Strategic Plan Core Themes in the context of the NWCCU reaffirmation of accreditation self-study:

Core Theme One: Teaching and Learning
Objective 1.1: Enhance student success by continually improving curricular, co-curricular, and extracurricular programs.
Outcome 1.1.2: Students will persist to graduation with increased efficiency and rate.
Indicator 1.1.2.1: Retention, persistence, and graduation rates for first-time freshmen and transfer student cohorts (2009-2017) by demographic, socioeconomic status, and prior academic achievement factors.
Indicator 1.1.2.2: Time and credit hours to degree completion for first-time freshmen and transfer student cohorts (2009-2017) by demographic, socioeconomic status, and prior academic achievement factors.
Objective 1.2: Enhance the effectiveness of student support services.
Outcome 1.2.1: Increase student use and effectiveness of support services.
Indicator 1.2.1.1: Analyses of use and effectiveness of academic programming, e.g., advising, developmental, honors, and online/multi-modal learning.
Indicator 1.2.1.2: Analyses of use and effectiveness of student life programming, e.g., career services, housing, learning support, recreation center, student union, student medical and counseling clinic, student government and organizations, TRiO and related programs, and the Veterans’ Center.
Core Theme Two: Inclusiveness and Diversity
Objective 2.1: Create and sustain a diverse and inclusive community.
Outcome 2.1.1: Increase the percentage of faculty, staff, and students from groups traditionally underrepresented in higher education who are recruited, hired or enrolled, and retained at CWU.
Indicator 2.1.1.1: Recruitment, employment, enrollment, and retention analyses and historical comparisons (2009-2018).
Core Theme Five: Resource Development and Stewardship
Objective 5.2: Develop and implement enrollment management strategies that maximize revenue.
Outcome 5.2.1: Create, implement, and evaluate the strategic enrollment management plan. Outcome 5.2.2: Create communication and marketing plans that generate increased student enrollment in targeted academic programs. Outcome 5.2.3: Develop a plan and launch initiatives to increase student persistence.