GPA – Graphical Progress...
23
GPA – Graphical Progress Analyzer 19 Sample Project System requirements: 1 GB RAM, 100 MB free disk space OS : Windows XP,NT & Vista Primavera Project Planner or Primavera 5,6,6.2 with SQL server / Oracle database AutoCAD 2004 – 2010 Recommended: If you are new to GPA, follow the sample project step by step as described below. With a pen/pencil put a tick on the check boxes upon completion of each step. 1. Register and login GPA 2. Go through a locked project 3. Implement a sample project 4. Add Project Monitor Users 5. Do your own project Download, Install, Register and Login If you already installed GPA skip steps 1.1 and 1.2 □ Step 1.1 Download GPA installation setup from www.projectmonitoringsystems.com □ Step 1.2 Install GPA setup □ Step 1.3 Run GPA from the desktop icon or from the windows program menu Upon successful connection to the GPA Server through the internet, the following login screen will be displayed. If you already registered skip steps 1.4 to 1.7 □ Step 1.4 Click on New User □ Step 1.5 Type the correct information □ Step 1.6 Click on Register button □ Step 1.7 Open your email to get the password □ Step 1.8 Use your email ID as username with the correct password click on Login Use Forget password? Link to retrieve password.
Transcript of GPA – Graphical Progress...

GPA – Graphical Progress Analyzer
19
Sample Project System requirements: 1 GB RAM, 100 MB free disk space OS : Windows XP,NT & Vista Primavera Project Planner or Primavera 5,6,6.2 with SQL server / Oracle database AutoCAD 2004 – 2010 Recommended: If you are new to GPA, follow the sample project step by step as described below. With a pen/pencil put a tick on the check boxes upon completion of each step.
1. Register and login GPA 2. Go through a locked project 3. Implement a sample project 4. Add Project Monitor Users 5. Do your own project
Download, Install, Register and Login If you already installed GPA skip steps 1.1 and 1.2
□ Step 1.1 Download GPA installation setup from www.projectmonitoringsystems.com
□ Step 1.2 Install GPA setup
□ Step 1.3 Run GPA from the desktop icon or from the windows program menu Upon successful connection to the GPA Server through the internet, the following login screen will be displayed.
If you already registered skip steps 1.4 to 1.7
□ Step 1.4 Click on New User
□ Step 1.5 Type the correct information
□ Step 1.6 Click on Register button
□ Step 1.7 Open your email to get the password
□ Step 1.8 Use your email ID as username with the correct password click on Login Use Forget password? Link to retrieve password.

GPA – Graphical Progress Analyzer
20
If you are new to GPA, always recommend going through the following session, otherwise directly go to 3. Go through a locked project Locked projects are sample projects intended for output only. Anyone can go through the output of this project using GPA Viewer and its input are locked by the administrator. Upon successful login the following dialog box will be displayed.
□ Step 2.1 Select one on the locked sample project. (Example: GPA Sample Bridge Project)
□ Step 2.2 Click on Load GPA Viewer… button Wait a while to load the project in GPA Viewer as shown below.
Familiarise the GPA screen
□ Step 2.3 Disable flash progressing activities by removing check mark
□ Step 2.4 Change visibility controls of progressing, completed, pending and delayed activities by checking and un-checking respective boxes as shown below and see the changes on the graphics screen.

GPA – Graphical Progress Analyzer
21
□ Step 2.5 Enable listing of activities from settings menu or from the toolbar Show Activities
□ Step 2.5 Change visibility controls of progressing, completed, pending and delayed activities again by checking and un-checking respective boxes as shown below and see the simultaneous changes on the graphics screen and activity area.
□ Step 2.6 Click on an activity, on the activity description to highlight (flash) on the screen

GPA – Graphical Progress Analyzer
22
□ Step 2.7 Right click on the graphics area to activate context menu and select Find Activity
□ Step 2.8 click on any object (E.g.: on the highlighted object below)
See the selected objects are highlighted with properties on the window.
□ Step 2.9 Change a colour scheme from the settings menu

GPA – Graphical Progress Analyzer
23
Dark background scheme Light background scheme
These two are the standard set of colours for different configured items. But, you can change individual colours as below.
□ Step 2.10 Click on change colour from settings menu and select one desired item
□ Step 2.11 Select desired colour and click on OK button to set the selected colour to the selected item
Note: Colour changes can also be done from the colour thumbnail from the controls.
□ Step 2.12 Change pen width from settings menu for small, medium and large as 1, 2 and 3 pixels respectively
GPA – Graphical Progress Analyzer
24
Width= 1 pixel Width=2 pixels Wdith =3 pixels
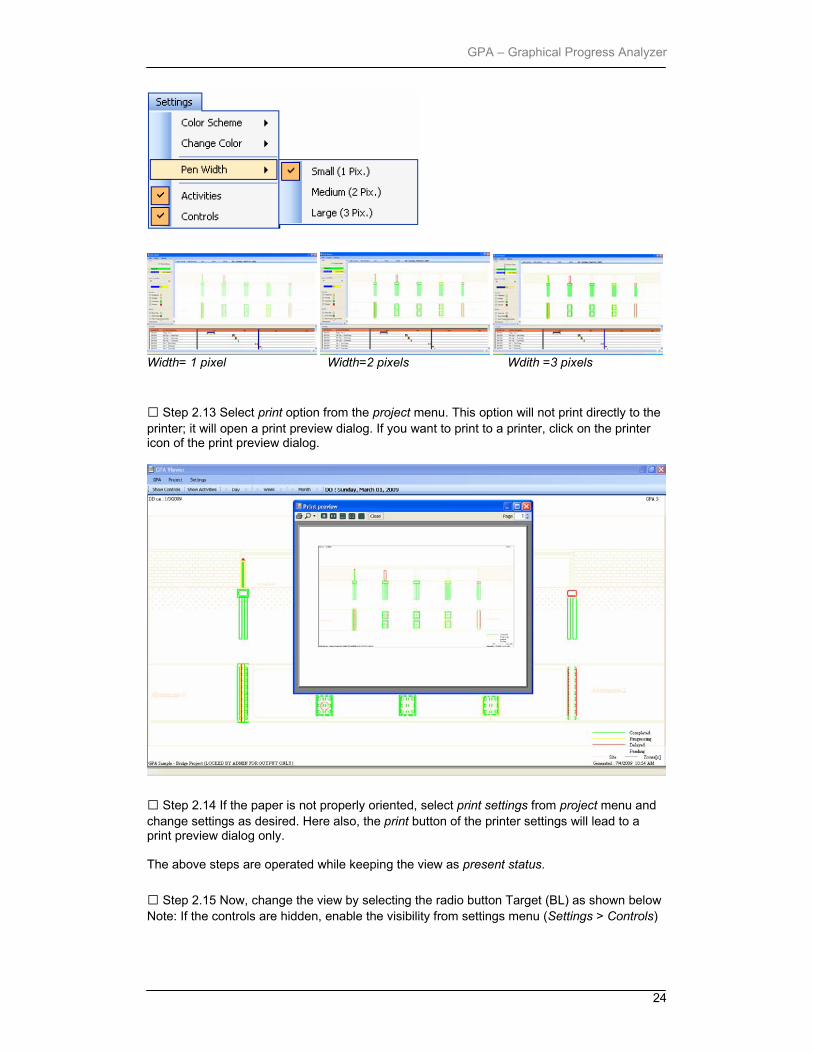
□ Step 2.13 Select print option from the project menu. This option will not print directly to the printer; it will open a print preview dialog. If you want to print to a printer, click on the printer icon of the print preview dialog.
□ Step 2.14 If the paper is not properly oriented, select print settings from project menu and change settings as desired. Here also, the print button of the printer settings will lead to a print preview dialog only. The above steps are operated while keeping the view as present status.
□ Step 2.15 Now, change the view by selecting the radio button Target (BL) as shown below Note: If the controls are hidden, enable the visibility from settings menu (Settings > Controls)

GPA – Graphical Progress Analyzer
25
□ Step 2.16 Select any desired planned date by scrolling the slider and drop to generate the baseline planned progress drawing.
□ Step 2.17 Click on > from the toolbar, to go to next day or week or month (< for previous)
□ Step 2.18 Do the above steps for Work done by selecting the radio button. This option will show you the actual work progress as on any past date, thus the scroll bar will not move beyond the Data Date
GPA – Graphical Progress Analyzer
26
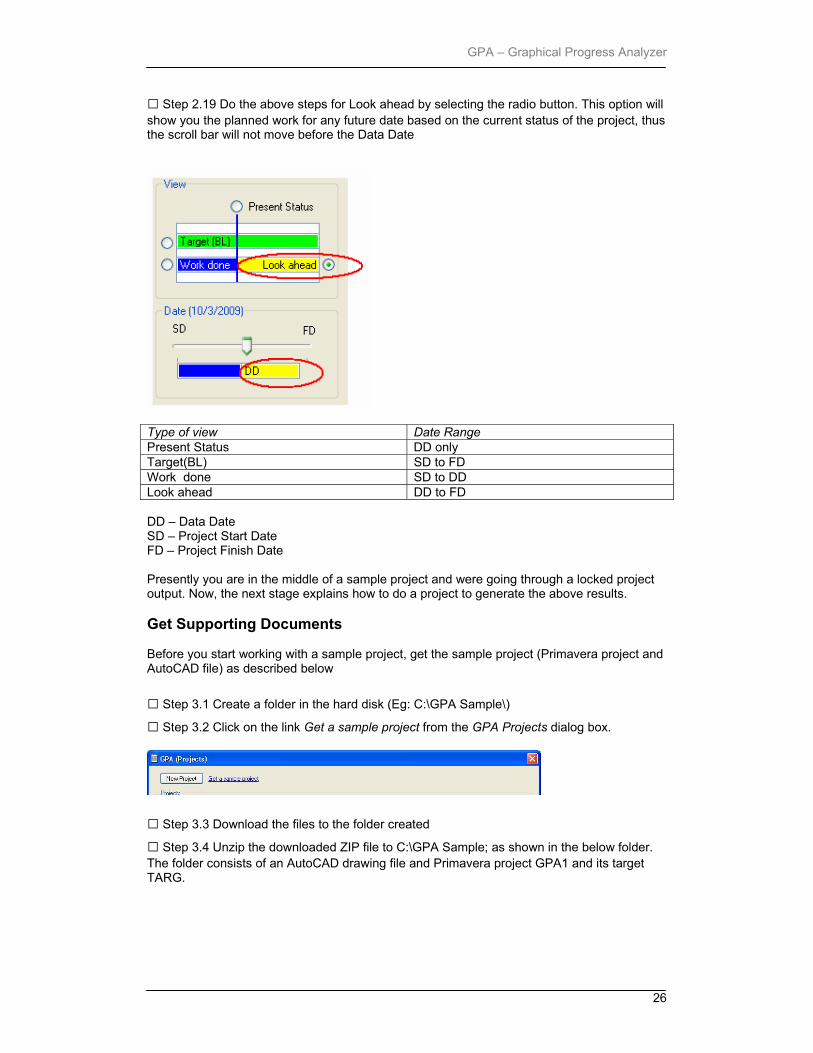
□ Step 2.19 Do the above steps for Look ahead by selecting the radio button. This option will show you the planned work for any future date based on the current status of the project, thus the scroll bar will not move before the Data Date
Type of view Date Range Present Status DD only Target(BL) SD to FD Work done SD to DD Look ahead DD to FD DD – Data Date SD – Project Start Date FD – Project Finish Date Presently you are in the middle of a sample project and were going through a locked project output. Now, the next stage explains how to do a project to generate the above results. Get Supporting Documents Before you start working with a sample project, get the sample project (Primavera project and AutoCAD file) as described below
□ Step 3.1 Create a folder in the hard disk (Eg: C:\GPA Sample\) □ Step 3.2 Click on the link Get a sample project from the GPA Projects dialog box.
□ Step 3.3 Download the files to the folder created
□ Step 3.4 Unzip the downloaded ZIP file to C:\GPA Sample; as shown in the below folder. The folder consists of an AutoCAD drawing file and Primavera project GPA1 and its target TARG.

GPA – Graphical Progress Analyzer
27
Create a project
□ Step 3.5 Click on new project button in GPA Project Viewer..
□ Step 3.6 Type a project name (E.g.: My Sample Project)
□ Step 3.7 Click on Create button
□ Step 3.8 Click on the project you created (My Sample Project) of the Project list. Load GPA Viewer button is disabled because; the project is not ready to monitor.

GPA – Graphical Progress Analyzer
28
Upload AutoCAD drawing
□ Step 3.9 Click on AutoCAD Drawing button
□ Step 3.10 Select the DWG file in the folder C:\GPA Sample
□ Step 3.11 Click on Open button and wait till you receive a confirmation message from the GPA server.

GPA – Graphical Progress Analyzer
29
See the change of colour of the button AutoCAD Drawing from red to black means the AutoCAD file is successfully uploaded to GPA Server. Attach Primavera project
□ Step 3.12 Click on the Primavera Project button to open the following dialog
□ Step 3.13 Select P3 option
□ Step 3.14 Click on Connect button and wait for a few seconds. To succeed this operation, your PC has to have Primavera Project Planner If Browse button enabled after a few seconds, skip step 3.15.
□ Step 3.15 If GPA is unable to connect by default settings, Username and Password boxes will be enabled. Type the correct username and password of the Primavera Project Planner and click on Connect again.

GPA – Graphical Progress Analyzer
30
□ Step 3.16 Click on Browse button
□ Step 3.17 Select the project GPA1 or any file starting with GPA1
□ Step 3.18 Click on Open button, you can see the project details as shown below
□ Step 3.19 Click on Load button and wait till to get a confirmation message form the GPA server
Process for graphical simulation
□ Step 3.20 If necessary, restart the GPA again. Now you can see that, the process button is enabled. Which means the AutoCAD drawing and Primavera project are ready to simulate.

GPA – Graphical Progress Analyzer
31
□ Step 3.21. Click on Process button, to open the following dialog.
□ Step 3.22 Click on Start button and wait till to complete processing. It might take several seconds to a few minutes depending on the size of the AutoCAD geometry
If you receive the following message, your project is completely ready to monitor.

GPA – Graphical Progress Analyzer
32
Visualize baseline planning stages
□ Step 3.23 Select your project and click on Load GPA Viewer button and wait to open the following screen.
□ Step 3.24 Repeat the steps 2.3 to 2.18 with the opened project. You will realize, all the activities in the present status (DD) view are pending. The reason is, the primavera project you uploaded is not updated for actual progress. That is, the Data Date is still the start date of the project as shown below
Same thing you can see in the GPA’s date scroll bar in full yellow colour to indicate that the entire stretch is look ahead.

GPA – Graphical Progress Analyzer
33
Now, let us try with updating some of the activities. Visualize based on new updates
□ Step 3.25 Run Primavera
□ Step 3.26 Open your project (GPA1) in primavera
□ Step 3.27 Update few activities Example: -
1. Project Start = 100% 2. Piling – Abutment -1 = 100% 3. Piling – Pier-1 = 50 %
□ Step 3.28 Schedule with new data date = 20 January 2009
As per the above:
1. Piling – Abutment -1 is completed 2. Piling – Pier -1 is progressing 3. Piling – Pier-2 is delayed
□ Step 3.29 Close Primavera
□ Step 3.30 Run GPA
□ Step 3.31 Select your project
□ Step 3.32 Click on Primavera Project

GPA – Graphical Progress Analyzer
34
□ Step 3.33 Click on Connect, Browse and Upload
□ Step 3.34 Now, load GPA viewer and check the present status
Without pending activities With pending activities Look at the output and cross check the primavera activity update status are reflected in the graphics.
□ Step 3.35 Repeat the above steps (3.25 to 3.34) by updating further activities with new data dates. Add Project Monitor Users This session explains how to add permission to monitor your project for other project members.
□ Step 4.1 Open your project in GPA
□ Step 4.2 Click on Project Monitor Users from Project menu
Note: This can also accessed before opening project using Project Monitor Users from the Projects dialog.

GPA – Graphical Progress Analyzer
35
□ Step 4.3 Type the correct email id of the person whom you want to permit to monitor this project.
□ Step 4.4 Click on Add button. Note: This member has to register in PMS before doing this operation. The Project Monitor user will get an automated email notification regarding the new project added for monitoring and by whom. If you want you can easily remove the user from the Project Monitor list by a single click on the button to remove after selection of the respective user. The monitoring users will get the project in the Monitor Projects tab of the Projects dialog as shown below.
If he selects the project title, the input section (AutoCAD, Primavera and Process) will be inactive and he can view the project using Load GPA Viewer with full facility in GPA Viewer as the administrator of the project.

GPA – Graphical Progress Analyzer
36
Do your own project If you complete the above steps, you are capable of doing your own project. Here the important thing to understand before doing your own project is how the primavera activities and graphical elements are communicated? It is very simple, open the drawing in AutoCAD which is to be attached to GPA. The drawing can be anything like layout, section, or both. The drawing elements associated to an activity have to be moved to a separate layer with activity ID as the layer name. Open your sample file download, in AutoCAD; you can see how it is arranged in different layers by opening Layer property dialog.
If you are not very familiar with AutoCAD, get assistance from your draughtsman.

GPA – Graphical Progress Analyzer
37
Appendix A Primavera P3 configuration If you are using Primavera Project Planner (P3), GPA will try to connect P3 with default settings. In case of faulty connection, you will be prompted to enter Username and Password of a P3 user as shown below.
You can create users in Primavera Network Administrator (Netset from the windows Primavera programs with default password netset)
Use this username and password in GPA to connect P3 projects Note: Users can also be created without passwords.
GPA – Graphical Progress Analyzer
38
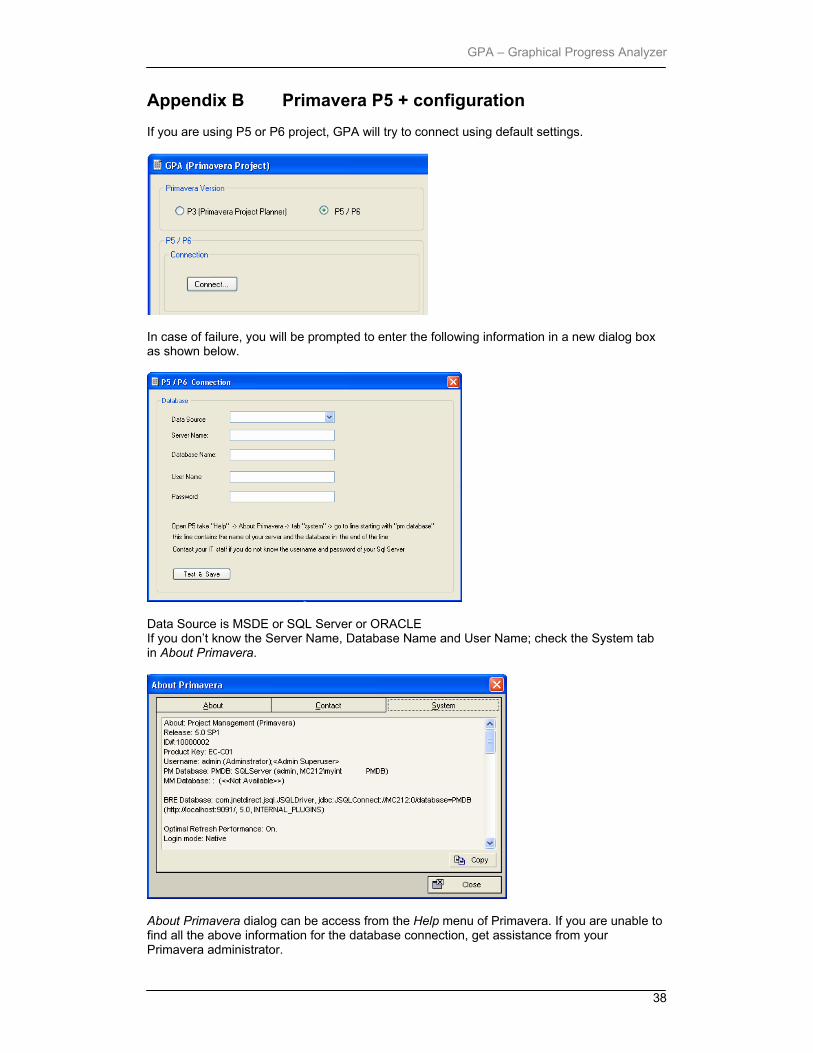
Appendix B Primavera P5 + configuration If you are using P5 or P6 project, GPA will try to connect using default settings.
In case of failure, you will be prompted to enter the following information in a new dialog box as shown below.
Data Source is MSDE or SQL Server or ORACLE If you don’t know the Server Name, Database Name and User Name; check the System tab in About Primavera.
About Primavera dialog can be access from the Help menu of Primavera. If you are unable to find all the above information for the database connection, get assistance from your Primavera administrator.

GPA – Graphical Progress Analyzer
39
Appendix C AutoCAD LIMITS to view The default view of the GPA output is Zoom Max as shown below, which is the drawing limit of the AutoCAD drawing file.
AutoCAD drawing limit is defined by LIMITS command in AutoCAD by clicking or typing lower left corner and upper right corner as shown below.
You can go to any zoom level in GPA same as AutoCAD. Thus define the proper LIMITS in AutoCAD before you upload the DWG file in GPA.
GPA – Graphical Progress Analyzer
40
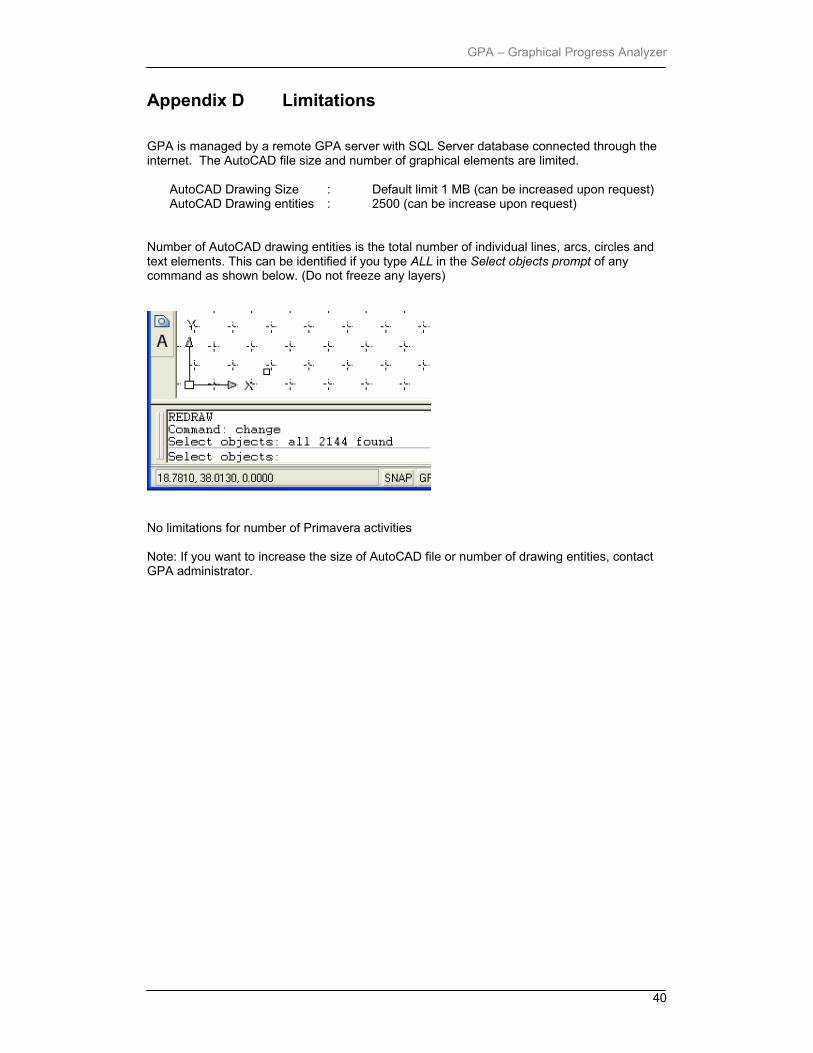
Appendix D Limitations GPA is managed by a remote GPA server with SQL Server database connected through the internet. The AutoCAD file size and number of graphical elements are limited.
AutoCAD Drawing Size : Default limit 1 MB (can be increased upon request) AutoCAD Drawing entities : 2500 (can be increase upon request)
Number of AutoCAD drawing entities is the total number of individual lines, arcs, circles and text elements. This can be identified if you type ALL in the Select objects prompt of any command as shown below. (Do not freeze any layers)
No limitations for number of Primavera activities Note: If you want to increase the size of AutoCAD file or number of drawing entities, contact GPA administrator.

GPA – Graphical Progress Analyzer
41
www.projectmonitoringsystems.com April 2009


![Barahipath, jif{ @@ c° ^$ @)&$ c;f/ g] 19 k[ ^±^≠!@ dNo ...apeksha thapa gpa: 3.70 kajal rai gpa: 3.70 rohan dahal gpa: 3.70 deewakar dahal gpa: 3.70 ishwor poudel gpa: 3.65 sonam](https://static.fdocuments.us/doc/165x107/5e9ce50a88852d7f7d5df312/barahipath-jif-c-cf-g-19-k-a-dno-apeksha-thapa.jpg)