Absorption Calculator: A Cross-Platform Application for ...
26
e University of Akron IdeaExchange@UAkron Williams Honors College, Honors Research Projects e Dr. Gary B. and Pamela S. Williams Honors College Spring 2019 Absorption Calculator: A Cross-Platform Application for Portable Data Analysis AnnMarie Kolbl [email protected] Please take a moment to share how this work helps you through this survey. Your feedback will be important as we plan further development of our repository. Follow this and additional works at: hps://ideaexchange.uakron.edu/honors_research_projects Part of the Databases and Information Systems Commons , Numerical Analysis and Scientific Computing Commons , Other Computer Sciences Commons , and the eory and Algorithms Commons is Honors Research Project is brought to you for free and open access by e Dr. Gary B. and Pamela S. Williams Honors College at IdeaExchange@UAkron, the institutional repository of e University of Akron in Akron, Ohio, USA. It has been accepted for inclusion in Williams Honors College, Honors Research Projects by an authorized administrator of IdeaExchange@UAkron. For more information, please contact [email protected], [email protected]. Recommended Citation Kolbl, AnnMarie, "Absorption Calculator: A Cross-Platform Application for Portable Data Analysis" (2019). Williams Honors College, Honors Research Projects. 894. hps://ideaexchange.uakron.edu/honors_research_projects/894
Transcript of Absorption Calculator: A Cross-Platform Application for ...

The University of AkronIdeaExchange@UAkronWilliams Honors College, Honors ResearchProjects
The Dr. Gary B. and Pamela S. Williams HonorsCollege
Spring 2019
Absorption Calculator: A Cross-PlatformApplication for Portable Data AnalysisAnnMarie [email protected]
Please take a moment to share how this work helps you through this survey. Your feedback will beimportant as we plan further development of our repository.Follow this and additional works at: https://ideaexchange.uakron.edu/honors_research_projects
Part of the Databases and Information Systems Commons, Numerical Analysis and ScientificComputing Commons, Other Computer Sciences Commons, and the Theory and AlgorithmsCommons
This Honors Research Project is brought to you for free and open access by The Dr. Gary B. and Pamela S. WilliamsHonors College at IdeaExchange@UAkron, the institutional repository of The University of Akron in Akron, Ohio,USA. It has been accepted for inclusion in Williams Honors College, Honors Research Projects by an authorizedadministrator of IdeaExchange@UAkron. For more information, please contact [email protected],[email protected].
Recommended CitationKolbl, AnnMarie, "Absorption Calculator: A Cross-Platform Application for Portable Data Analysis" (2019).Williams Honors College, Honors Research Projects. 894.https://ideaexchange.uakron.edu/honors_research_projects/894

Absorption Calculator 1
Absorption Calculator: A Cross-Platform Application for Portable Data Analysis
Abstract
Traditional spectrometers are expensive and non-portable, making them inaccessible to
the public. This application will be used in conjunction with spectrometer hardware developed
by Erie Open Systems. The hardware itself is 3D printed and, in addition to being portable,
enables data to be collected easily. The purpose of this project is to create a cross-platform
application capable of reading the output from the spectrometer hardware, calculating the
absorbance levels of the sample against the control, and recording the data in tables stored on the
cloud. The end result will be an application that runs on iOS and Android, and is easily
accessible to the general public. The main contribution of the application will be to make this
version of spectrometer more affordable and portable than its counterparts.
Introduction
My criteria for choosing a project to work on was that it needed to be challenging and
make an impact in the community. Traditionally, spectrometers and colorimeters are an
expensive black box, averaging around $1,500 a piece, which is problematic when trying to
involve the community and citizen scientists in research projects because they often can’t afford
the hardware and are unable to take it into the field. Additionally, traditional hardware hides the
internal workings of the device, making it difficult for those using it to understand the processes
occurring and calculate the results. Erie Open Systems, a local company “dedicated to providing
accurate and affordable environmental monitoring tools for the general public, including citizen

Absorption Calculator 2
scientists and young participants of formal or informal learning activities” has developed a 3D
printed, open source spectrometer hardware to help solve these problems (“Erie Open Systems”).
The original goal of this project was to design a cross-platform, multi-tier application that
would read the output from the spectrometer hardware designed by Erie Open Systems. It would
read the images of the spectra, perform pixel-by-pixel image analysis, and calculate the levels of
phosphate and nitrate present in the samples. The data would then be inserted into a database,
allowing users to access the data and track sources of nutrient loadings.
At the time of application development, there were some existing applications that
perform similar tasks. However, some are accompanied by expensive hardware, or no hardware
at all. This hardware-software combination is unique in that the hardware is open source and
inexpensive, meaning that it is more accessible to users. Additionally, many of the other
applications are simply used for calculating concentration and absorbance values of substances
without an agricultural component. This application was designed with an emphasis on the
importance of agriculture, teaching those who use it how to successfully use the hardware and
report accurate results.
Erie Open Systems and Spectrometer Hardware
Erie Open Systems is a company created by University of Akron professors, research
scientists, and doctoral candidates dedicated to developing open-source 3D printed spectrometer
hardware to track the concentration of nutrient loading resulting in harmful algal blooms in Lake
Erie (Christensen). The initial idea for the hardware was developed in the King Lab at the
University of Akron, where they were developing a “smart-phone based, pedagogic tool, based

Absorption Calculator 3
on the optics and chemistry of conventional spectroscopic methods, to measure nitrate and
phosphate concentrations” (“Ongoing Projects”).
Fig. 1: Image of the open-source spectrometer hardware
Figure 1 shows a model of the spectrometer hardware, a design which is being released as
open-source, or can be purchased for only $40- a fraction of what normal spectrometer hardware
would cost (“Erie Open Systems”). The phone application will read the output of the hardware
by taking a picture of the visible spectra through the small hole at the top, and perform the
absorbance and concentration analysis from there.

Absorption Calculator 4
Fig. 2: Image of the current application on iOS
Figure 2 shows a screenshot of the initial application that Erie Open Systems had
designed for iOS. This application was limited to iOS only, so the functionality did not meet the
needs of the end users.
Xamarin and C#
The first step of development was to select the programming language that I would use to
build the application. I had never built a phone application before, but I was familiar with
Android Studio and its use for building Android applications. In this instance, however, the
application needed to span multiple platforms, and Android Studio would not be able to
accommodate my needs. The initial application, which was built by Erie Open Systems, was
written using Visual Studio, Xamarin, and C#. When looking into it further, I found that
Xamarin and C# seemed to be the best option for building cross-platform applications because it
Absorption Calculator 5
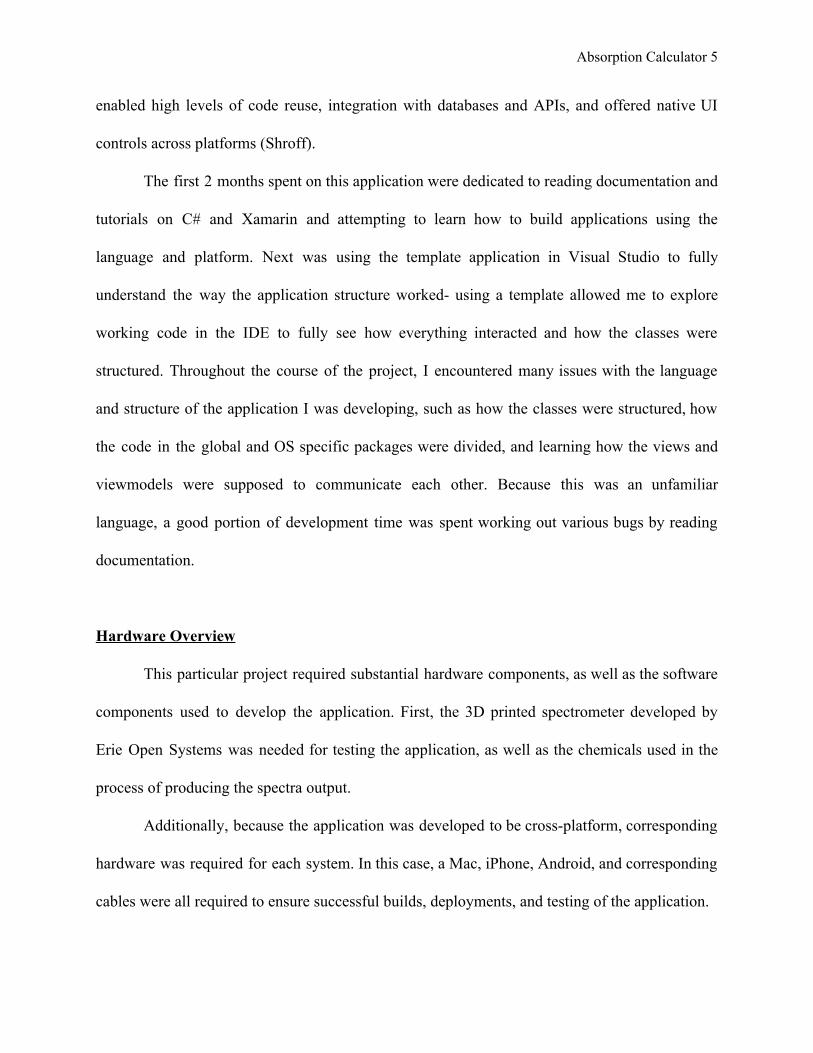
enabled high levels of code reuse, integration with databases and APIs, and offered native UI
controls across platforms (Shroff).
The first 2 months spent on this application were dedicated to reading documentation and
tutorials on C# and Xamarin and attempting to learn how to build applications using the
language and platform. Next was using the template application in Visual Studio to fully
understand the way the application structure worked- using a template allowed me to explore
working code in the IDE to fully see how everything interacted and how the classes were
structured. Throughout the course of the project, I encountered many issues with the language
and structure of the application I was developing, such as how the classes were structured, how
the code in the global and OS specific packages were divided, and learning how the views and
viewmodels were supposed to communicate each other. Because this was an unfamiliar
language, a good portion of development time was spent working out various bugs by reading
documentation.
Hardware Overview
This particular project required substantial hardware components, as well as the software
components used to develop the application. First, the 3D printed spectrometer developed by
Erie Open Systems was needed for testing the application, as well as the chemicals used in the
process of producing the spectra output.
Additionally, because the application was developed to be cross-platform, corresponding
hardware was required for each system. In this case, a Mac, iPhone, Android, and corresponding
cables were all required to ensure successful builds, deployments, and testing of the application.

Absorption Calculator 6
I own an HP laptop and a Samsung Galaxy S8, which took care of the necessary
components for the Android portion of the application. To obtain the hardware for iOS
development, I applied for the Tiered Mentoring program through the Biology Department. I
partnered with Dr. King’s lab and Banafsheh Khakipoor to work on the DIY Spectrometry
Mobile Phone Application Development Project, and was awarded $500 to purchase the
necessary hardware components. The funding provided by the Tiered Mentoring program was
used to purchase two phones for testing- one iPhone 7 and one Huawei Mate SE.
Problems with Emulation
Fig. 3: Command to enable Hyper-V on Windows Command Line
Fig. 4: Error in Powershell
This project required more hardware to get started than I anticipated. Initially, I thought
that my HP laptop would be enough to get the first build of the application up and running on an
Android emulator. I created a template application, deployed it to the Android emulator I had set

Absorption Calculator 7
up on my laptop, and received an error because hardware acceleration was not supported. To fix
this issue, I found that Hyper-V needed to be enabled through the code shown in Figure 3.
However, running this command in PowerShell produced the error shown in Figure 4.
Fig. 5: Image of the emulator shortly before it crashed
After looking into it further, I found that this meant my firmware did not have the
capabilities to support the features necessary. As a work around, I installed a non-accelerated
emulator and was able to successfully build the application and deploy it to the emulator.
However, the emulator remained unresponsive once the deployment was complete, and crashed

Absorption Calculator 8
soon after (see Figure 5). Due to these problems, I chose to abandon the emulation and opt for
directly deploying the application to an Android phone.
Problems with iOS Builds
Fig. 6: Error from Pair-to-Mac in Visual Studio
Fig. 7: Image of the Remote Login Screen Equivalent on Mac
Designing and building the iOS portion of the cross-platform application presented its
own set of challenges. Going into development, I knew I did not have the correct hardware to
deploy the application for testing. However, I found that without a Mac, I was unable to access

Absorption Calculator 9
the .IOS files for the application, which meant that I was unable to make changes to the template
application, build, deploy, or test anything linked to iOS. When I would try, I would get the error
shown in Figure 6.
Upon researching further, I found that to build and deploy an iOS application from a PC I
would need to pair my device with a Mac server which would enable my device to access Xcode
and deploy to an iPhone. Figure 7 shows the configuration screen on the Mac used when pairing
to the Mac server in Visual Studio. By providing explicit access for my user, Visual Studio was
able to establish an ssh connection to the Mac and access the necessary utilities and programs for
development.
There was a significant delay on application development while I tracked down a Mac
that I could use- eventually obtaining one, which enabled me to make more progress on the
application. However, obtaining the correct hardware components for the application delayed the
development timeframe I had initially proposed and proved to be a challenge during the
development of the application. The process of tracking down the necessary hardware taught me
a valuable lesson about software not always working on the environments you expect them to
and the difficulties getting everything to synchronize across multiple platforms and multiple
pieces of hardware.
Once access to the Mac and iPhone hardware was established, I was able to begin
development in earnest on the application. I began attempting to deploy the template application
to the iPhone, but encountered another error during the deployment process. In order to deploy to
an iOS device, the application code has to be signed. This means obtaining provisioning profiles
and a certificate (.p12 file) in order for the code to be deployed to a physical device (Nrajpurkar).

Absorption Calculator 10
Fig. 8: Erie Open System’s Developer Certificate
Getting a certificate required an Apple Developer Program membership, which is
required to “request, download, and use signing certificates issued by Apple” (“Certificates”).
Luckily, Erie Open Systems had already obtained one of these licenses that I was able to use
(Figure 8 above), so the delay in development time was dramatically shortened from what it
would originally have been. After configuring the provisioning profiles and certificate on the
Mac I was using, I was able to successfully build and deploy the iOS portion of the application
for the first time.
Table Design
Fig. 9: ER Diagram of the Application Tables

Absorption Calculator 11
The original application developed by Erie Open Systems was not collecting or storing
the absorption data. The result was simply being shown to the user and then discarded. To
prevent this loss of data and increase the functionality and usefulness, the application was
designed to push the data to a back-end database, where it could later be used for metrics and
other research purposes. Initially, I was going to create the tables using MySQL, a database that I
am very familiar with. However, Erie Open Systems had obtained the AI for Earth: Microsoft
Azure grant, meaning that I had access to a paid Microsoft account and was able to design the
tables using Microsoft SQL.
Figure 9 shows the ER diagrams for the tables, which were designed with ease of
readability and speed of data access in mind. Each table has an auto-incremented primary key,
allowing for quick data access and better efficiency in creating foreign keys. The database is
specifically broken down into three tables- Absorbance Data, User, and Phone. Absorbance Data
is the primary table of the three- it is used to hold the data taken from the spectra analysis
performed by the application. The User table stores login information for the user, as well as
demographic information that may be useful at a later date when performing data analysis. The
Phone table was created to store the additional phone attributes needed to accurately calculate the
concentration and absorbance values. These items, such as white balance, brightness, and shutter
speed, all have an impact on how the picture looks when it is taken, meaning it can impact the
values calculated and needs to be accounted for.

Absorption Calculator 12
Database Implementation
Midway through table designs, Erie Open Systems acquired a server on which to host
their website. After discussion as to where the best place to host the tables was, we came to the
conclusion that hosting the tables on their personal server made more sense than developing the
tables using Microsoft Azure. The server they were using had a MySQL instance pre-installed on
it, which I was able to use to create the tables without much trouble. Due to the server switch,
some time was lost reading Azure documentation that was no longer necessary for the table
development. However, developing the tables in MySQL is something I am relatively familiar
with, and I was able to get them built quickly.
Fig. 10: Final Table Designs
Fig. 11: Image of Created Tables in phpMyAdmin
Absorption Calculator 13
Figure 10 shows the final table designs that were created on Erie Open System’s server.
The database and access user on the server were created using the MySQL Database Wizard,
which configured everything on the server automatically. I then created the tables using
phpMyAdmin, which was also configured automatically on the server. The phpMyAdmin system
seemed outdated and hard to use while trying to define the tables (Figure 11 shows the
navigation bar of the created tables in phpMyAdmin), so I decided to switch to a different IDE.
When doing this, I encountered a problem with making the connection to the database, as the
server rejects requests from outside hosts that haven’t been registered. To fix this issue, I had to
register my host within the server, and was eventually able to connect.
Converting Existing Functionality
As previously mentioned, Erie Open Systems has an existing application that performs
the base functionality of analyzing the spectra output from the hardware. However, their existing
solution only works on iOS, and lacks the necessary structure for supporting cross-platform
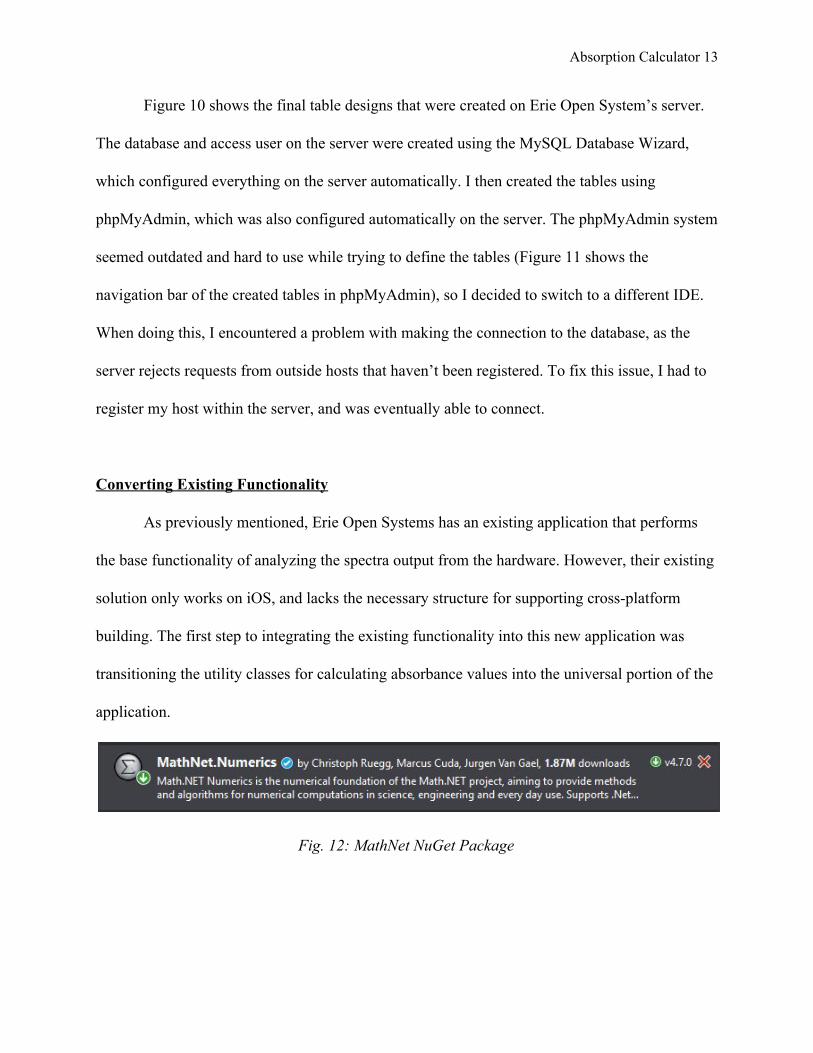
building. The first step to integrating the existing functionality into this new application was
transitioning the utility classes for calculating absorbance values into the universal portion of the
application.
Fig. 12: MathNet NuGet Package

Absorption Calculator 14
Fig. 13: Microsoft AppCenter NuGet Packages
When integrating, I found that some of the packages were not importing properly,
causing errors when building the application. Upon looking into it further, I discovered this was
because the existing util classes were using NuGet packages that had not been imported. Within
the util class, there is a calculation for a least-squares curve fitting routine, which utilizes the
MathNet.Numerics. Installing the package shown in Figure 12 fixed the issue. Additionally,
when converting the existing functionality from iOS to the new application, I found that the
existing code base was using Microsoft.AppCenter NuGet packages for analytics and crash
reporting. Installing the packages in Figure 13 fixed those issues, and when running the app I
found they provided excellent when debugging.
Taking a Picture
Fig. 14: Android Code to Enable Camera Functionality

Absorption Calculator 15
With regards to this application, the primary functionality is to take a picture of the
output from the spectrometer hardware and then calculate the absorption values. To do this, the
application has to have access to the camera hardware on both platforms. The first step in
enabling the camera for Android was to edit the user permissions to bypass security restrictions
and grant the application access to the hardware. There are several ways to do this, but the most
efficient way that I found on Android was to give the application explicit permission using
StrictMode through the code shown in Figure 14. This gives the application access without
asking permission from the user, and it enables the full range of required permissions, such as
accessing the camera and internal file storage in order to save the images (“Launch Camera
Activity with Saving File in External Storage Crashes the App”).
Fig. 15: iOS Option to Enable Camera Functionality
Granting camera permissions on iOS is a slightly different process. For their platform,
there is an internal permissions file that can be edited directly in Visual Studio named info.plist.
This file contains all the permissions that the application will request when it is downloaded for
the first time. Info.plist enables you to edit existing permissions, introduce new, as well as
specify messages that will display when the application requests access. The permission added
for camera and file system access is shown in Figure 15.

Absorption Calculator 16
Fig. 16: Initial Camera Screens
After setting permissions, the initial camera designs on iOS and Android were very
similar, since they were built in the global domain. Figures 16 shows the camera screens on
Android, and the screens on iOS look almost exactly the same. The initial application was only
able to take pictures and save them to the internal file storage system of the phone, though it also
provided users the opportunity to retake photos without saving. However, it also needed to be
able to calculate the absorption values from the spectra images, which required image
processing.

Absorption Calculator 17
Calculating Absorption
The algorithm that calculates absorption drives the primary functionality behind the
application. The explanation below is summarized from the pseudocode provided in the
algorithm class originally written by Banafsheh Khakipoor (Khakipoor).
1. For each pixel value, find the sum of the RGB differences
2. Handle Columns
a. Calculate average for each column of pixels in the image
b. Get the maximum value between the column averages
c. Eliminate columns with low RGB values, or black rows, which will be the
external columns and the gap between the two spectra images
d. Find the center gap and use it to isolate the left and right sides of the spectra
images respectively
3. Handle Rows
a. Calculate average for each row of pixels in the image
b. Get the maximum value between the row averages
c. Eliminate rows with low RGB values, or black rows
4. Use resulting values calculated from handling columns and rows to draw sample and
reference rectangles around the pixels containing the spectra images
5. Save cropped images with sample and reference locations identified
6. Use the RGB values from the isolated images to calculate the absorption values

Absorption Calculator 18
Application Design
Fig. 17: Login Page on Android OS
Fig. 18: Menu on Android OS

Absorption Calculator 19
Fig. 19: About Page on Android OS
Fig. 20: Instructions and Instructions Detail Pages

Absorption Calculator 20
Fig. 21: Initial Camera Screen on iOS
The first page a user will see when accessing the application is the Login page, shown on
the Android OS in Figure 17. Since the application is not equipped with a SQLite or MySQL
database instance, the application simply validates the user entry against a set string (in this case,
username ‘[email protected]’, password ‘secret’) and allows or denies entry based on the
correct combination.
When designing the application, I tried to keep the design simple and user-friendly. Since
the app will potentially be used by people of all ages, I wanted the design the be clean and easily
accessible. The main design consists of 3 pages- About, Instructions, and Camera. These pages
all exist in the global domain of the application, meaning they cross-build between platforms
without any platform specific code needing to be written and accessed by a menu structure
shown in Figure 18. The exception to this rule is the Camera page- the menu to access it is in the

Absorption Calculator 21
global realm, as is the algorithm that behind it. However, the camera functionality on iOS and
Android differ for now, and as such there is specific code for each in the different packages.
The About page, shown in Figure 19, provides more information about the application
design. It also provides a link to Erie Open System’s homepage, through which they can find out
more about the company and the 3D printed spectrometer hardware.
The Instructions page, shown on the left of Figure 20, is designed to be clicked through
by the user while they are preparing the sample for the spectrometer hardware. It was designed to
be easily accessible, and present sometimes complex instructions in an easy-to-read manner.
Each step expands into subpages when clicked, shown in the right of Figure 20. These subpages
offer more detail on the instructions and allow for easier access to each step.
The last page accessible through the menu is the Camera page, which allows users to take
pictures. As explained above, the functionality differs on Android and iOS platforms. However,
both screens were designed with ease of use in mind. Figure 21 shows the screen designed using
xCode by Erie Open Systems, which was imported into the project. The Android screens, shown
in Figure 16, were designed using the native Android interface, with the intention of transitioning
over at a later date.
Future Work
As is common with most large-scale development projects of this nature, things did not
go entirely according to plan. The end result of this application was one that met some of the
goals set forth at the beginning of development, but ultimately was not completed in the time

Absorption Calculator 22
frame due to unforeseen hardware and software issues. Because of this, there is a good amount of
future work that I would like to do on this application.
The first changes that I would like to make to the application are to get the Android
portion fully operational. The utility functions, as well as the base pages for the rest of the
application, exist in the global domain, so they are accessible on both platforms. Additionally,
users are able to take pictures through the Android side of the application that they are able to
save. However, I was unable to get the full functionality of the iOS application transitioned over
in the timeframe, so calculating absorption on Android hardware is currently not possible.
Next, I would like to get the database component fully integrated into the application.
During the course of this project, the tables for the application were fully designed and are
currently being hosted on an independent server, meaning they should be easily accessible. Once
again, since this project presented so many challenges during development, I was unable to
integrate the two, but it is a very important step moving forward to enable data tracking.
Lastly, I would like to make changes to the application UI to make it more user-friendly
in the long run. Erie Open Systems hopes to work with children and adults of all ages to help
increase the monitoring and combat the spread of harmful algal blooms, so creating a UI that is
not only functional but is more accessible to everyone will be a great benefit in the long term.
Conclusion
This project was something I was very excited to work on, due to both the challenging
aspects and the potentially positive environmental impact. I was able to successfully meet many
of my goals on this project, and though the overall application is not what was originally

Absorption Calculator 23
proposed, I feel it is still a success in many ways. My application begins the transition from a
purely iOS application to one that is open and accessible to more people. In addition, the
database tables created through this project will allow for the storage of data which can
eventually be used to track the spread of harmful algal blooms throughout freshwater bodies.
Looking back on my experiences during this project, I realize just how much I’ve been
able to learn and grow during this process. I was able to teach myself new languages, overcome
challenges working with new hardware, and solve problems as they arose. I am very proud of
what I have accomplished with this project. The knowledge I have gained working with new
technologies, as well as the experience working on a development project of this magnitude, are
the biggest things I will take with me to utilize in the future.

Absorption Calculator 24
Works Cited
1. “Certificates.” Certificates - Support - Apple Developer, Apple, Inc,
developer.apple.com/support/certificates/.
2. Christensen, Claude. “Erie Open Systems.” Medium, Medium, 2 Jan. 2019,
medium.com/@claudechristensen/erie-open-systems-ed08cba0f16b..
3. “ERDPlus.” ERDPlus, erdplus.com/.
4. “Erie Open Systems.” Erie Open Systems, erieopen.tech/.
5. jfeng. “ErieOpenSpec v10.” Thingiverse, www.thingiverse.com/thing:2904527.
6. Khakipoor, Banafsheh. “BanafshehKhaki/OESApplication.” GitHub, 22 Mar. 2019,
github.com/BanafshehKhaki/OESApplication/.
7. “Launch Camera Activity with Saving File in External Storage Crashes the App.”
Xamarin Community Forums, Xamarin, 8 June 2017,
forums.xamarin.com/discussion/97273/launch-camera-activity-with-saving-file-in-extern
al-storage-crashes-the-app.
8. “Making an EOS 1 Open-Source Spectrometer.” Instructables, Instructables, 28 Nov.
2018,
www.instructables.com/id/Assembly-of-EOS-1-Open-source-Spectrometer-Walk-th/.
9. Nrajpurkar, Nilofer, et al. “IOS Code Signing in App Center - Visual Studio App
Center.” IOS Code Signing in App Center - Visual Studio App Center | Microsoft Docs,
18 Nov. 2018, docs.microsoft.com/en-us/appcenter/build/ios/code-signing.
10. “Ongoing Projects.” MBOD, mbod-lab.com/.

Absorption Calculator 25
11. Shroff, Rohan. “5 Reasons Why Xamarin Is the King of Cross-Platform Development.”
Softwebsolutions, 4 Nov. 2014,
www.softwebsolutions.com/resources/5-reasons-why-xamarin-is-cross-platform-develop
ment-king.html.