Applying Natural Language Processing in the Clinical Setting

4-1
Section 4
About the Natural Setting
If the earth’s history were compressed into a single
day, life would first stir at about 6 AM and “fossil men
and their modern representatives” would show up only
a few seconds before midnight.
—Wayne Grady, The Great Lakes1
Introduction Lac du Flambeau is in the Northern Highlands
Ecological Landscape, one of sixteen landscapes in
Wisconsin.5 This section focuses on the early
formation of the landscape and describes its
watersheds, hydrology, climate, temperature,
precipitation, wetlands, woodlands, agricultural
areas, and mineral resources. Lac du Flambeau
land uses, habitat, and wildlife types are also
examined, along with results of a community survey.
Formation of Ecological Landscapes The land and lakes known today as Lac du
Flambeau started taking shape more than 2 billion
years ago when the landmass that eventually
became the continent of North America was forming
by the jostling and fusing of two massive tectonic
plates. The seam between them, now called the
Midcontinent Rift, remained a fault line which a
billion years later split apart and filled with molten
rock from deep within the earth. Today, that seam is
beneath Lake Superior and the state of Michigan. A
second fault line formed about 570 million years
later when North America divided again, forming a
rift beneath the Lakes of Ontario and Erie,
determining the course of the St. Lawrence River.6
Over millions of years of such movements, three
stable landmasses eventually formed and joined
creating the Canadian Shield, which today is
associated with the Great Lakes and surrounding
areas. One of the landmasses, the Southern
Province, is beneath southern Ontario, parts of
Michigan, and most of Minnesota and Wisconsin.7
Lac du Flambeau is part of the Southern Province.
The shape and arrangement of the Great lakes and
surrounding areas, including Lac du Flambeau,
resulted from what ice did to the land.8 Though there
have been several long periods of glaciations during
the history of the earth, there were four that affected
primarily the formation of the Great Lakes: the
Nebraskan (1 million to 900,000 years ago), the
Kansan (700,000 to 600,000 years ago), the Illinoian
(300,000 to 200,000 years ago), and the
Wisconsinian (90,000 to 10,000 years ago).9
The physical landscape is determined by only two
factors: tectonics and climate. The movement of
continental plates forms the rough contours of a
landscape, and then climate proceeds to refine
those features as an artist uses knives and scrapers
to create the likeness of a face in wet clay. Climate’s
tools—water, wind, sedimentation, plant species,
glaciers—shape and alter river valleys, bluffs,
hills, and soil.
—Wayne Grady, The Great Lakes2
Between every two pine trees there is a door leading
to a new way of life.
—John Muir3
A lake is the landscape’s most beautiful and
expressive feature. It is earth’s eye; looking into
which the beholder measures the depth of his own
nature.
—Henry David Thoreau, 18494

4-2 Section 4: About the Natural Setting
Bear River Watershed Compreh
The exorbitant weight and pressure of the moving
ice sheets carved many depressions in the Southern
Province’s surface and distributed huge piles of silt,
clay, sand, and gravel, ranging in size from dust to
boulders. After thousands of years the ice eventua
melted and the water filled many of the depressions
forming lakes and riverbeds.10
About 9,000 years ago, the long process of soil
formation began. The melting ice had deposited
minerals needed to support plant life, but an organic
material was needed to keep the minerals from
washing away and to enable them to support plant
life. Lichens grow on almost any substrate and were
the first organisms to help in the process. Mosses
and ferns, whose roots do not require soil, then
moved in, followed by flowering plants whose spread
was aided by the wind.11
As plants grew and died, their decomposition was
aided by microscopic organisms that broke the
organic matter down into soil nutrients. Over time,
this process was aided by the addition of increasing
numbers of insects, small rodents, and a variety of
other organisms. Depending on conditions of climate
such as rainfall, drought, and temperature, soil
Figure 4-1. Ecological Landscapes in Wisconsin
Section 4: About the Natural Setting
r Watershed Comprehensive Lake Management Plan
the moving
ice sheets carved many depressions in the Southern
Province’s surface and distributed huge piles of silt,
ranging in size from dust to
boulders. After thousands of years the ice eventually
melted and the water filled many of the depressions,
About 9,000 years ago, the long process of soil
formation began. The melting ice had deposited
minerals needed to support plant life, but an organic
material was needed to keep the minerals from
support plant
. Lichens grow on almost any substrate and were
the first organisms to help in the process. Mosses
and ferns, whose roots do not require soil, then
moved in, followed by flowering plants whose spread
As plants grew and died, their decomposition was
aided by microscopic organisms that broke the
organic matter down into soil nutrients. Over time,
this process was aided by the addition of increasing
numbers of insects, small rodents, and a variety of
r organisms. Depending on conditions of climate
such as rainfall, drought, and temperature, soil
accumulated at a rate of 2 to about 10 centimeters
every 100 years. As time passed, the rock that had
been covered by sheets of ice became lands
cloaked by numerous grasses, trees, and a
seemingly unlimited variety of plants.
The interplay of tectonics and climate over time
created a variety of ecological landscapes that today
cover the earth. The State of Wisconsin, for
example, has sixteen ecological landsca
4-1), each with its own set of attributes.
Interestingly, the boundaries of areas negotiated by
tribal chiefs in 1837 and 1842 for the protection of
tribal resources (Figure 4-2) closely resemble the
boundaries of the current ecological regions,
illustrating the knowledge and importan
to tribal people.
Northern Highlands Ecological LandscapeThe Northern Highland Ecological Landscape is
located in northern central Wisconsin and includes
Lac du Flambeau and the Bear River Watershed. The
landscape corresponds to US EPA management unit
ecoregion known as Northern Lakes and Forest
. Ecological Landscapes in Wisconsin
Figure 4-2. Boundaries Negotiatedand 1842
accumulated at a rate of 2 to about 10 centimeters
every 100 years. As time passed, the rock that had
been covered by sheets of ice became lands
erous grasses, trees, and a
seemingly unlimited variety of plants.12
The interplay of tectonics and climate over time
created a variety of ecological landscapes that today
arth. The State of Wisconsin, for
example, has sixteen ecological landscapes (Figure
), each with its own set of attributes.13
Interestingly, the boundaries of areas negotiated by
tribal chiefs in 1837 and 1842 for the protection of
) closely resemble the
boundaries of the current ecological regions,
illustrating the knowledge and importance of ecology
Northern Highlands Ecological Landscape The Northern Highland Ecological Landscape is
located in northern central Wisconsin and includes
Lac du Flambeau and the Bear River Watershed. The
landscape corresponds to US EPA management unit
rthern Lakes and Forest,
d by Tribal Chiefs in 1837

Section 4: About the Natural Setting 4-3
Bear River Watershed Comprehensive Lake Management Plan
Northern Wisconsin Highlands Lakes Country (50i).14
The area is 2,081 square miles and represents 3.7%
of the total land area in Wisconsin. The Northern
Highland Ecological Landscape is predominantly
igneous and metamorphic rock generally covered by
deposits of glacial drift from 5 to 100 feet in depth.15
It is a rolling plain known for its lakes and mixture of
extensive forests, large peat lands, bogs, and
conifer swamps. Though characterized mainly by
pitted outwash plains, it also contains some coarse-
textured moraines.16
Most of the Northern Highland Ecological Landscape
soils are sands and gravels, some with loamy
material. Soil productivity is low compared to glacial
till but relatively high for outwash sands. Wetlands
are numerous, most with organic soils of peat or
muck.17
Hydrologic Features The Northern Highlands Ecological Landscape has
one of the highest concentrations of lakes in the
world. The lakes were formed as glaciers melted and
large ice blocks became stranded and outwash
materials were deposited over them. As the ice
blocks slowly melted and collapsed, lakes were
formed in areas that were below the level of ground
water. Today, the area includes 4,291 lakes and
1,543 miles of streams, including the headwaters of
the Wisconsin and Manitowish-Flambeau-Chippewa
river systems. Many lakes are connected by small
streams. Rare aquatic species and extensive
wetlands occur here.18
Lying within the Northern Highlands Ecological
Landscape, Lac du Flambeau has 260 lakes
covering 17,897 acres, 71 miles of streams and
rivers, and 24,000 acres of wetlands. Lac du
Flambeau has the third highest density of lakes in
the world with 27.09 square miles of surface water.
Nearly one-half (48.4%) of Lac du Flambeau’s
overall surface is under water.19
Temperature The Northern Highland Ecological Landscape has
an average annual temperature of 39.5 degrees
Fahrenheit, the lowest of any Ecological Landscape
in the state and almost two degrees lower than that
of other northern ecological landscapes.
Temperatures regularly range from winter lows of
-20 degrees Fahrenheit to summer highs of 95
degrees Fahrenheit.20
Precipitation The average annual precipitation is 31.6 inches,
similar to other northern ecological landscapes. The
average annual snowfall is 68.1 inches, the second
largest amount of snowfall in the state. Only the
Superior Coastal Plain receives more snowfall, an
average of 87.4 inches per year. Snowfall varies
dramatically within the Northern Highland Ecological
Landscape, with the northern part of the landscape
being within the outer edge of the lake effect snow-
belt of Upper Michigan and northwestern
Wisconsin.21
Watersheds A watershed is an area of land drained by a river
system.22
Lac du Flambeau extends over four
watersheds as classified by the Wisconsin
Department of Natural Resources (Figure 4-3 and
Table 4-1). The watersheds are commonly known as
the Upper South Fork Flambeau River Watershed,
Manitowish River Watershed, Upper Tomahawk
River Watershed, and the Bear River Watershed.23
Most of Lac du Flambeau is located in the Bear
River watershed. The part of Lac du Flambeau
within the Chequamegon-Nicolet National Forest lies
within the upper South Fork of the Flambeau River
watershed. A sliver of the northeast part of Lac du
Flambeau is located in the Manitowish River
watershed, and two lobes in the southeast are within
the Upper Tomahawk River watershed. All of these
watersheds drain into the Mississippi River.24

4-4 Section 4: About the Natural Setting
Bear River Watershed Comprehensive Lake Management Plan
Figure 4-3. Overlay of Lac du Flambeau on Watersheds
Table 4-1. Summary Data on Area Watersheds
Watershed
Bear Manitowish Flambeau Tomahawk
Size, square mi 145 269 279 187
Streams, miles 110 212 255 139
Lakes, acres 16,824 22,943 8,509 17,609
Wetlands, acres 30,672 33,727 63,099 20,470
The United States Geological Survey (USGS)
proffers an alternative classification of the
watersheds, considering the watersheds to be sub-
watersheds of three watersheds (Table 4-2):
Flambeau Watershed, South Fork Flambeau
Watershed, and Upper Wisconsin Watershed.25
Table 4-2. Watersheds as Characterized by USGS
Lac du Flambeau Watershed Name
USGS 8-digit Watershed
Hydrologic Unit Code (HUC)
Approximate Percentage of
Reservation Area in each
Watershed
Manitowish River (4.5%) Bear River (76.5%)
Flambeau 07050002
81%
Upper South Fork Flambeau River
South Fork Flambeau 07050003
8.9%
Upper Tomahawk River Upper Wisconsin
07070001 10.1%
Upper Tomahawk River Watershed The Upper Tomahawk River Watershed (Table 4-3)
is in Oneida and Vilas counties. It is 119,568 acres
in size and contains 139 miles of streams and rivers,
17,610 acres of lakes, and 20,470 acres of
wetlands. The watershed is dominated by forest
(59%), wetlands (17%), and open water (14%), and
is ranked high for nonpoint source pollution issues
affecting streams and lakes.26
Table 4-3. Upper Tomahawk River Watershed
Watershed Size 187 sq mi
Stream Miles 139 mi
Lake 17,610 ac
Wetland 20,470 ac
Outstanding/Exceptional Miles 19.6 mi
Outstanding/Exceptional Acres 3,765 ac
Trout Waters 14.2 mi
Impaired Streams 0 mi
Impaired Lakes/Impoundments 727 ac
The Upper Tomahawk River Watershed covers
approximately 10.1% of the total Reservation area,
and includes vast areas of highly developed
lakefront property.27
Upper South Fork Flambeau River Watershed This Upper South Fork Flambeau River Watershed
(Table 4-4) lies mainly within the Chequamegon
National Forest in Price County. Meld is the only
municipal area; there are no point source discharges
to surface waters. Much of the watershed is wetland
or forested, with very little agriculture.28
The Upper South Fork Flambeau River Watershed
covers approximately 8.9% of the Reservation and
includes expansive tracts of undeveloped Tribal land
and minimal lakefront development.29

Section 4: About the Natural Setting 4-5
Bear River Watershed Comprehensive Lake Management Plan
Table 4-4. Upper South Fork Flambeau River Watershed
Watershed Size 279 sq mi
Stream Miles 255 mi
Lake 8,509 ac
Wetland 63,099 ac
Outstanding/Exceptional Miles 74 mi
Outstanding/Exceptional Acres 234 ac
Trout Waters 41.8 mi; 11.7 ac
Impaired Streams 0 mi
Impaired Bays/Harbors/Lakes 3,249.9 ac
Manitowish River Watershed The Manitowish River Watershed (Table 4-5) is in
the northeastern-most tip of the Upper Chippewa
River Basin and is almost completely contained
within the Northern Highland American Legion State
Forest. The region is mostly forest and wetlands.
The Manitowish River originates in wetland areas of
central Vilas County and runs through several lakes
before it joins with the Bear River to form the
Flambeau River.30
Table 4-5. Manitowish River Watershed
Watershed Size 269 sq mi
Stream Miles 212 mi
Lake 22,943 ac
Wetland 33,727 ac
Outstanding/Exceptional Miles 46.6 mi
Outstanding/Exceptional Acres 5,140.6 ac
Trout Waters 27.6 mi
Impaired Streams 0 mi
Impaired Bays/Harbors/Lakes 4,945 ac
The Manitowish River Watershed covers
approximately 4.5% of the Reservation, with limited
developed lakefront property. It has, however,
cranberry operations that affect the water quality of
several waterbodies.31
Bear River Watershed The Bear River Watershed (Table 4-6) is located in
southeastern Iron and southwestern Vilas counties
and includes the ten lakes on which this
Comprehensive Lake Management Plan focuses.
Table 4-6. Bear River Watershed
Watershed Size 145 sq mi
Stream Miles 110 mi
Lake 16,824 ac
Wetland 30,672 ac
Outstanding/Exceptional Miles 0 mi
Outstanding/Exceptional Acres 0 ac
Trout Waters 0 mi
Impaired Streams 0 mi
Impaired Bays/Harbors/Lakes 1,721 ac
The Bear River watershed is primarily undeveloped
forest and wetlands, with its northern quarter
spanning the Northern Highland American Legion
State Forest. Most of its central and southern
sections are within the Lac du Flambeau Indian
Reservation.32
The Bear River Watershed is known for its pitted
outwash plains and kettle lakes mixed with extensive
forests and large peat lands. The watershed’s
landforms are characterized mainly by pitted
outwash and some coarse-textured moraines. The
soils are acidic and relatively unproductive due to
low moisture-holding capacity and lack of organic
matter.33
Most of the watershed’s lakes are concentrated in
the eastern half and many are linked by streams to
Flambeau Lake (Figure 4-4). The Bear River
Watershed covers the majority of Reservation
acreage, at 76.5%. It includes vast tracts of
undeveloped Tribal land as well as large areas of
highly developed lakefront property, both Tribal and
fee land.34
4-6 Section 4: About the Natural Setting
Bear River Watershed Comprehensive Lake Management Plan
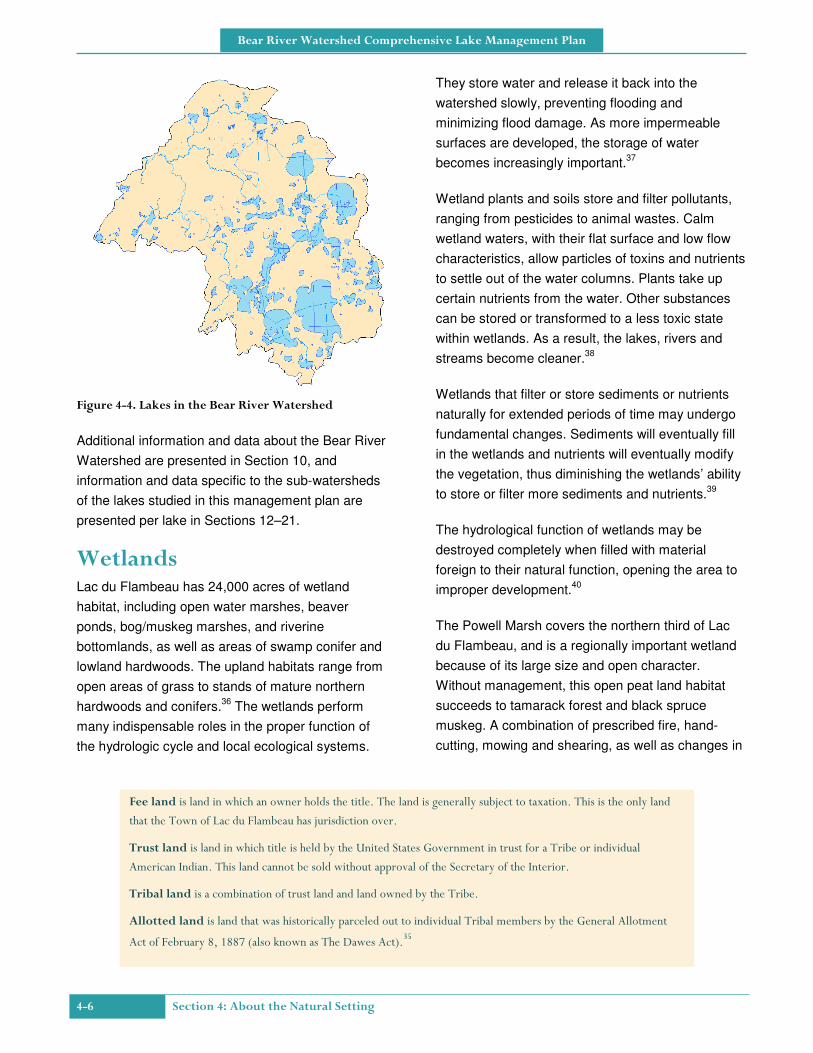
Figure 4-4. Lakes in the Bear River Watershed
Additional information and data about the Bear River
Watershed are presented in Section 10, and
information and data specific to the sub-watersheds
of the lakes studied in this management plan are
presented per lake in Sections 12–21.
Wetlands Lac du Flambeau has 24,000 acres of wetland
habitat, including open water marshes, beaver
ponds, bog/muskeg marshes, and riverine
bottomlands, as well as areas of swamp conifer and
lowland hardwoods. The upland habitats range from
open areas of grass to stands of mature northern
hardwoods and conifers.36
The wetlands perform
many indispensable roles in the proper function of
the hydrologic cycle and local ecological systems.
They store water and release it back into the
watershed slowly, preventing flooding and
minimizing flood damage. As more impermeable
surfaces are developed, the storage of water
becomes increasingly important.37
Wetland plants and soils store and filter pollutants,
ranging from pesticides to animal wastes. Calm
wetland waters, with their flat surface and low flow
characteristics, allow particles of toxins and nutrients
to settle out of the water columns. Plants take up
certain nutrients from the water. Other substances
can be stored or transformed to a less toxic state
within wetlands. As a result, the lakes, rivers and
streams become cleaner.38
Wetlands that filter or store sediments or nutrients
naturally for extended periods of time may undergo
fundamental changes. Sediments will eventually fill
in the wetlands and nutrients will eventually modify
the vegetation, thus diminishing the wetlands’ ability
to store or filter more sediments and nutrients.39
The hydrological function of wetlands may be
destroyed completely when filled with material
foreign to their natural function, opening the area to
improper development.40
The Powell Marsh covers the northern third of Lac
du Flambeau, and is a regionally important wetland
because of its large size and open character.
Without management, this open peat land habitat
succeeds to tamarack forest and black spruce
muskeg. A combination of prescribed fire, hand-
cutting, mowing and shearing, as well as changes in
Fee land is land in which an owner holds the title. The land is generally subject to taxation. This is the only land
that the Town of Lac du Flambeau has jurisdiction over.
Trust land is land in which title is held by the United States Government in trust for a Tribe or individual
American Indian. This land cannot be sold without approval of the Secretary of the Interior.
Tribal land is a combination of trust land and land owned by the Tribe.
Allotted land is land that was historically parceled out to individual Tribal members by the General Allotment
Act of February 8, 1887 (also known as The Dawes Act).35

Section 4: About the Natural Setting 4-7
Bear River Watershed Comprehensive Lake Management Plan
water levels is used to limit the growth of shrubs and
trees while increasing the abundance of grasses and
sedges. Control of woody species is the primary
required habitat manipulation for many wildlife
species. Flowages are managed with periodic
drawdowns.41
Metallic and Non-Metallic Mineral Resources There are several rock, sand, and other aggregate
mines throughout Lac du Flambeau that are often
referred to as “pits” or “quarries.” These sites
produce material such as sand or gravel, and can
vary in size from just a few acres of land to large
excavations covering hundreds of acres.42
Agricultural Areas The Northern Highlands Ecological Landscape has
an average growing season of 122 days. The cool
temperatures, short growing season, and sandy
soils are not adequate to support agricultural row
crops such as corn. Only about one percent of the
Northern Highland is used for agricultural
purposes.43
In Lac du Flambeau today, there are 137 acres of
cranberry bogs on a cranberry farm in the northeast
corner of Lac du Flambeau. Also, the Tribal
Department of Forestry has maintained strawberry
fields since 2001 as a cash crop on Tribal land.
Recently, the fields were diversified to include
blueberries, raspberries, and other crops.44
Woodlands About one-seventh of Lac du Flambeau lies in the
Chequamegon National Forest, where most of the
land is owned in trust by the U.S. Forest Service.
The remaining six-sevenths of Lac du Flambeau
constitute the Reservation of the Lac du Flambeau
Band of Lake Superior Chippewa Indians.45
Lac du Flambeau’s 41,733 acres of woodlands play
a key role in the protection of environmentally
sensitive areas like steep slopes, shorelands,
wetlands, and flood plains. Over the years, Lac du
Flambeau has regained much of the woodland cover
lost during the days of intense logging, although the
plant species composition is not the same now as
during pre-settlement times. Now, significant
amounts of aspen, paper birch, and balsam fir exist
where pine and hemlock once stood (Figure 4-5).46
Figure 4-5. Forest Cover Types for Lac du Flambeau Commercial Forests
Summary of Land Use Table 4-7 shows the land use within Lac du
Flambeau in 2007 as calculated from a geographic
information system (GIS) computer program. Tribal
land refers to land owned or managed by the Tribe.
It is separated from Land Use Types because the
Town and Tribe have separate jurisdictions. Tribal
land includes woodlands and forested wetlands –
about 16% of the water listed in the table – and most
of the land in downtown Lac du Flambeau.47
The majority of the Town is woodland and forested
wetland, at about 30,075 acres or 37 percent of the
whole town. Both woodlands and forested wetlands
are listed together in the table. The next most
significant land use type is water, approximately 22
percent or 17,632 acres. Open Lands consist of
fields and non-forested wetlands, and cover about
1,390 acres (1.7%). Residential land covers about
1,842 acres (2.25%). Transportation land use
includes all the roads in Town, and amounts to
about 590 acres (0.7%). All other land uses listed
amount to less than 100 acres for each land use.48

4-8 Section 4: About the Natural Setting
Bear River Watershed Comprehensive Lake Management Plan
Table 4-7. Lac du Flambeau Land Uses in 2007
Land Use Type Acres Percent
Agriculture 151 0.18%
Commercial 69 0.08%
Government/Institution 19 0.02%
Industrial 96 0.12%
Open Lands 1,390 1.70%
Outdoor Recreation 2 0.00%
Residential 1,842 2.25%
Resort 79 0.10%
Transportation 590 0.72%
Tribal 29,862 36.50%
Water 17,632 21.55%
Woodlands 30,075 36.76%
Total 81,808 100.00%
Table 4-8 projects land use within Lac du Flambeau
by 2028 as determined by members on the Lac du
Flambeau Zoning Committee in 2007.49
Table 4-8. Projected Land Use, 2028
Land Use Type Acres Percent
Commercial 2,582 3.16
Government/Institution 166 0.20
Industrial 221 0.27
Residential 9,827 12.01
Transportation 590 0.72
Tribal 29,862 36.50
Water 17,632 21.55
Woodlands 20,929 25.58
Total 81,808 100.00
The Lac du Flambeau Indian Reservation covers
approximately 86,500 acres (135 square miles) that
include 41,733 acres of forested uplands, 24,000
acres of wetlands, and 17,897 acres of lakes and
rivers (Figure 4-6). That means approximately 49%
of the Reservation’s area is covered by lakes, rivers,
and wetlands.50
Figure 4-6. Land Cover on the Lac du Flambeau Indian Reservation
Habitat and Wildlife Types Habitat on the Reservation is similar to that of
adjoining properties and much of the rest of northern
Wisconsin. These lands, while relatively intact, are
feeling the pressures of habitat fragmentation on
many differing scales. Examples of habitat
fragmentation include commercial and residential
development associated with an ever increasing
human population in the Northwoods. Habitat
fragmentation affects the species richness of natural
communities, population trends of some species,
and the overall biological diversity of ecosystems.
Whether the effects of habitat fragmentation are
found to be beneficial or detrimental depends largely
on the desired species composition and abundance
for any given area.51
Although extensive inventories of forest tree species
have been conducted, there has been little work
done on the understory of vegetative communities,
and thus specific habitat types. Because of this, the
finer scale effects of habitat fragmentation are
largely unknown. Most of northern Wisconsin’s and
the Reservation’s wildlife species are able to
traverse and occupy a wide variety of habitats and
cover types. Examples of exceptions include some
neotropical migratory songbirds species, Pine
Martens (a threatened species in Wisconsin), and
local populations of salamanders to which
chemically-treated forest roads can become fatal
obstacles during migration.52

Section 4: About the Natural Setting 4-9
Bear River Watershed Comprehensive Lake Management Plan
Often the public and natural resource managers think
of fragmentation strictly as breaks or clearings
(particularly those caused by timber harvests) in the
forest canopy. However, forms of habitat fragment-
ation that affect wildlife more severely include housing
developments, parking lots, business developments,
and other types of human infrastructure that do little
to provide food and cover, and where wildlife
species are easily depredated. Wetlands, lakes,
rivers, and streams naturally are interconnected in
the landscape mosaic. Buffering of waterfront habitat
by limiting human disturbance and development is
important to providing corridors and linkage zones
through otherwise fragmented areas. Upland and
off-water corridors are harder to protect and take
planning and careful management. The Reservation
has a nature reserve system in place consisting
mainly of wetland habitats with other upland types of
habitats represented. Planned wildlife corridors are
in essence nonexistent on the reservation.53
Wildlife management on the reservation is primarily
restricted to the game species traditionally harvested.
During the spring but before leaf-out (green-up), deer,
hare, and grouse-roost surveys are conducted and
recorded for 50 transects. The following graphs depict
the status of the Whitetailed Deer, Grouse, Snowshoe
Hare, and Black Bear populations.54
Based on the spring wildlife survey, the 2012 deer
population on the reservation equaled 3.39
deer/square mile, a decrease from 2010 and 2011
(Figure 4-7). The Reservation’s deer management
goal is 13 deer per square mile.55
In the Grouse-Roost Surveys (Figure 4-8), the
results of the data collected are reported as the
number of grouse roosts per transect, and indicate a
population trend rather than an estimate. The grouse
population peaked in 1989 (0.82 grouse roosts per
transect), declining annually thereafter. Grouse
populations usually fluctuate in 10-year cycles, and it
was anticipated that a general increase in the
population would begin in 1999 (sampling data are
not available for that time period).56
Figure 4-7. Deer Density Survey Results for 1984–2012
Figure 4-8. Grouse Roost Survey Results for 1984–2006
The Snowshoe Hare Index (Figure 4-9) shows a
typical fluctuating population over time. Although
many factors play a role in hare population
abundance, predators and early spring weather
have the greatest effect on the annual population
trends.57
Figure 4-9. Snowshoe Hare Index for 250 Plots in 2012
0
0.1
0.2
0.3
0.4
0.5
0.6
0.7
0.8
0.9
Gro
us
e R
oo
st/
Tra
ns
ec
t
1984 1986 1988 1990 1993 2002 2004 2006
Year

4-10 Section 4: About the Natural Setting
Bear River Watershed Comprehensive Lake Management Plan
In late June to early July, Tribal Natural Resource
staff members conduct the annual Bear Bait Station
Survey (Figure 4-10). Fifty randomly selected
stations are baited with beef and staff members
return two weeks later to determine the number of
bear hits.
Figure 4-10. Bear Station Survey Data for 1986–2012
The survey is an index, not a population estimate,
and provides only general trend information on the
bear population. In 1992, bears hit only 4% of the
bait stations. In 2002, 46% of the bear bait stations
were hit. In 2012, 50% of the stations were hit, the
highest percent in more than two decades of
surveying. Since 2002, the bear population has been
relatively high. This trend is further substantiated by
the number of bear complaints the Tribal
Conservation Law Enforcement Department has
received during this time.58
Natural Heritage Inventory Wisconsin participates in the Natural Heritage
Inventory (NHI), which is part of an international
network of programs focusing on rare plants and
animals, natural communities, and other rare
elements of nature. The defining and unifying
characteristic of this network is the use of a standard
methodology for collecting, processing, and
managing data on the occurrences of natural
biological diversity.59
The Wisconsin natural heritage working list contains
species known or suspected to be rare in the state,
along with natural communities native to Wisconsin.
It includes species legally designated as
“endangered” or “threatened,” as well as species in
the advisory “special concern” category. Most of the
species and natural communities on the list are
actively tracked.60
Table 4-9 shows the species on
Wisconsin’s working list that are in Lac du
Flambeau.61
Table 4-9. Wisconsin Natural Heritage Inventory Data for Lac du Flambeau Lake Areas
Lake* BC FE FL IW LC LT LI MO PO WS
Within 2 Mile Buffer
Fairy Slipper T
T
T
T
T
Wood Turtle T T T
T
T T T T
Bald Eagle SC SC SC SC SC SC SC SC SC SC
Pugnose Shiner
T
T
Greater Redhorse
T
T
Longear Sunfish
T
T
Least Darter
SC
SC
Yellow Rail
T
Le Conte’s Sparrow
SC
Around the Lake
Bald Eagle SC SC
SC
SC SC
SC SC
Wood Turtle T T
T
T T T
T – Threatened SC – Special Concern
*Lakes BC - Big Crawling Stone FE – Fence
FL – Flambeau IW - Ike Walton LC - Little Crawling Stone
LT - Little Trout LI - Long Interlaken MO - Moss
PO - Pokegama WS - White Sand

Section 4: About the Natural Setting 4-11
Bear River Watershed Comprehensive Lake Management Plan
Community Survey The process used to prepare the Bear River
Watershed Comprehensive Lake Management Plan
included mailing a survey to 3,000 households in
Lac du Flambeau. The survey posed questions
about residents’ perceptions of the quality of lake
water, fisheries, and overall environment; current
and ideal shoreline landscaping; interests on
attending a variety of workshops; and knowledge of
aquatic invasive species and aquatic plants. The
survey also included a couple of questions about the
natural setting.62
Almost one-third (996 of 3,000) of the surveys were
returned completed, representing fifty-one lakes. Of
the 996 completed surveys, 576 (57.8%) are from
households affiliated with the ten lakes of focus in
the Bear River Watershed Comprehensive Lake
Management Plan.
The respondents were presented with a list of
issues/items and then asked to identify up to three
that concern them the most. Table 4-10 shows their
responses to the question.
The column to the far right (BR-576) presents the
total numbers and percentages for all ten lakes.
Regarding algae blooms, for example, 96 of 576
(16.7%) respondents believe that algae blooms are
a major concern to them.
A review of the BR-576 column reveals that the
three issues of most concern include Aquatic
Invasive Species (41.70%), Water Quality
Degradation (27.4%), and Loss of Fish Habitat
Table 4-10. Survey Results on the Issues of Most Concern to Lac du Flambeau Residents
Lake* and Number of Respondents to Survey CS-96 LT-3 FE-123 LI-31 FL-54 M-27 IW-23 WS-102 LC-34 PK-83 BR-576
Number (#) & Percent (%) of Respondents to Item # % # % # % # % # % # % # % # % # % # % # %
Item / Concerns
Algae Blooms 13 13.50% 1 33.30% 22 17.90% 5 16.10% 10 18.50% 7 25.90% 3 13% 18 17.60% 6 17.60% 11 13.30% 96 16.70%
Light Pollution 3 3.10% 0 0% 11 8.90% 3 9.70% 9 16.70% 5 18.50% 1 4.3% 9 8.80% 5 14.70% 11 13.30% 57 9.90%
Shoreline Runoff 12 12.50% 1 33.30% 17 13.80% 4 12.90% 8 14.80% 3 11.10% 1 4.30% 18 17.60% 4 11.80% 15 18.10% 83 14.40%
AIS 42 43.80% 2 66.70% 54 43.90% 11 35.50% 13 24.10% 13 48.10% 7 30.40% 46 45.10% 14 41.20% 38 45.80% 240 41.70%
Loss of Fish Habitat 22 22.90% 2 66.60% 29 23.60% 11 35.5% 12 22.20% 9 33.30% 6 26.10% 25 24.50% 8 23.50% 20 24.10% 144 25%
Water Quality Degradation 23 24% 2 66.70% 35 28.50% 9 29.00% 14 25.90% 9 33.30% 4 17.40% 26 25.50% 13 38.20% 23 27.70% 158 27.40%
Boat Traffic 18 18.80% 1 33.30% 18 14.60% 3 9.70% 9 16.70% 3 11.10% 1 4.30% 15 14.70% 14 41.20% 11 13.30% 93 16.10%
Loss of Shoreline 11 11.50% 1 33.30% 11 8.90% 6 19.40% 10 18.50% 3 11.10% 0 0% 12 11.80% 6 17.60% 12 14.50% 72 12.50%
Septic Discharge 16 16.70% 0 0% 25 20.30% 2 6.50% 7 13% 5 18.50% 2 8.70% 21 20.60% 9 26.50% 15 18.10% 102 17.70%
Degradation of Native Aquatic Plants
7 7.30% 1 33.30% 15 12.20% 3 9.70% 9 16.70% 5 18.50% 5 21.70% 9 8.80% 3 8.80% 8 9.60% 65 11.30%
Loss of Wildlife Habitat 3 13.50% 0 0% 16 13% 2 6.50% 1 1.90% 5 18.50% 5 21.70% 8 7.80% 0 0% 6 7.20% 56 9.70%
Excessive Aquatic Plant Growth
9 9.40% 1 33.30% 8 6.50% 3 9.70% 11 20.40% 4 14.80% 2 8.70% 11 10.80% 6 17.60% 12 14.40% 67 11.60%
Noise Pollution 4 4.20% 0 0% 4 3.30% 1 3.20% 8 14.80% 0 0% 1 4.30% 5 4.90% 4 11.80% 6 7.20% 33 5.70%
Shoreline Development 11 11.50% 0 0% 12 9.80% 4 12.90% 7 13% 2 7.40% 4 17.40% 14 13.70% 6 17.60% 14 16.90% 74 12.80%
Excessive Fishing Pressure
7 7.30% 1 33.30% 16 13% 2 6.50% 9 16.70% 2 7.40% 2 8.70% 15 14.70% 4 11.80% 12 14.40% 70 12.20%
Shoreline Erosion 17 17.70% 1 33.30% 17 13.80% 3 9.70% 10 18.50% 3 11.10% 4 17.40% 24 23.50% 7 20.60% 16 19.30% 102 17.70%
Other 12 12.50% 1 33.30% 26 21.10% 5 16.10% 10 18.50% 2 7.40% 1 4.30% 14 13.70% 10 29.40% 14 16.90% 95 16.50%
Not Concerned of any Issues
13 13.50% 0 0% 19 15.40% 6 19.40% 8 14.80% 12 44.40% 4 17.40% 17 16.70% 3 8.80% 14 16.90% 96 16.70%
*Lakes CS – Crawling Stone LT – Little Trout
FE – Fence LI – Long Interlaken FL – Flambeau
M – Moss IW – Ike Walton WS – White Sand
LC – Little Crawling Stone PK – Pokegama BR – Totals Bear River
4-12 Section 4: About the Natural Setting
Bear River Watershed Comprehensive Lake Management Plan
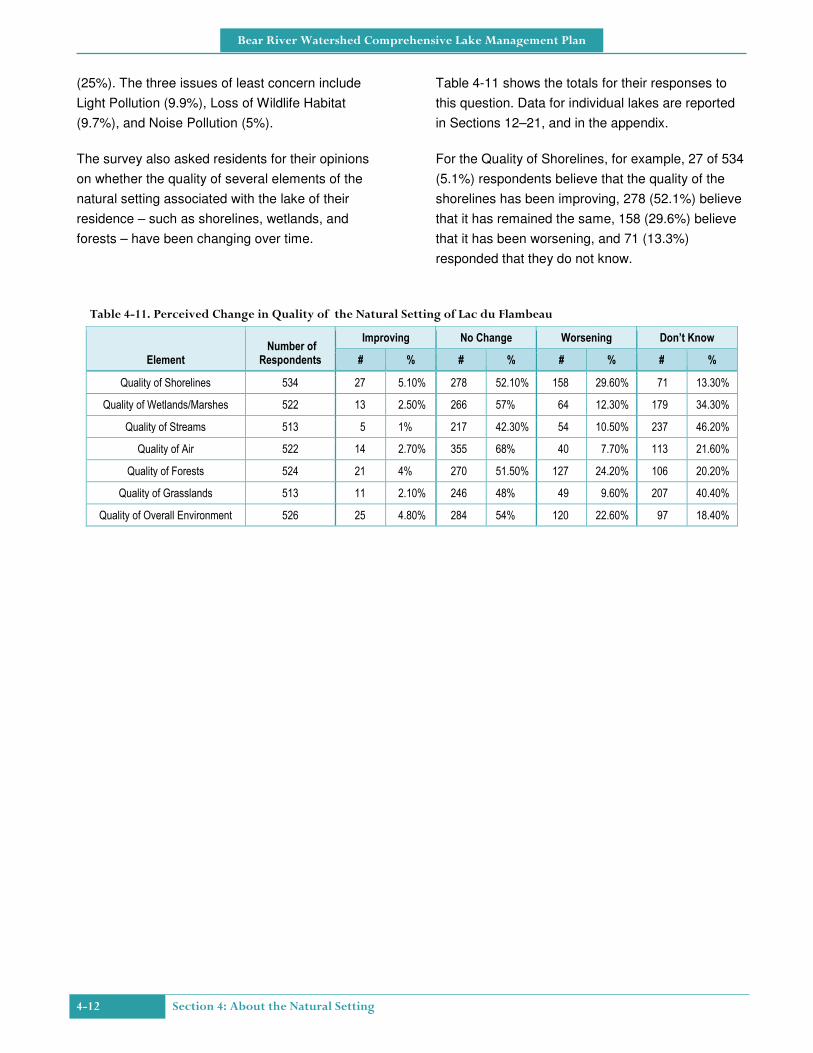
(25%). The three issues of least concern include
Light Pollution (9.9%), Loss of Wildlife Habitat
(9.7%), and Noise Pollution (5%).
The survey also asked residents for their opinions
on whether the quality of several elements of the
natural setting associated with the lake of their
residence – such as shorelines, wetlands, and
forests – have been changing over time.
Table 4-11 shows the totals for their responses to
this question. Data for individual lakes are reported
in Sections 12–21, and in the appendix.
For the Quality of Shorelines, for example, 27 of 534
(5.1%) respondents believe that the quality of the
shorelines has been improving, 278 (52.1%) believe
that it has remained the same, 158 (29.6%) believe
that it has been worsening, and 71 (13.3%)
responded that they do not know.
Table 4-11. Perceived Change in Quality of the Natural Setting of Lac du Flambeau
Element Number of Respondents
Improving No Change Worsening Don’t Know
# % # % # % # %
Quality of Shorelines 534 27 5.10% 278 52.10% 158 29.60% 71 13.30%
Quality of Wetlands/Marshes 522 13 2.50% 266 57% 64 12.30% 179 34.30%
Quality of Streams 513 5 1% 217 42.30% 54 10.50% 237 46.20%
Quality of Air 522 14 2.70% 355 68% 40 7.70% 113 21.60%
Quality of Forests 524 21 4% 270 51.50% 127 24.20% 106 20.20%
Quality of Grasslands 513 11 2.10% 246 48% 49 9.60% 207 40.40%
Quality of Overall Environment 526 25 4.80% 284 54% 120 22.60% 97 18.40%
Section 4: About the Natural Setting 4-13
Bear River Watershed Comprehensive Lake Management Plan
Notes for Section 4 1. Wayne Grady, The Great Lakes: The Natural History of a
Changing Region (Greystone Books, 2007) 39.
2. Ibid, 77.
3. Dan Styer, The Quotable John Muir. Dan Styer has written an interesting piece on how he has determined that the quotation is in fact attributable to John Muir, the famous American naturalist.
http://www.oberlin.edu/physics/dstyer/Muir/QuotableJohnMuir.html.
4. Henry David Thoreau (as presented in the National Lakes Assessment: A Collaborative Survey of the Nation’s Lakes (U.S. Environmental Protection Agency, 2009) viii.
http://www.epa.gov/owow/LAKES/lakessurvey/pdf/nla_report_low_res.pdf. Also in Through the Looking Glass: A Field Guide to Aquatic Plants, Wisconsin Lakes Partnership, 109.
5. Wisconsin Department of Natural Resources online:
http://dnr.wi.gov/topic/landscapes/index.asp.
6. Grady, 42-43.
7. Ibid, 45.
8. Ibid, 64.
9. Ibid.
10. Ibid.
11. Ibid, 69.
12. Ibid, 71.
13. Wisconsin Department of Natural Resources online:
http://dnr.wi.gov/topic/landscapes/index.asp.
14. Maps and information related to EPA management unit eco-regions may be found at:
ftp://ftp.epa.gov/wed/ecoregions/us/Eco_Level_IV_US.pdf; ftp://ftp.epa.gov/wed/ecoregions/wi/wi_eco.pdf
15. Wisconsin Department of Natural Resources online:
http://dnr.wi.gov/topic/landscapes/index.asp?mode=detail&landscape=5.
16. Ibid.
17. Ibid.
18. Ibid.
19. Integrated Resource Management Plan, 2000-2023 (IRMP)( Lac du Flambeau Band of lake Superior Chippewa Indians) 2:2.
20. Wisconsin Department of Natural Resources online.
http://dnr.wi.gov/topic/landscapes/index.asp?mode=detail&landscape=5.
21. Wisconsin Department of Natural Resources online.
http://dnr.wi.gov/topic/landscapes/index.asp?mode=detail&landscape=5.
22. Robert G. Wetzel, Limnology, Lake and River Ecosystems (Academic Press, Third Edition, 2001) 18.
23. Integrated Resource Management Plan, 4:3.
24. Ibid.
25. Ibid.
26. Wisconsin Department of Natural Resources online:
http://dnr.wi.gov/water/watersheddetail.aspx?code=uw38&name=upper%tomahawk%river20river
27. Integrated Resource Management Plan, 4:7.
28. Wisconsin Department of Natural Resources online:
http://dnr.wi.gov/water/watersheddetail.aspx?code=uc10&name=upper%20south%20fork%20flambeau%20river
29. Tribal Plan, 4:7.
30. Wisconsin Department of Natural Resources online:
http://dnr.wi.gov/water/watersheddetail.aspx?code=uc16&name=manitowish%20river
31. Integrated Resource Management Plan, 4:6.
32. Wisconsin Department of Natural Resources online:
http://dnr.wi.gov/water/watersheddetail.aspx?code=uc15&name=bear%20river
33. Ibid.
34. Integrated Resource Management Plan, 4:6.
35. Town of Lac du Flambeau Comprehensive Management Plan, Adopted December 2008 (Prepared by the North Central Wisconsin Regional Planning Commission) 61-62. The plan is available online at
http://www.ncwrpc.org/counties/vilas/LDF_Adopted-Plan_OnWeb.pdf.
36. Integrated Resource Management Plan, 2:2.
37. Town of Lac du Flambeau Comprehensive Management Plan, 40.
38. Ibid.
39. Ibid.
40. Ibid.
41. Ibid.
42. Ibid, 45.
43. Wisconsin Department of Natural Resources online.
http://dnr.wi.gov/topic/landscapes/index.asp?mode=detail&landscape=5.
44. Town of Lac du Flambeau Comprehensive Management Plan, 49.
45. Ibid, 61.
46. Ibid, 42.
47. Ibid, 62.
48. Ibid.
49. Ibid, 68.
50. Integrated Resource Management Plan, 2:2.
51. Ibid, 6:1. Information for notes 51-58 is from two sources: Integrated Resource Management Plan (Lac du Flambeau Band of Lake Superior Chippewa Indians), 6:1-6:6 and, Final Reports Contract Number CTF55T432F8 (Lac du Flambeau Band of Lake Superior Indians, 10/1/10-9/20/12) 14-16.
52. Ibid.
53. Ibid.
54. Ibid: 6:2.
55. Ibid.
56. Ibid, 6:4.
57. Ibid.
58. Ibid, 6:5-6:6.
59. Wisconsin Natural Heritage Inventory, http://dnr.wi.gov/topic/NHI/WList.html.
60. Ibid.
61. Information on the table was provided by the Wisconsin Department of Natural Resources, Woodruff office.
62. Data from the Bear River Watershed Comprehensive Lake Management Plan Survey, Lake-by-lake Comparisons, June 2012. See Appendix.

4-14 Section 4: About the Natural Setting
Bear River Watershed Comprehensive Lake Management Plan
Figure Notes for Section 4 Figure 4-1. Ecological Landscapes in Wisconsin. http://dnr.wi.gov/topic/landscapes/documents/State Maps/Map_S1_ELs.pdf
Figure 4-2. Boundaries Negotiated by Tribal Chiefs in 1837 and 1842. Great Lakes Indian Fish and Wildlife Commission, http://www.glifwc.org/
Figure 4-3. Overlay of Lac du Flambeau on Watersheds. Map provided by the Tribal Natural Resources Department.
Figure 4-4. Lakes in the Bear River Watershed. Map provided by Tribal Natural Resources Department. Other maps available through the Wisconsin Department of Natural Resources: http://dnr.wi.gov/water/watersheddetail.aspx?code= uc15&name=bear%20river
Figure 4-5. Forest Cover Types for Lac du Flambeau Commercial Forests. Integrated Resource Management Plan (Lac du Flambeau Band of Lake Superior Chippewa Indians) 3:1.
Figure 4-6. Land Cover on the Lac du Flambeau Indian Reservation. Integrated Resource Management Plan (Lac du Flambeau Band of Lake Superior Chippewa Indians) 2:3.
Figure 4-7. Deer Density Survey Results for 1984-2012. FY2011 & 2012 Final Reports Contract Number CTF55T432F8 (Lac du Flambeau Band of Lake Superior Chippewa Indians) 15.
Figure 4-8. Grouse Roost Survey Results for 1984-2006. FY2011 & 2012 Final Reports Contract Number CTF55T432F8 (Lac du Flambeau Band of Lake Superior Chippewa Indians) 16.
Figure 4-9. Snowshoe Hare Index for 250 Plots in 2012. FY2011 & 2012 Final Reports Contract Number CTF55T432F8 (Lac du Flambeau Band of Lake Superior Chippewa Indians) 15.
Figure 4-10. Bear Station Survey Data for 1986-2012. FY2011 & 2012 Final Reports Contract Number CTF55T432F8 (Lac du Flambeau Band of Lake Superior Chippewa Indians) 16.
Table Notes for Section 4 Table 4-1. Summary Data on Area Watersheds The table is a summary of data from Tables 3-6.
Table 4-2. Watersheds as Characterized by USGS. Integrated Resource Management Plan, 2000-2023 (Lac du Flambeau Band of Lake Superior Chippewa Indians) 4:3.
Table 4-3. Upper Tomahawk River Watershed. Wisconsin Department of Natural Resources online: http://dnr.wi.gov/water/watersheddetail.aspx?code= uw38&name=upper%20tomahawk%20river
Table 4-4. Upper South Fork Flambeau River Watershed. Wisconsin Department of Natural Resources online: http://dnr.wi.gov/water/watersheddetail.aspx?code= uc10&name=upper%20south%20fork%20flambeau %20river
Table 4-5. Manitowish River Watershed. Wisconsin Department of Natural Resources online: http://dnr.wi.gov/water/watersheddetail.aspx?code= uc16&name=manitowish%20river
Table 4-6. Bear River Watershed. Wisconsin Department of Natural Resources online: http://dnr.wi.gov/water/watersheddetail.aspx?code= uc15&name=bear%20river
Table 4-7. Lac du Flambeau Land Uses, 2007. (Town of Lac du Flambeau Comprehensive Plan, December 2012) 62. http://www.ncwrpc.org/counties/vilas/LDF_Adopted- Plan_OnWeb.pdf.
Table 4-8. Projected Land Uses, 2028. (Town of Lac du Flambeau Comprehensive Plan, December 2012) 68. http://www.ncwrpc.org/counties/vilas/LDF_Adopted- Plan_OnWeb.pdf.
Table 4-9. Wisconsin Natural Heritage Inventory Data for Lac du Flambeau lake Areas. Information on the table was provided by the Wisconsin Department of Natural Resources, Woodruff office.
Table 4-10. Survey Results on Issues of Most Concern to Lac du Flambeau resiudents. Data from Bear River Watershed Comprehensive Lake Management Plan Survey, Lake-by-lake Comparisons, June 2012, Question #31. See Appendix.
Table 4-11. Perceived Change in Quality of Natural Setting. Data from Bear River Watershed Comprehensive Lake Management Plan Survey, Lake-by-lake Comparisons, June 2012, Question #32. See Appendix.
Figures Figure 4-1. Ecological Landscapes in Wisconsin ............... 4-2
Figure 4-2. Boundaries Negotiated by Tribal Chiefs in 1837 and 1842 ....................................................... 4-2
Figure 4-3. Overlay of Lac du Flambeau on Watersheds ............................................................ 4-4
Figure 4-4. Lakes in the Bear River Watershed ................. 4-6
Figure 4-5. Forest Cover Types for Lac du Flambeau Commercial Forests ............................................... 4-7
Figure 4-6. Land Cover on the Lac du Flambeau Indian Reservation ............................................................ 4-8
Figure 4-7. Deer Density Survey Results for 1984–2012 ....................................................................... 4-9
Figure 4-8. Grouse Roost Survey Results for 1984–2006 ....................................................................... 4-9
Figure 4-9. Snowshoe Hare Index for 250 Plots in 2012 .... 4-9
Figure 4-10. Bear Station Survey Data for 1986–2012 .... 4-10
Tables Table 4-1. Summary Data on Area Watersheds ................ 4-4
Table 4-2. Watersheds as Characterized by USGS ........... 4-4
Table 4-3. Upper Tomahawk River Watershed .................. 4-4
Table 4-4. Upper South Fork Flambeau River Watershed ............................................................. 4-5
Table 4-5. Manitowish River Watershed ............................ 4-5
Table 4-6. Bear River Watershed ...................................... 4-5
Table 4-7. Lac du Flambeau Land Uses in 2007 ............... 4-8
Table 4-8. Projected Land Use, 2028 ................................ 4-8
Section 4: About the Natural Setting 4-15
Bear River Watershed Comprehensive Lake Management Plan
Table 4-9. Wisconsin Natural Heritage Inventory Data for Lac du Flambeau Lake Areas ......................... 4-10
Table 4-10. Survey Results on the Issues of Most Concern to Lac du Flambeau Residents .............. 4-11
Table 4-11. Perceived Change in Quality of the Natural Setting of Lac du Flambeau .................... 4-12