About the lessons - Esri Supportdownloads2.esri.com/ESRIpress/images/136/OW1TB_sample.pdf · 2008....
60
1 Introduction About the lessons Thinking Spatially Using GIS is a book of computer activities, data, and resources that can help introduce students at young ages to mapping concepts, GIS, geography, and other relevant topics. Because the lessons cover topics that you are already teaching in social studies, geography, history, life science, and earth science, we think you’ll find it to be a valuable supplement to your cur- rent textbook or curriculum. We’ve designed these lessons to help your students get excited about exploring the world around them while stepping into the world of contemporary computing and the smart maps of geographic information systems. The book comes with a copy of ArcExplorer Java Edition for Education (AEJEE) GIS software. Students will use this software to work through the lessons. This means that your students will be learning to use GIS tools that are similar to those being used by professionals around the world. And they will be using tools that they are increasingly likely to encounter in the future, whether it is in middle or high school, college or technical school, or as a citizen on the Internet. Where to begin Before you start using the book in class, we recommend that you do the following: 1. Finish reading this section and skim through this book and the student workbook to locate teacher and student materials. 2. Install the teacher resources, AEJEE software, and lesson data on your computer. (Besides being there for your own use, this can serve as a backup of the lesson data and teacher resources in case the disk is misplaced.) 3. Work through all of the lessons yourself. 4. Choose the lessons that you would like to present to your students. 5. Read the “Teaching the lesson” section of the teacher materials for ideas on how to present the lessons you choose. 6. Install the AEJEE software and lesson data on student computers. (Refer to “Setting up the software and data” later in the next section, and the detailed software and data installation guide at the back of the book.) 7. Work through the lessons of choice with your students.
Transcript of About the lessons - Esri Supportdownloads2.esri.com/ESRIpress/images/136/OW1TB_sample.pdf · 2008....

1
IntroductionAbout the lessonsThinking Spatially Using GIS is a book of computer activities, data, and resources that can help introduce students at young ages to mapping concepts, GIS, geography, and other relevant topics. Because the lessons cover topics that you are already teaching in social studies, geography, history, life science, and earth science, we think you’ll find it to be a valuable supplement to your cur-rent textbook or curriculum. We’ve designed these lessons to help your students get excited about exploring the world around them while stepping into the world of contemporary computing and the smart maps of geographic information systems.
The book comes with a copy of ArcExplorer Java Edition for Education (AEJEE) GIS software. Students will use this software to work through the lessons. This means that your students will be learning to use GIS tools that are similar to those being used by professionals around the world. And they will be using tools that they are increasingly likely to encounter in the future, whether it is in middle or high school, college or technical school, or as a citizen on the Internet.
Where to beginBefore you start using the book in class, we recommend that you do the following:
1. Finish reading this section and skim through this book and the student workbook to locate teacher and student materials.
2. Install the teacher resources, AEJEE software, and lesson data on your computer. (Besides being there for your own use, this can serve as a backup of the lesson data and teacher resources in case the disk is misplaced.)
3. Work through all of the lessons yourself. 4. Choose the lessons that you would like to present to your students.5. Read the “Teaching the lesson” section of the teacher materials for ideas on how to present the
lessons you choose. 6. Install the AEJEE software and lesson data on student computers. (Refer to “Setting up the
software and data” later in the next section, and the detailed software and data installation guide at the back of the book.)
7. Work through the lessons of choice with your students.

2
Our World GIS Education: Thinking Spatially Using GIS
ModulesThe modules in this book present spatial thinking concepts. Each module has a theme on spatial thinking. In module 1, the theme is location — of places (absolute and relative) and the characteris-tics of locations. In module 2, the theme is classification — making sense of the world by organizing the things in it into categories and quantities. In module 3, the theme is movement and patterns — the migration of humans and the patterns that result. In module 4, the theme is analyzing change — over space (spatial analysis) and over time.
While all of the modules are designed to be appropriate for elementary school, some are more appropriate for certain grades.
Module Appropriate grade levels
1 3rd through 6th grade
2 4th through 6th grade
3 5th through 6th grade
4 4th through 6th grade
You can teach each module independently of the others, and you should tailor the material to suit the specific needs of your class and curriculum. Each module consists of two or three lessons. Within some modules, the lessons build on each other. This is true in modules 1 and 2, while the lessons in modules 3 and 4 can be presented independently of one another.
Module Recommended order
1 Lessons 1 and 2 should be presented in order.
2 Lessons 1, 2, and 3 should be presented in order.
3 Lessons 1 and 2 can be presented independently.
4 Lessons 1 and 2 can be presented independently.
You may also choose to present only one lesson within a module.
Prerequisite skills Students are expected to have basic computer skills such as using a mouse, highlighting text, and moving and closing windows. For a guide on preparing students to work with AEJEE software, refer to “Preparing students to work with AEJEE software” in the next section.
Prerequisite knowledgeStudents will get more out of the lessons if they have some of the prerequisite knowledge. The “Introducing the lesson” section of the teacher materials for each lesson has suggestions on what to review before students work through the GIS activities. For example, before working through the first GIS activity in module 1, students would benefit from understanding the major lines of lati-tude and longitude (e.g., equator, prime meridian, Tropic of Cancer, Arctic Circle) and how they divide the world into hemispheres and zones or regions (e.g., tropics).

3
Introduction
How the materials are organizedThis book contains teacher materials for each lesson, including the following:
• A lesson overview, including estimated time and list of materials for the lesson, objectives, a list of the GIS tools and functions encountered in the activity, and a list of national geography standards related to the lesson.
• Notes about teaching the lesson, including suggestions for introducing the lesson, teacher tips on how to conduct the GIS activity, things to look for while students are working, and how to conclude the lesson. Ideas for extending the lesson are listed as well.
• A list of Web sites with information related to the lesson. • Student activities and worksheets with answers.
The accompanying student workbook contains GIS activities, worksheets, and handouts.
Options for providing these materials to your students include ordering copies of the student workbook, photocopying the student workbook pages, or printing out the student workbook pages from the files on the CD.
The software, data, and resources CD has three separate installations: the AEJEE software, a student data folder, and a teacher resources folder.
The teacher resources folder (OurWorld1_teacher) includes the following:
• Digital documents (PDF format) of the student activities, worksheets, and handouts required by the lessons.
• Digital documents (PDF format) of some of the teacher materials in this book, such as lesson overviews, teacher notes, and student activities with answers.
The AEJEE software can be installed on Windows or Macintosh computers. (Refer to the section, “About the software and data.”)
The student data folder (OurWorld1) includes the data that students will access and view with the AEJEE software. This folder needs to be installed on each student computer after the AEJEE software is installed. Inside the OurWorld1 folder, the data is organized by module.
Curriculum standards Each lesson teaches skills corresponding to National Geography Standards (Geography for Life: The National Geography Standards, 1994). The applicable standards for elementary school (grades K-4) and middle school (grades 5-8) are listed in each lesson overview. Matrices matching all lessons in the book to the National Geography Standards and to the National Technology Standards are also provided (see table of contents).
The companion Web siteThe book’s Web site, www.esri.com/ourworldgiseducation, places a variety of GIS resources and other helpful information at your fingertips. For example, you’ll want to check the Web site’s “Resources by Module” section for specific resources, Web links, or changes when you get ready to use a particular lesson. Solutions to common problems and any significant changes or corrections to the book will also be posted here.

4
Our World GIS Education: Thinking Spatially Using GIS
Taking it furtherAfter your students have completed the lessons you selected, you can do the following:
• Challenge the students further in the “Extending the lesson” part of the teacher notes.• Challenge them with another AEJEE-based lesson that you download from ArcLessons on the
ESRI website: www.esri.com/arclessons.• Have them put together a profile of your community and post it on the ESRI Community Atlas
Web site: www.esri.com/communityatlas. Your school may be able to earn software through this program.
• Find out who’s doing what with GIS near you and contact them for ideas. The following resources and suggestions can help:
• ESRIGISEducationCommunity,http://edcommunity.esri.com• ESRIEducationUserConference,www.esri.com/educ.• GISDayWebsite,www.gisday.com• GIS.comWebsite,www.gis.com• InviteaGISspecialistfromyourcitygovernmentorotherlocalorganizationtodoapresenta-
tion on GIS for your class.• Challenge5thor6thgradestudentswithlessonsfromlevel2intheOur World GIS Education
series: Mapping Our World Using GIS. This book comes with a 365-day trial version of ArcGIS Desktop software (ArcView license). You may want to check with your district or state tech-nology coordinator to find out if a district-wide or statewide software license already covers your school.

5
Introduction
About the software and data
ArcExplorer Java Edition for Education softwareThe lessons in this book use ArcExplorer Java Edition for Education (AEJEE) software. AEJEE is free software from ESRI that is provided on the CD at the back of this book. The software is also available for download from http://edcommunity.esri.com. AEJEE can be used to display and visu-alize geographic data, perform basic GIS analysis, and create basic map layouts for printing.
Setting up the software and dataThis book comes with a CD that contains AEJEE software for Macintosh or Microsoft Windows computers, as well as the data, student activities, and other documents required for the lessons. Refer to the installation guides at the back of the book for detailed system requirements and instructions on how to install the software, data, and resources. A copy of the data license agreement is also found at the back of the book.
Note: It is important that you install the AEJEE software before installing the data, since the data will be installed in one of the AEJEE folders.

6
Our World GIS Education: Thinking Spatially Using GIS
If you do not feel comfortable installing programs on your computer or your students’ computers, please be sure to ask your school’s technology specialist for assistance. The software and data on the disk needs to be installed on your computer and all computers that the students will use to com-plete the GIS activities. The teacher resources should be installed on your computer, not on the student computers.
Desktop shortcut. Consider creating an AEJEE shortcut icon on the desktop of each student’s computer so that students can quickly locate and start the AEJEE program. (Refer to page 256 and 266 for instructions on how to create a shortcut on a Windows-based and Macintosh computer, respectively.)
Student work folders. The activity instructions advise students to ask their teacher how and where to save their work. It is a good idea to have students save their work to a student folder. This way the original data is unaltered and can be used by multiple students. See the “Teacher notes” section of individual lessons for more information.
Moving or deleting data. The installation program installs the data for all modules. If for some reason you decide to remove part of the data, be sure to keep entire module folders intact. For example, if you only plan to teach lesson 1 of module 2, you should keep the entire module 2 folder. Lessons within a module often share some data, and map projects are set up to find data in specific locations within a module folder.
MetadataMetadata (information about the data) describes the GIS data provided on the Software and Data CD. The metadata includes a description of the data, where it came from, a definition for each attribute field, and other useful information. Each data file has a corresponding metadata file in text (txt) format that can be viewed in any text editor (e.g., Notepad or Wordpad on the PC). A copy of each metadata file in XML format is also included, which can be viewed in ArcGIS Desktop software, if you happen to have it.
Preparing students to work with AEJEE softwareStudents will get more out of the lessons if they have some basic computing skills. Here is a list of computer skills to review before students work through the GIS lessons.
• Left-clicking, right-clicking (PC only), single-clicking, and double-clicking.• Clicking and dragging, for example, moving a window to a different location on the computer
screen or zooming in using the Zoom In tool.• Moving the mouse to position the cursor.• Maximizing the AEJEE window.• Highlighting text to select and replace it.• Navigating to different data folders and selecting files. For example, to open a map (AXL file) for
the lesson, students must navigate to the proper module folder. To add a layer (shapefile) to the map, students must navigate to the proper data folder.

7
Introduction
Note: Exercise instructions are written for Microsoft Windows users. Students working on Macintosh computers should review the Macintosh user guide at the back of the book.
Here are general guidelines and hints for helping students work through the GIS lessons. See the “Teacher notes” section of individual lessons for more information.
• For younger grades, lead students through the lessons. For example, perform one or more GIS actions while the students follow along, repeating your actions. This is effective for students with limited reading skills.
• Allow one or more hours for each lesson.• If you plan to complete more than one lesson, book the computer lab for 2 or 3 days in a row if
possible.• Modify the lessons to include your own questions and steps.• Data is installed locally on each student’s computer. If you are using the lessons with more than
one group of students, you should create student work folders and have students save their work to these folders.
Troubleshooting ArcExplorerOnce in a while, the software may not perform as expected. Often, simple solutions correct the sit-uation. For example, if a map layer does not display properly when you turn it on, turn the layer off and then turn it on again. This usually resolves the issue. A list of commonly encountered troubles and their solutions can be found on this book’s Web site, www.esri.com/ourworldgiseducation.
If you have questions related to installing the software or you want to report a problem or error with the lesson materials in this book, you can send e-mail to [email protected] with your questions.
8
Our World GIS Education: Thinking Spatially Using GIS
Standard
Module 1 Module 2 Module 3 Module 4
Lesson 1 Lesson 2 Lesson 1 Lesson 2 Lesson 3 Lesson 1 Lesson 2 Lesson 1 Lesson 2
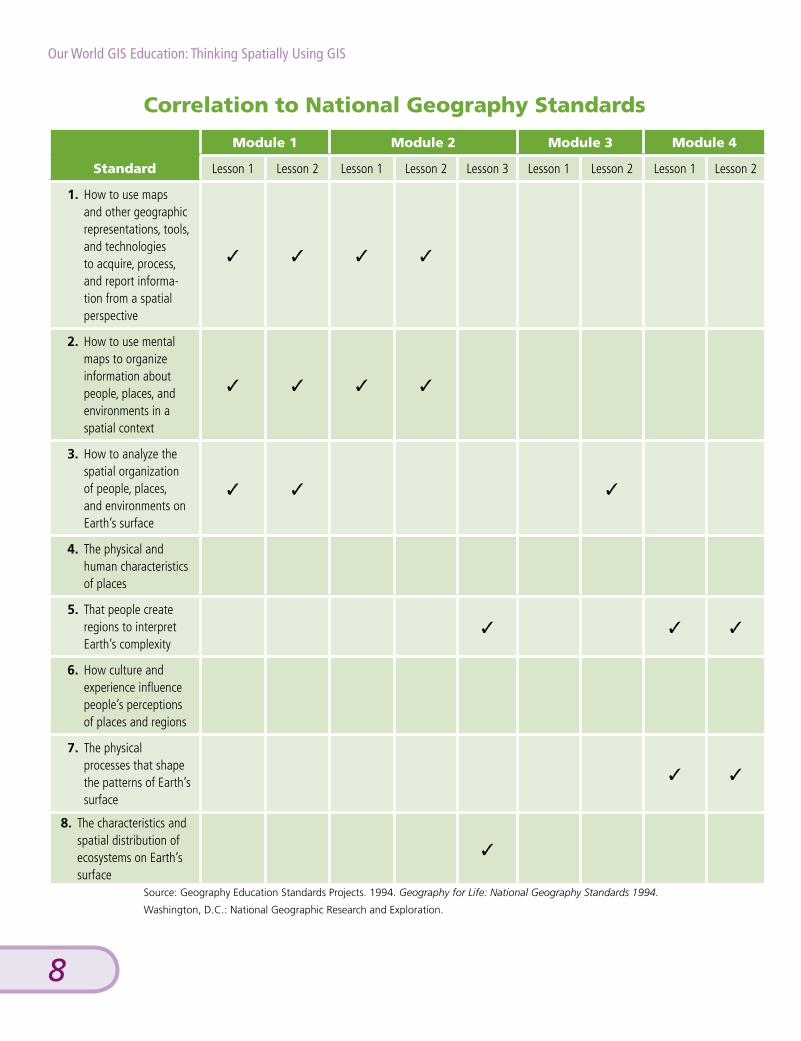
1. How to use maps and other geographic representations, tools, and technologies to acquire, process, and report informa-tion from a spatial perspective
✓ ✓ ✓ ✓
2. How to use mental maps to organize information about people, places, and environments in a spatial context
✓ ✓ ✓ ✓
3. How to analyze the spatial organization of people, places, and environments on Earth’s surface
✓ ✓ ✓
4. The physical and human characteristics of places
5. That people create regions to interpret Earth’s complexity
✓ ✓ ✓
6. How culture and experience influence people’s perceptions of places and regions
7. The physical processes that shape the patterns of Earth’s surface
✓ ✓
8. The characteristics and spatial distribution of ecosystems on Earth’s surface
✓
Correlation to National Geography Standards
Source: Geography Education Standards Projects. 1994. Geography for Life: National Geography Standards 1994.
Washington, D.C.: National Geographic Research and Exploration.

9
Introduction
Standard
Module 1 Module 2 Module 3 Module 4
Lesson 1 Lesson 2 Lesson 1 Lesson 2 Lesson 3 Lesson 1 Lesson 2 Lesson 1 Lesson 2
9. The characteristics, dis-tribution, and migration of human populations on Earth’s surface
✓
10. The characteristics, distribution, and com-plexity of Earth’s cultural mosaics
✓
11. The patterns and networks of economic interdependence on Earth’s surface
✓
12. The processes, patterns, and functions of human settlement
✓
13. How the forces of cooperation and conflict among people influence the division and control of Earth’s surface
14. How human actions modify the physical environment
✓
15. How physical systems affect human systems ✓ ✓ ✓
16. The changes that occur in the meaning, use, distribution, and impor-tance of resources
17. How to apply geography to interpret the past ✓ ✓ ✓
18. How to apply geography to interpret the present and plan for the future
✓ ✓ ✓
Source: Geography Education Standards Projects. 1994. Geography for Life: National Geography Standards 1994.
Washington, D.C.: National Geographic Research and Exploration.

10
Our World GIS Education: Thinking Spatially Using GIS
Standard
Module 1 Module 2 Module 3 Module 4
Lesson 1 Lesson 2 Lesson 1 Lesson 2 Lesson 3 Lesson 1 Lesson 2 Lesson 1 Lesson 2
A. Science as inquiry
● ♦ ● ♦ ● ♦ ● ♦ ● ♦ ● ♦ ● ♦
B. Physical science
● ● ● ♦ ♦
C. Life science
● ♦ ● ♦ ● ♦
D. Earth and space science ● ♦ ● ♦ ● ♦ ● ♦ ● ♦
E. Science and technology ● ● ♦
F. Science in personal and social perspectives
♦ ♦ ● ♦ ● ♦ ♦ ♦
G. History and nature of science ● ♦ ● ♦ ● ● ● ♦ ● ♦ ● ♦ ● ♦ ● ♦
Key
● = grades K-4 standards
♦ = grades 5-8 standards
Correlation to National Science Education Standards
Standards reprinted with permission from National Science Education Standards. Copyright 1996 by the National Academy of Sciences. Courtesy
of the National Academy Press, Washington, D.C.

11
Introduction
Standard
Module 1 Module 2 Module 3 Module 4
Lesson 1 Lesson 2 Lesson 1 Lesson 2 Lesson 3 Lesson 1 Lesson 2 Lesson 1 Lesson 2
1
✓ ✓ ✓ ✓ ✓ ✓ ✓ ✓ ✓
2
✓ ✓ ✓
3
✓ ✓
4
✓ ✓ ✓ ✓ ✓ ✓
✓ ✓
5
6
✓ ✓ ✓ ✓ ✓ ✓ ✓ ✓ ✓
Source: National Education Technology Standards for Students. 2007. International Society for Technology in Education.
Correlation to National Technology Standards


13
MODULE 1Orientation to spatial thinking: World explorationIntroductionFerdinand Magellan’s expedition circumnavigated the globe in the early sixteenth century. Along the way, Magellan and his crew stopped at many places, crossed several oceans, visited differ-ent continents, countries, and cities, and crossed major lines of latitude (parallels) and longitude (meridians) many times. This module puts students in the role of navigator, using GIS as a tool to get them from place to place all the way around the world. They will identify and find places along the route, learn about sailing in places with little wind (the doldrums) and lots of wind (trade winds), measure the distance between stops, zoom in and pan the map to get a better view of the route, change the flat map to a globe, and turn the globe as they travel.
Lesson 1: Magellan crosses the Atlantic Ocean
Lesson 2: Magellan crosses the Pacific Ocean

Explorer Ferdinand Magellan’s expedition crossed the Atlantic Ocean, passing through two groups of islands as it sailed
toward the east coast of South America.

15
Module 1: Lesson 1
Magellan crosses the Atlantic Ocean
Lesson overviewStudents will follow the path of Ferdinand Magellan on the first half of his expedition’s circumnavigation of the globe — from Spain to the eastern coast of South America and across the Strait of Magellan to the Pacific Ocean. As they explore the world map, students will identify continents, countries, and cities along Magellan’s route and work with major latitude and longitude lines. They will also learn about the doldrums and trade winds. They will interact with the map to change the scale and appearance of the map and answer relevant questions about Magellan’s voyage.
While lesson 1 and lesson 2 can be done independently, students would benefit from doing both lessons sequentially.
Estimated timeApproximately 60 minutes
MaterialsThe student activity can be found in the student workbook or on the Software and Data CD. Install the teacher resources on your computer to access it.
Location: OurWorld_teacher\Module1\Lesson1• Student activity: M1L1_student.pdf
ObjectivesAfter completing this lesson, students will be able to do the following:
• Locate places on a world map• Identify major lines of latitude and longitude• Use cardinal directions to navigate from one place to another• Recognize the difference between small-scale and large-scale maps

16
Our World GIS Education: Thinking Spatially Using GIS
Mo
du
le 1
: Lesson 1
M L
GIS tools and functions Open a map file
Find a specific feature on the map
Use the Identify tool to get information about a feature
Zoom to the geographic extent of a layer that is active (highlighted)
Zoom out to see more of the map (less detail)
Measure distance on the map
• Turn layers on and off• Activate a layer• Label features• Use the Pan Panel to pan (shift) the map (up, down, left, right)
National geography standards
Standard K-4 5-8
1 How to use maps and other geographic representations, tools, and technologies to acquire, process, and report information
The characteristics and purposes of geographic representa-tions — such as maps, globes, graphs, diagrams, aerial and other photographs, and satellite-produced images
The characteristics, functions, and applications of maps, globes, aerial and other photographs, satellite-produced images, and models
2 How to use mental maps to organize information about people, places, and environments
The location of Earth’s continents and oceans in relation to each other and to principal parallels and meridians
How perception influences peo-ple’s mental maps and attitudes about places
3 How to analyze the spatial organization of people, places, and environments on Earth’s surface
The spatial concepts of location, distance, direction, scale, move-ment, and region
How to use spatial concepts to explain spatial structure
17 How to apply geography to interpret the past
How places and geographic contexts change over time
How people’s differing percep-tions of places, peoples, and resources have affected events and conditions of the past

Mo
du
le 1
: Le
sson
1
17
Magellan crosses the Atlantic Ocean
Teaching the lesson
Introducing the lessonBegin this lesson by reviewing these concepts:
• The major lines of latitude and longitude (e.g., equator, prime meridian, tropic of cancer, Arctic Circle) and how they are used to divide the world into hemispheres and zones
• Map scale and the difference between large-scale and small-scale maps• How winds converge at the equator, creating the doldrums and making it hard for sailing ships
to cross the equator• The importance of Magellan’s circumnavigation and what it proved about the world • How the Spanish and the Portuguese divided the world between them in the Treaty of Tordesillas
Student activityWe recommend that you complete this lesson yourself before completing it with students. This will allow you to modify the activity to accommodate the specific needs of your students.
Teacher notes• For younger grades, you can conduct the GIS activity as a teacher-led activity in which students
follow along. You can lead students through the GIS steps and ask them the associated questions as a class.
• Ideally each student will have access to a computer, but students can complete the activities in groups or under the direction of a teacher.
• Throughout the GIS activity, students are presented with questions. The GIS activity sheets are designed so that students can mark their answers directly on these sheets. Alternatively, you can create a separate answer sheet.
• We recommend that students save their work as they progress through the GIS activity. Students can use either the Save command (to save their changes to the original map) or the Save As command (to save their changes to a new map). Please explain to students where and how they should save their work.
The following are things to look for while students are working on this lesson:
• As students work through the steps, are they focusing on the underlying geographic concepts (e.g., What are the spatial relationships between continents? How do major lines of latitude and longitude help us locate places on the earth?).
• Are students answering the questions in the GIS activity as they work through the steps?• Are students able to use the legends to interpret the map layers?• Are students aware of changes in scale as they zoom in and out on the map?
Concluding the lesson• Engage students in a discussion about the observations and discoveries they made during their
exploration of the world map.• Ask students about their impressions of Magellan and his circumnavigation. • Has this activity raised any questions that students would like to explore further?• How can GIS help students to learn about world explorers and their discoveries?• Has this activity changed students’ ideas about maps?

18
Our World GIS Education: Thinking Spatially Using GIS
Mo
du
le 1
: Lesson 1
M L
Extending the lesson• Have students research other circumnavigations and why Magellan’s voyage was so important.• Have students research the treaties between the Spanish and the Portuguese in the fifteenth and
sixteenth centuries and how the line of demarcation changed over time.• Have students research the navigation equipment that Magellan used during his voyage.
References • http://www.ucalgary.ca/applied_history/tutor/eurvoya/• http://www.nationalgeographic.com/volvooceanrace/geofiles/01/index.html• http://www.expedition360.com/home/circumnavigation.htm

Mo
du
le 1
: Le
sson
1
19
Magellan crosses the Atlantic Ocean
Student activity answer keyAnswers appear in blue.
Thinking Spatially Using GISModule 1: Lesson 1
1
Name: ________________________________
Date: _________________________________
Copy
right
© 2
008
ESRI
. All
Righ
ts R
eser
ved.
Module 1, Lesson 1
Magellan crosses the Atlantic Ocean
After Christopher Columbus found the New World in 1492, Spain and Portugal were eager to conquer and claim new lands. The two world powers decided to divide the world in half by drawing a line that ran through the Atlantic Ocean. Based on this line, Spain could claim new lands in the western half of the world, and Portugal could claim lands in the eastern half.
This shows the approximate location of the dividing line between the Spanish (western) half of the world and the Portuguese (eastern) half of the world.
Both countries wanted to claim the Spice Islands because of the cloves and other valuable spices that could be found there. But it was unclear where the Spice Islands were in relation to the dividing line because the islands were on the far side of the world from Europe.
Ferdinand Magellan, a Portuguese explorer born in 1480, led the first expedition to sail completely around the world. We call this a circumnaviga-tion. Like Christopher Columbus, Magellan believed he could get to the Spice

20
Our World GIS Education: Thinking Spatially Using GIS
Mo
du
le 1
: Lesson 1
M L
Thinking Spatially Using GISModule 1: Lesson 1
2
Copy
right
© 2
008
ESRI
. All
Righ
ts R
eser
ved.
Islands by sailing west. Magellan knew that he would have to sail around or through the Americas to do it.
Portugal turned down Magellan’s plan, but he won support from the king of Spain. Magellan thought he could find a new route to the Spice Islands and perhaps claim those lands for Spain. In 1519, Magellan set sail with five ships and 270 men.
Let’s follow Magellan’s voyage and find out the new route he discovered.
Step 1: Start AEJEE.
1. Ask your teacher how to start the AEJEE software.
2. Click the Maximize button at the top right of the window. If you are not sure how to do this, ask your teacher.
Now the AEJEE window fills your screen.
Step 2: Open the project.
1. Click the Open button. You see the Open window.
2. Choose OurWorld1 and click Open.
3. Choose Module1 and click Open.

Mo
du
le 1
: Le
sson
1
21
Magellan crosses the Atlantic Ocean
Thinking Spatially Using GISModule 1: Lesson 1
3
Copy
right
© 2
008
ESRI
. All
Righ
ts R
eser
ved.
4. Choose MagellanAtlantic.axl and click Open.
A map of the world appears on your screen.

22
Our World GIS Education: Thinking Spatially Using GIS
Mo
du
le 1
: Lesson 1
M L
Thinking Spatially Using GISModule 1: Lesson 1
4
Copy
right
© 2
008
ESRI
. All
Righ
ts R
eser
ved.
On the left side you see a list of layers. Layers are used to show geographic data on GIS maps. Each layer has a name and a legend. You can turn each layer on and off. At the top of the window, you see menus and buttons that you will use during this activity.
Q1 Look at the continents on the map and fill in the missing letters in the following statements.
a. Europe is touching the continent of A S I A.
b. The A T L A N T I C Ocean separates the continent of A F R I C A from South America.
c. The P A C I F I C Ocean separates the continent of North America from A S I A.
Step 3: Locate the Spice Islands, also known as the Moluccas.
1. Turn on the Moluccas layer by clicking the box next to Moluccas.
Map window
List of layers
A check mark means the layer is turned on. No check mark means it is turned off.

Mo
du
le 1
: Le
sson
1
23
Magellan crosses the Atlantic Ocean
Thinking Spatially Using GISModule 1: Lesson 1
5
Copy
right
© 2
008
ESRI
. All
Righ
ts R
eser
ved.
2. Look on your map for a small red area in the Far East.
3. Click the Continents layer name to highlight it. It becomes active.
4. Click the Identify tool. It allows you to get information about the active layer.
5. Click the Moluccas on the map.
The Identify Results window opens. On the left you see the name of the continent you clicked. On the right you see additional information about that continent.
Q2 What is the name of the continent where the Moluccas are found?
a. Australia
b. Oceania
c. Asia
6. Close the Identify Results window.
Note: Making a layer active tells the GIS that this is the layer you want to work with or learn about.
Moluccas

24
Our World GIS Education: Thinking Spatially Using GIS
Mo
du
le 1
: Lesson 1
M L
Thinking Spatially Using GISModule 1: Lesson 1
6
Copy
right
© 2
008
ESRI
. All
Righ
ts R
eser
ved.
7. Turn on the Major Lines layer by clicking the box next to its name. It shows the major lines of latitude and longitude (e.g., the equator and the prime meridian).
Q3 What major line of latitude passes through the Moluccas? (Circle the correct answer.)
a. Tropic of Cancer
b. Equator
c. Tropic of Capricorn
d. Prime meridian
8. Turn off the Major Lines layer by clicking the check mark next to its name.
Step 4: View Magellan’s route.
You’ll turn on different layers to see where Magellan sailed.
1. Turn on the Countries layer by clicking the box next to Countries in the list of layers. The outlines of all the countries appear on the map.
2. Turn off the Continents layer by clicking the check mark next to Continents.
3. Turn on the Start layer by clicking the box next to its name. A red star appears show-ing where Magellan started his voyage.
4. Turn on the Magellan Route layer by clicking the box next to its name.
The route Magellan followed around the world appears on the map.

Mo
du
le 1
: Le
sson
1
25
Magellan crosses the Atlantic Ocean
Thinking Spatially Using GISModule 1: Lesson 1
7
Copy
right
© 2
008
ESRI
. All
Righ
ts R
eser
ved.
5. Click the Start layer name to highlight it. It becomes active.
6. Click the Identify tool.
7. Click the red star on the map. The Identify Results window opens.
Q4 What is the name of the city where Magellan began his voyage? Seville
Q5 What country is this city in? (Hint: Look on the right side of the Identify Results window.) Spain
8. Close the Identify Results window.
9. Turn on the Major Lines layer in the list of layers.
Q6 Magellan started at the red star and traveled west. How many times did he cross the equator to return to the starting point? (Circle the correct answer.)
a. One time
b. Two times
c. Three times
d. Four times

26
Our World GIS Education: Thinking Spatially Using GIS
Mo
du
le 1
: Lesson 1
M L
Thinking Spatially Using GISModule 1: Lesson 1
8
Copy
right
© 2
008
ESRI
. All
Righ
ts R
eser
ved.
A true circumnavigation requires crossing the equator at least once.
Q7 Did Magellan spend more time north of the equator or south of the equator? (Circle the correct answer.)
a. North of the equator
b. South of the equator
The equator divides the world in half between north and south. Each half is called a hemisphere.
Step 5: Follow Magellan as he starts his voyage in September of 1519 and passes through two groups of islands.
You’ll zoom in for a closer look at Magellan’s route.
1. Turn off the Moluccas layer by clicking the box next to its name.
2. Turn on the StudyArea1 layer.
3. Click the StudyArea1 layer name to highlight it. It becomes active.
4. Click the Zoom to Active Layer button.

Mo
du
le 1
: Le
sson
1
27
Magellan crosses the Atlantic Ocean
Thinking Spatially Using GISModule 1: Lesson 1
9
Copy
right
© 2
008
ESRI
. All
Righ
ts R
eser
ved.
Q8 How did your map change?
a. The map shows more detail (larger scale).
b. The map shows less detail (smaller scale).
5. Turn off the StudyArea1 layer.
6. Turn on the Stops layer.
Magellan passed through two groups of islands on his way to the equator.
Q9 What direction did Magellan have to sail to reach these islands? (Circle the correct answer.)
a. Northeast
b. North
c. Southeast
d. Southwest
7. Click the Stops layer name to highlight it. It becomes active.
8. Click the Identify tool.
9. Click the first stop Magellan reached after leaving the start point.
Q10 What is the name of the group of islands at this stop? Canary Islands
10. Close the Identify Results window.
11. Click the next stop.
Q11 What is the name of the group of islands at this stop? Cape Verde Islands
12. Close the Identify Results window.

28
Our World GIS Education: Thinking Spatially Using GIS
Mo
du
le 1
: Lesson 1
M L

Mo
du
le 1
: Le
sson
1
29
Magellan crosses the Atlantic Ocean
Thinking Spatially Using GISModule 1: Lesson 1
11
Copy
right
© 2
008
ESRI
. All
Righ
ts R
eser
ved.
Step 7: Magellan sailed along the coast of Brazil looking for a headland that would provide passage across the South American continent.
Magellan was told about a great headland near the southern tip of Brazil. (A headland is a place where the land is shaped like a “head” and sticks out into the ocean.) Magellan thought this headland could be a passage. He wanted to find it.
You’ll find Brazil and select it on the map.
1. Click the Find button. The Find window opens.
2. In the Value box, type Brazil (make sure you type it correctly).
3. In the Layers to Search list, click Countries.
4. Click Find.
The information appears on the right side of the window.
5. Click Select at the bottom of the window.
6. Close the Find window.

30
Our World GIS Education: Thinking Spatially Using GIS
Mo
du
le 1
: Lesson 1
M L
Thinking Spatially Using GISModule 1: Lesson 1
12
Copy
right
© 2
008
ESRI
. All
Righ
ts R
eser
ved.
The country of Brazil is now highlighted in yellow on your map. You’ll zoom out a little so you can see all of it.
7. Click the Zoom Out tool.
8. Place your mouse on the spot where Magellan’s route to Brazil crosses the equator.
9. Click one time.
Q14 How did your map change? (Circle all the correct answers.)
a. The map shows less detail (smaller scale).
b. The map shows more detail (larger scale).
c. The map shows a bigger area.
d. The map shows a smaller area.
10. Click the Stops layer name to highlight it.
11. Click the Identify tool.
Note: If you click in the wrong place, click the Previous Extent button and try again.

Mo
du
le 1
: Le
sson
1
31
Magellan crosses the Atlantic Ocean
Thinking Spatially Using GISModule 1: Lesson 1
13
Copy
right
© 2
008
ESRI
. All
Righ
ts R
eser
ved.
Q15 What is the name of the place in Brazil where Magellan landed? Rio de Janeiro
Magellan stopped here to make repairs and stock up on food. How far did Magellan travel to get here? You will use the Measure tool to find out.
12. Close the Identify Results window.
13. Click the Measure tool and choose Nautical Miles from the list.
Nautical Miles are slightly longer than regular miles.
14. Click and hold your mouse on the starting place of Magellan’s voyage.
15. Drag your mouse to Magellan’s stop in Brazil. The gray box in the top left corner of your map shows the length of the line you are drawing.
16. Release the mouse button.
Q16 Look at the gray box. How many nautical miles did Magellan travel? (Hint: Use the number next to Total.) 4, 1 8 8.7 4 7 nm (answers will vary)
Step 8: Magellan reached the headland on Christmas Day, 1519, three months after starting his voyage.
Magellan and his fleet left Brazil to sail along the east coast of South America, looking for the headland that he was told about. Just south of Brazil, they found it.
Before continuing, you will label the Stops.

32
Our World GIS Education: Thinking Spatially Using GIS
Mo
du
le 1
: Lesson 1
M L
Thinking Spatially Using GISModule 1: Lesson 1
14
Copy
right
© 2
008
ESRI
. All
Righ
ts R
eser
ved.
1. Right-click Stops and choose Properties. This opens the Properties window.
2. Click the Labels tab at the top.
3. Under Label features using, choose StopNumber.
4. Increase the Size to 12.
5. Click the box next to Bold to check it.
6. Click the Effects button.
7. Click the box next to Glow.
8. Click OK.
9. Click OK again.
Now the stops are labeled with numbers that have a yellow glow around them.

Mo
du
le 1
: Le
sson
1
33
Magellan crosses the Atlantic Ocean
Thinking Spatially Using GISModule 1: Lesson 1
15
Copy
right
© 2
008
ESRI
. All
Righ
ts R
eser
ved.
10. Look at the map and find Stop 4.
Magellan sent one of his ships to explore this location. He hoped it was a place where ships could cross to the other side of the South American continent.
11. Turn on the Rivers layer by clicking the box next to its name.
12. Click the Rivers layer name to highlight it. It becomes active.
13. Click the Identify tool.
14. Click the river that leads into the place where Magellan explored.
Q17 What is the name of the river where Magellan’s crew explored? Parana
15. Close the Identify Results window.
Q18 Why do you think Magellan couldn’t sail his ships to the other side of the continent from this place? Possible answers include the following:
The river doesn’t cross all the way to the other side of the continent.
Magellan left the river in early February of 1520. His crew wanted to head north for the winter, but Magellan decided to sail south toward the tip of South America.
To see the tip of South America, you will pan the map.

34
Our World GIS Education: Thinking Spatially Using GIS
Mo
du
le 1
: Lesson 1
M L
Thinking Spatially Using GISModule 1: Lesson 1
16
Copy
right
© 2
008
ESRI
. All
Righ
ts R
eser
ved.
16. Click the View menu and choose Pan Panel.
You see a frame around your map. Each side of the frame has a small white arrow. By clicking one of these arrows, you can move or pan the map up (north), down (south), left (west), or right (east).
17. To pan south, click once on the white arrow at the bottom of the map.
Q19 What happened to your map? Describe the changes in your own words. The map moved up so that the area to the south is visible. The map is no longer centered on the equator. The southern tip of South America and the northern portion of Antarctica (below the Antarctic Circle) are now visible. The scale of the map did not change.
Click once on the white arrow

Mo
du
le 1
: Le
sson
1
35
Magellan crosses the Atlantic Ocean
Thinking Spatially Using GISModule 1: Lesson 1
17
Copy
right
© 2
008
ESRI
. All
Righ
ts R
eser
ved.
Step 9: Follow Magellan’s route south along a deserted coast.
Magellan’s ships faced strong winds and big waves as they sailed for about two months along the deserted coast. Bad weather seriously damaged three of Magellan’s ships. By late March 1520, Magellan was forced to stop and spend the winter. He found a safe harbor at Stop 5.
Q20 What major line of latitude is south of the southern tip of South America? (Circle the correct answer.)
a. Equator
b. Tropic of Capricorn
c. Arctic Circle
d. Antarctic Circle
Q21 As Magellan sailed south to Stop 5, do you think the temperature got warmer or colder?
a. Colder
b. Warmer
1. Turn on StudyArea2 by clicking the box next to its name.
2. Click the StudyArea2 layer name to highlight it. It becomes active.
3. Click the Zoom to Active Layer button.
Q22 Look at your map. Do you see more detail or less detail?
a. More detail
b. Less detail
4. Turn off StudyArea2.
5. Click the Stops layer name to highlight it.
6. Click the Identify tool.
7. Click Stop 5 (the star).

36
Our World GIS Education: Thinking Spatially Using GIS
Mo
du
le 1
: Lesson 1
M L
Thinking Spatially Using GISModule 1: Lesson 1
18
Copy
right
© 2
008
ESRI
. All
Righ
ts R
eser
ved.
Q23 What is the name of Stop 5? San Julian
Magellan faced mutiny at this stop. A mutiny is when a group, like the crew on a ship, refuses to obey the person in charge, in this case, Magellan. Fortunately for Magellan, the mutiny failed and he punished the leaders.
8. Close the Identify Results window.
Step 10: Magellan discovered an ocean.
In October, 1520, more than a year after he began his voyage, Magellan and his crew found the headland they were looking for. They called it the Cape of
Q24 Click Stop 6 to find out what this stop is called today. (Hint: Use the Identify tool.) Cape Virgenes
found them in a deep, narrow channel of water (called a strait) that ran west-ward through the mountains. He followed this channel all the way across the tip of the South American continent.
Q25 Click Stop 7 to find out what this famous passage is called today. (Hint: Use the Identify tool.) Strait of Magellan

Mo
du
le 1
: Le
sson
1
37
Magellan crosses the Atlantic Ocean
Thinking Spatially Using GISModule 1: Lesson 1
19
Copy
right
© 2
008
ESRI
. All
Righ
ts R
eser
ved.
1. Close the Identify Results window.
2. Turn on the StudyArea3 layer. You can only see part of this layer now.
3. Click the StudyArea3 layer name to highlight it. It becomes active.
4. Click the Zoom to Active Layer button.
The scale of the map changed, so you can see a bigger area.
5. Turn off StudyArea3.
Q26 What is the name of the ocean that Magellan reached on the west side of South America? (Circle the correct answer.)
a. Atlantic Ocean
b. Pacific Ocean
Step 11: Save your work and exit AEJEE.
1. Ask your teacher how and where to save your work.

38
Our World GIS Education: Thinking Spatially Using GIS
Mo
du
le 1
: Lesson 1
M L
Thinking Spatially Using GISModule 1: Lesson 1
20
Copy
right
© 2
008
ESRI
. All
Righ
ts R
eser
ved.
2. Click the File menu and choose Exit.
Q27 Write a short paragraph explaining what Magellan accomplished to this point. (Hint: What bodies of water and what major lines of latitude did he cross? What continents and countries did he visited?) After leaving Spain, Magellan crossed the Atlantic Ocean sailing toward Brazil. When he got there, he searched for a place to cross the continent of South America. He eventually found this place and found an ocean on the other side—the Pacific Ocean. Along the way, he crossed the equator and the Tropic of Capricorn.
Conclusion
At this point, Magellan and his crew were the first Europeans to cross the South American continent and reach the ocean on the other side. They still needed to cross a big ocean to reach the continent of Asia and find the Spice Islands. With GIS, you have followed his path, gotten information about his stops, and measured distances along the way. In the next lesson, you will continue to follow Magellan’s exploration.


An orthographic map, shaped like a globe, shows the route that Magellan’s expedition followed as it sailed west across the
Indian Ocean.

41
Module 1: Lesson 2
Magellan crosses the Pacific Ocean
Lesson overviewStudents will follow the path of Magellan and his crew on the second half of their circumnavigation of the globe—from the west coast of South America, across the Pacific Ocean to the Spice Islands, and back to Spain. As they explore the world map, students will identify locations along Magellan’s route using latitude and longitude values, measure distances between stops, and work with a map projection. Based on their exploration of the world map, students will answer questions about what Magellan’s expedition accomplished.
While lesson 1 and lesson 2 can be done independently, students would benefit from doing both lessons sequentially.
Estimated timeApproximately 60 minutes
MaterialsThe student activity can be found in the student workbook or on the Software and Data CD. Install the teacher resources on your computer to access it.
Location: OurWorld_teacher\Module1\Lesson2• Student activity: M1L2_student.pdf
Objectives After completing this lesson, students will be able to do the following:
• Locate places on a world map• Identify major lines of latitude and longitude• Use latitude and longitude values to locate features• Use cardinal directions to navigate from one place to another• Recognize the difference between a small-scale map and a large-scale map

Mo
du
le 1
: Lesson 2
42
Our World GIS Education: Thinking Spatially Using GIS
M L
GIS tools and functions Open a map file
Zoom to the geographic extent of a layer that is active (highlighted)
Add labels that appear when you place the mouse over a feature (called MapTips)
Zoom to the full geographic extent of all the layers in the map
Measure distance on the map
• Turn layers on and off• Activate a layer• Change the map projection• Customize a map projection
National geography standard
Standard K-4 5-8
1 How to use maps and other geographic representations, tools, and technologies to acquire, process, and report information
The characteristics and purposes of geographic representa-tions — such as maps, globes, graphs, diagrams, aerial and other photographs, and satellite-produced images
The characteristics, functions, and applications of maps, globes, aerial and other photographs, satellite-produced images, and models
2 How to use mental maps to organize information about people, places, and environments
The location of Earth’s continents and oceans in relation to each other and to principal parallels and meridians
How perception influences peo-ple’s mental maps and attitudes about places
3 How to analyze the spatial organization of people, places, and environments on Earth’s surface
The spatial concepts of location, distance, direction, scale, move-ment, and region
How to use spatial concepts to explain spatial structure
17 How to apply geography to interpret the past
How places and geographic contexts change over time
How people’s differing percep-tions of places, peoples, and resources have affected events and conditions of the past

Mo
du
le 1
: Le
sson
2
43
Magellan crosses the Pacific Ocean
Teaching the lesson
Introducing the lessonBegin this lesson by reviewing these concepts:
• The major lines of latitude and longitude (e.g., equator, prime meridian, tropic of cancer, Arctic Circle) and how they are used to divide the world into hemispheres and zones
• How latitude and longitude are used to locate features precisely on the earth and on a map• What a map projection is and how it changes the shape of the earth on a map• The importance of Magellan’s circumnavigation and what it proved about the world• How the Spanish and the Portuguese divided the world between them
Student activityWe recommend you complete this lesson yourself before completing it with students. This will allow you to modify the activity to accommodate the specific needs of your students.
Teacher notes• For younger grades, you can conduct the GIS activity as a teacher-led activity with students
following along. You can lead students through the GIS steps and ask them the associated ques-tions as a class.
• For older grades, ideally, each student will have access to a computer, but students can complete the activities in groups or under the direction of a teacher.
• Throughout the GIS activity, students are presented with questions. The GIS activity sheets are designed so that students can mark their answers directly on these sheets. Alternatively, you can create a separate answer sheet.
• We recommend that students save their work as they progress through the GIS activity. Students can use either the Save command (to save their changes to the original map) or the Save As command (to save their changes to a new map). Please explain to students where and how they should save their work.
• Software notes• Students should maximize the software window before opening an AXL file.• If students close AEJEE before completing the GIS activity, the MapTips function is not
saved. Students will have to set MapTips again when they reopen the map.
The following are things to look for while students are working on this lesson:
• As students work through the steps, are they thinking about the underlying geographic concepts (e.g., How do major lines of latitude and longitude help them locate places on the earth? How does changing the map projection affect what they see on the map?)?
• Are students answering the questions in the GIS activity as they work through the steps?• Are students able to use the legends to interpret the map layers?• Are students aware of changes in the map as they change the map projection?

Mo
du
le 1
: Lesson 2
44
Our World GIS Education: Thinking Spatially Using GIS
M L
Concluding the lesson• Engage students in a discussion about the observations and discoveries they made during their
exploration of the world map.• Ask students about their impressions of Magellan’s expedition and its circumnavigation. • Ask students to compare their experience working with a flat map of the world to their experience
working with a map that looks like a globe.• Has this activity raised any questions that students would like to explore further?• How can GIS help students to learn about world explorers and their discoveries?• Has this activity changed students’ ideas about maps?
Extending the lesson
• Have students research other circumnavigations and why Magellan’s voyage was so important.• Students can research the treaties between the Spanish and the Portuguese in the fifteenth and
sixteenth centuries and how the line of demarcation changed over time.• Have students research the navigation equipment that Magellan used during his voyage.• Ask students to pretend they are planning a circumnavigation. Using information from the GIS
map, from books, and the Internet, have students write a description of the route they would take and the stops they would make along the way.
• In the MagellanPacific.axl file, have students turn on the Line of Demarcation layer and the Moluccas layer. Set the Projection to Orthographic and the Center Longitude to 150. Ask your students if the Moluccas are in the Spanish or the Portuguese half of the world.
References• http://www.ucalgary.ca/applied_history/tutor/eurvoya/• http://www.geocities.com/rolborr/magsuicide.html• http://www.expedition360.com/home/circumnavigation.htm

Mo
du
le 1
: Le
sson
2
45
Magellan crosses the Pacific Ocean
Thinking Spatially Using GISModule 1: Lesson 2
1
Name: ________________________________
Date: _________________________________
Copy
right
© 2
008
ESRI
. All
Righ
ts R
eser
ved.
Module 1, Lesson 2
Magellan crosses the Pacific Ocean
Ferdinand Magellan was the first European explorer to reach the Pacific Ocean when his expedition sailed through an opening, or strait, near the tip of South America in 1520. He named the ocean Mar Pacifico, which means peaceful sea. The strait, which connected the Atlantic and Pacific oceans, was later named for him.
At that point in his journey, Magellan and his fleet had been at sea for more than a year. He had lost two of his five ships. Now he would cross the Pacific Ocean with three ships, looking for the coast of Asia and the Spice Islands. However, he had no idea the Pacific Ocean would be so big!
Step 1: Start AEJEE.
1. Ask your teacher how to start the AEJEE software.
2. Click the Maximize button at the top of the window. Now the AEJEE window fills your screen.
Step 2: Open the project.
1. Click the Open button.
2. Navigate to your OurWorld1\Module1 folder.
3. Choose MagellanPacific.axl.
4. Click Open.
When the project opens, you see a map of the world showing Magellan’s route on your screen.
Student activity answer keyAnswers appear in blue.

Mo
du
le 1
: Lesson 2
46
Our World GIS Education: Thinking Spatially Using GIS
M L
Thinking Spatially Using GISModule 1: Lesson 2
2
Copy
right
© 2
008
ESRI
. All
Righ
ts R
eser
ved.
Notice the list of layers on the left side. Layers are used to show geographic data on GIS maps. Each layer has a name and a legend. You can turn each layer on and off. At the top of the window, you see menus and buttons that you will use during this activity.
Step 3: Follow Magellan on his Pacific voyage.
You are going to focus on the area where Magellan began to cross the Pacific Ocean.
1. Turn on the StudyArea1 layer by clicking the box next to its name.
2. Click the StudyArea1 layer name to highlight it. It becomes active.
3. Click the Zoom to Active Layer button.
The map redraws, and you are zoomed in to the Pacific Ocean.

Mo
du
le 1
: Le
sson
2
47
Magellan crosses the Pacific Ocean
Thinking Spatially Using GISModule 1: Lesson 2
3
Copy
right
© 2
008
ESRI
. All
Righ
ts R
eser
ved.
4. Turn off the StudyArea1 layer by clicking the check mark next to its name.
Magellan hoped to find the coast of Asia, but the ships sailed for weeks without spotting land. Their food supplies rotted and began to disappear. After six weeks, his men began to die of scurvy, a disease caused by not having enough vitamin C. By mid-January 1521, more than a third of his men were too weak to walk, and they had only enough water for one sip a day.
Finally, on January 25, they spotted a small island at approximately 139 degrees west longitude and 14 degrees south latitude.
5. Place your mouse on the map while you look in the bottom left corner of the AEJEE window.
The numbers you see represent longitude (X) and latitude (Y). Longitude and latitude are used to identify the exact location of any place on the earth.
The X represents longitude — east or west of the prime meridian (a minus sign means west). The Y represents latitude — north or south of the equator (a minus sign means south).
6. Move your mouse until you find X:-139 Y:-14.

Mo
du
le 1
: Lesson 2
48
Our World GIS Education: Thinking Spatially Using GIS
M L
Thinking Spatially Using GISModule 1: Lesson 2
4
Copy
right
© 2
008
ESRI
. All
Righ
ts R
eser
ved.
Q1 What stop number is at this location? Stop 8
Q2 Is this location east or west of the prime meridian?
a. East
b. West
Q3 Is this location north or south of the equator?
a. North
b. South
You can see the stop numbers, but you can’t see their names. You will turn on MapTips so you can see the name of each stop when you place your mouse on it.
7. Click the MapTips button. The MapTips window opens.
8. In the Layers list, scroll down and click Stops.
9. Under Fields, click StopName.
10. Click Set MapTips.
11. Click OK.
12. Hold your mouse over the red star at Stop 8 (don’t click).
The name of the stop appears in a small box called a MapTip.
Q4 What is the name of the island at this stop? P U K A P U K A
Note: If you don’t see the MapTip, move your mouse away from the red star, then move it back again.

Mo
du
le 1
: Le
sson
2
49
Magellan crosses the Pacific Ocean
Thinking Spatially Using GISModule 1: Lesson 2
5
Copy
right
© 2
008
ESRI
. All
Righ
ts R
eser
ved.
Step 4: They left the island on January 28, 1521, and sailed onward.
To follow Magellan’s route across the Pacific, you will change the shape of the map.
1. Click the Tools menu and choose Projection from the list.
2. In the Select Coordinate System window, click the Custom tab.
3. Click the drop-down arrow next to Projection.
4. Scroll down in the list until you see Orthographic, and click it.
5. Click the Center Longitude box, and change the value from 0.0 to -160.0. (Be sure to include the minus sign!)

Mo
du
le 1
: Lesson 2
50
Our World GIS Education: Thinking Spatially Using GIS
M L
Thinking Spatially Using GISModule 1: Lesson 2
6
Copy
right
© 2
008
ESRI
. All
Righ
ts R
eser
ved.
6. Click OK.
7. Click the Zoom to Full Extent button.
Q5 What happened to your map? Describe the changes in your own words. The map changed from flat (like a rectangle) to round (like a globe). The map is centered on the Pacific Ocean. The surface of the map appears curved.
Step 5: Magellan’s route missed most of the Pacific islands where he could have found food.
When Magellan left Stop 8, he decided to head west and slightly north. By March 4, about five weeks after leaving the island at Stop 8, Magellan’s ship ran out of food, leaving only a dozen men strong enough to do any work.
On March 5, just when things seemed hopeless, they spotted land at Stop 9.
Q6 What is the name of this stop? (Hint: Hold your mouse over the stop and read the MapTip.) Guam
At this stop, native people carrying clubs, spears, and shields surrounded Magellan’s ships. Magellan used crossbows, a type of bow and arrow, to kill some of them. These native people, called Chamorros, left in their canoes. Magellan stole their water and food and used cannons to bomb their vil-lage. Magellan’s fleet sailed away as hundreds of Chamorros returned in their canoes to fight.

Mo
du
le 1
: Le
sson
2
51
Magellan crosses the Pacific Ocean
Thinking Spatially Using GISModule 1: Lesson 2
7
Copy
right
© 2
008
ESRI
. All
Righ
ts R
eser
ved.
Before you turn the globe again, you will measure the distance Magellan traveled across the Pacific Ocean.
1. Click the Measure tool and choose Nautical Miles.
2. Click and hold down your mouse button on Stop 7.
3. Drag your mouse to Stop 10 or 11 (they are on top of each other).
4. Let go of your mouse button.
You see three lines on the map. Each shows a different measurement. The three lines are explained in the box below.
Q7 Look at the curved blue line on your map and the blue (geodesic) measurement in the gray box. What is the great circle distance that Magellan traveled on his voyage from South America to Asia? Write the answer here. 8,0 6 4.6 7 7 nm (Answers will vary depending on placement of the mouse pointer)
Note: If you make a mistake, click the Measure tool and choose Clear Measure Totals. Then try again.
When you measure on a projected map in AEJEE, you see three different lines:
between two points, but because the earth is round, it may not be the shortest distance in real life.
points if you used a piece of string on a real globe to measure the distance.
the entire trip.

Mo
du
le 1
: Lesson 2
52
Our World GIS Education: Thinking Spatially Using GIS
M L
Thinking Spatially Using GISModule 1: Lesson 2
8
Copy
right
© 2
008
ESRI
. All
Righ
ts R
eser
ved.
5. Click the Measure tool and choose Clear Measure Totals.
Step 6: Magellan decided to sail to the Philippines instead of the Spice Islands.
At this point, Magellan decided to sail to the Philippines. To follow his route to the Philippines, you will turn the globe again.
1. Click the Tools menu and choose Projection from the list.
2. Click the Custom tab.
3. Click in the Center Longitude box, and change the number to 150.0 (no minus sign this time).
4. Click OK.
You will zoom in for a closer look.
5. Turn on the StudyArea2 layer by clicking the box next to its name.

Mo
du
le 1
: Le
sson
2
53
Magellan crosses the Pacific Ocean
Thinking Spatially Using GISModule 1: Lesson 2
9
Copy
right
© 2
008
ESRI
. All
Righ
ts R
eser
ved.
6. Click the StudyArea2 layer name to highlight it. It becomes active.
7. Click the Zoom to Active Layer button.
8. Turn off the StudyArea2 layer by clicking the check mark next to its name.
Q8 How did your map change? (Circle all the correct answers.)
a. The map shows more detail (larger scale).
b. The map shows less detail (smaller scale).
c. The map shows a bigger area.
d. The map shows a smaller area.
On March 16, 1521, four months after leaving the west coast of South America, Magellan reached the Philippine Islands.
Q9 What is the name of the island at Stop 10? (Hint: Use the MapTip.) Homonhon, Philippines
Here the crew gathered and recovered from scurvy when they ate fruit with lots of vitamin C. On March 27, 1521, Magellan realized he was close to the coast of Asia when a large canoe with people brought him gifts made in China.

Mo
du
le 1
: Lesson 2
54
Our World GIS Education: Thinking Spatially Using GIS
M L
Thinking Spatially Using GISModule 1: Lesson 2
10
Copy
right
© 2
008
ESRI
. All
Righ
ts R
eser
ved.
Step 7: Magellan further explored the Philippine Islands, from Stop 10 to Stop 11.
Q10 What is the name of the island at Stop 11? (Hint: Use the MapTip.) Cebu, Philippines
In the days that followed, Magellan and his men spent their time trading, relaxing, and converting natives to Christianity. When some rajahs, or chiefs, refused to convert, Magellan decided to punish them but was instead killed during a battle with the native peoples.
His men left Magellan’s body behind, and two ships set sail for the Spice Islands. They landed at Stop 12 in November of 1521, after a voyage of 820 days (more than 2 years) since they left Spain. They spent three months in the Spice Islands (also known as the Moluccas), stocking up on spices and preparing to return to Spain.
To see the route back to Spain, you will turn the globe again.
1. Click the Tools menu and choose Projection from the list.
2. Click the Custom tab.
3. Click in the Center Longitude box and change the number to 90.0 (no minus sign).
4. Click OK.
5. Click the Zoom to Full Extent button.

Mo
du
le 1
: Le
sson
2
55
Magellan crosses the Pacific Ocean
Thinking Spatially Using GISModule 1: Lesson 2
11
Copy
right
© 2
008
ESRI
. All
Righ
ts R
eser
ved.
Q11 What happened to your map? Describe the changes in your own words. The globe turned toward the east (to the right). The map is now centered on the Indian Ocean instead of the Pacific Ocean. The surface of the map still appears curved.
Q12 What ocean did they cross on their way back to Spain? (Circle the correct answer.)
a. Pacific Ocean
b. Indian Ocean
c. Atlantic Ocean
d. Arctic Ocean
6. Turn off Countries by clicking the check mark next to its name.
7. Turn on Continents by clicking the box next to its name.
You will find out how far it is from the Spice Islands to the southern tip of Africa.

Mo
du
le 1
: Lesson 2
56
Our World GIS Education: Thinking Spatially Using GIS
M L
Thinking Spatially Using GISModule 1: Lesson 2
12
Copy
right
© 2
008
ESRI
. All
Righ
ts R
eser
ved.
8. Click the Measure tool and choose Nautical Miles.
9. Click and hold your mouse on Stop 12.
10. Drag your mouse to Stop 13.
11. Let go of your mouse button.
Q13 Look at the blue geodesic measurement to find out the great circle distance from the Spice Islands to Africa. Write it here: 6,3 0 3.2 6 1 nm (Answers will vary depending on placement of the mouse pointer)
Q14 Compare your measurement in Q7 (across the Pacific Ocean) with the measurement you just made (across the Indian Ocean). Which ocean is the greatest distance across? (Circle the correct answer.)
a. Indian Ocean
b. Pacific Ocean
12. Click the Measure tool and choose Clear Measure Totals.
Step 8: Heading for home.
In February 1522, one of the two remaining ships began to sink. Half the men were sent onward under the command of Juan Sebastian del Cano. The others stayed behind in the Spice Islands to make repairs but were soon captured by pirates and hanged.
Del Cano led the crew into the Indian Ocean at the end of March 1522. Soon they were low on water and food and sick with scurvy again. Violent

Mo
du
le 1
: Le
sson
2
57
Magellan crosses the Pacific Ocean
Thinking Spatially Using GISModule 1: Lesson 2
13
Copy
right
© 2
008
ESRI
. All
Righ
ts R
eser
ved.
storms damaged the ship. Late in May of 1522, they managed to sail past the cape at the southern tip of Africa (Stop 13).
Q15 What is the name of this cape? (Hint: Use the MapTip.) Cape of Good Hope
By July, they were completely out of food and water. Only 24 men were left, so they headed for the Cape Verde Islands.
To see the route, you will turn the globe one last time.
1. Click the Tools menu and choose Projection from the list.
2. Click the Custom tab.
3. Click in the Center Longitude box and change the number to 0.0 (no minus sign).
4. Click OK.
5. Click the Countries layer name to highlight it. It becomes active even though it is not turned on.
6. Click the Zoom to Active Layer button.
7. Turn on the Countries layer by clicking the box next to its name.

Mo
du
le 1
: Lesson 2
58
Our World GIS Education: Thinking Spatially Using GIS
M L
Thinking Spatially Using GISModule 1: Lesson 2
14
Copy
right
© 2
008
ESRI
. All
Righ
ts R
eser
ved.
8. Turn off the Continents layer.
Do you remember where the Cape Verde Islands are? Magellan stopped there on his way to South America.
Q16 Which stop represents the Cape Verde Islands? (Hint: Use the MapTip.)
a. Stop 13
b. Stop 3
c. Stop 2
d. Stop 1
Q17 Which major lines of latitude did they cross on their way to this stop from the tip of Africa? (Circle all the correct answers.)
a. Antarctic Circle
b. Tropic of Capricorn
c. Equator
d. Tropic of Cancer
e. Arctic Circle
The Cape Verde Islands were in the half of the world claimed by the Portuguese, so del Cano and his Spanish crew were careful. When Portuguese troops

Mo
du
le 1
: Le
sson
2
59
Magellan crosses the Pacific Ocean
Thinking Spatially Using GISModule 1: Lesson 2
15
Copy
right
© 2
008
ESRI
. All
Righ
ts R
eser
ved.
arrived from a nearby fort, del Cano left in a hurry, leaving some of his men behind. He was afraid of losing the 26 tons of valuable spices (cloves and cin-namon) his ship was carrying.
In the first week of September 1522, almost three years after the voyage began, del Cano entered the bay that leads to the city of Seville, Spain—where the voyage started. Only 18 men had survived the journey. They were the first men known to travel all the way around the world. We call this a circumnavigation.
Q18 Which major line of latitude did they cross on their way from Stop 2 to their final destination? (Circle the correct answer.)
a. Antarctic Circle
b. Tropic of Capricorn
c. Equator
d. Tropic of Cancer
e. Arctic Circle
Q19 Write a short paragraph explaining what Magellan’s expedition accomplished after leaving the South American continent. (Hint: What bodies of water and what major lines of latitude did the expedition cross? What continents and islands did the expedition visit?) After leaving the west coast of South America, the expedition accomplished the following:
Step 9: Save your work and exit AEJEE.
1. Ask your teacher where and how to save your work.
2. Click the File menu and choose Exit.

Mo
du
le 1
: Lesson 2
60
Our World GIS Education: Thinking Spatially Using GIS
M L
Thinking Spatially Using GISModule 1: Lesson 2
16
Copy
right
© 2
008
ESRI
. All
Righ
ts R
eser
ved.
Conclusion
Magellan’s mission was to find a new route to the Spice Islands and claim them for Spain. Now you know that Magellan was killed and never reached the Spice Islands. Some of his crew made it there and returned with tons of spices, valuable enough to pay for the trip.
After Magellan’s fleet visited the Spice Islands in 1521, Spain claimed that these islands were within their (western) half of the world. Eight years later, Portugal paid the Spanish 350,000 gold coins to give up their claim to the Spice Islands.
While few of Magellan’s men survived, some of their most important accomplishments include the following:
and Pacific oceans
a penguin)
sky over the southern hemisphere
earth, discovering its full extent (the actual extent or circumference of the earth is 40,075.16 kilometers or 24,901.55 miles)