Aberystwyth University The responding and ecological ...
40
Aberystwyth University The responding and ecological contribution of biofilm-leaves of submerged macrophytes on phenanthrene dissipation in sediments Zhao, Zhenhua; Qin, Zhirui; Xia, Liling; Zhang, Dan; Mela, Sara; Li, Yong Published in: Environmental Pollution DOI: 10.1016/j.envpol.2018.12.030 Publication date: 2019 Citation for published version (APA): Zhao, Z., Qin, Z., Xia, L., Zhang, D., Mela, S., & Li, Y. (2019). The responding and ecological contribution of biofilm-leaves of submerged macrophytes on phenanthrene dissipation in sediments. Environmental Pollution, 246, 357-365. https://doi.org/10.1016/j.envpol.2018.12.030 Document License CC BY-NC-ND General rights Copyright and moral rights for the publications made accessible in the Aberystwyth Research Portal (the Institutional Repository) are retained by the authors and/or other copyright owners and it is a condition of accessing publications that users recognise and abide by the legal requirements associated with these rights. • Users may download and print one copy of any publication from the Aberystwyth Research Portal for the purpose of private study or research. • You may not further distribute the material or use it for any profit-making activity or commercial gain • You may freely distribute the URL identifying the publication in the Aberystwyth Research Portal Take down policy If you believe that this document breaches copyright please contact us providing details, and we will remove access to the work immediately and investigate your claim. tel: +44 1970 62 2400 email: [email protected] Download date: 19. Jan. 2022
Transcript of Aberystwyth University The responding and ecological ...
Aberystwyth University
The responding and ecological contribution of biofilm-leaves of submergedmacrophytes on phenanthrene dissipation in sedimentsZhao, Zhenhua; Qin, Zhirui; Xia, Liling; Zhang, Dan; Mela, Sara; Li, Yong
Published in:Environmental Pollution
DOI:10.1016/j.envpol.2018.12.030
Publication date:2019
Citation for published version (APA):Zhao, Z., Qin, Z., Xia, L., Zhang, D., Mela, S., & Li, Y. (2019). The responding and ecological contribution ofbiofilm-leaves of submerged macrophytes on phenanthrene dissipation in sediments. Environmental Pollution,246, 357-365. https://doi.org/10.1016/j.envpol.2018.12.030
Document LicenseCC BY-NC-ND
General rightsCopyright and moral rights for the publications made accessible in the Aberystwyth Research Portal (the Institutional Repository) areretained by the authors and/or other copyright owners and it is a condition of accessing publications that users recognise and abide by thelegal requirements associated with these rights.
• Users may download and print one copy of any publication from the Aberystwyth Research Portal for the purpose of private study orresearch. • You may not further distribute the material or use it for any profit-making activity or commercial gain • You may freely distribute the URL identifying the publication in the Aberystwyth Research Portal
Take down policyIf you believe that this document breaches copyright please contact us providing details, and we will remove access to the work immediatelyand investigate your claim.
tel: +44 1970 62 2400email: [email protected]
Download date: 19. Jan. 2022

1
The responding and ecological contribution of biofilm-leaves 1
of submerged macrophytes on phenanthrene dissipation in 2
sediments 3
Zhenhua Zhao1,2*, Zhirui Qin1, liling Xia3, Dan Zhang1, Sara Margaret Mela4, Yong Li1 4
1 Key Laboratory of Integrated Regulation and Resource Development on Shallow Lake 5
of Ministry of Education, College of Environment, Hohai University, Nanjing 210098, 6
P.R. China. 7
2 Department of Plant, Soil, and Microbial Sciences, Michigan State University, East 8
Lansing, MI 48824, USA. 9
3 Nanjing Institute of Industry Technology, Nanjing 210016, P.R. China 10
4 Department of Geography and Earth Sciences, Aberystwyth University, Penglais, 11
Aberystwyth, Ceredigion, SY23 3DB, UK 12
13
14
*Corresponding author: E-mail: [email protected] (Zhenhua Zhao) 15
Tel.: +86 25 83786696; Fax: +86 25 83786696 16
17

2
Abstract 18
The bacterial communities and ecological contribution of biofilm-leaves of the 19
Vallisneria natans (VN), Hydrilla verticillata (HV) and artificial plant (AP) settled in 20
sediments with different polluted levels of phenanthrene were investigated by high-21
throughput sequencing in different growth periods. There was no significant difference 22
among the detected Alpha diversity indices based on three classification, attached surface, 23
spiking concentration and incubation time. While Beta diversity analysis assessed by 24
PCoA on operational taxonomic units (OTU) indicated that bacterial community 25
structures were significantly influenced in order of attached surface > incubation time > 26
spiking concentration of phenanthrene in sediment. Moreover, the results of hierarchical 27
dendrograms and heat maps at genus level were consistent with PCoA analysis. We 28
speculated that the weak influence of phenanthrene spiking concentration in sediment 29
might be related to lower concentration and smaller concentration gradient of 30
phenanthrene in leaves. Meanwhile, difference analysis suggested that attached surface 31
was inclined to influence the rare genera up to significant level than incubation time. In 32
general, the results proved that phenanthrene concentrations, submerged macrophytes 33
categories and incubation time did influence the bacterial community of biofilm-leaves. 34
In turn, results also showed a non-negligible ecological contribution of biofilm-leaves in 35
dissipating the phenanthrene in sediments (>13.2%-17.1%) in contrast with rhizosphere 36
remediation (2.5%-3.2% for HV and 9.9%-10.6% for VN). 37
38

3
Capsule: The bacterial community structures were influenced in order of attached surface > 39
incubation time > spiking concentration of phenanthrene in sediment. 40
41
Key words: phenanthrene bioremediation; submerged macrophyte; biofilm-leaf; 42
bacterial community; high-throughput sequencing 43
44

4
1. Introduction 45
Polycyclic aromatic hydrocarbons (PAHs) are widely distributed environmental 46
pollutants (Chen et al., 2015; Li et al., 2014), which result from incomplete combustion 47
of fossil fuels and organic materials, and are often associated with industrial and human 48
activities (Bamforth and Singleton, 2010). PAHs are highly carcinogenic, teratogenic and 49
mutagenic compounds and can pose a great threat to human health through food-chain 50
bioaccumulation (Moscoso et al., 2012). As demonstrated by studies on occurring, 51
transporting, adsorbing and biodegrading, the concentrations of PAHs in natural 52
environments can be detected in a wide scope from 1 ng/g to 300 mg/kg (Lu et al., 2012). 53
PAHs typically precipitate and accumulate in sediments due to their hydrophobic 54
properties in aquatic environment (Liang et al., 2007; Wang et al., 2003), which result in 55
the sediment being the major sink of PAHs. Meanwhile, several studies indicate that 56
sediments may be the second-most concentrated source of PAHs (Jérôme Cachot et al., 57
2007; Yang et al., 2008). PAHs observed in sediments mainly consist of 3-rings PAHs 58
(e.g. phenanthrene) and 4-rings PAHs (e.g. pyrene) (Hassan et al., 2018; Lin et al., 2016). 59
Dredging contaminated sediments is a common but disruptive practice which can lead to 60
the re-suspension of pollutants (Agarwal et al., 2007). Therefore, exploring cost-effective, 61
in situ approaches for sediment remediation has become increasingly important (Perelo, 62
2010). 63
Phytoremediation is a prospective alternative means because of its affordability, 64
effectiveness and low environmental impact (Cheema et al., 2010; Gomes et al., 2013). A 65
considerable amount of work has been done investigating the rhizosphere, which could 66

5
improve microbial population and diversity of soil surrounding plant roots (Ma et al., 67
2010). Such studies mainly focus on the rhizosphere of terrestrial plants, while submerged 68
plants are the key and widespread species in coastal shallow water. Diverse microbiomes 69
were often associated with submerged rhizoplanes, due to the unique environment that 70
persists compared to their terrestrial counterparts (Srivastava et al., 2016; Zhao et al., 71
2017). This plant-microbes ecosystem could be manipulated to alleviate the condition of 72
polluted sediments naturally. The high root oxygen loss (ROL) capacity of submerged 73
macrophytes could contribute to nitrogen cycling in sediments: higher abundance of 74
ammonia oxidizers increased denitrification, while nitrifies and denitrifying communities 75
may associate more closely in these environments (Vila‐Costa et al., 2016). 76
Recently, the remediation strategy of using submerged macrophytes to deal with 77
sediments polluted by PAHs has attracted widespread attention. Meng et al. (2015) 78
showed that microbial degradation, rather than plant uptake, played a major role in the 79
plant-promoted the dissipation of PAHs in sediments, and microbial degradation was not 80
controlled by the amount of bioavailable PAHs - even if these were readily bioavailable. 81
Dissipation ratio of PAHs was correlated with PAH-degrading bacteria population which 82
in turn, linked positively with sediment redox potential, and low plant density of 83
Vallisneria spiralis should be a better selection for phytoremediation (Liu et al., 2014). In 84
addition, Potamogeton crispus greatly improved the bioavailability (73.9%) and 85
biodegradation activity (277%) of pyrene in aged sediments in contrast with unaged 86
sediments (13.1% and 150%, respectively) (Meng and Chi, 2016). 87

6
Diverse substances such as organic matter, silt, zoogloea, algae and other 88
microorganisms often accumulate on the leaf surface of submerged plants. A micro-89
interface is therefore established which varies in its composition, structure and thickness 90
depending on the actual environmental properties. This impacts the gas exchange between 91
water and plants and induces specific heterogeneous oxidation – reduction environments. 92
Numerous investigations have focused on the micro-interface of submerged macrophytes. 93
Sand-Jensen et al. (1985) reported that dissolved oxygen (DO) on the micro-interfaces of 94
leaves of Potamogeton crispus, Littorella uniflora,Zostera marina and Scytosiphon 95
lomentaria increased with shorter distance from the leaf surfaces, and with increasing 96
illumination intensity. In the daytime, the leaf surfaces of submerged macrophytes 97
produced an oxygen-enriched environment, while a highly anaerobic environment 98
appeared in night. Meanwhile, the pH in the micro-interfaces was greater than 99
surrounding water (Jones et al., 2000; Sandjensen et al., 1985), and the difference value 100
increased with the thickness of biofilm (Jones et al., 2000). Recently, high throughput 101
sequencing, and next generation sequencing technology has provided gene sequence 102
outputs that could be further analyzed to provide in-depth bacterial taxonomic 103
assignments (Kim and Isaacson, 2015). Thus, some researchers studied the response and 104
role of functional bacteria on biofilm-leaves for eutrophication, especially for nitrogen in 105
aquatic environments through high throughput sequencing technology (Pang et al., 2016; 106
Yan et al., 2017; Zhang et al., 2016). Little is known about the cumulative capacity of 107
PAHs in the leaves of submerged macrophytes and their impact on the biofilm-leaves 108

7
when they release from sediments to water due to the characterization of hydrophobicity 109
normally. However, Lipotropy of leaves of submerged plants makes them enrich PAHs 110
from water (Diepens et al., 2014). PAHs may be mediated by microorganisms in micro-111
interfaces, especially bacteria. Thus, we hypothesized that the bacterial community in 112
biofilm attached on leaves of submerged macrophytes suffering from PAHs might be 113
altered and biofilm-leaves might contribute to the dissipation of PAHs in turn. 114
In our present study, phenanthrene was chosen as one of representative low molecular 115
weight (LMW) PAHs because it is commonly found in sediments. The bacterial 116
community and ecological contribution of biofilm-leaves were identified by high 117
throughput sequencing, compared between an artificial plant and two submerged 118
macrophytes in different growth periods, settled in sediments spiked with different 119
phenanthrene concentrations. The objective of this study is to explore and identify the key 120
driving factor influencing the bacterial community of biofilm-leaves and the ecological 121
contribution of different dissipation mechanism (e.g. biofilm, submerged macrophytes, 122
and background degradation) on phenanthrene dissipation in water and sediment. 123
2. Materials and methods 124
2.1 Materials 125
Vallisneria natans (VN) and Hydrilla verticillata (HV) (Nanjing Sam Creek aquatic 126
breeding research base) were selected as the tested aquatic plants. A control group (CG) 127
and artificial plants group (bio-racks with organic glass, AP) with similar surface area to 128
submerged macrophytes were also tested. Sediments (pH=7.32, organic matter=2.14%, 129

8
background phenanthrene level=0.056 mg/kg) were collected from a suburb river of 130
Nanjing (not in the main industrial area), air-dried, manually crushed, and then sieved 131
with 2-mm mesh to remove plant residues and stone. Organic glass containers (40 × 50 132
cm) were chosen to cultivate submerged plants, to avoid loss of phenanthrene via 133
adsorption. The experiment was carried out in the ecological greenhouse with three 134
replicates for 35 d. 135
2.2 Experimental setup 136
The 0.6 g phenanthrene dissolved in acetone (1600 mL) was spiked into 6 kg sediment. 137
After acetone evaporating, the polluted sediment was mixed with unpolluted sediment 138
with their respective proportion, and laid in each container smoothly. The final contents 139
of phenanthrene in sediment (dry weight) were 20 mg/kg and 10 mg/kg, respectively. 140
0.01 g norfloxacin and 0.015 g roxithromycin / L water) were added into water to 141
domesticate for 3 – 5 d, which could remove or destroy the original biofilm-leaves. After 142
the completion of plant domestication, the robust and uniform plants were transplanted 143
into the containers. 50 L water was added to the container and the water-line was marked 144
clearly to replenish water to a uniform level throughout cultivation. 145
Water, leaf and sediment samples were collected for phenanthrene analysis at 14, 28 146
and 35 d. The samples were stored at -20℃ for PAHs analysis. The biofilm-leaves of 147
submerged plants and biofilm-surface of AP were extracted in 14 and 28 d, respectively. 148
2.3 The separation of biofilm attached on the plants leaves 149
The method of biofilm separation from leaf surfaces was modified from He et al. (2012). 150

9
With precool ethanol-PBS buffer as eluent, appropriate amount of leaves were put in the 151
polyethylene test tube, then Triton solution and several 3 mm glass beads were added. All 152
the sample tubes were placed in reciprocating oscillator with constant temperature and 153
were shaken for 10 min (225 r/min), then underwent ultrasounds (150 W, 40 kHz) for 1 154
min. After filtrating elution liquor, the filtrate was centrifuged for 10 min (10000 rpm), 155
and the centrifugal precipitate was collected. Artificial plant biofilms could be scraped 156
directly with a sterile scalpel. 157
2.4 Analysis methods 158
2.4.1 Extracting and purifying of samples (Hussain et al., 2016; Zhao et al., 2014) 159
Sediment samples: 5.0 g of lyophilization sediment samples and 2.0 g anhydrous 160
sodium sulfates were mixed and soaked in 15 mL extractant agent (hexane / acetone = 161
2/1, v/v) for 1 h in 50 mL glass centrifuge tube, and processed 10 min ultrasonic extraction. 162
The above-mentioned process was repeated twice, and the supernatants were moved to 163
the pear-shaped bottle and concentrated to 1 mL with vacuum rotary evaporator for 164
purifying. After the Solid Phase Purification Column (SPPC, 0.5 g copper powder + 1 g 165
anhydrous sodium sulfate + 1g silica gel + 1 g alumina pretreated) was rinsed and 166
activated with 5 mL n-hexane, the concentrated extracting liquor was transferred to the 167
SPPC and eluted by 15 mL n-hexane and 10 mL dichloromethane. The obtained eluent 168
was concentrated and adjusted to 1 mL with n-hexane. 169
Water samples (Zhao et al., 2018): After each water sample (1 L) was filtrated through 170
glass fiber membrane of 0.45 μm and extracted with C18 SPE column, the column was 171

10
washed by HPLC water, and pumped for 30 minutes to remove redundant moisture. The 172
PAHs in the SPE column was eluted with 10 mL of acetone/n-hexane (v/v=1/2) and 12 173
mL of dichloromethane/n-hexane (v/v=3/2). The eluent was concentrated and adjusted to 174
1 mL with n-hexane. 175
Plant samples (Tao et al., 2006; Zhao et al., 2018): 5.0 g plant samples and 5.0 g 176
anhydrous sodium sulfates were packed in a filter paper parcel and extracted in Soxhlet 177
Extractor for 10 h with 100 mL 10% of acetone/n-hexane (v/v) mixed solvent, and the 178
extracted liquid was washed twice in separating funnel by 5% sodium sulfate solution for 179
removing acetone. The extract of n-hexane was concentrated to about 1 mL and dealt with 180
20 mL concentrated sulfuric acid to get rid of the fat in plant samples twice. Finally, the 181
extract was put into SPPC, the purification and elution steps were same as sediments. 182
2.4.2 Determination of phenanthrene (Jiao et al., 2007). 183
The phenanthrene was analyzed by Agilent1100 HPLC with fluorescence and UV - 184
adsorption detector. A 250 mm × 4.6 mm × 5 μm reversed phase C18 column (Agilent 185
ZORBAX Eclipse XDB-C18) was used as the stationary phase. A solution of acetonitrile 186
and ultrapure water was delivered as the mobile phase in a gradient programme at 1 187
mL/min. The volume ratio of acetonitrile and water was 75: 25. Phenanthrene was 188
quantified by using external standard solutions sourced from Ehrenstorfer (Augsburg, 189
Germany). Detective wavelength with FLD signals: Exλ=257 nm, Emλ=380 nm. 190
2.4.3 DNA extraction, PCR amplification, sequencing and data analysis 191
Weighing 0.5 g biofilm-leaves/-surface samples in 2 mL centrifuge tube, the bacterial 192

11
DNA were extracted by Soil DNA Kit (Omega E.Z.N.A.TM, Omega Bio-Tech) according 193
to manufacturer’s protocol. The PCR primers were V3-V4 universal primers 341F/805R 194
(341F: CCTACGGGNGGCWGCAG; 805R: GACTACHVGGGTATCTAATCC) 195
provided by Sangon Biotech Co., Ltd., Shanghai, China. The PCR reaction mixture 196
contained 5 μL 10×PCR buffer, 0.5 μL dNTPs (10 mM each), 0.5 μL Bar-PCR primer F 197
(50 μM), 0.5 μL Primer R (50 μM), 0.5 μL Plantium Taq (5 U/μL), 10 ng DNA template, 198
with sterile water added to make the final volume to 50 μL. The following PCR cycle was 199
performed: initial denaturation at 94 °C for 3 min, denaturation at 94 °C for 30 s, 200
renaturation at 94 °C for 30 s, annealing at 45°C for 20 s, extension at 65 °C for 30 s with 201
a total of 30 cycles, and the final extension at 72 °C for 5 min. Amplification products 202
were detected by 1% agarose gel electrophoresis, and then recycled using DNA Recycle 203
Kit, SK8131 (Sangon Biotech Co., Ltd, Shanghai, China), and finally quantified using 204
Qubit 2.0 DNA Assay Kit (Sangon Biotech Co., Ltd, Shanghai, China). Paired-end 205
sequencing was performed using Illumina MiSeq platform (Illumina, San Diego, CA, 206
USA). 207
Sequencing analysis was executed by using QIIME (Yu et al., 2017). The Uclust 208
method was used to pick the representative sequences for each operational taxonomic 209
units (OTUs). Then the taxonomic information was annotated with the SILVA database 210
after subsampling based on the lowest number of reads. The number of reads ranged from 211
35410 to 46153. Alpha diversity refers to the diversity of microorganism in a special 212
region or ecosystem. A number of Alpha diversity measures were evaluated using the 213

12
Mothur software including the abundance based coverage estimator (ACE), terminal 214
richness estimation (Chao1), the Shannon index, Simpson index and the Good’s coverage 215
estimation. Statistical analyses were performed using R software, including rank-216
abundance curves, microbial community composition at phylum and genus level, PCoA 217
and hierarchical cluster analysis using Bray-Curtis algorithm. Among them, PCoA and 218
hierarchical cluster analysis were usually used to research the similarity or difference of 219
microbial community composition of different samples group. Heat maps generated by 220
HemI can reflect visually the difference in abundance distribution of species between 221
different groups. The difference of microbial communities at genus level was analyzed 222
by Kruskal-wallis H test and Wilcoxon rank-sum test using STAMP software, which is 223
used to assess the difference of Alpha diversity indices based on three classifications. In 224
addition, one-way ANOVA was applied to check the difference of ECI between four 225
systems. 226
The raw DNA sequence data was uploaded to NCBI Short Read Archive (SRA) with 227
the accession number of SRP125077. 228
3. Results and discussion 229
3.1 Phenanthrene dissipation and ecological contribution of submerged macrophytes and 230
their biofilm-leaves 231
3.1.1 Dissipation of phenanthrene in water, sediment and leaves 232
During the experiment, phenanthrene concentration in sediments declined with the 233
time in all the treatments (Fig. 1a). The dissipated efficiencies were in the order of VN 234

13
(62.7% for 20 mg/kg and 64.1% for 10 mg/kg) > HV (51.1% and 58.4%) ≧ AP (51.6% 235
and 53.5%) > CG (35.8% and 42.4%). The results indicated that submerged macrophytes 236
settled in sediments could contribute to the removal of phenanthrene, with dissipation 237
rates dependent on the type of submerged macrophytes. This may relate to the capabilities 238
of oxygenation and microbiological degradation of root tissue (He and Chi, 2016) and the 239
biofilm-leaves. 240
The phenanthrene concentrations in water were rather low because of its 241
hydrophobicity and low solubility (Fig. 1b); most phenanthrene was adsorbed in 242
sediments (Fig. 1a) or on the surface of submerged macrophytes (Fig. 1c). The 243
phenanthrene concentrations in water showed an initial increase followed by a gradual 244
decrease slowly (Fig. 1b), while the phenanthrene concentrations in leaves always kept a 245
relatively stable level in two kinds of hydrophyte leaves and were approximately 200 246
times greater than in water (Fig. 1b, Fig. 1c). The concentrations of phenanthrene in leaves 247
were lower by an order of magnitude than in sediments (Fig. 1a, Fig. 1c), due to the 248
mutual exchange balance of PAHs among overlying water, leaves and sediment (Diepens 249
et al., 2014) and low level of phenanthrene in water naturally. 250
3.1.2 Ecological contribution of submerged macrophytes and their biofilm-leaves 251
Actually, the dissipation mechanisms of phenanthrene in different treatments system 252
are very complicated and include many dissipated processes, which may contain 253
synergies and antagonisms and be difficult to identify the sole dissipated contribution. In 254
order to understand the combined dissipation ecological contribution of different 255

14
treatments (e.g. background dissipation, volatilization, photolysis) well, we regarded the 256
dissipation of phenanthrene as the sum of dissipated contribution of different dissipation 257
mechanism and ignored the synergies and antagonisms among them probably. 258
Considering the giant area of leaves and its ability of releasing oxygen of submerged 259
macrophytes at the same time, we should give weight to the contribution of biofilm-leaves 260
in remediating PAHs polluted sediments. So, we set an ecological contribution index (ECI) 261
to evaluate the contribution of each system in remediating Phe-polluted sediments (Fig. 262
1d). 263
ECI= (spiked conc.-residual conc.) ∗100/ spiked conc. % (1) 264
ECI was in order of VN (36.8%-62.7%) > HV (30.2%-51.10%) > AP (27.6%-51.6%) > 265
CG (7.1%-35.8%) in 20 mg/kg phenanthrene system, and VN (40.3%-64.1%) > HV 266
( 33.2%-58.4%) > AP (30.3%-53.5%) > CG (14.6%-42.4%) in 10 mg/kg phenanthrene 267
system from 14 d to 35 d, respectively. One-way ANOVA followed by DUNCAN post 268
hoc test was performed to check the difference of ECI among these four systems. And 269
results showed that there were no significant difference appeared regarding the PAHs 270
concentration (p=0.078 for 20 mg/kg; p=0.233 for 10 mg/kg); however, the ECI of 271
VN/HV system, especially for VN system was higher than AP/CG system spiked by 20 272
mg/kg phenanthrene rather than 10 mg/kg phenanthrene. Actually, the dissipation of 273
phenanthrene in CG system comes from the background dissipating ability, which 274
includes the volatilization, photolysis, release from sediment to water, microbiological 275
degradation in water and sediment. The dissipation of phenanthrene in AP system comes 276

15
from the background dissipating ability and the adsorption of artificial plant and the 277
degradation by the biofilm attached on the artificial plant surface. In the submerged 278
macrophytes system, phenanthrene dissipation can be explained by the action of 279
rhizosphere microbes, in addition to the factors acting in the AP. The difference of 280
dissipation between the AP and CG systems can represent the ecological contribution of 281
artificial plant biofilm (15.0%-20.5% for 20 mg/kg phenanthrene and 11.1%-15.6% for 282
10 mg/kg phenanthrene, and the averages were 17.1% and 13.2%, respectively), and the 283
ecological contribution of rhizosphere microbes can be represented by the difference of 284
dissipation between submerged macrophytes system and AP system (9.2%-11.7% in 20 285
mg/kg phenanthrene and 9.1%-10.6% in 10 mg/kg phenanthrene system for VN, the 286
average was 9.9%-10.6%; and 0%-5.4% in 20 mg/kg phenanthrene system and 1.6%-4.9% 287
in 10 mg/kg phenanthrene system for HV, the average was 2.5%-3.2%). 288
Our research confirmed phenanthrene released from sediments to water then 289
accumulated on the leaves surface of submerged macrophytes. We also noticed the 290
dissipation of phenanthrene in water and sediments during the cultivation process (Fig. 291
1a and Fig. 1b). It may be related to the dissipation induced by physical and chemical 292
process (e.g. photodecomposition), the enrichment and dissipation of hydrophyte (Li et 293
al., 2009), and the degradation of microorganisms. In addition, the added organic matters 294
could improve the adsorption capacity of sediment on phenanthrene because the dead 295
leaves sank into sediments later (Ying-Heng et al., 2014). However, the steady 296
phenanthrene concentration in the leaves of submerged macrophytes might be related to 297

16
the length of incubation time (Liu et al., 2014). 298
299
Figure 1 300
301
3.2 Bacterial diversity analysis based on attached surface, spiking concentration and 302
incubation time 303
3.2.1 Alpha diversity 304
Alpha diversity can show the diversity of microorganism in a special region or 305
ecosystem. In this study, the alpha diversities of biofilm microbial indices for leaf surface 306
were shown in Table 1. ACE and Chao 1 are designed to estimate the community richness 307
of biofilm samples based on the OTU numbers. The values of ACE and Chao 1 showed 308
that the community richness of microbes in artificial plant samples (1C and 2C) were far 309
higher than those submerged plant samples (1A, 2A, 3A, 4A and 1B, 2B, 3B, 4B), and 310
the community richness of VN were slightly higher than those of HV. The Shannon and 311
Simpson indices reflect community diversity. In our present study, the community 312
diversity was consistent with community richness. The incubation time significantly 313
affected the community diversity of biofilm samples, and those of 14 d samples were 314
higher than those of 28 d samples. However, the effect of phenanthrene concentration was 315
indistinctive. The coverage index represents the sequencing depth. In the study, the 316
coverage was approximately equal to 0.99 except for 1C (0.97) and 2C (0.97) after 317
subsampling based on the lowest number of reads, and indicating all the samples reflected 318

17
the actual situation. Meanwhile, the difference was analyzed among Alpha indices based 319
on three classifications (attached surface, spiking concentration of phenanthrene and 320
incubation time) using Wilcoxon rank-sum test (Table S1). However, there was not 321
statistically significant difference regretfully (p<0.05, see the Table S1). 322
323
Table 1 324
325
3.2.2 Taxon richness and distribution evenness analysis: Rank-abundance distribution 326
curves, Shannon-Wiener curves and Rarefaction curves of the OTUs 327
Applying the rank-abundance curve to analyze species distribution was an imperative 328
manner. On account of computing the sequencing numbers which each OTU contained, 329
researchers sorted by OTUs in descending order and depicted the relevant relations in 330
accordance with abundance. The curves can reflect both species abundance and 331
distribution evenness (Cheng et al., 2016). Fig. 2 showed that the distribution ranges of 332
AP were wider than SM, which demonstrated that the species in the biofilm-surface of 333
AP were more abundant. The curve graph of SM was smaller than that of AP, which meant 334
that the species distribution was more even in AP. The rank-abundance distribution 335
corresponded to the analysis of community diversity using Alpha diversity indices. 336
The Shannon-Wiener curves takes richness and evenness of samples into account. 337
Sample 10B had the highest diversity (6.64) and followed by sample 9B (6.53), while the 338
sample 3B had the lowest diversity (4.00) (Fig S1a). The reads of each sample were large 339
18
enough (>25,000 tags per sample) to reflect huge diversity of microbial community 340
because they reached the plateau since less than 5,000 tags for each sample. Rarefaction 341
analysis was applied to standardize and compare taxon richness observed among samples 342
(Fig. S1b). The rarefaction curves based on OTUs (97% similarity) presented a generally 343
consistent tendency for SM rather than AP. These results showed that recovered 344
sequences reflected the diversity of microbial community well, and further sampling 345
could reveal the diversity of microbial community in AP to some extent. 346
3.2.3 Beta diversity 347
The Beta diversity is good at comparing the microbial community composition among 348
different sample groups. Here, it was assessed by PCoA based on OTU level, and the 349
results were illustrated in Fig. 3a. Principal components 1 (PC1) and PC2 explained 42.5% 350
and 18.79% of variation of microbial community composition, respectively. Generally, 351
the samples were divided into three groups (group A, group B and group C). The different 352
attached surface (AP: group C vs. SM: group A and group B) had a dominant influence 353
on the microbial community structure, but the difference among submerged macrophytes 354
was small. The separation of group A and group B indicated that incubation time also 355
influenced the bacterial community composition. However, the spiking concentration of 356
phenanthrene just presented marked effect on the community structure in VN only. 357
Figure 2 358
359
3.3 Comparison and difference analysis based on attached surface, spiking concentration 360

19
and incubation time at genus level 361
The bacterial community structures of AP and SM samples at phylum level are shown 362
in Fig. S3. The results reflected that the diversity and evenness of bacterial community 363
on the surface of artificial plant were higher than those on the leaves of submerged 364
macrophytes again. In order to identify and understand the key impact factors (e.g. 365
submerged plants, spiking concentration of and incubation time) on the microorganism 366
composition of biofilm-leaves, Hierarchical clustering analysis, heat map, Kruskal-wallis 367
H test and Wilcoxon rank-sum test were used to analysis and visually show the difference 368
significant of different impact factors. 369
3.3.1 Hierarchical clustering analysis 370
Hierarchical clustering dendrograms were usually used to research the similarity or 371
difference of microbial community composition of different samples. And in our study, 372
they were generated at genus level based on attached surface, spiking concentration and 373
incubation time, respectively. From Fig. 3b, all the samples were separated into two 374
distinct groups: AP and SM. And compared to HV, VN had a stronger influence on 375
bacterial community composition at genus level except for sample 1A. While different 376
spiking concentration of phenanthrene had a weak impact on the bacterial community 377
structures at genus level (Fig. 3c). Moreover, bacterial community structures changed 378
along with incubation time at genus level except for 3A (Fig. 3d). These results were 379
consistent with PCoA. 380
3.3.2 Visual display of difference: Heat maps of bacterial communities 381

20
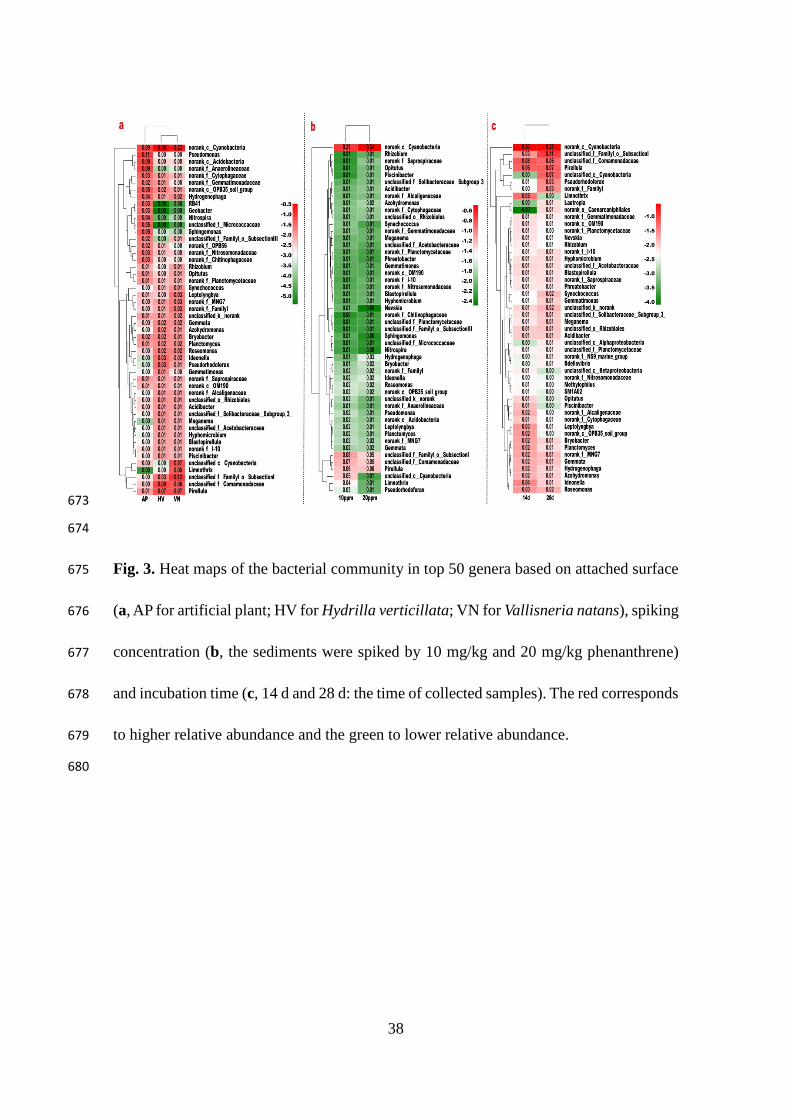
Attached surface, spiking concentration of phenanthrene and incubation time affected 382
bacterial community in one way or another. Heat maps of bacterial communities in top 383
50 genera based on attached surface, spiking concentration and incubation time were 384
drawn to highlight distinctly different specific genera (Fig. 5). Fig. 5a showed that 8 385
genera were abundant in the bacterial community of samples AP, but were rarely 386
identified and appeared in samples SM, including Pseudomonas, 387
norank_c__Acidobacteria, norank_f__Anaerolineaceae, RB1, Geobacter, Nitrospira, 388
unclassified_f__Micrococcaceae and Sphingomonas. Previous studies showed that 389
Pseudomonas and Sphingomonas were PAH-degrading bacteria, and nitrospira sp. was 390
associated with nitrogen cycling. Norank_c__Cyanobacteria, 391
unclassified_f__Comamonadaceae and Pirellua were abundant in samples SM. A few 392
genera were abundant in samples VN, such as unclassified_c__Cyanobacteria, 393
Limnothrix and unclassified_f__FamilyІ_o__ SubsectionІ. 394
Fig. 5b presented unclassified_f__FamilyІ_o__SubsectionІ, unclassified_f__ 395
Comamonadaceae, unclassified_c__Cyanobacteria, Limnothrix and Pseudorhodoferax 396
were observed to be abundant in the lower concentration groups (10 mg/kg), while only 397
one genus, norank_c__Cyanobacteria, was found in abundance among the higher 398
concentration groups (20 mg/kg). 399
Only two genera, Limnothrix and Ideonella, were detected to be abundant in 14 d (Fig. 400
5c), while unclassified_c__Cyanobacteria, Pesudorhodoferax, norank_f__FamilyІ, 401
unclassified_f__FamilyІ_o__SubsectionІ and norank_o__Caenarcaniphilales were 402

21
abundant in 28 d. 403
Figure 3 404
405
3.3.3 Difference significance level analysis: Kruskal-wallis H test and Wilcoxon rank-406
sum test 407
In order to assess the significance level of abundance difference of species and obtain 408
the significantly different species, Kruskal-wallis H test and Wilcoxon rank-sum test were 409
used to identify the difference between the top 60 genera based on attached surface (Fig. 410
6a), and top 15 genera based on spiking concentration of phenanthrene (Fig. 6b) and 411
incubation time (Fig. 6c), respectively. Only five genera including 412
norank_c__Cyanobacteria (p=0.04227), Limnothrix (p=0.04973), norank_f__MNG7 413
(p=0.0197), norank_f__Gemmatimonadaceae (p=0.0379) and 414
unclassified_f__FamilyІ_o__SubsectionⅢ (p=0.01927) presented a significant 415
difference from top 40 genera in Fig. 4a. We observed that norank_c__Cyanobacteria, 416
Limnothrix and unclassified_f__FamilyІ_o__SubsectionⅢ belonged to the phylum of 417
Cyanobacteria, norank_f__MNG7 belonged to the phylum of Proteobacteria, and 418
norank_f__Gemmatimonadaceae belonged to the phylum of Gemmatimonadetes. 419
However, there were 9 genera presented significant difference from the last 15 rare genera 420
in top 60 genera. There was no significant difference between the top 15 genera (Fig 4b). 421
Seen in Fig. 4c, four genera in top 15 genera presented significant difference consisting 422
of Ideonella (p=0.03038), Bryobacter (p=0.03038), Gemmata (p=0.03038) and 423

22
Planctomyces (p=0.03038). Ideonella belonged to the phylum of Proteobacteria, 424
Gemmata and Planctomyces belonged to the phylum of Planctomycetes. These results 425
indicated that attached surface dominating in bacterial community tended to influence the 426
genera with lower relative abundance more than incubation time, while spiking 427
concentration of phenanthrene did not tend to affect the genera significantly. 428
429
Figure 4 430
431
3.4 The influence mechanism of attached surface, spiking concentration and incubation 432
time on microbial community 433
In our present study, SM had a more important role in biofilm establishment than AP. 434
This was most likely related to allelochemicals secreted by submerged macrophytes (e.g. 435
phenolic acids, fatty acids, alkaloids, terpenes and flavonoids) (Weston and Mathesius, 436
2013; Zi et al., 2014), which could restrict the growth of algae, cyanobacteria and 437
heterotrophic bacteria, and affected biofilm composition. In addition, submerged 438
macrophytes not only secreted organic substances to provide carbon source for the 439
microorganisms of the biofilm, but also released oxygen by photosynthesis, which leaded 440
to the change of micro-interfaces environment (e.g. DO, ORP and pH) day and night. 441
These activities also influenced the composition of bacterial communities attached on 442
leaves of submerged plants (Hempel et al., 2009). Of course, the morphological and 443
physiological complexity of submerged macrophytes could provide a diversity of 444

23
microhabitats for organisms to live in (Goldsborough et al., 2005). Several researchers 445
had insisted that periphyton communities correlated with macrophytes were highly host-446
specific (Kahlert and Pettersson, 2002; Wetzel, 1983). 447
The bacterial community was not obviously affected by the phenanthrene spiked in 448
surficial sediments in different concentrations. This might be related to the lower 449
concentration and smaller concentration gradient of phenanthrene on the leaves surface 450
by different migration routine (Fig. 1c). Phenanthrene can transfer in the macrophytes 451
tissues from root to leaves after it is absorbed from sediment; however, this may not be a 452
reliable pathway as phenanthrene translocation from roots to shoots can be limited (Liu 453
et al., 2014), let alone to leaves. An alternative explanation is that phenanthrene is released 454
from sediments into water and then to leaves. Recent studies suggested that phenanthrene 455
could be dissipated by rhizospheric microorganisms or fixed by sediments (He and Chi, 456
2016; He et al., 2016; Liu et al., 2014), and small amounts of phenanthrene were released 457
from sediments due to low solubility in water (1.18 mg/L). In addition, leaves of 458
submerged macrophytes could absorb from or release to overlying water for phenanthrene 459
(Diepens et al., 2014). Thus the contents of phenanthrene accumulated in leaves of 460
submerged macrophytes were rather limited (Fig. 1c and Fig. 1d), making it difficult to 461
change the composition of biofilm. If phenanthrene was directly accumulated by leaves 462
from water, results would be other cases which needed our future study. 463
Incubation time had a marked effect on the bacterial community of biofilm attached on 464
leaves of submerged macrophytes. We attributed this phenomenon to the growth status of 465

24
biofilm possibly (Cai et al., 2013). Several researches suggested that epiphytic microbes 466
were difficult to attach on the healthy leaves (Jennings and Steinberg, 1997; Peterson et 467
al., 2007). And the self-destruction of aged leaves produced plenty of dissolved 468
substances to facilitate the development of epiphytic microbes. Meanwhile, the 469
phenanthrene accumulated in leaves of submerged macrophytes was stable from 14 d to 470
35 d. We did not find out the PAH-degrading bacteria presented significant difference 471
(Fig. 6c), which might be related to the reality that these bacteria did not occupy the 472
dominating positions in nature. In our future study, we will put more emphasis on the 473
ascertaining response of the functional bacteria in the biofilm attached on leaves of 474
submerged macrophytes to organic and high-toxic pollutants like PAHs. 475
4. Conclusions 476
Our study suggested that biofilm-leaves could contribute to remediation of sediment 477
polluted by phenanthrene. Attached surface had an important effect on bacterial 478
community composition of biofilm-leaves/-surface due to the active interface influence 479
of submerged macrophytes. Incubation time changed the bacterial community, which 480
might explain differences in growth and mature state of the biofilm. Phenanthrene spiking 481
concentration in sediment did not appear to markedly influence bacterial community – 482
which may be due to the lower concentration and smaller concentration gradient of 483
phenanthrene on the leaf surfaces. On the whole, phenanthrene concentration spiked in 484
sediment, aquatic plant categories and incubation time affected the bacterial community 485
on biofilm-leaves with varying degrees. 486

25
Acknowledgements 487
This work was supported by the National Natural Science Foundation of China (Grants 488
No. 51879080, 51509129 and 41371307), Natural Science Foundation of Jiangsu 489
Province, China (BK20171435), National Key Research & Development Program of 490
China (No. 2018YFC0407906), the Open Foundation of State Key Laboratory of 491
Pollution Control and Resource Reuse (Grant No. PCRRF12010), the State Key 492
Laboratory of Soil and Sustainable Agriculture (Institute of Soil Science, Chinese 493
Academy of Sciences) foundation (Grant No. 0812201228), a project funded by the 494
Priority Academic Program Development of Jiangsu Higher Education Institutions 495
(PAPD), and the Top-notch Academic Programs Project (TAPP) of Jiangsu Higher 496
Education Institutions. 497
References 498
Agarwal, S., Al-Abed, S.R., Dionysiou, D.D., 2007. In Situ Technologies for 499
Reclamation of PCB-Contaminated Sediments: Current Challenges and Research Thrust 500
Areas. Journal of Environmental Engineering 133, 1075-1078. 501
Bamforth, S.M., Singleton, I., 2010. Bioremediation of polycyclic aromatic 502
hydrocarbons: current knowledge and future directions. Journal of Chemical 503
Technology & Biotechnology 80, 723-736. 504
Cai, X., Gao, G., Tang, X., Dong, B., Dai, J., Chen, D., Song, Y., 2013. The response of 505
epiphytic microbes to habitat and growth status of Potamogeton malaianus Miq. in Lake 506
Taihu. Journal of Basic Microbiology 53, 828–837. 507
Cheema, S.A., Imran, K.M., Shen, C., Tang, X., Farooq, M., Chen, L., Zhang, C., Chen, 508

26
Y., 2010. Degradation of phenanthrene and pyrene in spiked soils by single and 509
combined plants cultivation. Journal of Hazardous Materials 177, 384-389. 510
Chen, M., Xu, P., Zeng, G., Yang, C., Huang, D., Zhang, J., 2015. Bioremediation of 511
soils contaminated with polycyclic aromatic hydrocarbons, petroleum, pesticides, 512
chlorophenols and heavy metals by composting: Applications, microbes and future 513
research needs. Biotechnology Advances 33, 745. 514
Cheng, Z., Hu, X., Sun, Z., 2016. Microbial community distribution and dominant 515
bacterial species analysis in the bio-electrochemical system treating low concentration 516
cefuroxime. Chemical Engineering Journal 303, 137-144. 517
Diepens, N.J., Arts, G.H., Focks, A., Koelmans, A.A., 2014. Uptake, translocation, and 518
elimination in sediment-rooted macrophytes: a model-supported analysis of whole 519
sediment test data. Environmental Science & Technology 48, 12344. 520
Goldsborough, L.G., Mcdougal, R.L., North, A.K., Azim, M.E., Verdegem, M.C.J., Van 521
Dam, A.A., Beveridge, M.C.M., 2005. Periphyton in freshwater lakes and wetlands. 522
Gomes, H.I., Dias-Ferreira, C., Ribeiro, A.B., 2013. Overview of in situ and ex situ 523
remediation technologies for PCB-contaminated soils and sediments and obstacles for 524
full-scale application. Science of the Total Environment 445-446, 237. 525
Hassan, H.M., Castillo, A.B., Yigiterhan, O., Elobaid, E.A., Al-Obaidly, A., Al-Ansari, 526
E., Obbard, J.P., 2018. Baseline concentrations and distributions of Polycyclic Aromatic 527
Hydrocarbons in surface sediments from the Qatar marine environment. Marine 528
Pollution Bulletin 126, 58. 529

27
He, D., Ren, L., Wu, Q., 2012. Epiphytic bacterial communities on two common 530
submerged macrophytes in Taihu Lake: diversity and host-specificity. Chinese journal 531
of oceanology and limnology 30, 237-247. 532
He, Y., Chi, J., 2016. Phytoremediation of sediments polluted with phenanthrene and 533
pyrene by four submerged aquatic plants. Journal of Soils & Sediments Protection Risk 534
Assessment & Rem 16, 309-317. 535
He, Y., Chi, J., Qi, Y., 2016. Response of bacterial community structure to 536
disappearance of phenanthrene and pyrene from sediment with different submerged 537
macrophytes. Ecological Engineering 91, 207-211. 538
Hempel, M., Grossart, H.P., Gross, E.M., 2009. Community composition of bacterial 539
biofilms on two submerged macrophytes and an artificial substrate in a pre-alpine lake. 540
Aquatic Microbial Ecology 58, 79-94. 541
Hussain, J., Zhao, Z., Pang, Y., Xia, L., Hussain, I., Jiang, X., 2016. Effects of Different 542
Water Seasons on the Residual Characteristics and Ecological Risk of Polycyclic 543
Aromatic Hydrocarbons in Sediments from Changdang Lake, China. Journal of 544
Chemistry,2016,(2016-2-11) 2016. 545
Jérôme Cachot, †, Mac Law, Didier Pottier, Laurent Peluhet, Michelle Norris, Hélène 546
Budzinski, A., Richard Winn, 2007. Characterization of Toxic Effects of Sediment-547
Associated Organic Pollutants Using the λ Transgenic Medaka. Environmental Science 548
& Technology 41, 7830-7836. 549
Jennings, J.G., Steinberg, P.D., 1997. Phlorotannins versus Other Factors Affecting 550

28
Epiphyte Abundance on the Kelp Ecklonia radiata. Oecologia 109, 461-473. 551
Jiao, X.C., Xu, F.L., Dawson, R., Chen, S.H., Tao, S., 2007. Adsorption and absorption 552
of polycyclic aromatic hydrocarbons to rice roots. Environmental Pollution 148, 230-553
235. 554
Jones, J.I., Eaton, J.W., Hardwick, K., 2000. The influence of periphyton on boundary 555
layer conditions: a pH microelectrode investigation. Aquatic Botany 67, 191-206. 556
Kahlert, M., Pettersson, K., 2002. The impact of substrate and lake trophy on the 557
biomass and nutrient status of benthic algae. Hydrobiologia 489, 161-169. 558
Kim, H.B., Isaacson, R.E., 2015. The pig gut microbial diversity: Understanding the pig 559
gut microbial ecology through the next generation high throughput sequencing. 560
Veterinary Microbiology 177, 242-251. 561
Li, H., Qu, R., Li, C., Guo, W., Han, X., He, F., Ma, Y., Xing, B., 2014. Selective 562
removal of polycyclic aromatic hydrocarbons (PAHs) from soil washing effluents using 563
biochars produced at different pyrolytic temperatures. Bioresour Technol 163, 193-198. 564
Li, J.H., Guo, H.Y., Wang, X.R., Minghong, W., Wang, S.H., Yin, D.Q., Yin, Y., Zhang, 565
J.F., Munawar, M., 2009. Plant-promoted dissipation of four submerged macrophytes to 566
phenanthrene. Aquatic Ecosystem Health & Management 12, 471-476. 567
Liang, Y., Tse, M.F., Young, L., Wong, M.H., 2007. Distribution patterns of polycyclic 568
aromatic hydrocarbons (PAHs) in the sediments and fish at Mai Po Marshes Nature 569
Reserve, Hong Kong. Water Research 41, 1303. 570
Lin, Y., Deng, W., Li, S., Li, J., Wang, G., Zhang, D., Li, X., 2016. Congener profiles, 571

29
distribution, sources and ecological risk of parent and alkyl-PAHs in surface sediments 572
of Southern Yellow Sea, China. Science of the Total Environment 580, 1309-1317. 573
Liu, H., Meng, F., Tong, Y., Chi, J., 2014. Effect of plant density on phytoremediation of 574
polycyclic aromatic hydrocarbons contaminated sediments with Vallisneria spiralis. 575
Ecological Engineering 73, 380-385. 576
Lu, X.Y., Li, B., Zhang, T., Fang, H.H., 2012. Enhanced anoxic bioremediation of 577
PAHs-contaminated sediment. Bioresource Technology 104, 51-58. 578
Ma, B., Yan, H., Chen, H.H., Xu, J.M., Rengel, Z., 2010. Dissipation of polycyclic 579
aromatic hydrocarbons (PAHs) in the rhizosphere: synthesis through meta-analysis. 580
Environmental Pollution 158, 855-861. 581
Meng, F., Chi, J., 2016. Effect of Potamogeton crispus L. on bioavailability and 582
biodegradation activity of pyrene in aged and unaged sediments. Journal of Hazardous 583
Materials 324. 584
Meng, F., Huang, J., Liu, H., Chi, J., 2015. Remedial effects of Potamogeton crispus L. 585
on PAH-contaminated sediments. Environmental Science & Pollution Research 22, 586
7547-7556. 587
Moscoso, F., Teijiz, I., Deive, F.J., Sanromán, M.A., 2012. Efficient PAHs 588
biodegradation by a bacterial consortium at flask and bioreactor scale. Bioresource 589
Technology 119, 270-276. 590
Pang, S., Zhang, S., Lv, X.Y., Han, B., Liu, K., Qiu, C., Wang, C., Wang, P., Toland, H., 591
He, Z., 2016. Characterization of bacterial community in biofilm and sediments of 592

30
wetlands dominated by aquatic macrophytes. Ecological Engineering 97, 242-250. 593
Perelo, L.W., 2010. Review: In situ and bioremediation of organic pollutants in aquatic 594
sediments. Journal of Hazardous Materials 177, 81. 595
Peterson, B.J., Frankovich, T.A., Zieman, J.C., 2007. Response of seagrass epiphyte 596
loading to field manipulations of fertilization, gastropod grazing and leaf turnover rates. 597
Journal of Experimental Marine Biology & Ecology 349, 61-72. 598
Sandjensen, K., Revsbech, N.P., Jørgensen, B.B., 1985. Microprofiles of oxygen in 599
epiphyte communities on submerged macrophytes. Marine Biology 89, 55-62. 600
Srivastava, J.K., Chandra, H., Kalra, S.J.S., Mishra, P., Khan, H., Yadav, P., 2016. 601
Plant–microbe interaction in aquatic system and their role in the management of water 602
quality: a review. Applied Water Science, 1-12. 603
Tao, S., Jiao, X.C., Chen, S.H., Liu, W.X., Jr, R.M.C., Zhu, L.Z., Luo, Y.M., 2006. 604
Accumulation and distribution of polycyclic aromatic hydrocarbons in rice ( Oryza 605
sativa ). Environmental Pollution 140, 406-415. 606
Vila‐Costa, M., Pulido, C., Chappuis, E., Calviño, A., Casamayor, E.O., Gacia, E., 2016. 607
Macrophyte landscape modulates lake ecosystem‐level nitrogen losses through tightly 608
coupled plant‐microbe interactions. Limnology & Oceanography 61, 78-88. 609
Wang, L.C., Lee, W.J., Lee, W.S., Changchien, G.P., Tsai, P.J., 2003. Characterizing the 610
emissions of polychlorinated dibenzo-p-dioxins and dibenzofurans from crematories 611
and their impacts to the surrounding environment. Environmental Science & 612
Technology 37, 62-67. 613

31
Weston, L.A., Mathesius, U., 2013. Flavonoids: their structure, biosynthesis and role in 614
the rhizosphere, including allelopathy. Journal of Chemical Ecology 39, 283-297. 615
Wetzel, R.G., 1983. Attached algal-substrata interactions: fact or myth, and when and 616
how? Springer Netherlands. 617
Yan, L., Zhang, S., Lin, D., Guo, C., Yan, L., Wang, S., He, Z., 2017. Nitrogen loading 618
affects microbes, nitrifiers and denitrifiers attached to submerged macrophyte in 619
constructed wetlands. Science of the Total Environment 622-623, 121. 620
Yang, Z., Feng, J., Niu, J., Shen, Z., 2008. Release of polycyclic aromatic hydrocarbons 621
from Yangtze River sediment cores during periods of simulated resuspension. 622
Environmental Pollution 155, 366-374. 623
Ying-Heng, F., Baoshan, X., Xiao-Yan, L., 2014. Changes in the adsorption of bisphenol 624
A, 17 α-ethinyl estradiol, and phenanthrene on marine sediment in Hong Kong in 625
relation to the simulated sediment organic matter decomposition. Environmental 626
Pollution 192, 139. 627
Yu, B., Tian, J., Feng, L., 2017. Remediation of PAH polluted soils using a soil 628
microbial fuel cell: Influence of electrode interval and role of microbial community. 629
Journal of Hazardous Materials 336, 110. 630
Zhang, S., Pang, S., Wang, P., Wang, C., Guo, C., Addo, F.G., Li, Y., 2016. Responses of 631
bacterial community structure and denitrifying bacteria in biofilm to submerged 632
macrophytes and nitrate. Scientific Reports 6. 633
Zhao, D., Wang, S., Huang, R., Zeng, J., Huang, F., Yu, Z., 2017. Diversity and 634

32
composition of bacterial community in the rhizosphere sediments of submerged 635
macrophytes revealed by 454 pyrosequencing. Annals of Microbiology 67, 313-319. 636
Zhao, Z., Jiang, Y., Xia, L., Mi, T., Yan, W., Gao, Y., Jiang, X., Fawundu, E., Hussain, 637
J., 2014. Application of canonical correspondence analysis to determine the ecological 638
contribution of phytoplankton to PCBs bioaccumulation in Qinhuai River, Nanjing, 639
China. Environmental Science & Pollution Research International 21, 3091-3103. 640
Zhao, Z., Xia, L., Jiang, X., Gao, Y., 2018. Effects of water-saving irrigation on the 641
residues and risk of polycyclic aromatic hydrocarbon in paddy field. Science Of The 642
Total Environment 618, 736-745. 643
Zi, J., Mafu, S., Peters, R.J., 2014. To Gibberellins and Beyond! Surveying the 644
Evolution of (Di)Terpenoid Metabolism. Annual Review of Plant Biology 65, 259. 645
646
647

33
Table 1. Microbial diversity indices in all ten samples 648
Samples
NO
Phe
Conc.
mg/kg
Sampling
Time
Submerged
plants
ACE Chao 1 Shannon Simpson Coverage
(%)
1A 20 14d VN 1535 1526 5.24 0.0156 98.8
2A 20 HV 1561 1593 5.08 0.0254 98.8
3A 10 VN 1551 1617 5.11 0.0240 98.7
4A 10 HV 1591 1621 5.39 0.0129 98.8
1B 20 28d VN 1568 1590 5.11 0.0236 98.8
2B 20 HV 1451 1550 4.90 0.0407 98.9
3B 10 VN 1894 1694 4.00 0.0761 98.5
4B 10 HV 1262 1265 4.94 0.0213 99.0
1C 20 28d AP 3916 3823 6.53 0.0053 96.7
2C 10 AP 4070 4036 6.63 0.0061 96.6
Note: VN: Vallisneria natans; HV: Hydrilla verticillata; AP: artificial plants 649
650

34
651
652
35
653
Fig. 1. The residual characteristics of phenanthrene in sediment (a), in water (b), in leaves 654
of VN and HV (c). The dissipation percentage in sediment of VN, HV, AP and CG system, 655
ecological contribution index (ECI) of VN, HV-rhizosphere and AP-biofilm (d). The 20 656
mg/kg and 10 mg/kg of phenanthrene concentrations were spiked in sediment initially, 657
respectively. (CG: control group; AP: artificial plant; HV: Hydrilla verticillata; VN: 658
Vallisneria natans. 14A: 14 d-20 ppm; 14B: 14 d-10 ppm; 28A: 28 d-20 ppm; 28 B: 28 659
d-10 ppm; 35A: 35 d-20 ppm; 35B: 35 d-10 ppm.) 660
661

36
662

37
663
664
Fig. 2. a: Principal coordinates analysis (PCoA) using Bray-Curtis distances for all the 665
samples on OTU level; b, c and d: Hierarchical clustering tree using average linkage 666
between samples at genus level based on attached surface (b), spiking concentration of 667
phenanthrene in sediment (c, 10 mg/kg and 20 mg/kg) and incubation time (d, 14 d and 668
28 d: the time of collected samples), respectively. (VN for Vallisneria natans; HV for 669
Hydrilla verticillata; SM means submerged macrophytes for VN+ HV; AP for artificial 670
plants) 671
672
38
673
674
Fig. 3. Heat maps of the bacterial community in top 50 genera based on attached surface 675
(a, AP for artificial plant; HV for Hydrilla verticillata; VN for Vallisneria natans), spiking 676
concentration (b, the sediments were spiked by 10 mg/kg and 20 mg/kg phenanthrene) 677
and incubation time (c, 14 d and 28 d: the time of collected samples). The red corresponds 678
to higher relative abundance and the green to lower relative abundance. 679
680

39
681
682
Fig. 4. Difference test between genera based on attached surface (a, AP for artificial plant; 683
HV for Hydrilla verticillata; VN for Vallisneria natans; N(RHA) means the number of 684
species with relative high abundance; N(RLA) means the number of species with relative 685
low abundance), spiking concentration (b, the sediments were spiked by 10 mg/kg and 686
20 mg/kg phenanthrene) and incubation time (c, 14 d and 28 d: the time of collected 687
samples) . 688
Notes: “*” denotes differences were statistically significant (p < 0.05) 689
690