AARTI INDUSTRIES LTD… · In Dec 2017, AIL signed Rs. 100,000 mn multi‐year, exclusive supply...
14
Document code: FOTL_051120184_2 Copyright © 2016 Firstobject Technologies Ltd. All rights reserved AARTI INDUSTRIES LTD Result Update (PARENT BASIS): Q2 FY19 CMP: 1383.75 NOV 5 th , 2018 Overweight ISIN: INE769A01020 Index Details SYNOPSIS Aarti Industries (AIL) is one of the most competitive benzene‐based speciality chemical companies in the world. The company achieved a turnover of Rs. 12995.20 mn for Q2 FY19 up by 46.36% as against Rs. 8878.90 mn in the corresponding quarter of the previous year. EBITDA was Rs. 2423.30 mn in Q2 FY19 as against Rs. 1603.90 mn in the corresponding period of last year, up by 51.09%. Profit before tax (PBT) stood at Rs. 1521.70 mn in Q2 FY19 compared to Rs. 960.10 mn in Q2 FY18. In Q2 FY19, net profit stood at Rs. 1229.20 mn as compared to Rs. 785.10 mn in Q2 FY18, grew by 56.57%. The company has reported an EPS of Rs. 15.12 for the 2 nd quarter as against of Rs. 9.56 in the corresponding quarter of the previous year. Gross Income from Operations registered a growth of 41.6% at Rs. 23779.90 mn in H1 FY19 as against Rs. 16797.00 mn in H1 FY18. During H1 FY19, Exports of the company increased by 12.1% at Rs. 8674.5 mn against Rs. 4126.3 mn in corresponding previous half year period. PAT of the company for H1 FY19 registered a growth of 49.9% at Rs. 2121.90 mn as against Rs. 1415.60 mn in H1 FY18. Specialty Chemicals Segment of the company achieved a revenue growth of 43.36% at Rs. 18880.0 mn in H1 FY19 as compared to Rs. 13170.0 mn in H1 FY18 with a volume growth of 10%. Revenue from Home & Personal Care Segment increased to Rs. 149.0 mn in H1 FY19 as against Rs. 120.0 mn in the corresponding previous year, up by 24.17%. Net Sales and PAT of the company is expected to grow at a CAGR of 18% and 19% over 2017 to 2020E, respectively. Stock Data Sector Commodity Chemicals BSE Code 524208 Face Value 5.00 52wk. High / Low (Rs.) 1434.95/851.00 Volume (2wk. Avg.) 3556 Market Cap (Rs. in mn.) 112498.88 Annual Estimated Results(A*: Actual / E*: Estimated) Years(Rs in mn) FY18A FY19E FY20E Net Sales 36993.10 48830.89 57620.45 EBITDA 6588.60 9051.47 10595.15 Net Profit 3164.40 4381.18 5089.37 EPS 38.92 53.89 62.60 P/E 35.55 25.68 22.10 Shareholding Pattern (%) As on Sep 2018 As on June 2018 PROMOTER 53.00 53.07 PUBLIC 47.00 46.93 OTHERS -- -- 1 Year Comparative Graph AARTI INDUSTRIES LTD S&P BSE SENSEX PEER GROUPS CMP MARKET CAP EPS(TTM) P/E (X)(TTM) P/BV(X) DIVIDEND Company Name (Rs.) Rs. in mn. (Rs.) Ratio Ratio (%) Aarti Industries Ltd 1383.75 112498.88 47.40 29.19 7.42 20.00 Deepak Fertz. & Petrochem Ltd 209.00 18434.80 20.02 10.44 0.88 60.00 GHCL Ltd 215.50 21120.80 27.37 7.87 1.30 50.00 Bhageria Industries Ltd 301.00 6568.40 32.68 9.21 2.20 110.00
Transcript of AARTI INDUSTRIES LTD… · In Dec 2017, AIL signed Rs. 100,000 mn multi‐year, exclusive supply...

Document code: FOTL_051120184_2 Copyright © 2016 Firstobject Technologies Ltd. All rights reserved
AARTI INDUSTRIES LTDResult Update (PARENT BASIS): Q2 FY19
CMP: 1383.75 NOV 5th, 2018
Overweight ISIN:INE769A01020
Index Details SYNOPSIS Aarti Industries (AIL) is one of the most competitive
benzene‐based speciality chemical companies in theworld.
The company achieved a turnover of Rs. 12995.20 mnfor Q2 FY19 up by 46.36% as against Rs. 8878.90 mnin the corresponding quarter of the previous year.
EBITDA was Rs. 2423.30 mn in Q2 FY19 as againstRs. 1603.90 mn in the corresponding period of lastyear, up by 51.09%.
Profit before tax (PBT) stood at Rs. 1521.70 mn in Q2FY19 compared to Rs. 960.10 mn in Q2 FY18.
In Q2 FY19, net profit stood at Rs. 1229.20 mn ascompared to Rs. 785.10 mn in Q2 FY18, grew by56.57%.
The company has reported an EPS of Rs. 15.12 for the2nd quarter as against of Rs. 9.56 in the correspondingquarter of the previous year.
Gross Income from Operations registered a growth of41.6% at Rs. 23779.90 mn in H1 FY19 as against Rs.16797.00 mn in H1 FY18.
During H1 FY19, Exports of the company increased by12.1% at Rs. 8674.5 mn against Rs. 4126.3 mn incorresponding previous half year period.
PAT of the company for H1 FY19 registered a growthof 49.9% at Rs. 2121.90 mn as against Rs. 1415.60 mnin H1 FY18.
Specialty Chemicals Segment of the company achieveda revenue growth of 43.36% at Rs. 18880.0 mn in H1FY19 as compared to Rs. 13170.0 mn in H1 FY18 witha volume growth of 10%.
Revenue from Home & Personal Care Segmentincreased to Rs. 149.0 mn in H1 FY19 as against Rs.120.0 mn in the corresponding previous year, up by24.17%.
Net Sales and PAT of the company is expected to growat a CAGR of 18% and 19% over 2017 to 2020E,respectively.
Stock DataSector Commodity ChemicalsBSE Code 524208Face Value 5.0052wk. High / Low (Rs.) 1434.95/851.00Volume (2wk. Avg.) 3556Market Cap (Rs. in mn.) 112498.88
Annual Estimated Results(A*: Actual / E*: Estimated)Years(Rs in mn) FY18A FY19E FY20ENet Sales 36993.10 48830.89 57620.45EBITDA 6588.60 9051.47 10595.15Net Profit 3164.40 4381.18 5089.37EPS 38.92 53.89 62.60P/E 35.55 25.68 22.10
Shareholding Pattern (%)
As on Sep 2018 As on June 2018
PROMOTER 53.00 53.07
PUBLIC 47.00 46.93
OTHERS -- --
1 Year Comparative Graph
AARTI INDUSTRIES LTD S&P BSE SENSEX
PEER GROUPS CMP MARKET CAP EPS(TTM) P/E (X)(TTM) P/BV(X) DIVIDEND
Company Name (Rs.) Rs. in mn. (Rs.) Ratio Ratio (%)Aarti Industries Ltd 1383.75 112498.88 47.40 29.19 7.42 20.00Deepak Fertz. & Petrochem Ltd 209.00 18434.80 20.02 10.44 0.88 60.00GHCL Ltd 215.50 21120.80 27.37 7.87 1.30 50.00Bhageria Industries Ltd 301.00 6568.40 32.68 9.21 2.20 110.00

Document code: FOTL_051120184_2 Copyright © 2016 Firstobject Technologies Ltd. All rights reserved
QUARTERLY HIGHLIGHTS (PARENT BASIS)
Results updates- Q2 FY19,
(Rs in million) Sep-18 Sep-17 % Change
Revenue 12995.20 8878.90 46.36%
Net Profit 1229.20 785.10 56.57%
EPS 15.12 9.56 58.15%
EBITDA 2423.30 1603.90 51.09%
The company has achieved a turnover of Rs. 12995.20 million for the 2nd quarter of the financial year 2018-19 as against
Rs. 8878.90 million in the corresponding quarter of the previous year, rose by 46.36%. EBITDA of Rs. 2423.30 million in
Q2 FY19 as against Rs. 1603.90 million in the corresponding period of last year. In Q2 FY19, net profit registered at Rs.
1229.20 million as compared to Rs. 785.10 million in Q2 FY18, up by 56.57%. The company has reported an EPS of Rs.
15.12 for the 2nd quarter as against Rs. 9.56 in the corresponding quarter of the previous year.
Break up of Expenditure
Break up ofExpenditure
Value in Rs. Million
Q2 FY19 Q2 FY18 %Change
Cost of MaterialsConsumed 7982.20 4807.40 66%
Purchases of Stock inTrade 249.50 270.90 -8%
Employee BenefitsExpenses 528.50 414.10 28%
Depreciation &AmortizationExpenses
38.50 330.00 -88%
Other Expenses 2103.30 1639.20 28%

Document code: FOTL_051120184_2 Copyright © 2016 Firstobject Technologies Ltd. All rights reserved
Segment Revenue
Multi-year deals:
In June 2017, AIL signed Rs. 40,000 mn multi‐year deal with a Global Agriculture Company for supply of a high
value agrochemical intermediary, for use in herbicides, over a 10‐year period
The supplies are expected to commence from FY20 and would generate expected revenues of approximately Rs. 4000
mn over the contract term.
The project will entail investment of about Rs. 4000 mn (approximately USD 62 mn) by AIL
In Dec 2017, AIL signed Rs. 100,000 mn multi‐year, exclusive supply contract with a leading global chemical congl
omerate over a 20‐year period
The supplies are expected to commence from 2020. AIL is set to enter a new chemistry range, first of its kind in India;
and its end product is amongst the major growth initiatives for the customer.
AIL will be investing $35‐40 mn to setup dedicated large scale manufacturing facility for production of this speciality
chemical intermediate, and will be built on the basic technology package received from the customer.
The customer shall provide $42 mn as an advance to AIL in installments, to be adjusted against supplies in the future.
This advance will help reduce the net capital employed enabling higher ROCE for this project.
Q2 FY19 Highlights:
Financial:
Capex of the company registered at Rs. 3320 mn as on 31st Sep 2018 for half year period.
Exports of the company registered a growth of 14.2% at Rs. 4713.70 mn as compared to Rs. 4126.3 mn in Q2 FY18.
Document code: FOTL_051120184_2 Copyright © 2016 Firstobject Technologies Ltd. All rights reserved
The Company had further provided for Revaluation loss on long term borrowing (ECBs) to the extent of Rs. 90.9 mn
as at 30th September, 2018. This loss has been provided under Finance Costs.
H1 FY19 Highlights:
Gross Income from Operations registered a growth of 41.6% at Rs. 23779.90 mn in H1 FY19 as against Rs. 16797.00
mn in H1 FY18.
During H1 FY19, Exports of the company increased by 12.1% at Rs. 8674.5 mn against Rs. 4126.3 mn in
corresponding previous half year period.
PAT of the company for H1 FY19 registered a growth of 49.9% at Rs. 2121.90 mn as against Rs. 1415.60 mn in H1
FY18.
Segment Revenue:
Specilality Chemicals:
Specilaity Chemicals Segment of the company achieved a revenue growth of 43.36% at Rs. 18880.0 mn in H1 FY19
as compared to Rs. 13170.0 mn in H1 FY18 with a volume growth of 10%.
Revenue of the specilaity chemicals registered a growth of 50.36% at Rs. 10391.0 mn in Q2 FY19 as against Rs.
6909.8 mn in Q2 FY18.
EBIT of the company for H1 FY19 increased by Rs. 3580 mn as against Rs. 2420 mn in H1 FY18.
During Q2 FY19, EBIT of the company increased by Rs. 210 mn as against Rs. 129 mn in Q2 FY18.
Pharma & HPC:
Revenue from Home & Personal Care Segemnt increased to Rs. 149 mn in H1 FY19 as against Rs. 120 mn in the
corresponding previous year, up by 24.17%.
During Q2 FY19, Revenue increased to Rs. 68 mn as compared to Rs. 60 mn in Q2 FY18.
Pharmaceuticals Revenue rose by 40.74% at Rs. 342 mn in H1 FY19 as against Rs. 243 in H1 FY18.
During Q2 FY19, revenue stood at Rs. 192 mn as compared to Rs. 137 mn in Q2 FY18.

Document code: FOTL_051120184_2 Copyright © 2016 Firstobject Technologies Ltd. All rights reserved
COMPANY PROFILE
Aarti Industries (AIL) is one of the most competitive benzene‐based speciality chemical companies in the world. AIL is a
rare instance of a global speciality chemicals company that combines process chemistry competence (recipe focus) with
scale‐up engineering competence (asset utilization). Over the last decade, AIL has transformed from an Indian company
servicing global markets to what is fundamentally a global company selecting to manufacture out of India. The Company
globally ranks at 1st – 4th position for 75% of its portfolio and is “Partner of Choice” for various Major Global &
Domestic Customers.
AIL has de‐risked portfolio that is multi‐product, multi‐geography, multi‐customer and multi industry. AIL has 125+
products, 500+ domestic customers, 150+ export customers spread across the globe in 60 countries with major presence in
USA, Europe, Japan. AIL serves leading consumers across the globe of Speciality Chemicals and Intermediate for
Pharmaceuticals, Agro Chemicals, Polymers, Pigments, Printing Inks, Dyes, Fuel additives, Aromatics, Surfactants and
various other speciality chemicals.
AIL is committed to Safety Health & Equipment Quality with environment polices mapped to global benchmarks
ensuring customer confidence and business sustainability. The Company has 4 Zero Discharge units and a strong focus on
Reduce‐Reuse‐Recover across its 16manufacturing sites.
AIL is a responsible corporate citizen engaged in community welfare through associated trusts (Aarti Foundation and
Dhanvallabh Charitable Trust) as well as focused NGOs engaged in diverse social causes.
Over the years, AIL has received multiple awards and recognitions. CHEMEXCIL presented the Company ‘Trishul
Award’ for outstanding export performance for FY14‐15 and ‘Award of Excellency’ for the consistency in export
performance for FY13‐14. CHEMTECH Foundation accorded AIL with the ‘Outstanding Achievement for Innovation’
award for the company’s commendable efforts in conserving the environments as well as ensuring sustainable growth
through path breaking innovation. Indian Institute of Chemical Engineers bestowed the prestigious Lala Shriram National
Award for ‘Leadership in Chemical Industry’ to Chairman Emeritus and founder Shri Chandrakant V. Gogri.

Document code: FOTL_051120184_2 Copyright © 2016 Firstobject Technologies Ltd. All rights reserved
FINANCIAL HIGHLIGHT (PARENT BASIS) (A*- Actual, E* -Estimations & Rs. In Millions)
Balance Sheet as of March 31, 2017 -2020E
FY17A FY18A FY19E FY20E
ASSETS1) Non-Current Assets
a) Property, plant and equipment 15648.70 18429.80 19719.89 20903.08b) Capital Work in Progress 2667.90 4311.80 6122.76 8265.72c) Other Intangible Assets 17.00 13.00 10.66 9.06d) Financial Assets
i) Investments 617.00 559.00 614.90 664.09e) Other Non Current Assets 1672.60 2170.10 2604.12 3072.86Sub - Total Non- Current Assets 20623.20 25483.70 29072.32 32914.81
2) Current Assetsa) Inventories 5465.90 6867.50 7897.63 9003.29b) Financial assets
i) Trade Receivables 5473.70 6392.30 6903.68 7317.91ii) Cash and Cash equivalents 5.40 4.80 3.60 3.06iii) Bank Balances other than Cash 211.00 234.50 586.25 750.40iv) Loans & Advances 1424.60 1947.60 1363.32 1158.82
c) Other Current Assets 205.10 244.60 305.75 360.79Sub - Total Current Assets 12785.70 15691.30 17060.23 18594.26
Total Assets (1+2) 33408.90 41175.00 46132.55 51509.08EQUITY AND LIABILITIES1) EQUITY
a) Equity Share Capital 410.60 406.50 406.50 410.60b) Other Equity 12690.40 14745.20 19126.38 24215.75
Total Equity 13101.00 15151.70 19532.88 24626.352) Non Current Liabilities
a) Financial Liabilitiesi) Borrowings 5956.00 8974.30 7897.38 7265.59
b) Deferred Tax Liabilities (net) 1419.50 1593.60 1721.09 1841.56Sub - Total Non Current Liabilities 7375.50 10567.90 9618.47 9107.16
3) Current Liabilitiesa) Financial liabilities
i) Borrowings 8223.40 9868.30 11148.36 11691.47ii) Trade Payables 2948.70 3466.00 3119.40 2901.04
b) Other Current Liabilities 1522.50 1846.20 2400.06 2832.07c) Provisions 237.80 274.90 313.39 350.99Sub - Total Current Liabilities 12932.40 15455.40 16981.21 17775.58
Total Equity and Liabilities (1+2+3) 33408.90 41175.00 46132.55 51509.08
Document code: FOTL_051120184_2 Copyright © 2016 Firstobject Technologies Ltd. All rights reserved
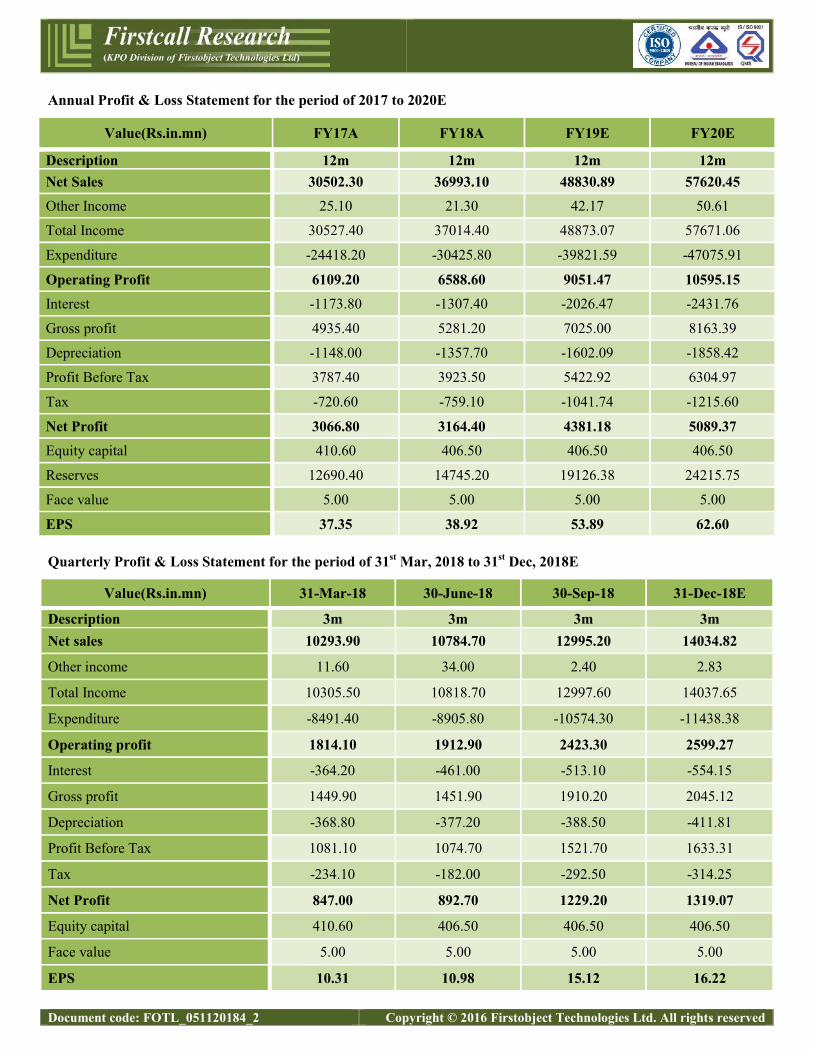
Annual Profit & Loss Statement for the period of 2017 to 2020E
Value(Rs.in.mn) FY17A FY18A FY19E FY20E
Description 12m 12m 12m 12mNet Sales 30502.30 36993.10 48830.89 57620.45Other Income 25.10 21.30 42.17 50.61
Total Income 30527.40 37014.40 48873.07 57671.06
Expenditure -24418.20 -30425.80 -39821.59 -47075.91
Operating Profit 6109.20 6588.60 9051.47 10595.15Interest -1173.80 -1307.40 -2026.47 -2431.76
Gross profit 4935.40 5281.20 7025.00 8163.39
Depreciation -1148.00 -1357.70 -1602.09 -1858.42
Profit Before Tax 3787.40 3923.50 5422.92 6304.97
Tax -720.60 -759.10 -1041.74 -1215.60
Net Profit 3066.80 3164.40 4381.18 5089.37Equity capital 410.60 406.50 406.50 406.50
Reserves 12690.40 14745.20 19126.38 24215.75
Face value 5.00 5.00 5.00 5.00
EPS 37.35 38.92 53.89 62.60
Quarterly Profit & Loss Statement for the period of 31st Mar, 2018 to 31st Dec, 2018E
Value(Rs.in.mn) 31-Mar-18 30-June-18 30-Sep-18 31-Dec-18E
Description 3m 3m 3m 3mNet sales 10293.90 10784.70 12995.20 14034.82
Other income 11.60 34.00 2.40 2.83
Total Income 10305.50 10818.70 12997.60 14037.65
Expenditure -8491.40 -8905.80 -10574.30 -11438.38
Operating profit 1814.10 1912.90 2423.30 2599.27
Interest -364.20 -461.00 -513.10 -554.15
Gross profit 1449.90 1451.90 1910.20 2045.12
Depreciation -368.80 -377.20 -388.50 -411.81
Profit Before Tax 1081.10 1074.70 1521.70 1633.31
Tax -234.10 -182.00 -292.50 -314.25
Net Profit 847.00 892.70 1229.20 1319.07
Equity capital 410.60 406.50 406.50 406.50
Face value 5.00 5.00 5.00 5.00
EPS 10.31 10.98 15.12 16.22

Document code: FOTL_051120184_2 Copyright © 2016 Firstobject Technologies Ltd. All rights reserved
Ratio Analysis
Particulars FY17A FY18A FY19E FY20E
EPS (Rs.) 37.35 38.92 53.89 62.60
EBITDA Margin (%) 20.03% 17.81% 18.54% 18.39%
PBT Margin (%) 12.42% 10.61% 11.11% 10.94%
PAT Margin (%) 10.05% 8.55% 8.97% 8.83%
P/E Ratio (x) 37.05 35.55 25.68 22.10
ROE (%) 23.41% 20.88% 22.43% 20.67%
ROCE (%) 18.19% 15.39% 19.31% 20.05%
Debt Equity Ratio 1.08 1.24 0.98 0.77
EV/EBITDA (x) 20.89 19.90 14.47 12.34
Book Value (Rs.) 159.53 186.37 240.26 302.86
P/BV 8.67 7.42 5.76 4.57
Charts

Document code: FOTL_051120184_2 Copyright © 2016 Firstobject Technologies Ltd. All rights reserved
OUTLOOK AND CONCLUSION
At the current market price of Rs. 1383.75, the stock P/E ratio is at 25.68 x FY19E and 22.10 x FY20E respectively.
Earning per share (EPS) of the company for the earnings for FY19E and FY20E is seen at Rs. 53.89 and Rs. 62.60
respectively.
Net Sales and PAT of the company are expected to grow at a CAGR of 18% and 19% over 2017 to 2020E,
respectively.
On the basis of EV/EBITDA, the stock trades at 14.47 x for FY19E and 12.34 x for FY20E.
Price to Book Value of the stock is expected to be at 5.76 x and 4.57 x for FY19E and FY20E respectively.
Hence, we say that, we are Overweight in this particular scrip for Medium to Long term investment.
INDUSTRY OVERVIEW
Speciality Chemicals are known for end-use performance enhancing applications rather than their composition. They are
recognised for “what they do” rather than “what they are” as in the case of basic chemicals. They provide solutions to
customer applications are knowledge-based and are known to deliver more financial returns as compared to basic
chemicals. They are a blend of base chemicals and sold on the basis of their quality or utility, rather than product
composition or brand. They are relatively high value, but low volume chemicals as compared with basic chemicals or
commodity chemicals.
Since speciality chemicals are mainly used to add value to the finished product, they are primarily sold on a B2B
(Business to Business) basis. Speciality chemicals can be further divided into various sub-segments on the basis of end-
use applications. The major sub-segments are 1) Agro-chemicals, 2) Colourants, 3) Construction chemicals, 4) Flavours &

Document code: FOTL_051120184_2 Copyright © 2016 Firstobject Technologies Ltd. All rights reserved
Fragrances, 5) Paints & Coatings, 6) Personal care, 7) Polymer & additives, 8) Surfactants, 9) Textile chemicals, and 10)
Water treatment chemicals.
While each sub segments have its own rationale for demand and growth, a higher growth is expected in the fields of
Agrochemicals, Water treatment chemicals, Polymer additives and Construction chemicals.
Global Speciality Chemicals market:
Over the past few decades, various countries has led the speciality chemicals business at different time periods. US led the
industry after World War II until the late 1980s, manufacturing chemicals for use in oil field services, electronics, plastics,
etc. Gradually, Europe took over and dominated the business mainly through exports, while the US and Japan remained
key producers. However, with trade liberalisation, technology transfer, reduction in economic barriers and rapid economic
growth in developing countries, the speciality chemicals industry expanded rapidly in Asia, with China contributing a
major part of this expansion. The high growth seen in China’s speciality chemicals industry may be attributed to low
labour costs, low energy and regulatory costs (compared to developed markets) and a highly-developed basic chemicals
segment. Although, China has witnessed strong growth in the speciality chemicals segment, significant regulatory issues
by way of higher pollution, labour reforms, etc. has increased the costs in China. India, on the other hand, would be able
to emerge as a fast-growing speciality chemicals hub on account of its low capital and operating cost competencies,
availability of feed stock and skilled manpower, better manufacturing standards and compliance of regulatory
frameworks, stronger IP protection, etc.
As per Grand View Research, the global speciality chemicals market was estimated at US$ 1.16 Tn in 2016 and is
expected to grow at a CAGR of 5.6% over 2017 to 2025, to reach US$ 1.79 Tn by 2025. Globally, speciality chemicals
are driven by extensive product research and innovation, which is a significant differentiator over the commoditized
chemical industry. Low cost labour and vast raw material resources are contributing to the increased growth in the Asia-
Pacific region, as foreign players are investing in emerging nations.
Gradual shift in preference as a major chemical supplier from China to India:
The Speciality Chemicals manufacturers in China are facing raw material shortage, rising energy costs, higher labour
costs and incremental effluent treatment and compliance charges. China’s weaker cost competitiveness in international
trade and product disruption due to wheeling of large manufacturing plants are contributing to slowdown in the Chinese
chemicals industry and its exports. India, a known alternative hub for chemicals could bag a multi-year exports
opportunity. China’s prolonged self-imposed slowdown offers a much longer window of at least a few years for Indian
chemicals peers to establish themselves in the international market by building global clients and ultimately tapping the
export opportunity.
Indian Speciality Chemicals market:
India is the 6th largest producer and the 6th largest consumer of chemicals worldwide. The Speciality Chemicals industry
in India represents a US$ 25 Bn market, growing at 14% over the last five years led by domestic consumption, growing
faster than the chemical sector as a whole. The industry serves both the local market and the global market. The key

Document code: FOTL_051120184_2 Copyright © 2016 Firstobject Technologies Ltd. All rights reserved
speciality segments in India are agrochemicals, paints, coating and construction chemicals, colourants, fine chemicals,
personal care chemicals and aroma chemicals. The critical success factors for most of the speciality chemical segments
include understanding of customer needs and product/application development to meet the same at a favourable price-
performance ratio. Global firms are gradually facing the heat of compliance, cost and capacity issues in other markets,
especially China, and are thus looking to outsource their manufacturing processes to India. The structural shift towards
Indian speciality chemical players is ably supported by the Government in the form of a robust patent framework, the
presence of appropriate regulations to protect intellectual capital, improvement in infrastructure and thrusts to promote
investments in R&D, as well as green technologies and a rich pool of knowledge workers.
Opportunity and outlook:
India has remained in China’s shadow for a long time in the global chemical speciality market. However, gradually it is
emerging out of with its own structural benefits and the spillover effect of China’s declining competitiveness. The factors
driving the growth of the speciality chemicals market include large base of end-use industries, high demand from Asia-
Pacific, increasing demand from automotive industry, and technological advancements. Over and above, faster end-use
industry growth, low penetration of speciality chemicals in India will support growth. Exponential growth expectations
led by favourable macro-economic factors in pharmaceutical, personal and home care products also presents a humungous
growth opportunity for associated speciality chemicals manufacturers. According to TSMG-FICCI, speciality chemicals
industry could grow 13%, leading to a market size of US$ 52 Bn by 2020.

Document code: FOTL_051120184_2 Copyright © 2016 Firstobject Technologies Ltd. All rights reserved
Disclosure Section
The information and opinions in Firstcall Research was prepared by our analysts and it does not constitute an offer orsolicitation for the purchase or sale of any financial instrument including any companies scrips or this is not an officialconfirmation of any transaction. The information contained herein is from publicly available secondary sources and dataor other secondary sources believed to be reliable but we do not represent that it is accurate or complete and it should notbe relied on as such. Firstcall Research or any of its affiliates shall not be in any way responsible for any loss or damagethat may arise to any person from any inadvertent error in the information contained in this report. Firstcall Research and/or its affiliates and/or employees will not be liable for the recipients’ investment decision based on this document.
Analyst Certification
The following analysts hereby state that their views about the companies and sectors are on best effort basis to the best oftheir knowledge. Unless otherwise stated, the individuals listed on the cover page of this report are research analysts. Theanalyst qualifications, sectors covered and their exposure if any are tabulated hereunder:
Name of the Analyst Qualifications SectorsCovered
Exposure/Interest tocompany/sector UnderCoverage in the CurrentReport
Dr.C.V.S.L. Kameswari M.Sc, PGDCA,M.B.A,Ph.D (Finance)
Pharma &Diversified
No Interest/ Exposure
U. Janaki Rao M.B.A CapitalGoods
No Interest/ Exposure
B. Anil Kumar M.B.A Auto, IT &FMCG
No Interest/ Exposure
V. Harini Priya M.B.A Diversified No Interest/ ExposureB. Srikanth M.B.A Diversified No Interest/ Exposure
Important Disclosures on Subject Companies
In the next 3 months, neither Firstcall Research nor the Entity expects to receive or intends to seek compensation for anyservices from the company under the current analytical research coverage. Within the last 12 months, Firstcall Researchhas not received any compensation for its products and services from the company under the current coverage. Within thelast 12 months, Firstcall Research has not provided or is providing any services to, or has any client relationship with, thecompany under current research coverage.
Within the last 12 months, Firstcall Research has neither provided or is providing any services to and/or in the past has notentered into an agreement to provide services or does not have a client relationship with the company under the researchcoverage.
Certain disclosures listed above are also for compliance with applicable regulations in various jurisdictions. FirstcallResearch does not assign ratings of Buy, Hold or Sell to the stocks we cover. Overweight, Equal-weight, No-Weight andUnderweight are not the equivalent of buy, hold and sell. Investors should carefully read the definitions of all weightsused in Firstcall Research. In addition, since Firstcall Research contains more complete information concerning theanalyst's views, investors should carefully read Firstcall Research, in its entirety, and not infer the contents from theweightages assigned alone. In any case, weightages (or research) should not be used or relied upon as investment advice.An investor's decision to buy or sell should depend on individual circumstances (such as the investor's own discretion, hisability of understanding the dynamics, existing holdings) and other considerations.

Document code: FOTL_051120184_2 Copyright © 2016 Firstobject Technologies Ltd. All rights reserved
Analyst Stock Weights
Overweight (O): The stock's total return is expected to exceed the average total return of the analyst's industry (orindustry team's) coverage universe, on a risk-adjusted basis, over the next 12-18 months.
Equal-weight (E): The stock's total return is expected to be in line with the average total return of the analyst's industry(or industry team's) coverage universe, on a risk-adjusted basis, over the next 12-18 months.
No-weight (NR): Currently the analyst does not have adequate conviction about the stock's total return relative to theaverage total return of the analyst's industry (or industry team's) coverage universe, on a risk-adjusted basis, over the next12-18 months.
Underweight (U): The stock's total return is expected to be below the average total return of the analyst's industry (orindustry team's) coverage universe, on a risk-adjusted basis, over the next 12-18 months.
Unless otherwise specified, the weights included in Firstcall Research does not indicate any price targets. The statisticalsummaries of Firstcall Research will only indicate the direction of the industry perception of the analyst and theinterpretations of analysts should be seen as statistical summaries of financial data of the companies with perceivedindustry direction in terms of weights.
Firstcall Research may not be distributed to the public media or quoted or used by the public media without the expresswritten consent of Firstcall Research. The reports of Firstcall Research are for Information purposes only and is not to beconstrued as a recommendation or a solicitation to trade in any securities/instruments. Firstcall Research is not abrokerage and does not execute transactions for clients in the securities/instruments.
Firstcall Research - Overall StatementS. No Particulars Remarks1 Comments on general trends in the securities market Full Compliance in Place2 Discussion is broad based and also broad based indices Full Compliance in Place3 Commentaries on economic, political or market conditions Full Compliance in Place4 Periodic reports or other communications not for public appearance Full Compliance in Place
5 The reports are statistical summaries of financial data of the companies as and whereapplicable
Full Compliance in Place
6 Analysis relating to the sector concerned Full Compliance in Place7 No material is for public appearance Full Compliance in Place8 We are no intermediaries for anyone and neither our entity nor our analysts have any
interests in the reportsFull Compliance in Place
9 Our reports are password protected and contain all the required applicable disclosures Full Compliance in Place10 Analysts as per the policy of the company are not entitled to take positions either for
trading or long term in the analytical view that they form as a part of their workFull Compliance in Place
11 No conflict of interest and analysts are expected to maintain strict adherence to thecompany rules and regulations.
Full Compliance in Place
12 As a matter of policy no analyst will be allowed to do personal trading or deal andeven if they do so they have to disclose the same to the company and take priorapproval of the company
Full Compliance in Place
13 Our entity or any analyst shall not provide any promise or assurance of any favorableoutcome based on their reports on industry, company or sector or group
Full Compliance in Place
14 Researchers maintain arms length/ Chinese wall distance from other employees of theentity
Full Compliance in Place

Document code: FOTL_051120184_2 Copyright © 2016 Firstobject Technologies Ltd. All rights reserved
15No analyst will be allowed to cover or do any research where he has financial interest
Full Compliance in Place
16 Our entity does not do any reports upon receiving any compensation from anycompany
Full Compliance in Place
Firstcall Research Provides
Industry Research on all the Sectors and Equity Research on Major Companiesforming part of Listed and Unlisted Segments
For Further Details Contact:Mobile No: 09959010555
E-mail: [email protected]@firstcallresearch.comwww.firstcallresearch.com