A Workshop to Improve Retention and Graduation Larry Abele Provost Emeritus
56
A Workshop to Improve Retention and Graduation Larry Abele Provost Emeritus Director, Institute for Academic Leadership Florida State University 1
-
Upload
unity-munoz -
Category
Documents
-
view
14 -
download
0
description
A Workshop to Improve Retention and Graduation Larry Abele Provost Emeritus Director, Institute for Academic Leadership Florida State University. In the midst of a recession education remains a huge advantage. The advantages of parents ’ education are transferred to their children. - PowerPoint PPT Presentation
Transcript of A Workshop to Improve Retention and Graduation Larry Abele Provost Emeritus
A Workshop to Improve Retention and Graduation
Larry AbeleProvost Emeritus
Director, Institute for Academic LeadershipFlorida State University
1
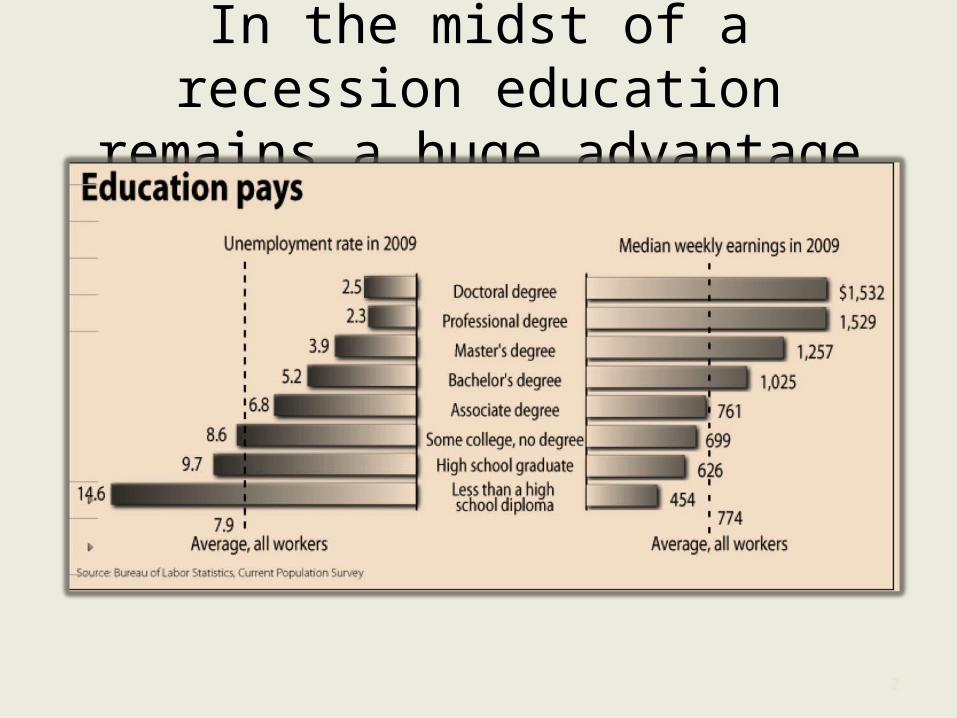
In the midst of a recession education remains a huge advantage
2
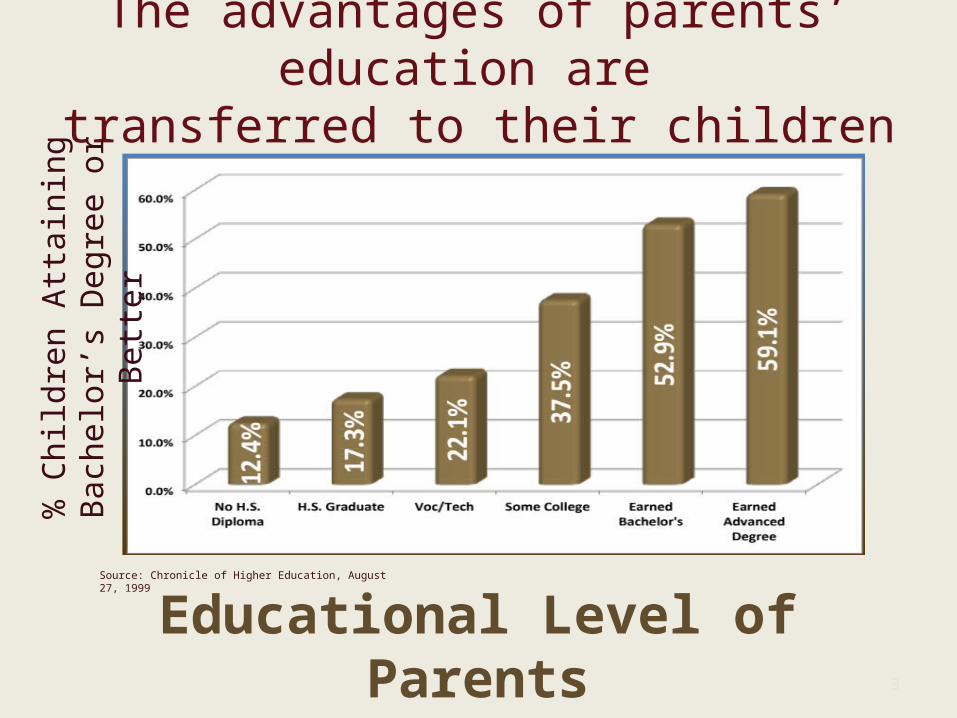
The advantages of parents’ education are transferred to their children
3
Educational Level of ParentsSource: Chronicle of Higher Education, August 27, 1999
% C
hild
ren
Attai
ning
Bac
helo
r’s
Deg
ree
or B
etter
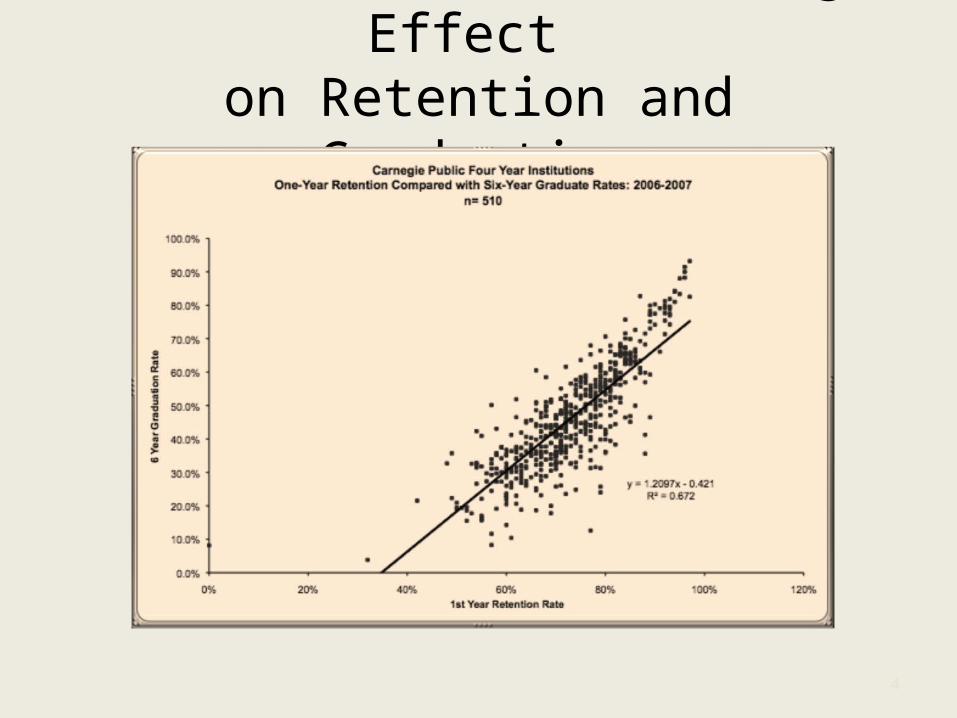
Institutions Have a Large Effect on Retention and Graduation
4
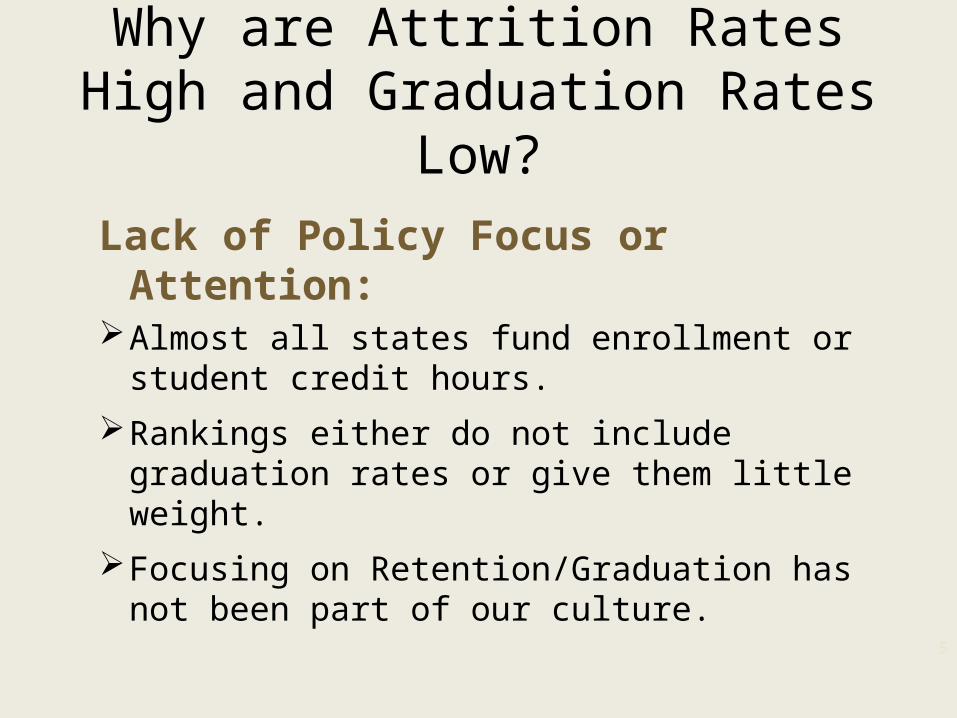
Why are Attrition Rates High and Graduation Rates Low?
Lack of Policy Focus or Attention:Almost all states fund enrollment or student
credit hours.Rankings either do not include graduation
rates or give them little weight.Focusing on Retention/Graduation has not
been part of our culture.
5
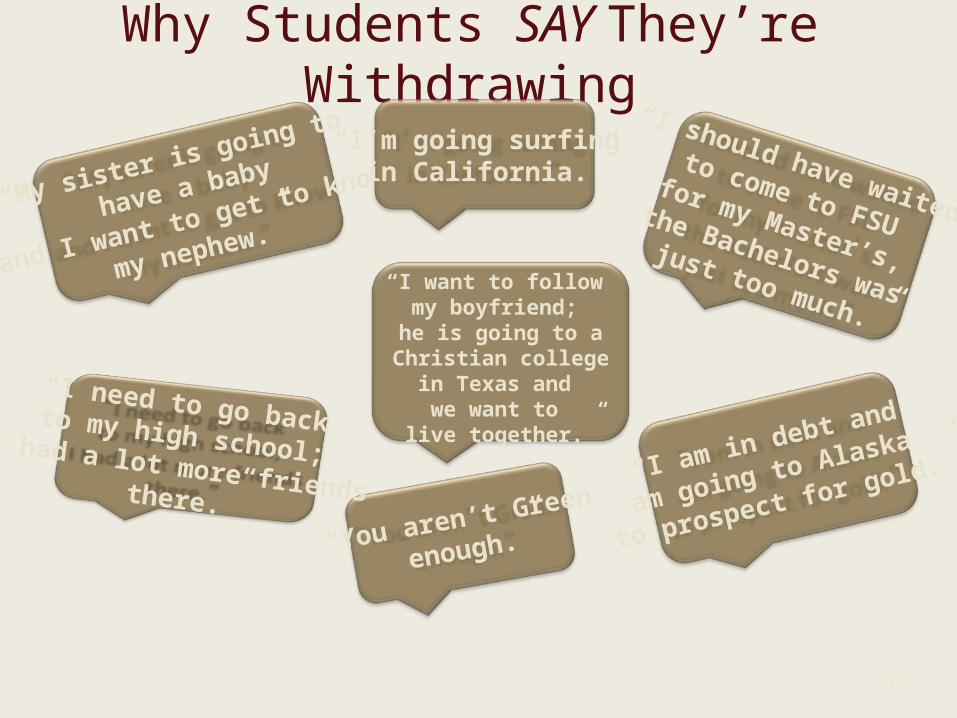
Why Students SAY They’re Withdrawing
6
“You aren’t Green
enough.”
“I should have waited to come to FSU
for my Master’s, the Bachelors was just too much.”
“I am in debt and
am going to Alaska
to prospect for gold.”
“My sister is going to
have a baby
and I want to get to know
my nephew.”
“I want to follow my boyfriend;
he is going to a Christian college in Texas and
we want to live together.”
“I need to go back to my high school; I had a lot more friends there.”
“I’m going surfing in California.”
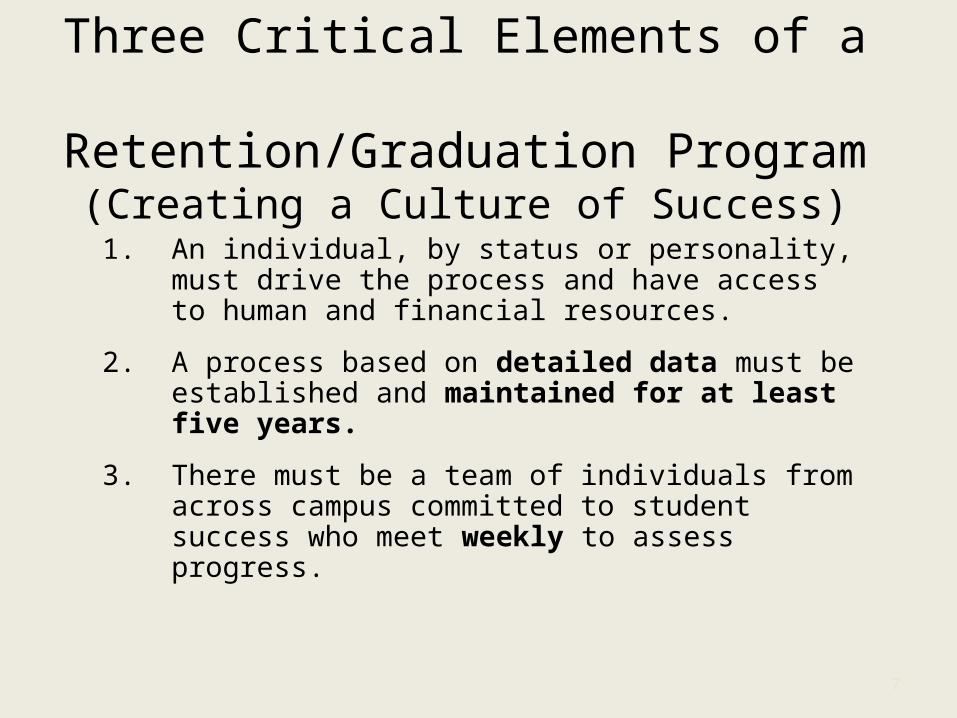
Three Critical Elements of a Retention/Graduation Program
(Creating a Culture of Success)
1. An individual, by status or personality, must drive the process and have access to human and financial resources.
2. A process based on detailed data must be established and maintained for at least five years.
3. There must be a team of individuals from across campus committed to student success who meet weekly to assess progress.
7
8 ©2013 U.S. Education Delivery Institute
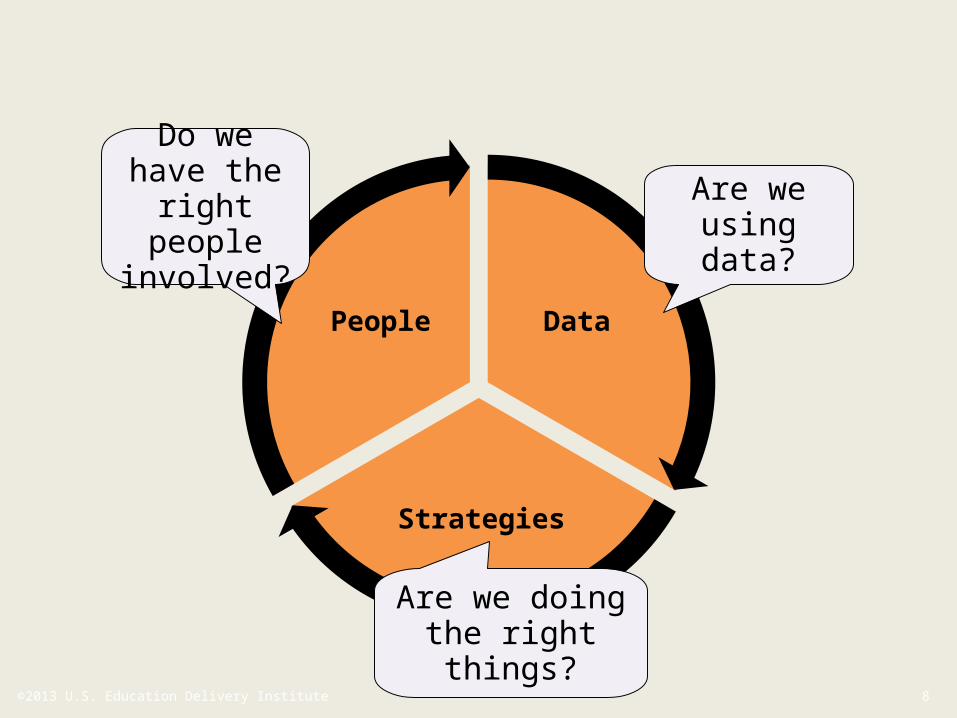
Data
Strategies
People
Are we using data?
Do we have the
right people
involved?
Are we doing the right things?
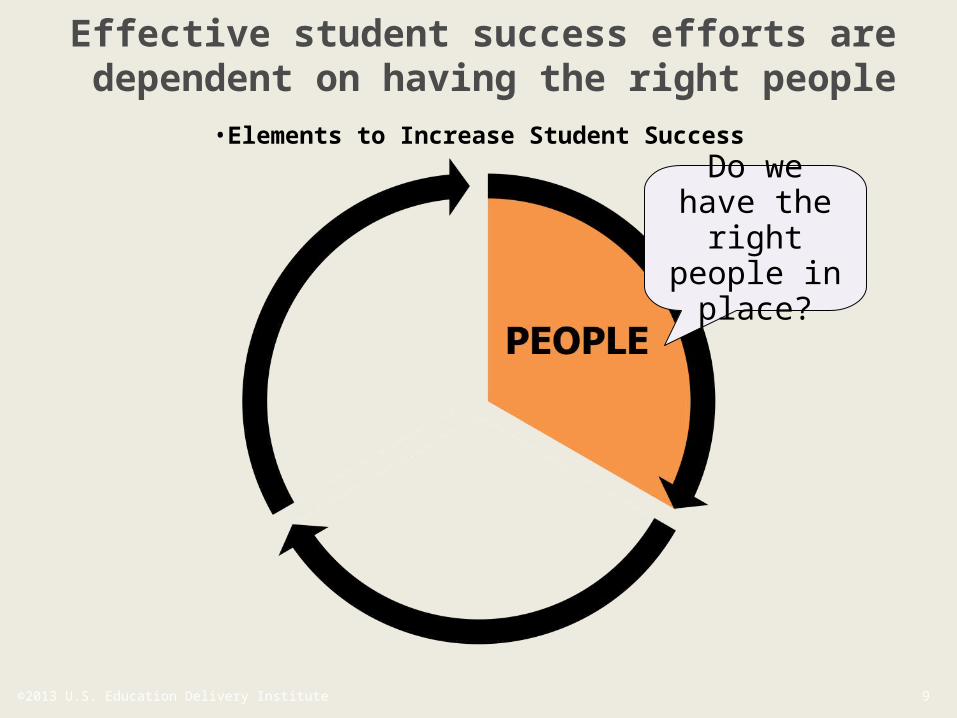
9 ©2013 U.S. Education Delivery Institute
Effective student success efforts are dependent on having the right people
•Elements to Increase Student SuccessDo we
have the right
people in place?
10
11 ©2013 U.S. Education Delivery Institute
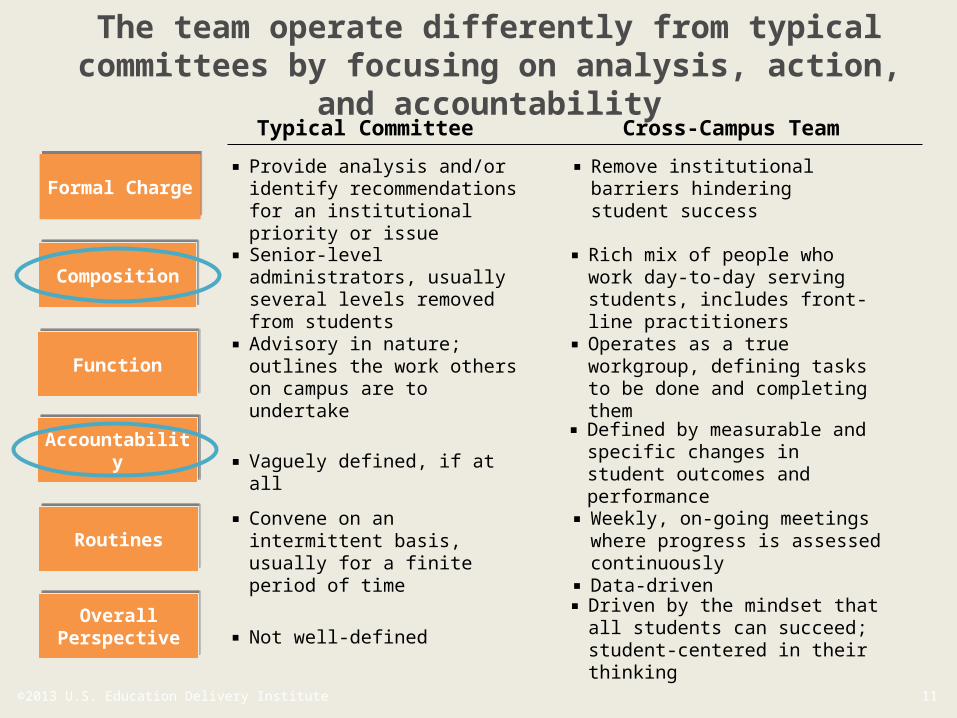
The team operate differently from typical committees by focusing on analysis, action, and
accountabilityCross-Campus TeamTypical Committee
Formal ChargeFormal Charge
▪ Remove institutional barriers hindering student success
▪ Provide analysis and/or identify recommendations for an institutional priority or issue
CompositionComposition▪ Rich mix of people who work
day-to-day serving students, includes front-line practitioners
▪ Senior-level administrators, usually several levels removed from students
FunctionFunction▪ Operates as a true workgroup,
defining tasks to be done and completing them
▪ Advisory in nature; outlines the work others on campus are to undertake
Accountability
Accountability
▪ Defined by measurable and specific changes in student outcomes and performance
▪ Vaguely defined, if at all
RoutinesRoutines▪ Weekly, on-going meetings
where progress is assessed continuously
▪ Data-driven
▪ Convene on an intermittent basis, usually for a finite period of time
Overall Perspective
Overall Perspective
▪ Driven by the mindset that all students can succeed; student-centered in their thinking
▪ Not well-defined
12 ©2013 U.S. Education Delivery Institute
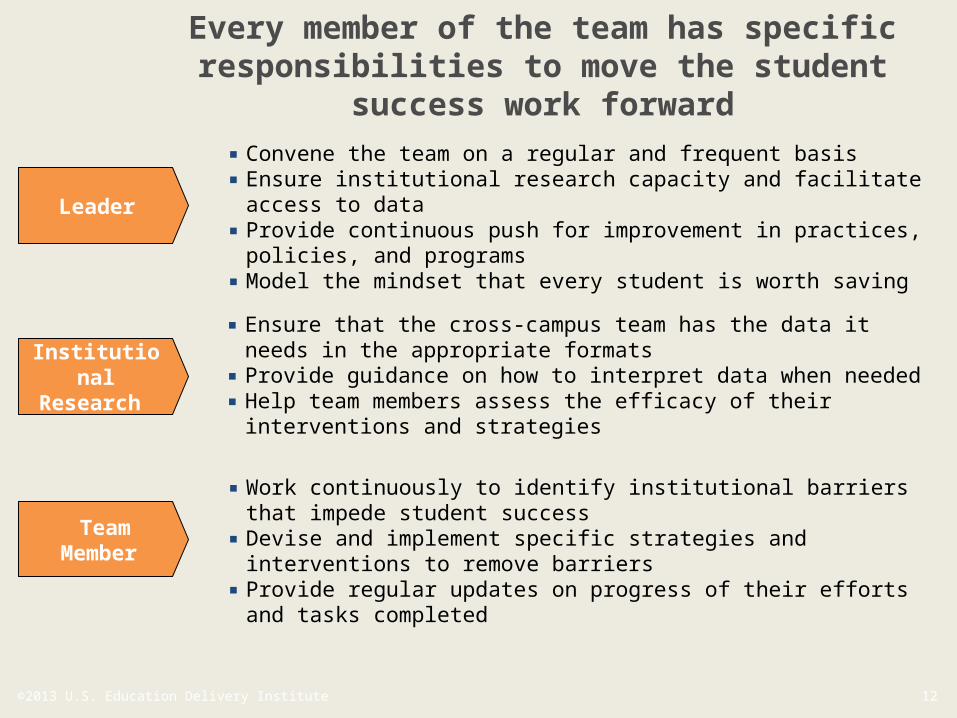
Every member of the team has specific responsibilities to move the student
success work forward▪ Convene the team on a regular and frequent basis▪ Ensure institutional research capacity and facilitate access to
data▪ Provide continuous push for improvement in practices, policies,
and programs▪ Model the mindset that every student is worth saving
Leader
▪ Ensure that the cross-campus team has the data it needs in the appropriate formats
▪ Provide guidance on how to interpret data when needed▪ Help team members assess the efficacy of their interventions
and strategies
Institutional Research
▪ Work continuously to identify institutional barriers that impede student success
▪ Devise and implement specific strategies and interventions to remove barriers
▪ Provide regular updates on progress of their efforts and tasks completed
Team Member
13 ©2013 U.S. Education Delivery Institute
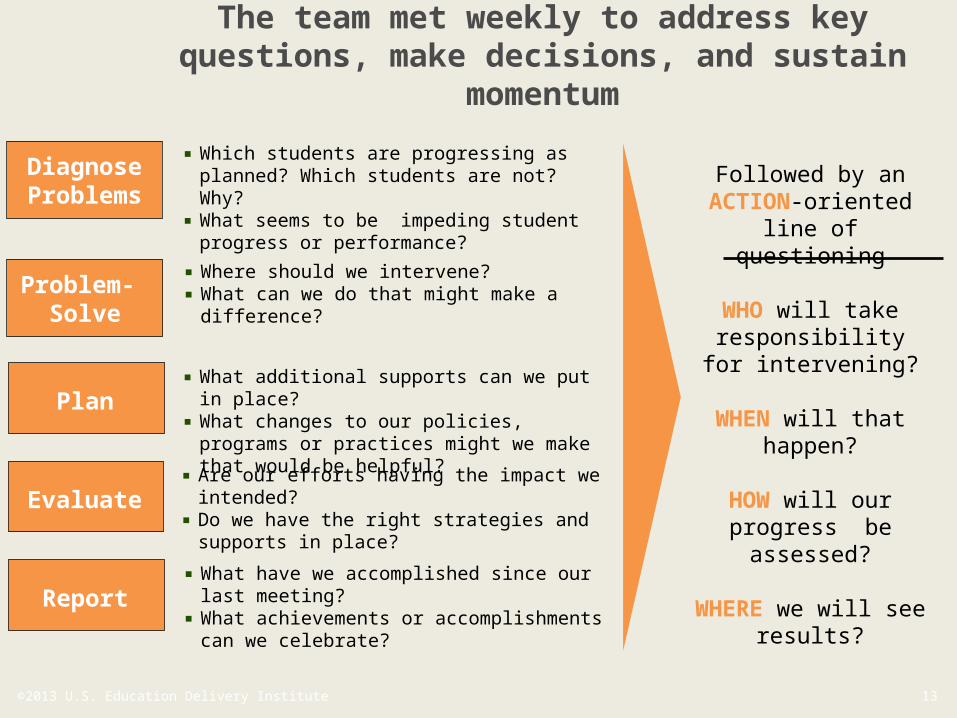
The team met weekly to address key questions, make decisions, and sustain
momentum
Diagnose Problems
▪Which students are progressing as planned? Which students are not? Why?
▪What seems to be impeding student progress or performance?
Problem- Solve
▪Where should we intervene?▪What can we do that might make a
difference?
▪What additional supports can we put in place?
▪What changes to our policies, programs or practices might we make that would be helpful?
Plan
Evaluate▪Are our efforts having the impact we
intended?▪Do we have the right strategies and
supports in place?
Report▪What have we accomplished since our last
meeting?▪What achievements or accomplishments
can we celebrate?
Followed by an ACTION-oriented line of questioning
WHO will take responsibility for
intervening?
WHEN will that happen?
HOW will ourprogress be assessed?
WHERE we will see results?
14 ©2013 U.S. Education Delivery Institute
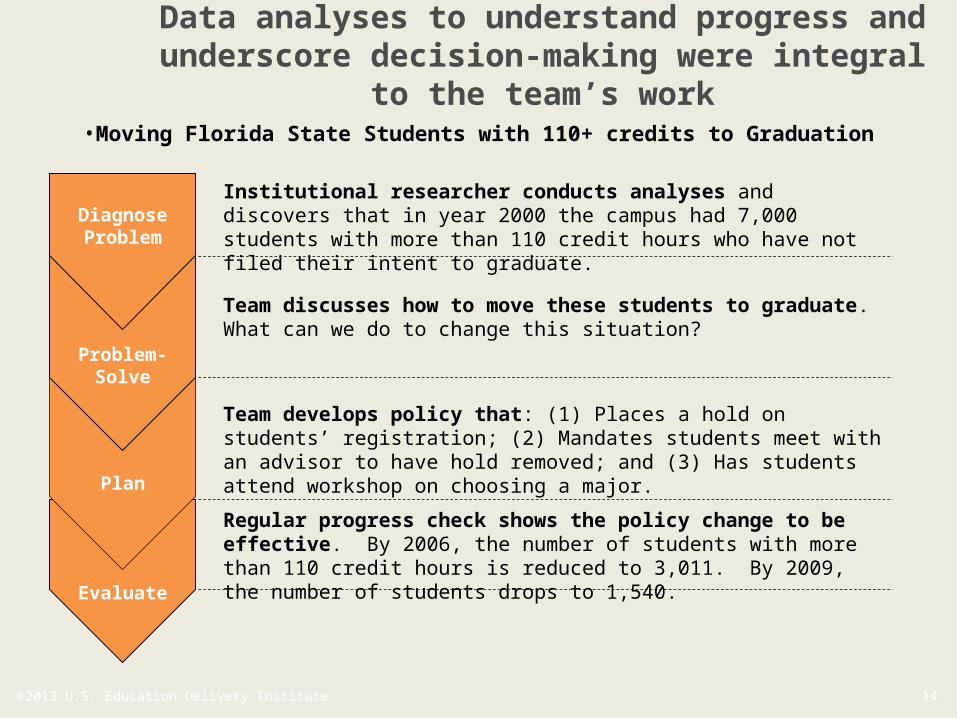
Data analyses to understand progress and underscore decision-making were integral
to the team’s work•Moving Florida State Students with 110+ credits to Graduation
Institutional researcher conducts analyses and discovers that in year 2000 the campus had 7,000 students with more than 110 credit hours who have not filed their intent to graduate.
Team discusses how to move these students to graduate. What can we do to change this situation?
Team develops policy that: (1) Places a hold on students’ registration; (2) Mandates students meet with an advisor to have hold removed; and (3) Has students attend workshop on choosing a major.
Regular progress check shows the policy change to be effective. By 2006, the number of students with more than 110 credit hours is reduced to 3,011. By 2009, the number of students drops to 1,540.
Diagnose
Problem
Problem-Solve
Plan
Evaluate
15 ©2013 U.S. Education Delivery Institute
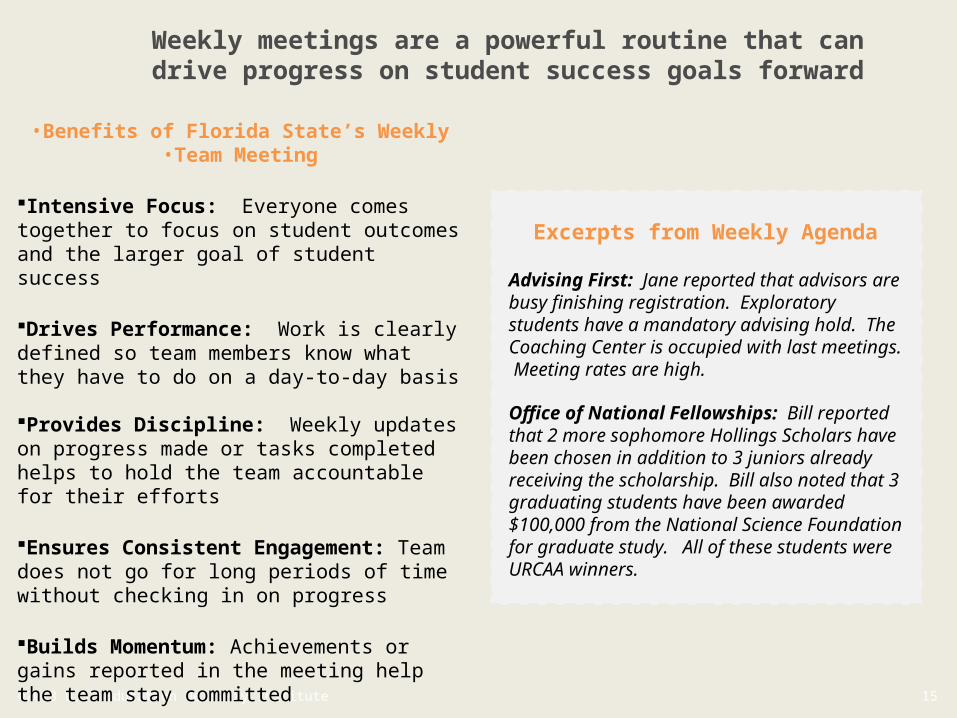
Weekly meetings are a powerful routine that can drive progress on student success goals forward
•Benefits of Florida State’s Weekly•Team Meeting
Intensive Focus: Everyone comes together to focus on student outcomes and the larger goal of student success
Drives Performance: Work is clearly defined so team members know what they have to do on a day-to-day basis
Provides Discipline: Weekly updates on progress made or tasks completed helps to hold the team accountable for their efforts
Ensures Consistent Engagement: Team does not go for long periods of time without checking in on progress
Builds Momentum: Achievements or gains reported in the meeting help the team stay committed
Excerpts from Weekly Agenda
Advising First: Jane reported that advisors are busy finishing registration. Exploratory students have a mandatory advising hold. The Coaching Center is occupied with last meetings. Meeting rates are high.Office of National Fellowships: Bill reported that 2 more sophomore Hollings Scholars have been chosen in addition to 3 juniors already receiving the scholarship. Bill also noted that 3 graduating students have been awarded $100,000 from the National Science Foundation for graduate study. All of these students were URCAA winners.
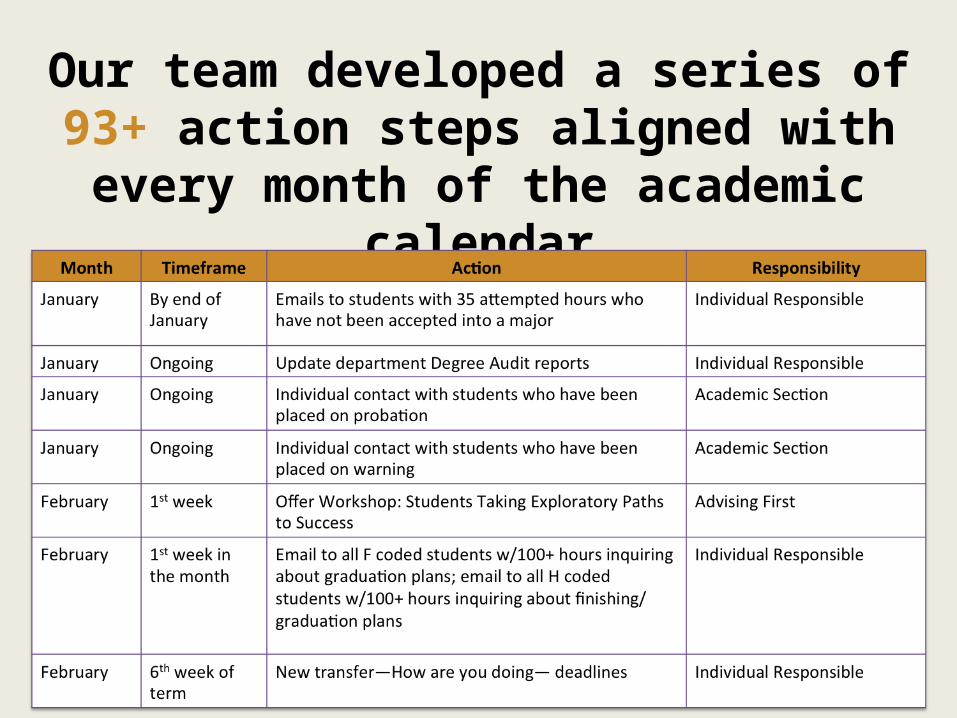
Our team developed a series of 93+ action steps aligned with every month of
the academic calendar
17 ©2013 U.S. Education Delivery Institute
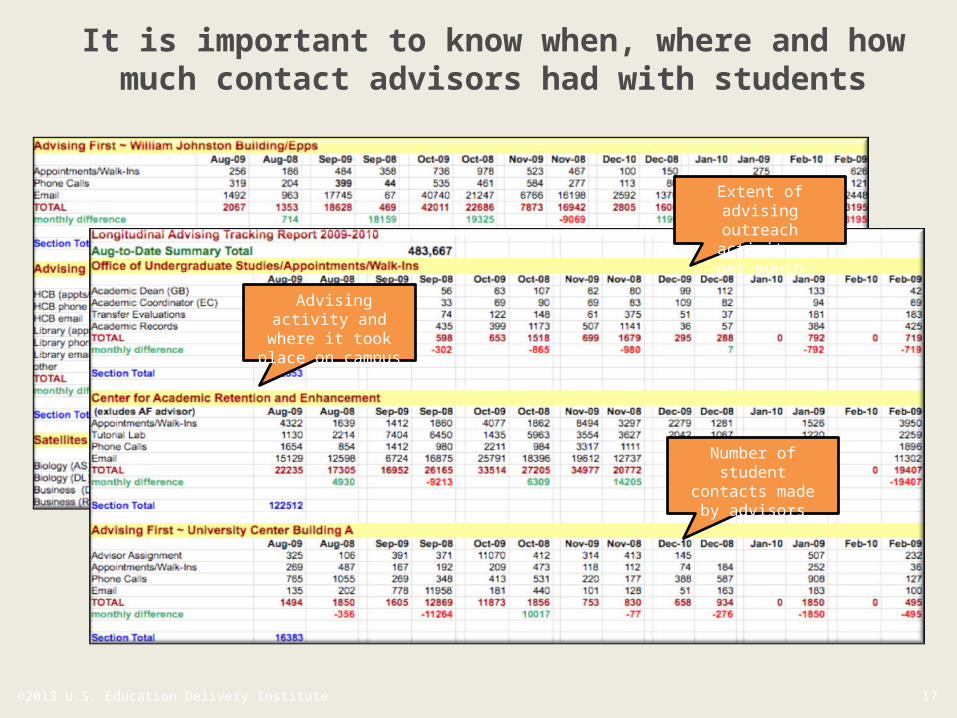
It is important to know when, where and how much contact advisors had with students
Extent of advising outreach activity
per month
Advising activity and where it took place on campus
Number of student contacts made by
advisors
18 ©2013 U.S. Education Delivery Institute
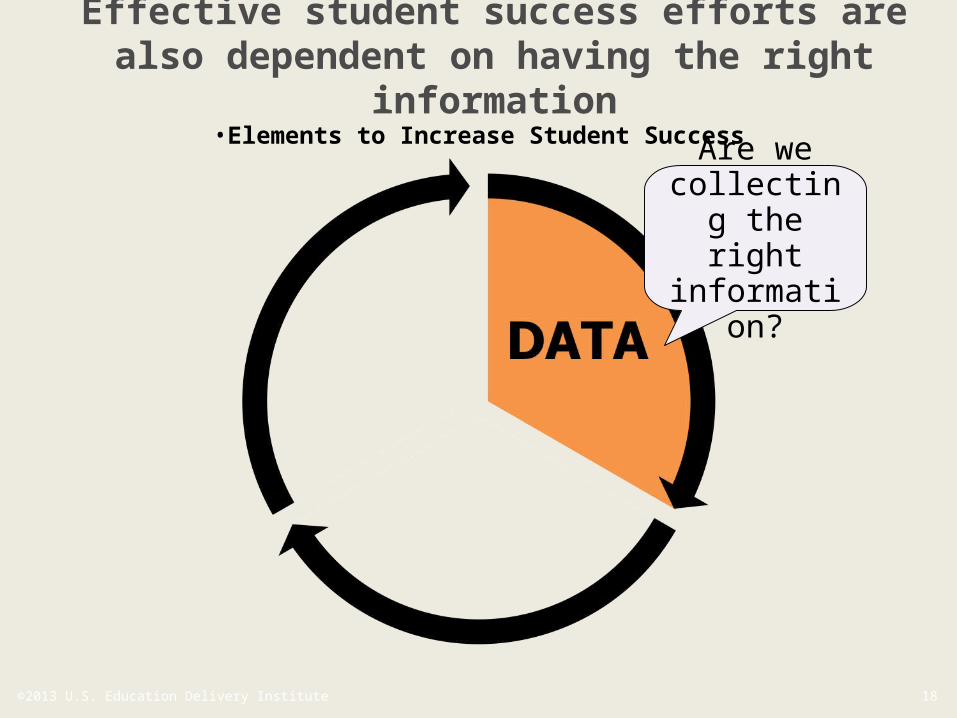
Effective student success efforts are also dependent on having the right
information•Elements to Increase Student Success
Are we collecting the right
information?
19 ©2013 U.S. Education Delivery Institute
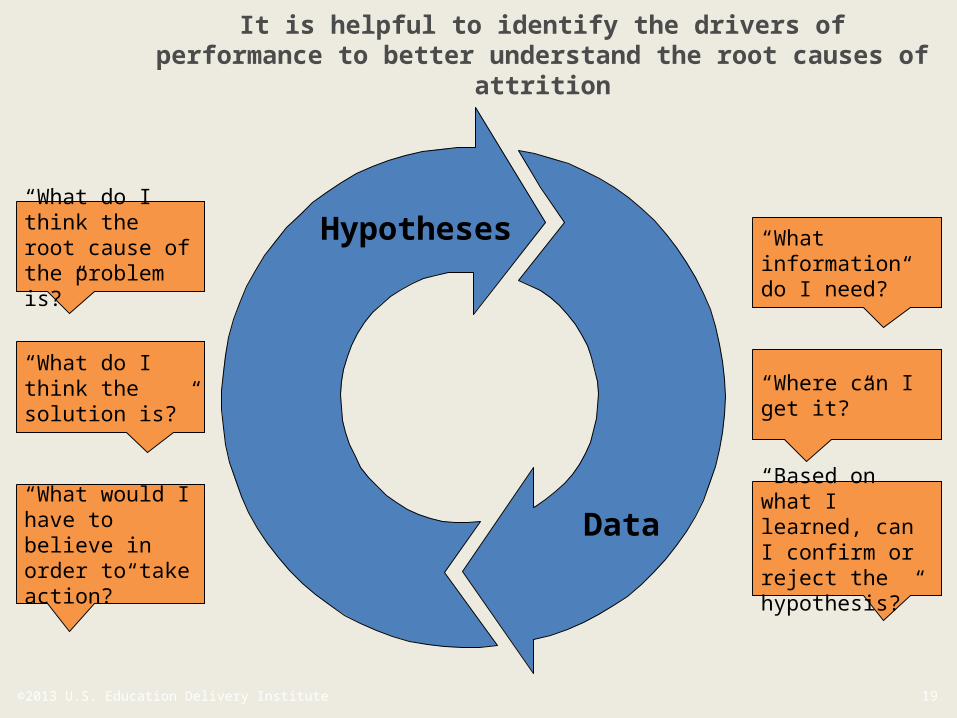
It is helpful to identify the drivers of performance to better understand the root causes of attrition
“What do I think the root cause of the problem is?”
“What do I think the solution is?”
“What would I have to believe in order to take action?”
“What information do I need?”
Hypotheses
Data
“Where can I get it?”
“Based on what I learned, can I confirm or reject the hypothesis?”
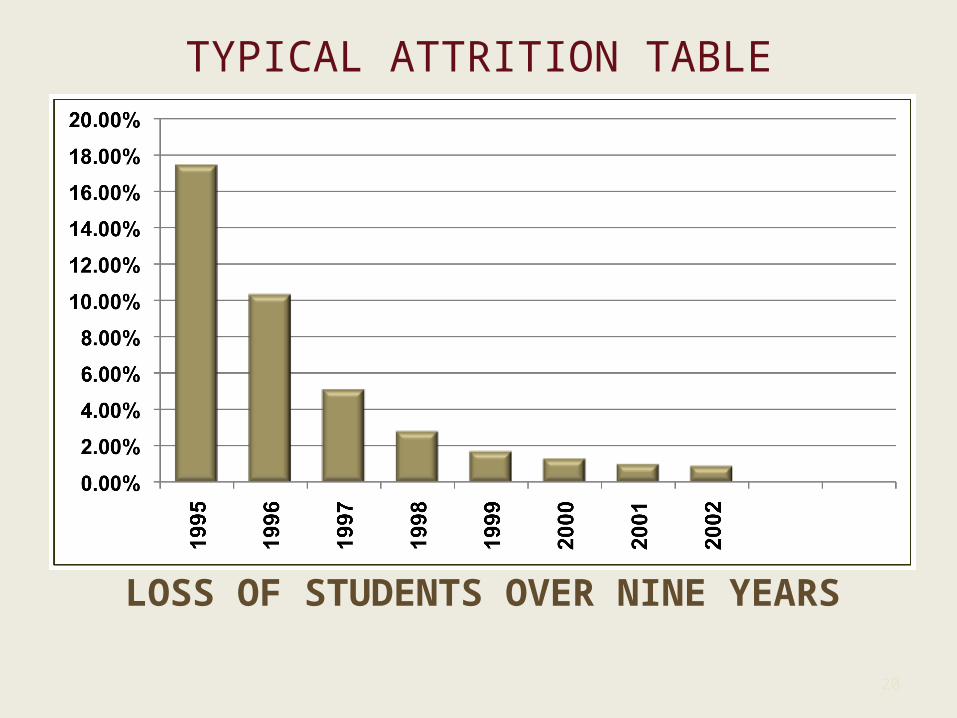
TYPICAL ATTRITION TABLE
20
LOSS OF STUDENTS OVER NINE YEARS
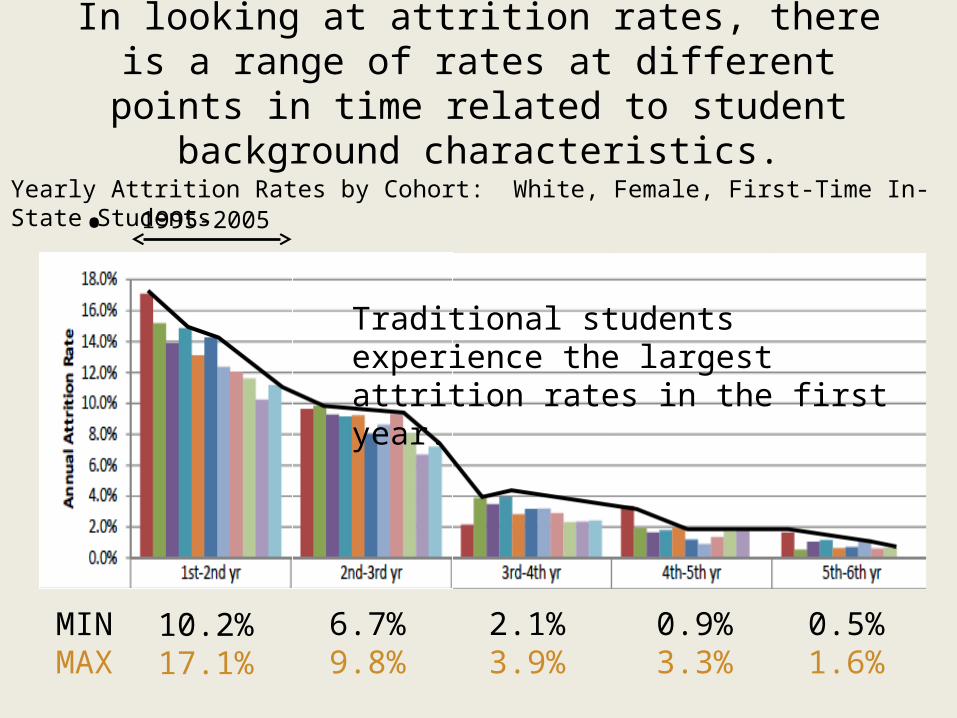
In looking at attrition rates, there is a range of rates at different points in time related to student
background characteristics.
• 1995-2005Yearly Attrition Rates by Cohort: White, Female, First-Time In-State Students
0.5%1.6%
0.9%3.3%
2.1%3.9%
6.7%9.8%
10.2%17.1%
MINMAX
Traditional students experience the largest attrition rates in the first year.
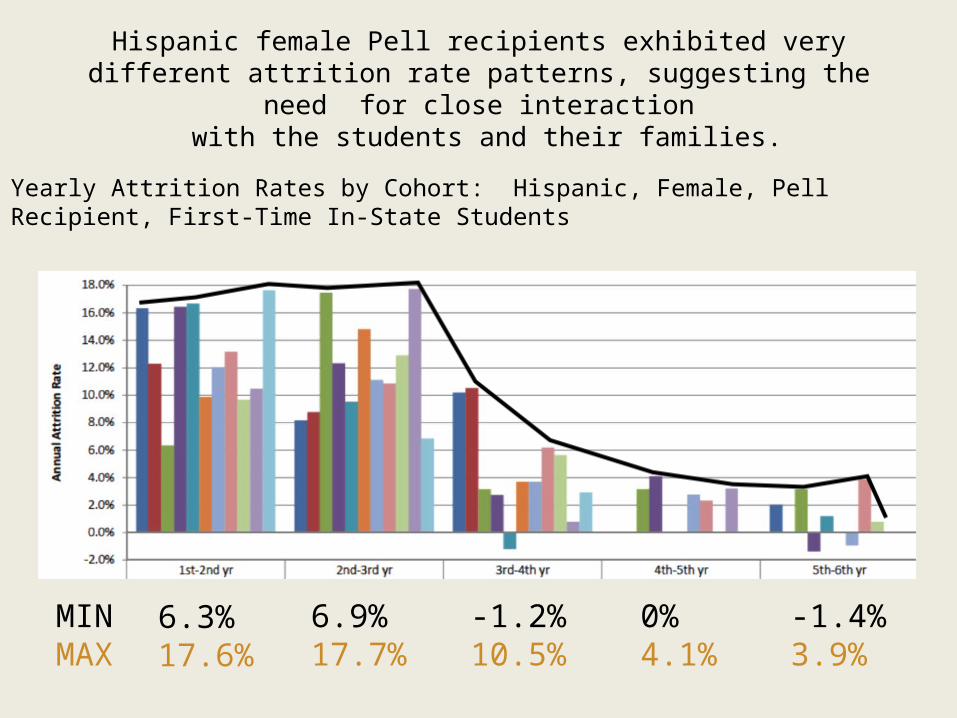
Hispanic female Pell recipients exhibited very different attrition rate patterns, suggesting the need for close interaction
with the students and their families.
Yearly Attrition Rates by Cohort: Hispanic, Female, Pell Recipient, First-Time In-State Students
6.3%17.6%
MINMAX
6.9%17.7%
-1.2%10.5%
0%4.1%
-1.4%3.9%
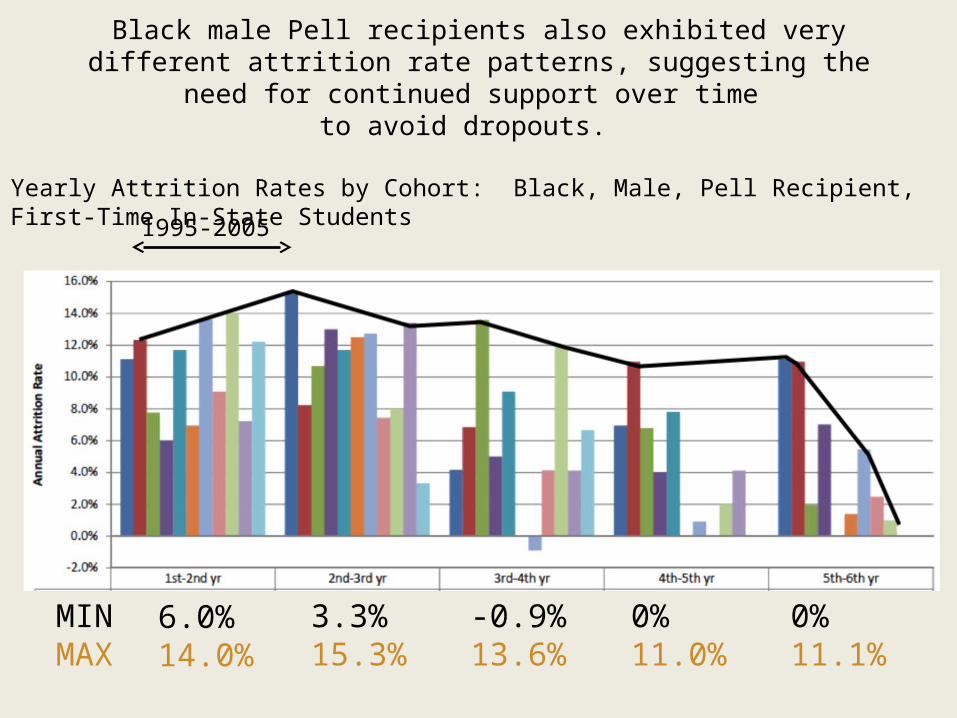
Black male Pell recipients also exhibited very different attrition rate patterns, suggesting the need for continued support over time
to avoid dropouts.
1995-2005
Yearly Attrition Rates by Cohort: Black, Male, Pell Recipient, First-Time In-State Students
6.0%14.0%
MINMAX
3.3%15.3%
-0.9%13.6%
0%11.0%
0%11.1%
24 ©2013 U.S. Education Delivery Institute
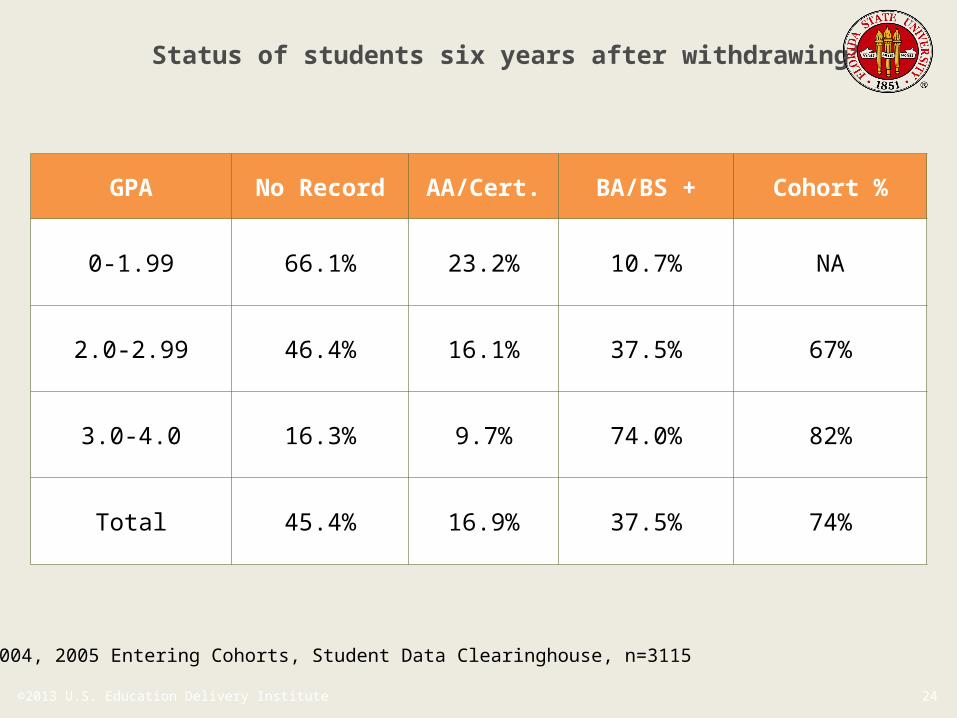
Status of students six years after withdrawing*
GPA No Record AA/Cert. BA/BS + Cohort %
0-1.99 66.1% 23.2% 10.7% NA
2.0-2.99 46.4% 16.1% 37.5% 67%
3.0-4.0 16.3% 9.7% 74.0% 82%
Total 45.4% 16.9% 37.5% 74%
*2004, 2005 Entering Cohorts, Student Data Clearinghouse, n=3115
25 ©2013 U.S. Education Delivery Institute
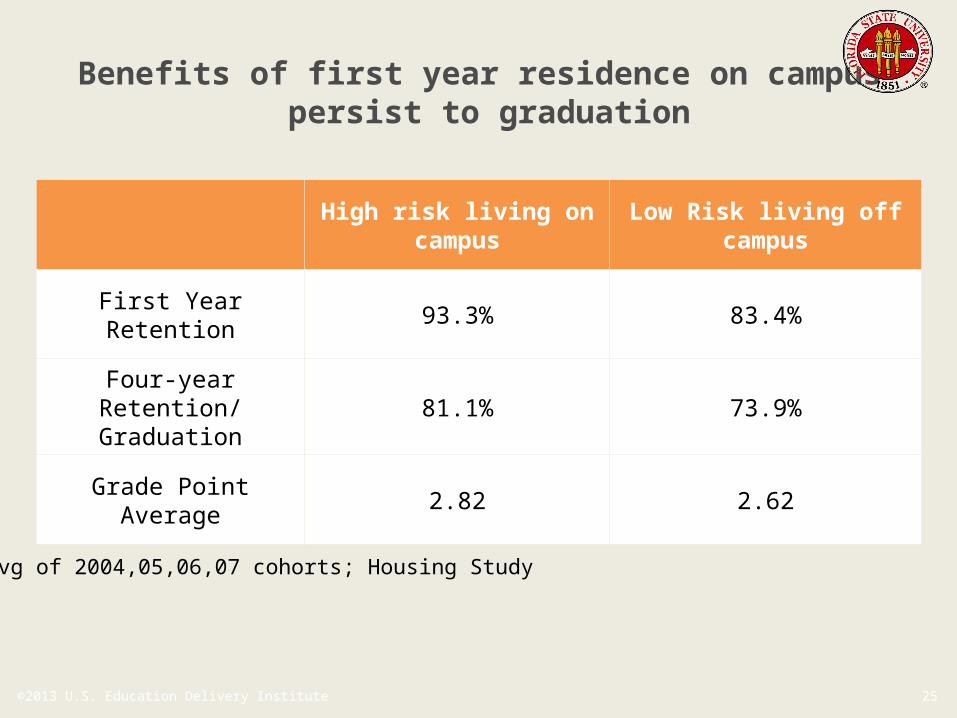
Benefits of first year residence on campus persist to graduation
High risk living on campus
Low Risk living off campus
First Year Retention 93.3% 83.4%
Four-year Retention/ Graduation
81.1% 73.9%
Grade Point Average 2.82 2.62
Avg of 2004,05,06,07 cohorts; Housing Study
26 ©2013 U.S. Education Delivery Institute
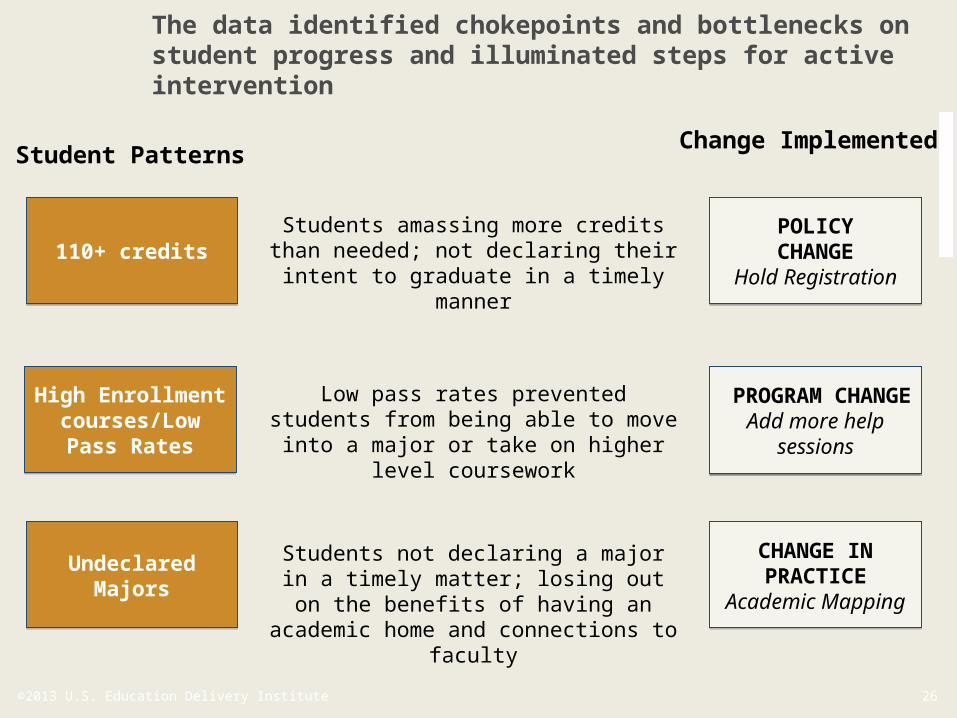
The data identified chokepoints and bottlenecks on student progress and illuminated steps for active intervention
110+ credits110+ credits
High Enrollment
courses/Low Pass Rates
High Enrollment
courses/Low Pass Rates
Undeclared Majors
Undeclared Majors
Students amassing more credits than needed; not declaring their intent to
graduate in a timely manner
Low pass rates prevented students from being able to move into a major
or take on higher level coursework
Student Patterns
Students not declaring a major in a timely matter; losing out on the
benefits of having an academic home and connections to faculty
Change Implemented
POLICYCHANGE
Hold Registration
POLICYCHANGE
Hold Registration
PROGRAM CHANGE
Add more help sessions
PROGRAM CHANGE
Add more help sessions
CHANGE IN PRACTICEAcademic Mapping
CHANGE IN PRACTICEAcademic Mapping
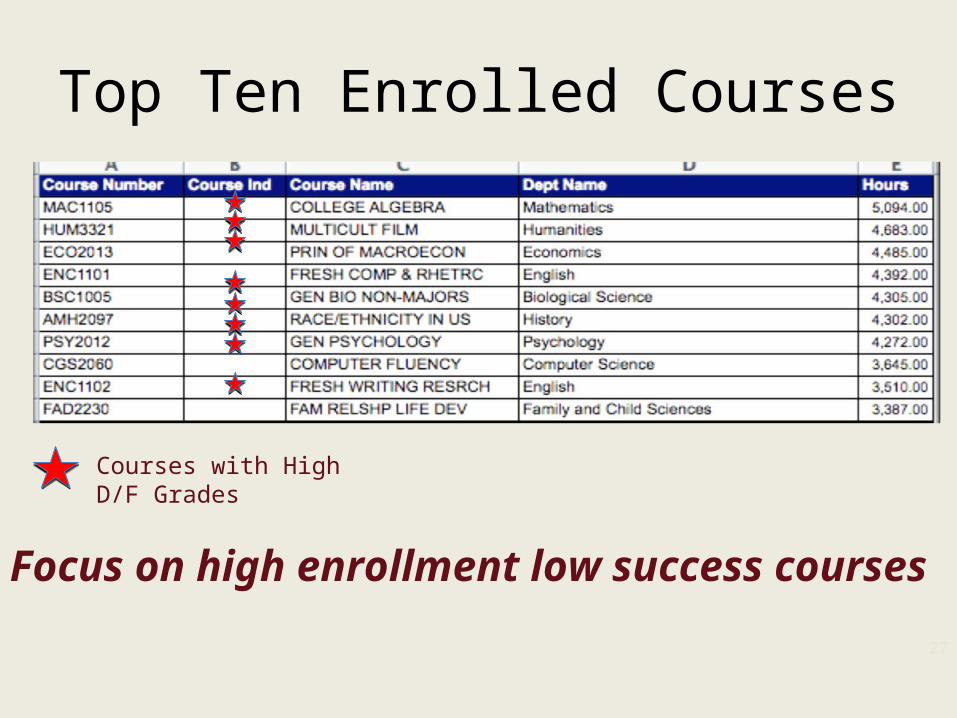
Top Ten Enrolled Courses
27
Focus on high enrollment low success courses
Courses with High D/F Grades
28 ©2013 U.S. Education Delivery Institute
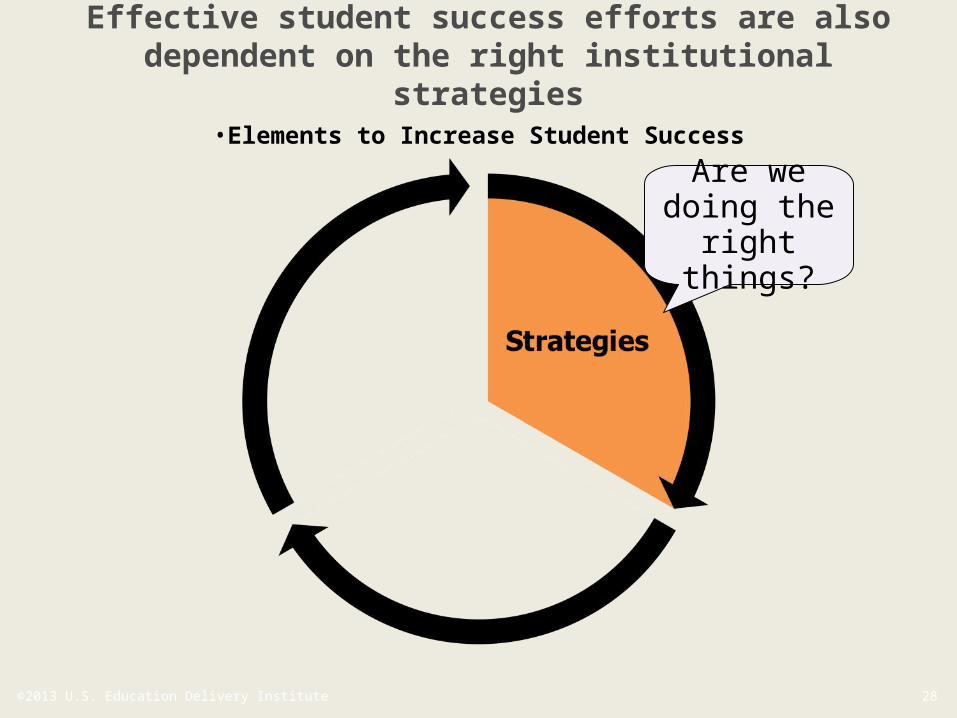
Effective student success efforts are also dependent on the right institutional strategies
•Elements to Increase Student Success
Are we doing the
right things?
29 ©2013 U.S. Education Delivery Institute
There is no silver bullet.You increase retention
literally one student at a time.
30 ©2013 U.S. Education Delivery Institute
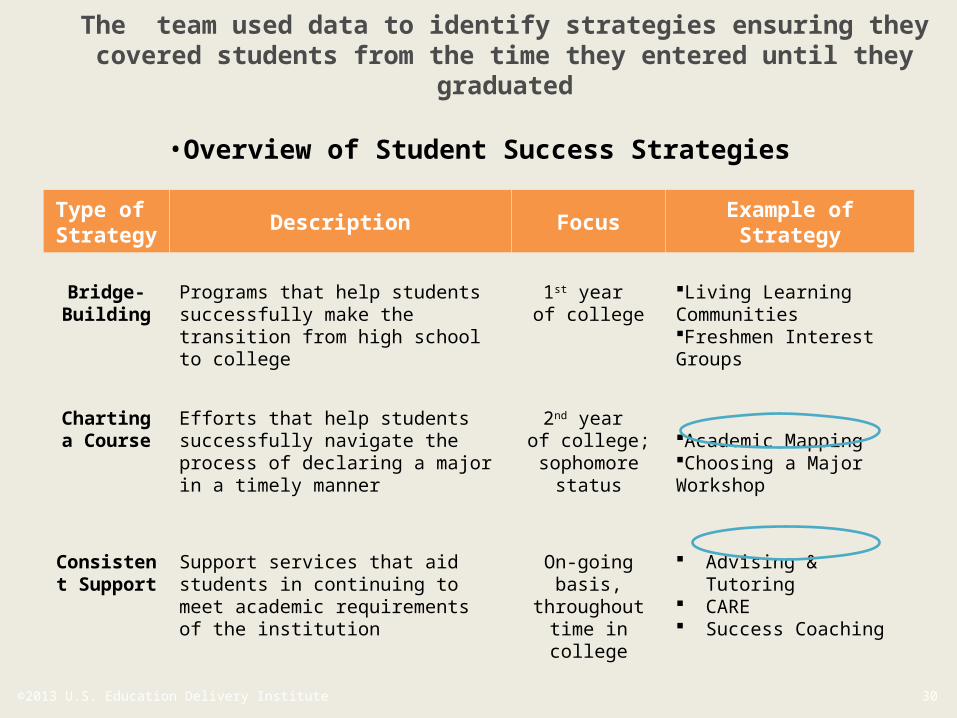
The team used data to identify strategies ensuring they covered students from the time they entered until they
graduated
•Overview of Student Success Strategies
Type of Strategy
Description FocusExample of Strategy
Bridge-Building
Programs that help students successfully make the transition from high school to college
1st year of college
Living Learning CommunitiesFreshmen Interest Groups
Charting a Course
Efforts that help students successfully navigate the process of declaring a major in a timely manner
2nd year of college; sophomore
status
Academic MappingChoosing a Major Workshop
Consistent Support
Support services that aid students in continuing to meet academic requirements of the institution
On-going basis,
throughout time in college
Advising & Tutoring CARE Success Coaching
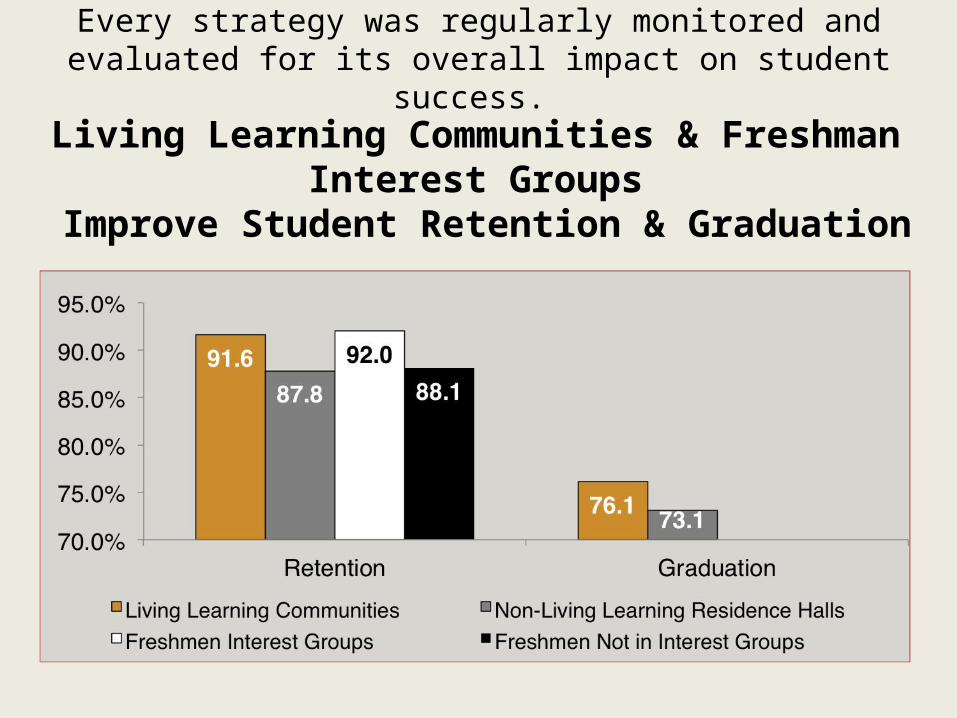
Every strategy was regularly monitored and evaluated for its overall impact on student success.
Living Learning Communities & Freshman Interest Groups
Improve Student Retention & Graduation
32 ©2013 U.S. Education Delivery Institute
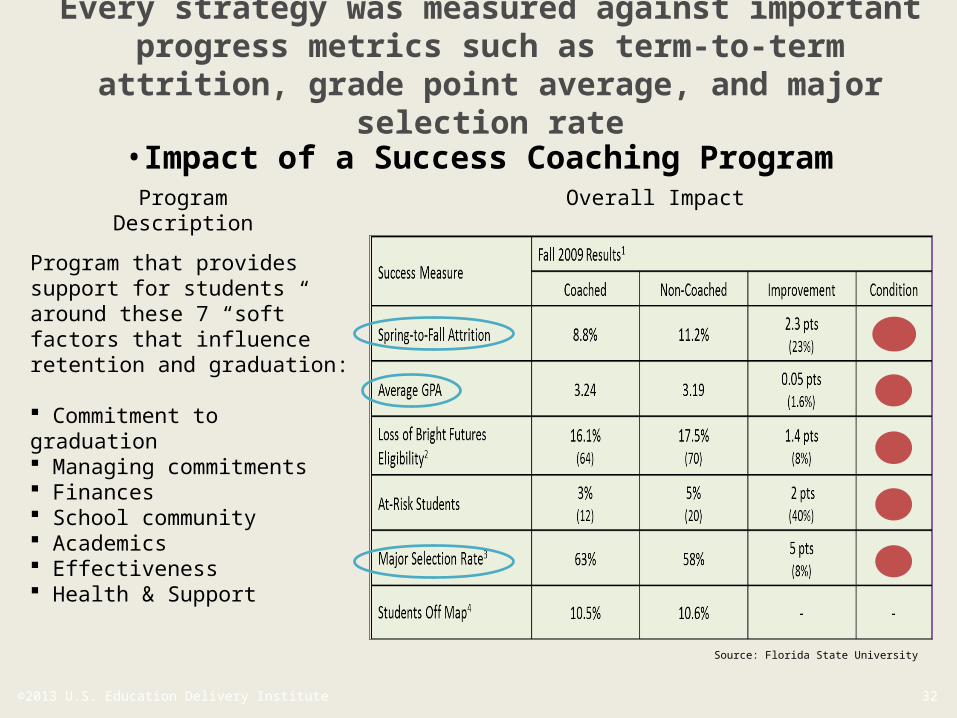
Every strategy was measured against important progress metrics such as term-to-term attrition, grade point average, and major selection rate
•Impact of a Success Coaching Program
Program that provides support for students around these 7 “soft” factors that influence retention and graduation:
Commitment to graduation Managing commitments Finances School community Academics Effectiveness Health & Support
Program Description Overall Impact
Source: Florida State University
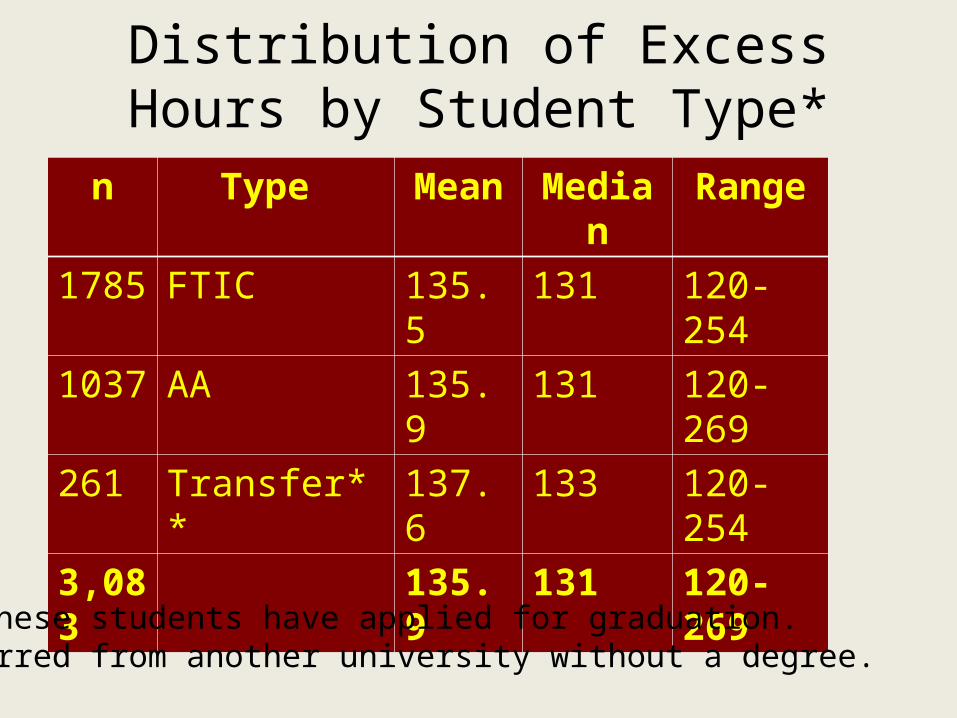
Distribution of Excess Hours by Student Type*
n Type Mean Median Range
1785 FTIC 135.5 131 120-254
1037 AA 135.9 131 120-269
261 Transfer** 137.6 133 120-254
3,083 135.9 131 120-269
*None of these students have applied for graduation.** Transferred from another university without a degree.

Source: http://www.academic-guide.fsu.edu/
34
Every Major is Given a Term by Term Course Schedule
35 ©2013 U.S. Education Delivery Institute
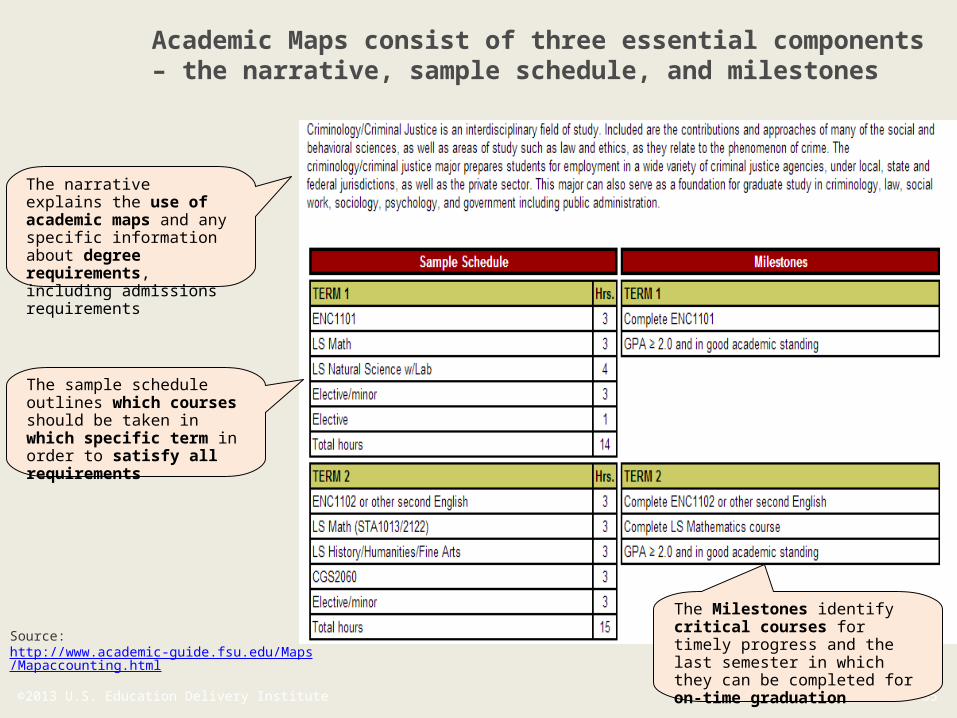
Academic Maps consist of three essential components – the narrative, sample schedule, and milestones
Source: http://www.academic-guide.fsu.edu/Maps/Mapaccounting.html
The narrative explains the use of academic maps and any specific information about degree requirements, including admissions requirements
The sample schedule outlines which courses should be taken in which specific term in order to satisfy all requirements
The Milestones identify critical courses for timely progress and the last semester in which they can be completed for on-time graduation
Source: http://www.academic-guide.fsu.edu/Maps/Mapaccounting.html
36
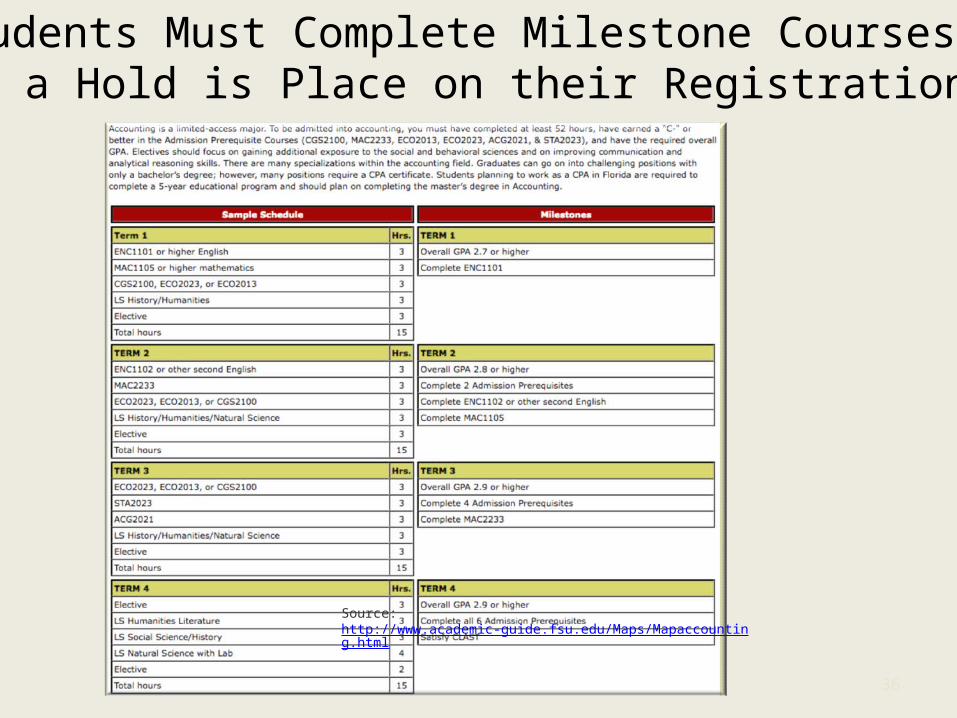
Students Must Complete Milestone Courses or a Hold is Place on their Registration
37 ©2013 U.S. Education Delivery Institute
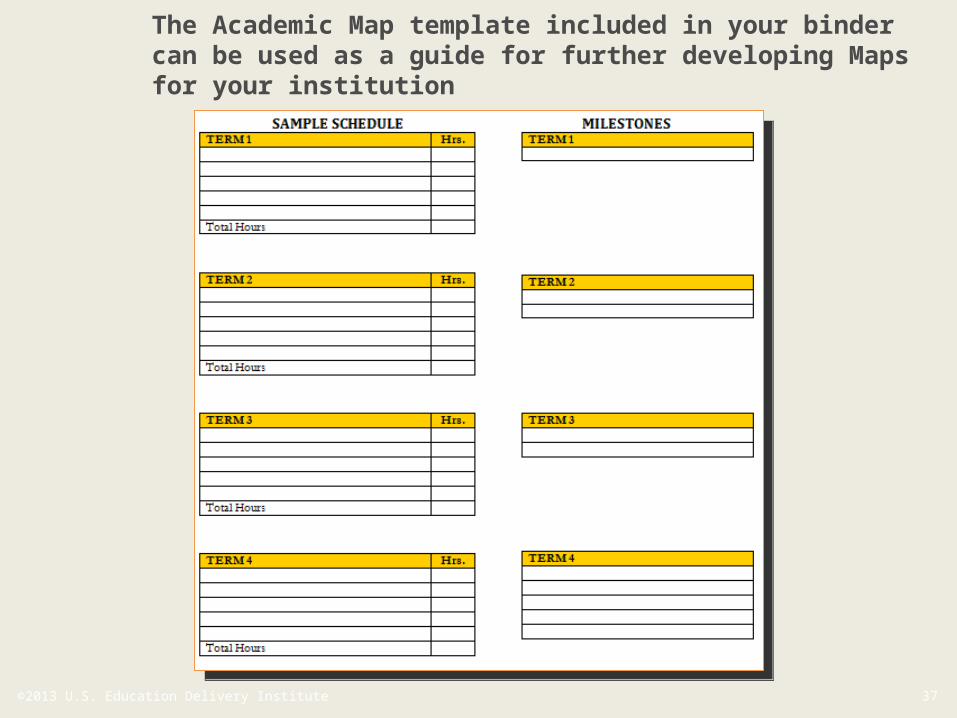
The Academic Map template included in your binder can be used as a guide for further developing Maps for your institution
38 ©2013 U.S. Education Delivery Institute
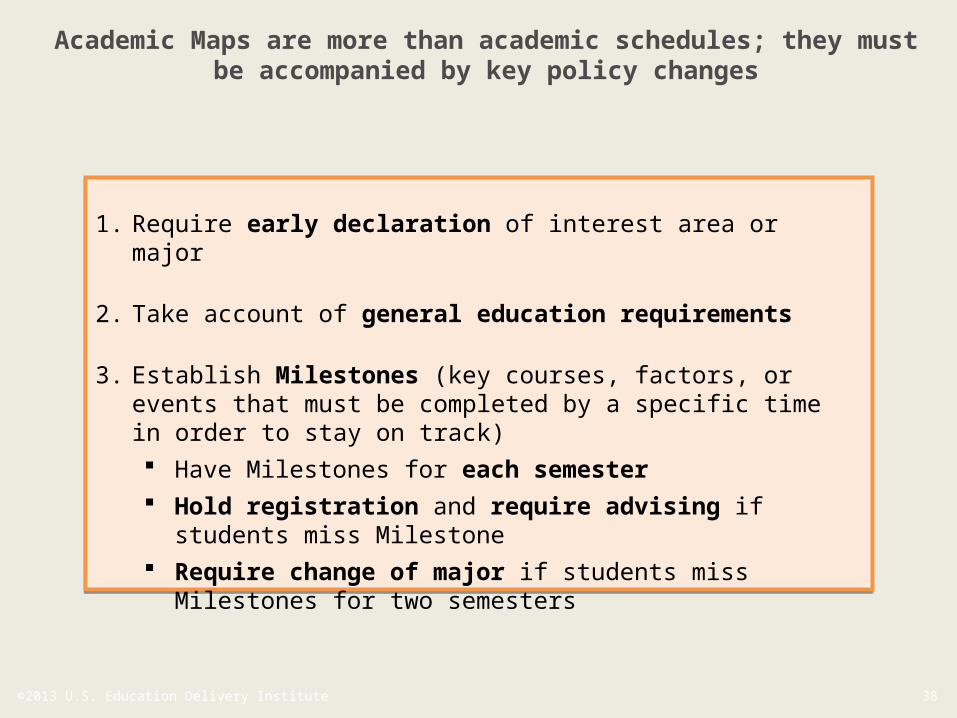
Academic Maps are more than academic schedules; they must be accompanied by key policy changes
1. Require early declaration of interest area or major
2. Take account of general education requirements
3. Establish Milestones (key courses, factors, or events that must be completed by a specific time in order to stay on track) Have Milestones for each semester Hold registration and require advising if students
miss Milestone Require change of major if students miss Milestones
for two semesters
39 ©2013 U.S. Education Delivery Institute
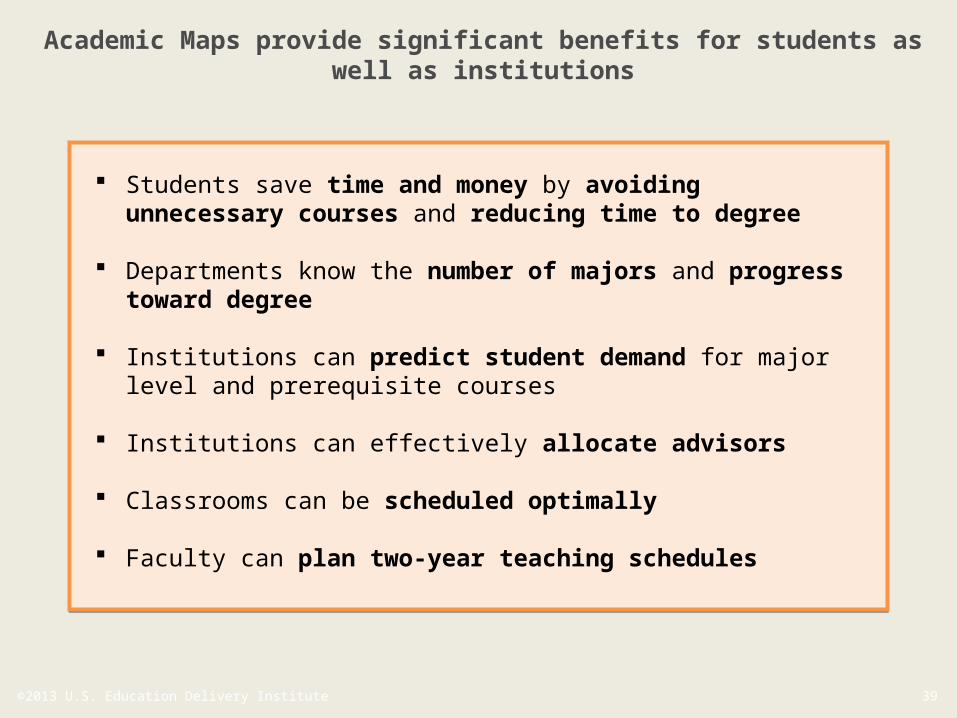
Academic Maps provide significant benefits for students as well as institutions
Students save time and money by avoiding unnecessary
courses and reducing time to degree
Departments know the number of majors and progress toward degree
Institutions can predict student demand for major level and prerequisite courses
Institutions can effectively allocate advisors
Classrooms can be scheduled optimally
Faculty can plan two-year teaching schedules
40 ©2013 U.S. Education Delivery Institute
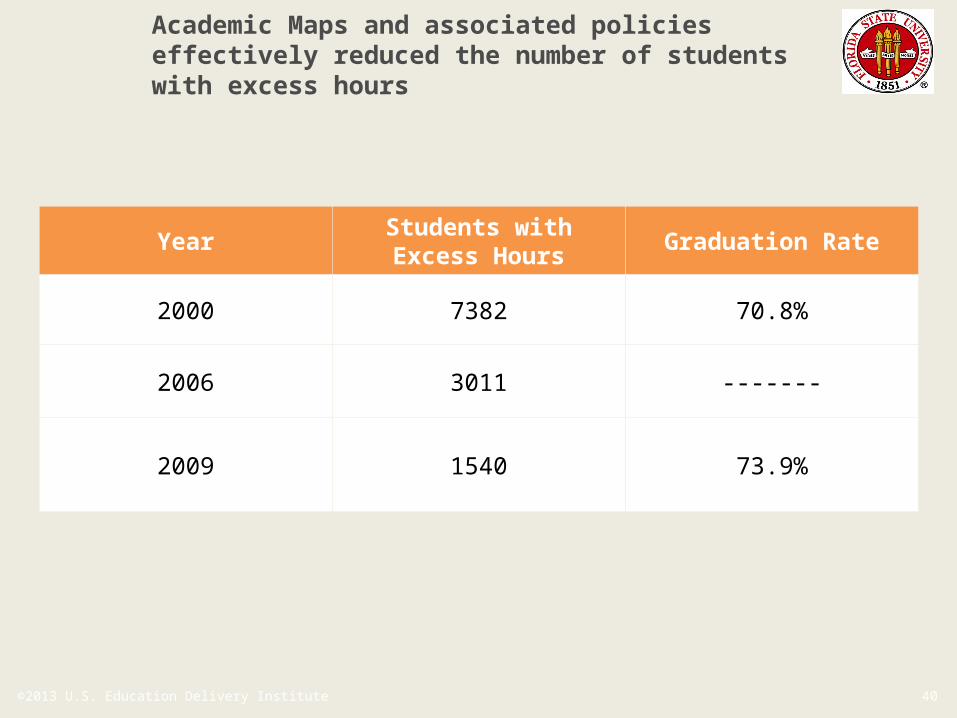
Academic Maps and associated policies effectively reduced the number of students with excess hours
YearStudents with Excess Hours
Graduation Rate
2000 7382 70.8%
2006 3011 -------
2009 1540 73.9%
41 ©2013 U.S. Education Delivery Institute
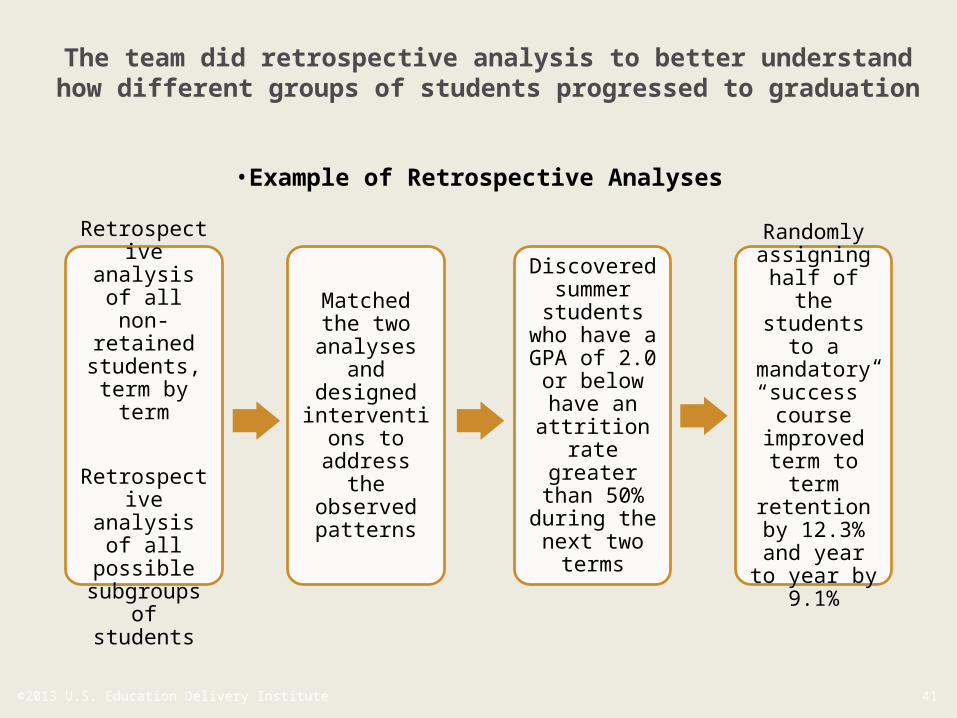
The team did retrospective analysis to better understand how different groups of students progressed to graduation
•Example of Retrospective Analyses
Retrospective analysis of
all non-retained students, term by
term
Retrospective analysis of all possible subgroups of students
Matched the two
analyses and
designed interventions to address
the observed patterns
Randomly assigning half of the students to
a mandatory “success”
course improved term to
term retention by 12.3% and
year to year by 9.1%
Discovered summer students
who have a GPA of 2.0 or below have an attrition
rate greater than 50% during the next two
terms
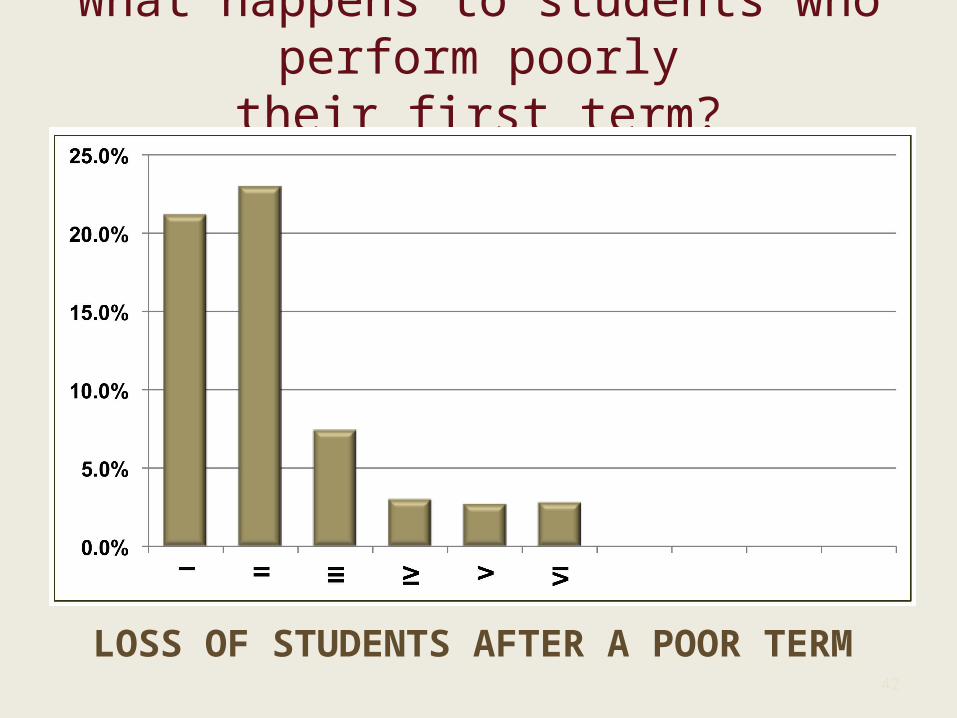
What happens to students who perform poorlytheir first term?
42
LOSS OF STUDENTS AFTER A POOR TERM
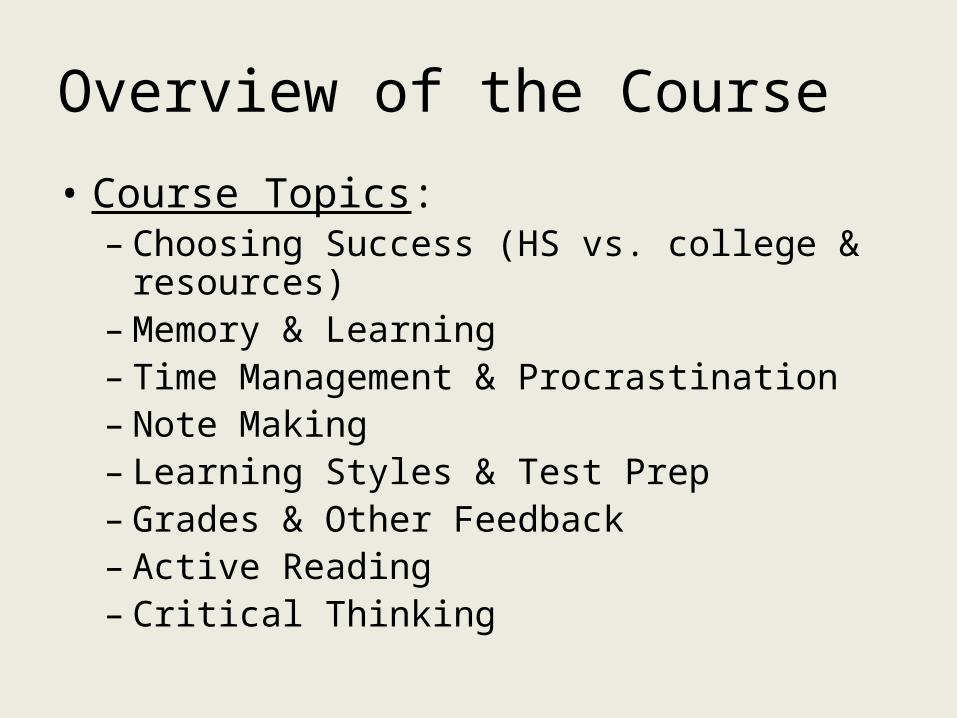
Overview of the Course
• Course Topics:– Choosing Success (HS vs. college & resources)– Memory & Learning– Time Management & Procrastination– Note Making– Learning Styles & Test Prep– Grades & Other Feedback– Active Reading– Critical Thinking
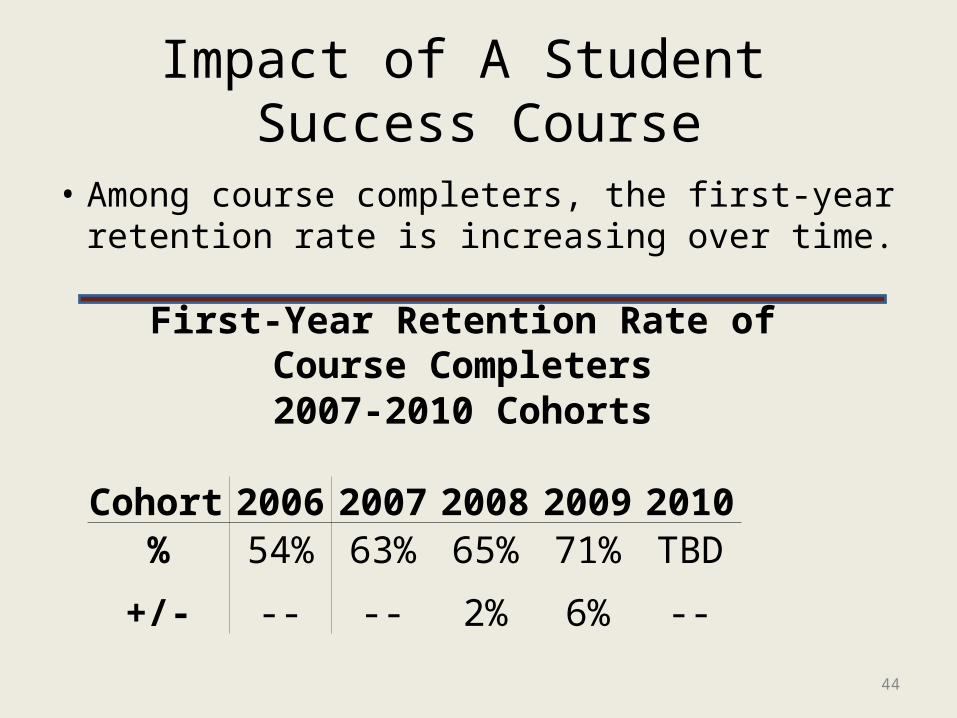
Impact of A Student Success Course
• Among course completers, the first-year retention rate is increasing over time.
44
First-Year Retention Rate of Course Completers2007-2010 Cohorts
Cohort 2006 2007 2008 2009 2010% 54% 63% 65% 71% TBD
+/- -- -- 2% 6% --
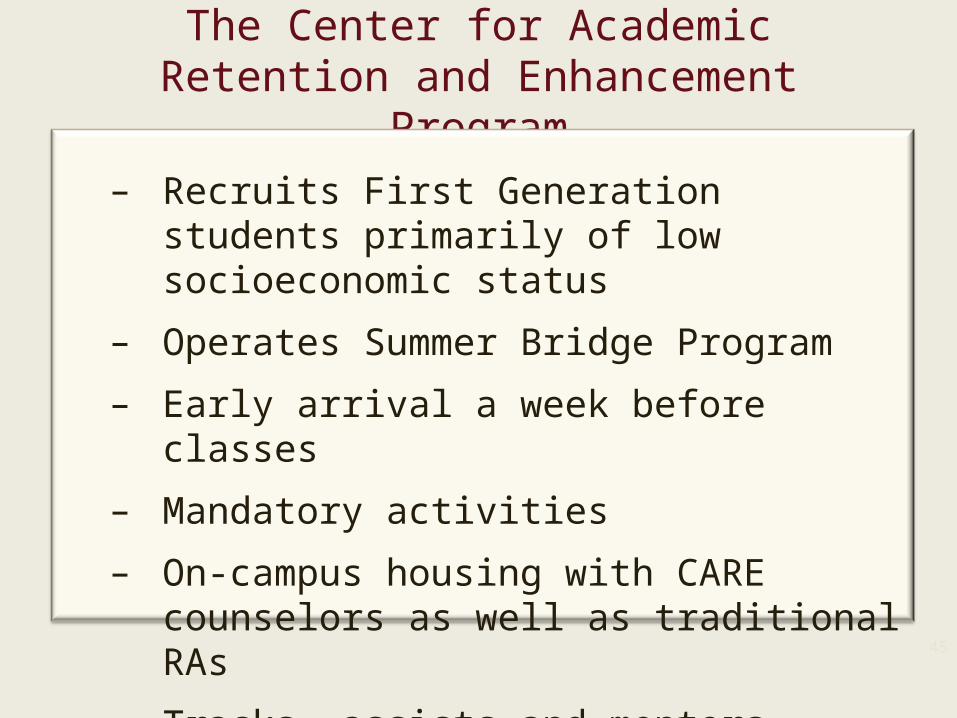
The Center for Academic Retention and Enhancement Program
– Recruits First Generation students primarily of low socioeconomic status
– Operates Summer Bridge Program
– Early arrival a week before classes
– Mandatory activities
– On-campus housing with CARE counselors as well as traditional RAs
– Tracks, assists and mentors students45
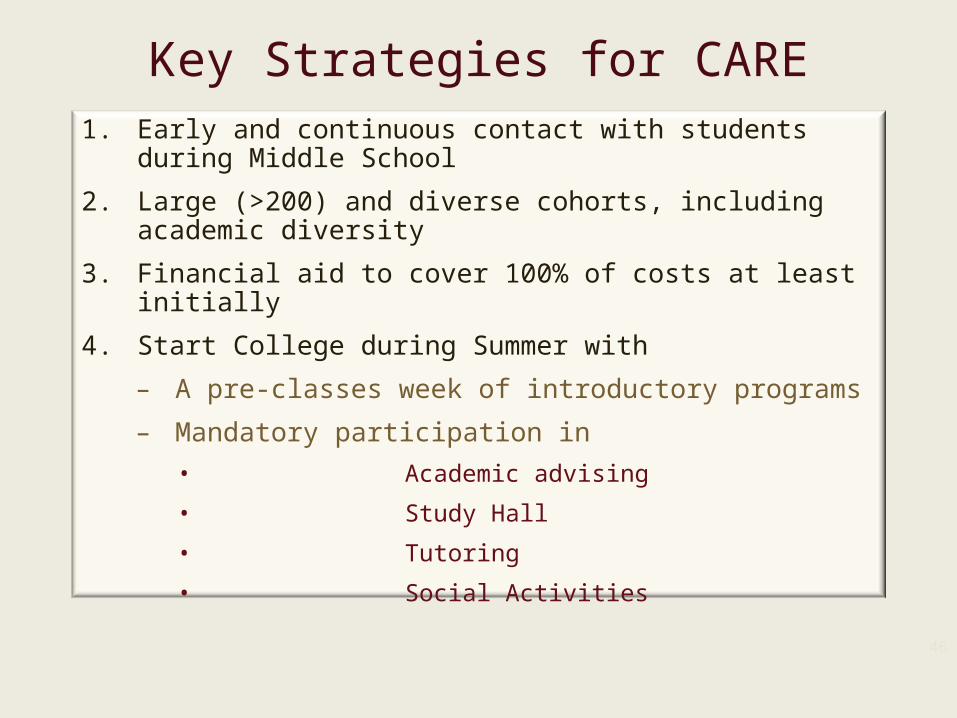
Key Strategies for CARE1. Early and continuous contact with students during
Middle School
2. Large (>200) and diverse cohorts, including academic diversity
3. Financial aid to cover 100% of costs at least initially
4. Start College during Summer with
– A pre-classes week of introductory programs
– Mandatory participation in
• Academic advising
• Study Hall
• Tutoring
• Social Activities
46
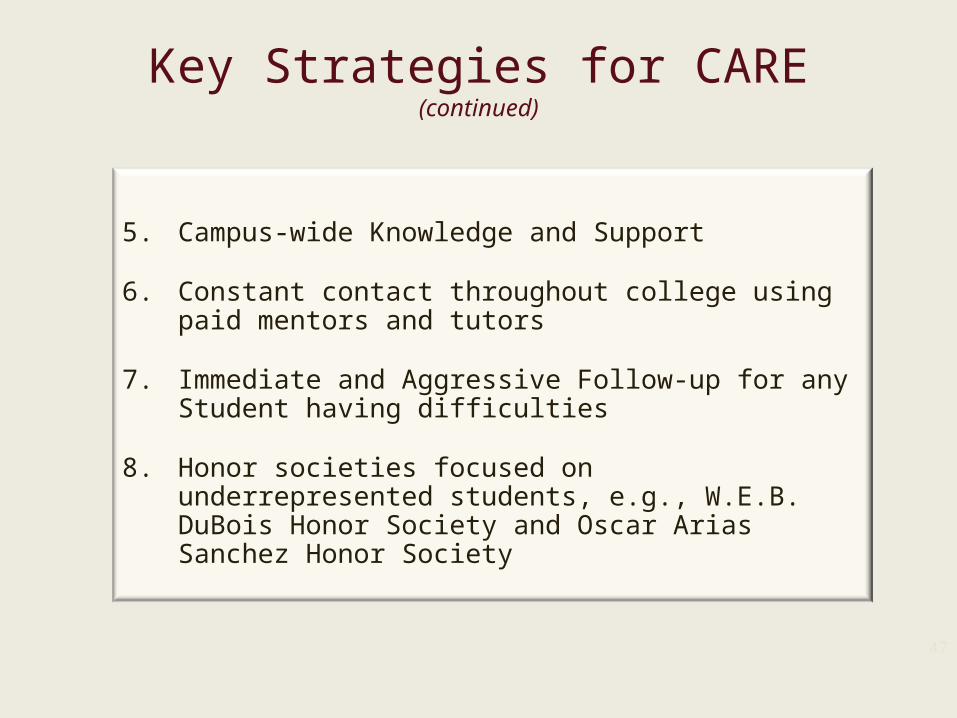
Key Strategies for CARE(continued)
5. Campus-wide Knowledge and Support
6. Constant contact throughout college using paid mentors and tutors
7. Immediate and Aggressive Follow-up for any Student having difficulties
8. Honor societies focused on underrepresented students, e.g., W.E.B. DuBois Honor Society and Oscar Arias Sanchez Honor Society
47
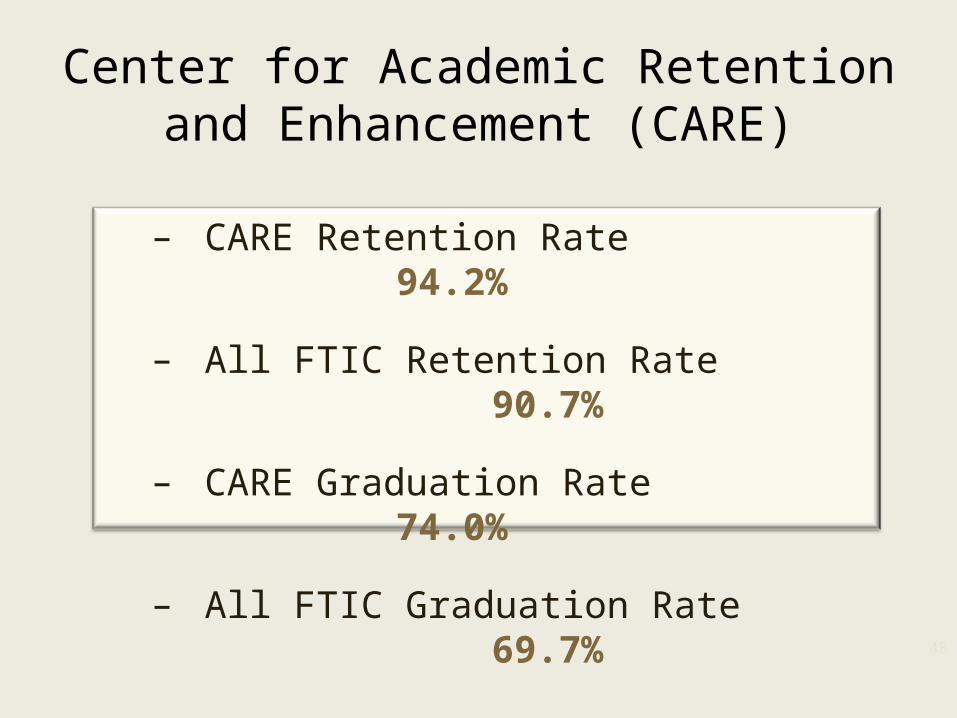
Center for Academic Retention and Enhancement (CARE)
– CARE Retention Rate94.2%
– All FTIC Retention Rate90.7%
– CARE Graduation Rate74.0%
– All FTIC Graduation Rate69.7% 48
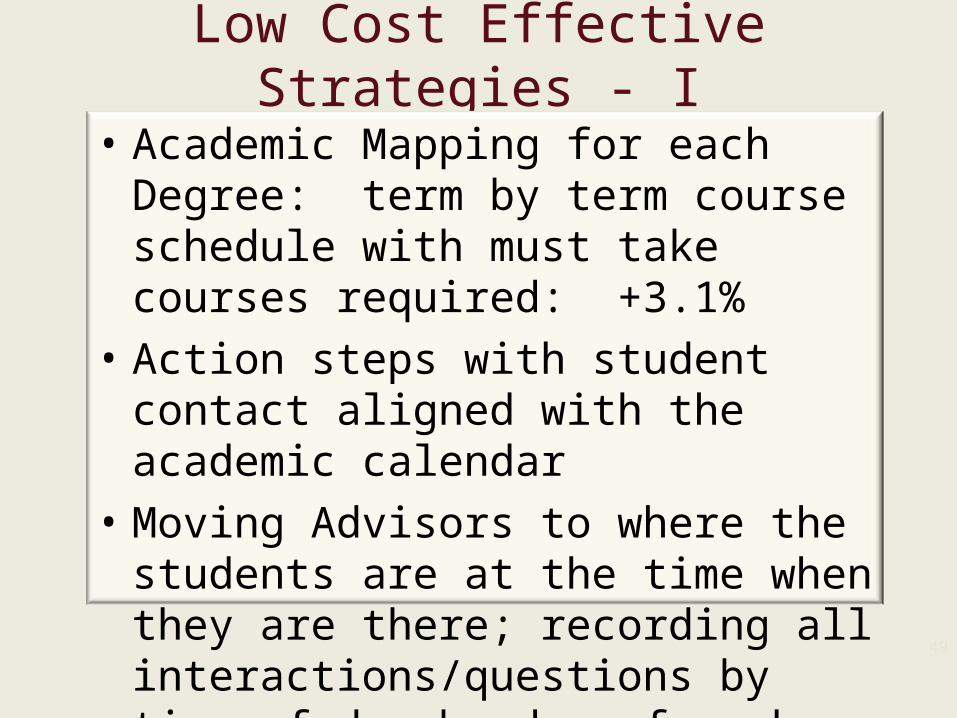
Low Cost Effective Strategies - I
• Academic Mapping for each Degree: term by term course schedule with must take courses required: +3.1%
• Action steps with student contact aligned with the academic calendar
• Moving Advisors to where the students are at the time when they are there; recording all interactions/questions by time-of-day by day-of-week.
49
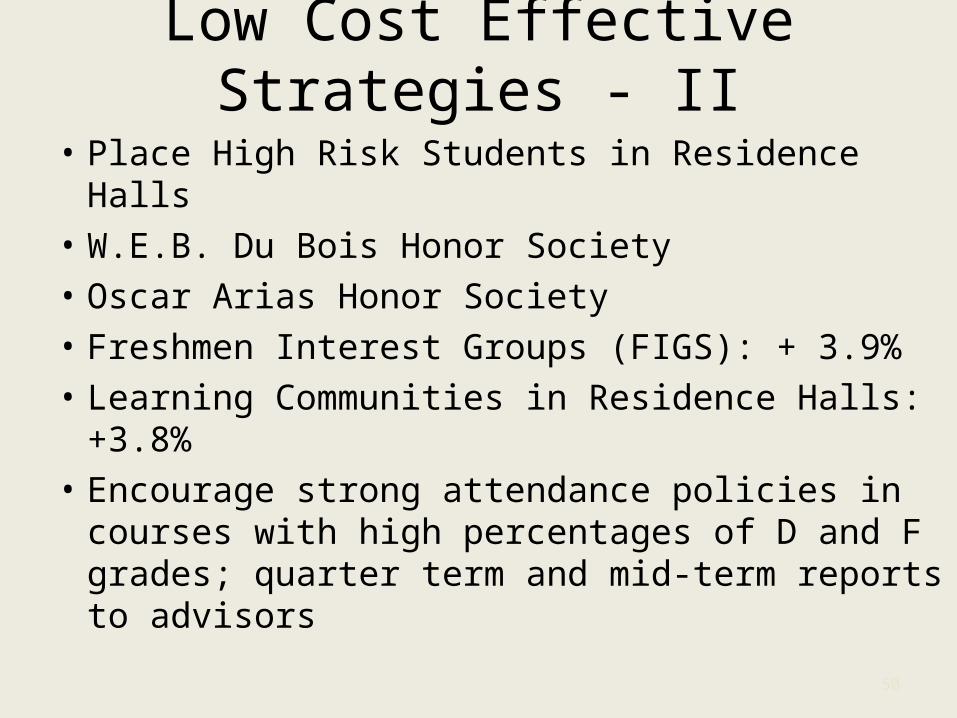
Low Cost Effective Strategies - II
• Place High Risk Students in Residence Halls• W.E.B. Du Bois Honor Society• Oscar Arias Honor Society• Freshmen Interest Groups (FIGS): + 3.9%• Learning Communities in Residence Halls: +3.8%• Encourage strong attendance policies in courses
with high percentages of D and F grades; quarter term and mid-term reports to advisors
50
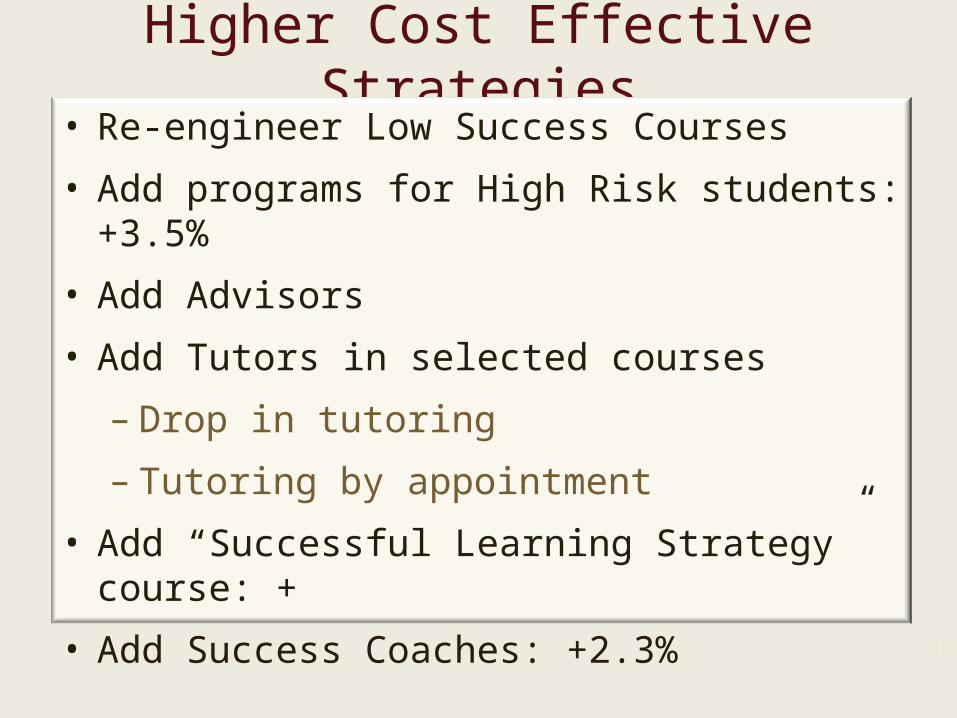
Higher Cost Effective Strategies• Re-engineer Low Success Courses
• Add programs for High Risk students: +3.5%
• Add Advisors
• Add Tutors in selected courses
– Drop in tutoring
– Tutoring by appointment
• Add “Successful Learning Strategy” course: +
• Add Success Coaches: +2.3%
51
52 ©2013 U.S. Education Delivery Institute
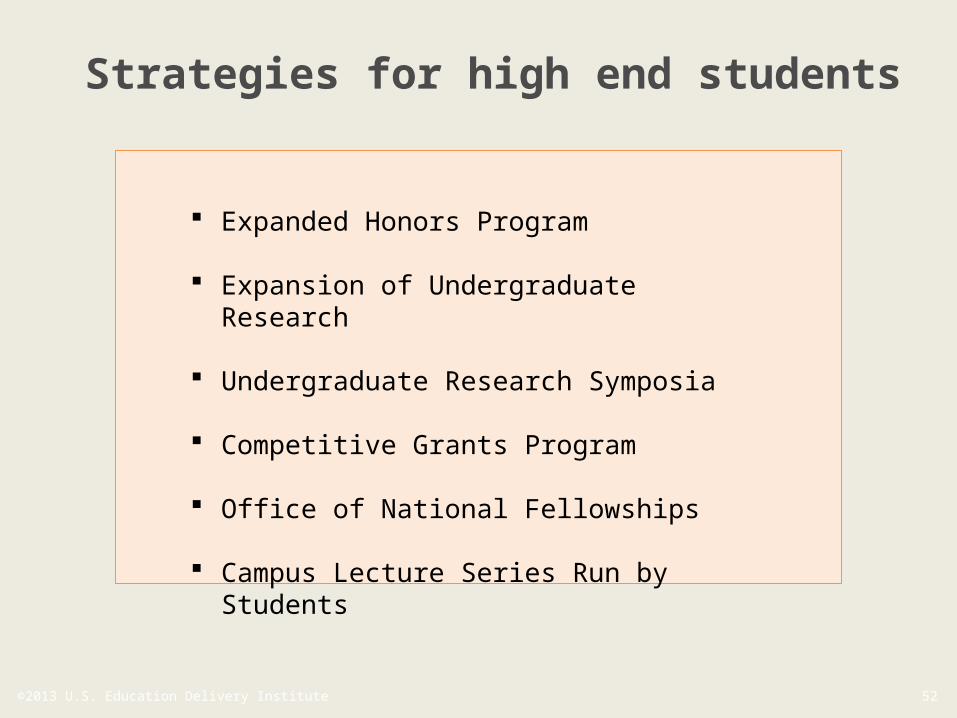
Strategies for high end students
Expanded Honors Program
Expansion of Undergraduate Research
Undergraduate Research Symposia
Competitive Grants Program
Office of National Fellowships
Campus Lecture Series Run by Students
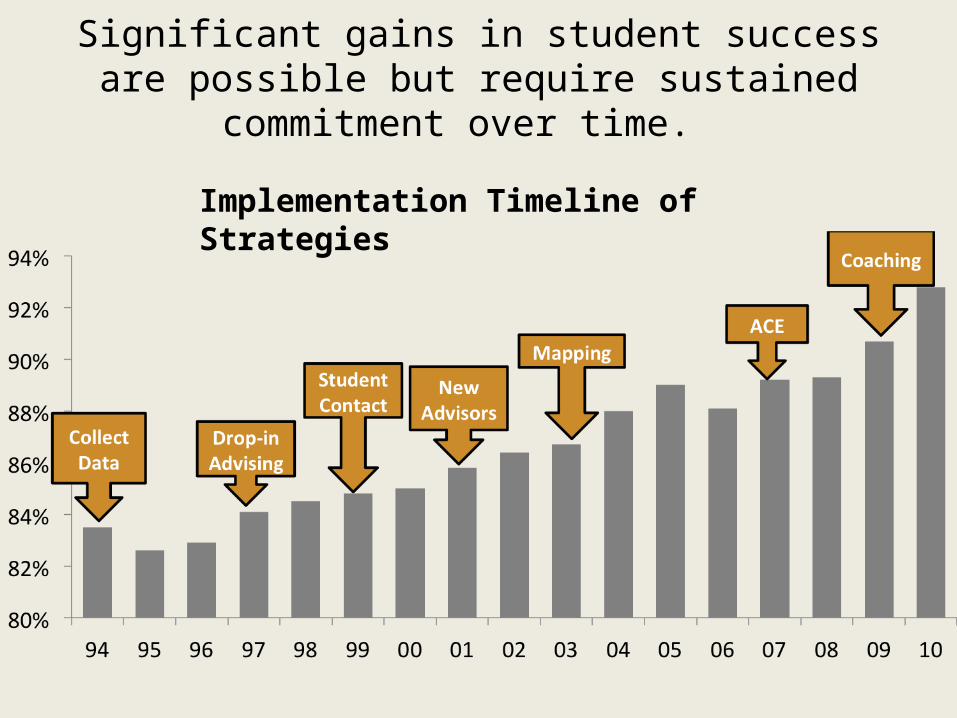
Significant gains in student success are possible but require sustained commitment over time.
Implementation Timeline of Strategies
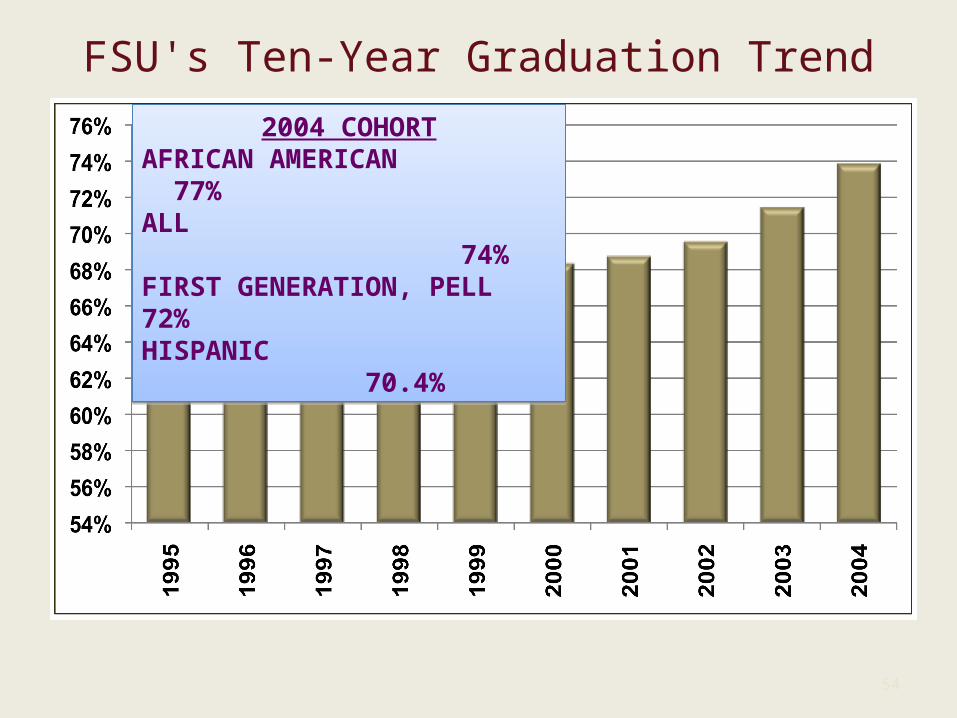
FSU's Ten-Year Graduation Trend
54
2004 COHORTAFRICAN AMERICAN 77%ALL 74%FIRST GENERATION, PELL 72%HISPANIC 70.4%
2004 COHORTAFRICAN AMERICAN 77%ALL 74%FIRST GENERATION, PELL 72%HISPANIC 70.4%
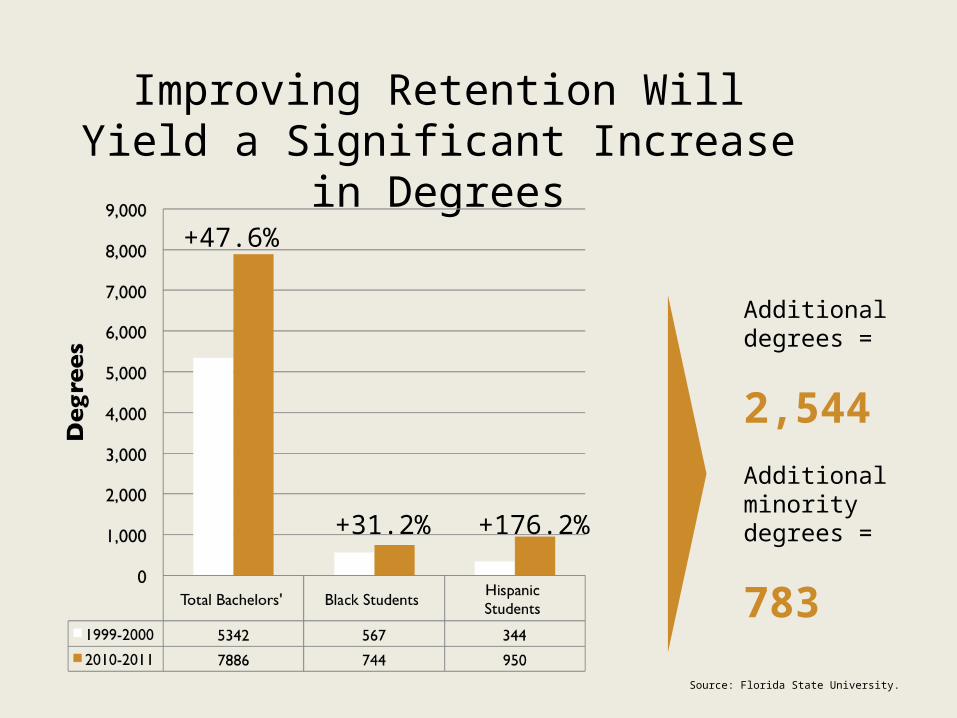
Improving Retention Will Yield a Significant Increase in Degrees
Source: Florida State University.
Additional degrees =
2,544
Additional minority degrees =
783
+47.6%
+31.2% +176.2%

Questions?
56