A Traffic Simulation Approach to Evaluating the Benefits of Incident
14
A Traffic Simulation Approach to Evaluating the Benefits of Incident Management Programs 29 th Australasian Transport Research Forum Page 1 A Traffic Simulation Approach to Evaluating the Benefits of Incident Management Programs Hussein Dia 1 , William Gondwe 2 , and Sakda Panwai 3 1 Intelligent Transport Systems Research Laboratory, the University of Queensland, Brisbane, QLD, Australia 2 Principal Project Officer (ITS and Road Operations), Queensland Main Roads. 3 Intelligent Transport Systems Research Laboratory, the University of Queensland, Brisbane, QLD, Australia 1 INTRODUCTION Quantifying the impacts of ITS technologies is an important and necessary undertaking in order to justify the expenditure of public funds on ITS projects. For example, roadway incidents such as accidents, broken-down vehicles or other events that reduce the capacity of the facility impose a substantial cost to society when delays, congestion, secondary incidents, and environmental emissions are taken into consideration (Lindley, 1987). These impacts can be substantially reduced through implementation of incident management programs (e.g. Dia and Rose, 1998). Significant benefits can be gained from early incident detection, quick response, provision of real-time traveller information and timely dispatch of emergence services. This can result in reducing traffic delays, secondary accidents, air pollution, and generally improve road safety and real-time traffic control. Recently, there has been a growing interest in developing traffic incident management plans for integrated freeway and arterial road networks and evaluating the effectiveness of such plans in minimising the effects of congestion. This is particularly important when evaluating incident management plans involving traffic being diverted to adjacent arterial networks. The impacts of incident management programs on network performance can be evaluated either in field studies or using traffic simulation. Field studies are generally expensive to conduct and they don’t offer flexibility in investigating alternative scenarios. The use of computer modelling, and microscopic traffic simulation in particular, offers a more feasible and cost-effective approach, in which input conditions can be varied (e.g. to reflect incidents during peak and non-peak conditions) and their impacts on network performance evaluated. It is clear that the benefits of these programs will depend on the extent of existing congestion in the road network, and will also vary according to the severity of the incident, its duration, and the time of day during which it occurs. These impacts can be determined by simulating incidents and varying their location, duration, and severity, and comparing the resulting network performance against a non-incident base case scenario. The traffic simulation model can also predict changes in the behaviour of individual drivers in response to a set of scenarios and provide output for analysis. Environmental emissions models can also be linked to the traffic simulation model and used to estimate fuel consumption and emissions. The work reported in this paper is part of a research project aimed at demonstrating the feasibility of using micro-simulation models to evaluate the potential benefits that can be realised from the integration of incident management strategies on both the arterial and motorway networks such that traffic can be diverted to least congested routes. Data collected from the test-bed on the Gold Coast and the Nerang Traffic Management Centre is being used to develop, test and evaluate incident management strategies under live conditions and develop route diversion plans. The project uses AIMSUN microscopic simulation to develop the strategies. For this paper, part of the simulation model for a major arterial road on the Gold Coast will be used to demonstrate the feasibility of the approach. Results of simulating incidents on the motorway and creating diversion plans to the arterial network are the subject of another paper submission and won’t be addressed in this paper.
Transcript of A Traffic Simulation Approach to Evaluating the Benefits of Incident
A Traffic Simulation Approach to Evaluating the Benefits of Incident Management Programs
29
th Australasian Transport Research Forum Page 1
A Traffic Simulation Approach to Evaluating the Benefits of Incident Management Programs
Hussein Dia1, William Gondwe2, and Sakda Panwai3 1 Intelligent Transport Systems Research Laboratory, the University of Queensland, Brisbane, QLD, Australia 2 Principal Project Officer (ITS and Road Operations), Queensland Main Roads. 3 Intelligent Transport Systems Research Laboratory, the University of Queensland, Brisbane, QLD, Australia
1 INTRODUCTION
Quantifying the impacts of ITS technologies is an important and necessary undertaking in order to justify the expenditure of public funds on ITS projects. For example, roadway incidents such as accidents, broken-down vehicles or other events that reduce the capacity of the facility impose a substantial cost to society when delays, congestion, secondary incidents, and environmental emissions are taken into consideration (Lindley, 1987). These impacts can be substantially reduced through implementation of incident management programs (e.g. Dia and Rose, 1998). Significant benefits can be gained from early incident detection, quick response, provision of real-time traveller information and timely dispatch of emergence services. This can result in reducing traffic delays, secondary accidents, air pollution, and generally improve road safety and real-time traffic control. Recently, there has been a growing interest in developing traffic incident management plans for integrated freeway and arterial road networks and evaluating the effectiveness of such plans in minimising the effects of congestion. This is particularly important when evaluating incident management plans involving traffic being diverted to adjacent arterial networks. The impacts of incident management programs on network performance can be evaluated either in field studies or using traffic simulation. Field studies are generally expensive to conduct and they don’t offer flexibility in investigating alternative scenarios. The use of computer modelling, and microscopic traffic simulation in particular, offers a more feasible and cost-effective approach, in which input conditions can be varied (e.g. to reflect incidents during peak and non-peak conditions) and their impacts on network performance evaluated. It is clear that the benefits of these programs will depend on the extent of existing congestion in the road network, and will also vary according to the severity of the incident, its duration, and the time of day during which it occurs. These impacts can be determined by simulating incidents and varying their location, duration, and severity, and comparing the resulting network performance against a non-incident base case scenario. The traffic simulation model can also predict changes in the behaviour of individual drivers in response to a set of scenarios and provide output for analysis. Environmental emissions models can also be linked to the traffic simulation model and used to estimate fuel consumption and emissions. The work reported in this paper is part of a research project aimed at demonstrating the feasibility of using micro-simulation models to evaluate the potential benefits that can be realised from the integration of incident management strategies on both the arterial and motorway networks such that traffic can be diverted to least congested routes. Data collected from the test-bed on the Gold Coast and the Nerang Traffic Management Centre is being used to develop, test and evaluate incident management strategies under live conditions and develop route diversion plans. The project uses AIMSUN microscopic simulation to develop the strategies. For this paper, part of the simulation model for a major arterial road on the Gold Coast will be used to demonstrate the feasibility of the approach. Results of simulating incidents on the motorway and creating diversion plans to the arterial network are the subject of another paper submission and won’t be addressed in this paper.
A Traffic Simulation Approach to Evaluating the Benefits of Incident Management Programs
29
th Australasian Transport Research Forum Page 2
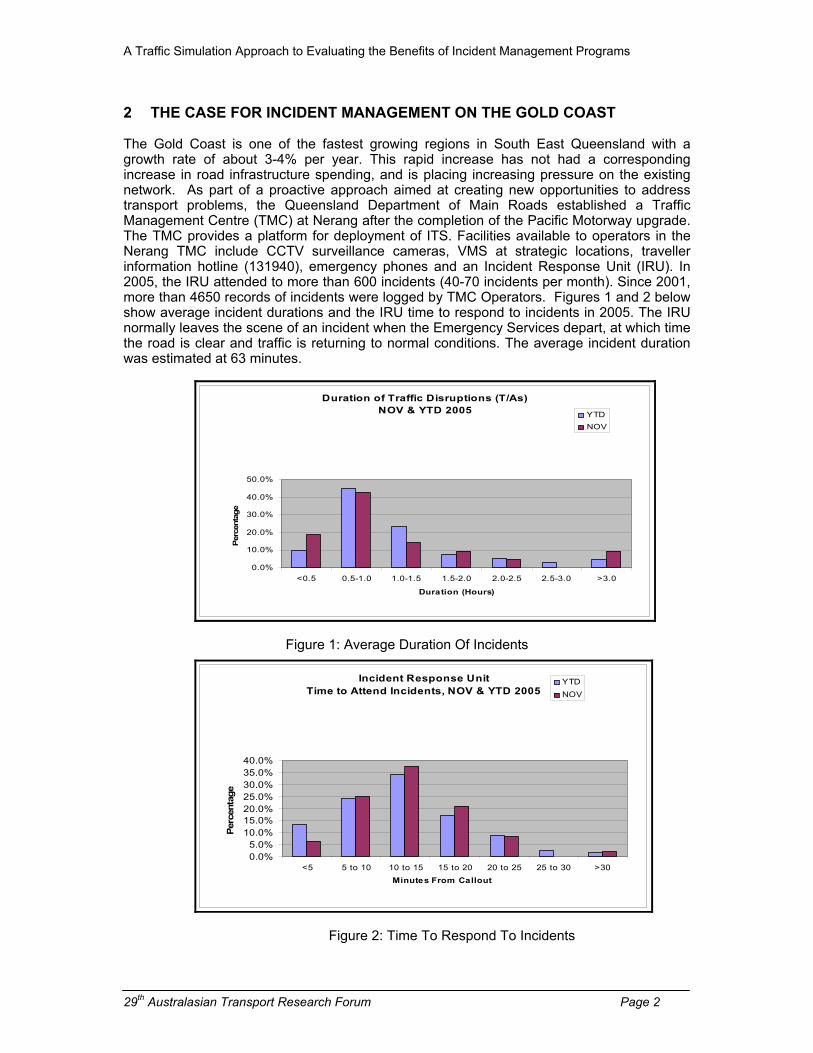
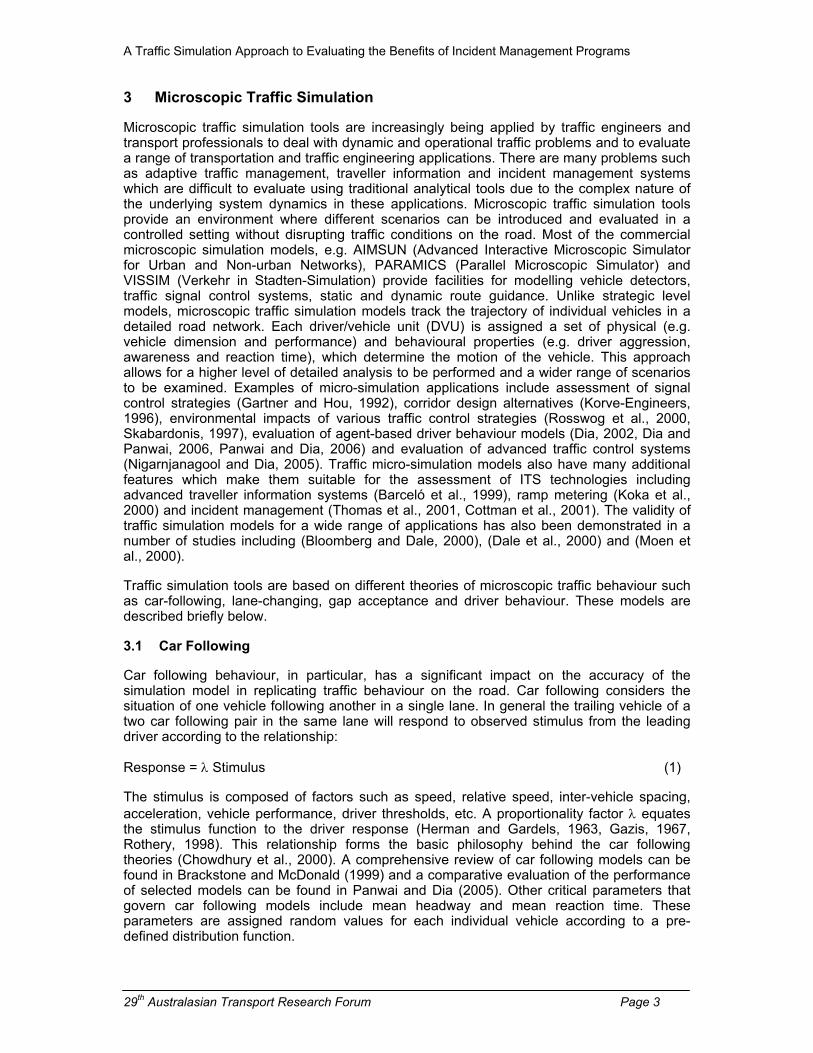
2 THE CASE FOR INCIDENT MANAGEMENT ON THE GOLD COAST The Gold Coast is one of the fastest growing regions in South East Queensland with a growth rate of about 3-4% per year. This rapid increase has not had a corresponding increase in road infrastructure spending, and is placing increasing pressure on the existing network. As part of a proactive approach aimed at creating new opportunities to address transport problems, the Queensland Department of Main Roads established a Traffic Management Centre (TMC) at Nerang after the completion of the Pacific Motorway upgrade. The TMC provides a platform for deployment of ITS. Facilities available to operators in the Nerang TMC include CCTV surveillance cameras, VMS at strategic locations, traveller information hotline (131940), emergency phones and an Incident Response Unit (IRU). In 2005, the IRU attended to more than 600 incidents (40-70 incidents per month). Since 2001, more than 4650 records of incidents were logged by TMC Operators. Figures 1 and 2 below show average incident durations and the IRU time to respond to incidents in 2005. The IRU normally leaves the scene of an incident when the Emergency Services depart, at which time the road is clear and traffic is returning to normal conditions. The average incident duration was estimated at 63 minutes.
Duration of Traffic Disruptions (T/As)
NOV & YTD 2005
0.0%
10.0%
20.0%
30.0%
40.0%
50.0%
<0.5 0.5-1.0 1.0-1.5 1.5-2.0 2.0-2.5 2.5-3.0 >3.0
Duration (Hours)
Perc
enta
ge
YTD
NOV
Figure 1: Average Duration Of Incidents
Incident Response Unit
Time to Attend Incidents, NOV & YTD 2005
0.0%
5.0%
10.0%
15.0%
20.0%
25.0%
30.0%
35.0%
40.0%
<5 5 to 10 10 to 15 15 to 20 20 to 25 25 to 30 >30
Minutes From Callout
Perc
enta
ge
YTD
NOV
Figure 2: Time To Respond To Incidents
A Traffic Simulation Approach to Evaluating the Benefits of Incident Management Programs
29
th Australasian Transport Research Forum Page 3
3 Microscopic Traffic Simulation Microscopic traffic simulation tools are increasingly being applied by traffic engineers and transport professionals to deal with dynamic and operational traffic problems and to evaluate a range of transportation and traffic engineering applications. There are many problems such as adaptive traffic management, traveller information and incident management systems which are difficult to evaluate using traditional analytical tools due to the complex nature of the underlying system dynamics in these applications. Microscopic traffic simulation tools provide an environment where different scenarios can be introduced and evaluated in a controlled setting without disrupting traffic conditions on the road. Most of the commercial microscopic simulation models, e.g. AIMSUN (Advanced Interactive Microscopic Simulator for Urban and Non-urban Networks), PARAMICS (Parallel Microscopic Simulator) and VISSIM (Verkehr in Stadten-Simulation) provide facilities for modelling vehicle detectors, traffic signal control systems, static and dynamic route guidance. Unlike strategic level models, microscopic traffic simulation models track the trajectory of individual vehicles in a detailed road network. Each driver/vehicle unit (DVU) is assigned a set of physical (e.g. vehicle dimension and performance) and behavioural properties (e.g. driver aggression, awareness and reaction time), which determine the motion of the vehicle. This approach allows for a higher level of detailed analysis to be performed and a wider range of scenarios to be examined. Examples of micro-simulation applications include assessment of signal control strategies (Gartner and Hou, 1992), corridor design alternatives (Korve-Engineers, 1996), environmental impacts of various traffic control strategies (Rosswog et al., 2000, Skabardonis, 1997), evaluation of agent-based driver behaviour models (Dia, 2002, Dia and Panwai, 2006, Panwai and Dia, 2006) and evaluation of advanced traffic control systems (Nigarnjanagool and Dia, 2005). Traffic micro-simulation models also have many additional features which make them suitable for the assessment of ITS technologies including advanced traveller information systems (Barceló et al., 1999), ramp metering (Koka et al., 2000) and incident management (Thomas et al., 2001, Cottman et al., 2001). The validity of traffic simulation models for a wide range of applications has also been demonstrated in a number of studies including (Bloomberg and Dale, 2000), (Dale et al., 2000) and (Moen et al., 2000). Traffic simulation tools are based on different theories of microscopic traffic behaviour such as car-following, lane-changing, gap acceptance and driver behaviour. These models are described briefly below.
3.1 Car Following Car following behaviour, in particular, has a significant impact on the accuracy of the simulation model in replicating traffic behaviour on the road. Car following considers the situation of one vehicle following another in a single lane. In general the trailing vehicle of a two car following pair in the same lane will respond to observed stimulus from the leading driver according to the relationship:
Response = n Stimulus (1)
The stimulus is composed of factors such as speed, relative speed, inter-vehicle spacing, acceleration, vehicle performance, driver thresholds, etc. A proportionality factor n equates the stimulus function to the driver response (Herman and Gardels, 1963, Gazis, 1967, Rothery, 1998). This relationship forms the basic philosophy behind the car following theories (Chowdhury et al., 2000). A comprehensive review of car following models can be found in Brackstone and McDonald (1999) and a comparative evaluation of the performance of selected models can be found in Panwai and Dia (2005). Other critical parameters that govern car following models include mean headway and mean reaction time. These parameters are assigned random values for each individual vehicle according to a pre-defined distribution function.
A Traffic Simulation Approach to Evaluating the Benefits of Incident Management Programs
29
th Australasian Transport Research Forum Page 4
3.2 Lane Changing An understanding of the lane changing process, or lateral movement of vehicles, is also necessary to allow an accurate representation of traffic flow behaviour in multi-lane situations. Lane changing considers the process by which a driver moves between adjacent lanes to achieve a desired goal. For example, lane changing can occur when a vehicle’s speed is impeded by the vehicle in front or when a disabled vehicle or incident blocks one or more lanes or when a lane is dropped or added (e.g. three lanes into two lanes). Three main categories of lane changing models are reported in the literature:
1. The safety-based model considers the extent to which the rear vehicle in the target lane is willing to decelerate to allow the lane-changing manoeuvre to occur. The Gipps model (1981) belongs to this category of lane-changing models.
2. The scoring and threshold model assesses the stimulus to lane changing based on
a range of scaled factors. Each factor that influences the lane changing decision (relative speed, speed advantage, proximity, etc.) is assigned a score for each decision and the sum of scores compared with a predefined decision threshold. The main criticism of this type of model is that it is difficult to calibrate.
3. The action point model represents human perception of speeds and distances in the lane changing process. Perceptions are compared to threshold values to determine whether drivers can achieve the lane change. The algorithm implemented in VISSIM (PTV, 2004) belongs to this category of lane changing models.
3.3 Gap Acceptance In conflicting situations, drivers must find an acceptable or ‘safe’ gap in which to merge with or cross the major traffic flow. Important parameters in gap acceptance are the critical gap and follow-up headway for the minor road, and the distribution of car following headways on the major route (Akçelik and Besley, 2001). Some gap acceptance models include variability in the acceptable gap and have provisions for modelling drivers’ tolerance thresholds as they wait for an acceptable gap (Velan and Van Aerde, 1996).
3.4 Driver Behaviour Additional driver behaviour parameters, aggression and awareness, are included in some models. Aggression and awareness values are assigned randomly to individual DVUs according to a statistical distribution. Dia (2002) and Dia and Panwai (2006) presented an agent-based neural network model (Neugent) to addresses commuters’ route choice behaviour in response to traveller information systems. The Neugent model can be used to analyse the impacts of socio-economic, context and information variables on individual behaviour and propensity to change route and adjust travel patterns. An evaluation of the benefits of the Neugent model over static route choice algorithms showed improvements of 4-7 percent in network speeds; 5-8 percent in network delays; 7-11 percent in stop time per vehicle and 1-3 percent in network travel times.
3.5 Selection of Simulator The three most commonly used commercial simulation tools are AIMSUN (TSS, 2005), PARAMICS (Quadstone, 2005) and VISSIM (PTV, 2004). These tools are based on different theories of microscopic traffic behaviour such as car-following and lane-changing models. For this study, AIMSUN was selected for model testing. The selection was based on a comparative evaluation of the car following behaviour in a number of simulation tools which showed that the Gipps model implemented in AIMSUN performed better than the family of psychophysical car following models implemented in PARAMICS and VISSIM (Panwai and Dia, 2005).This simulation software also has a number of unique features which allow the
A Traffic Simulation Approach to Evaluating the Benefits of Incident Management Programs
29
th Australasian Transport Research Forum Page 5
user to customise many features of the underlying simulation model through an application programming interface (API). This feature is critical for this study, as it will allow for interfacing fuel consumption/emission with the traffic simulation tool.
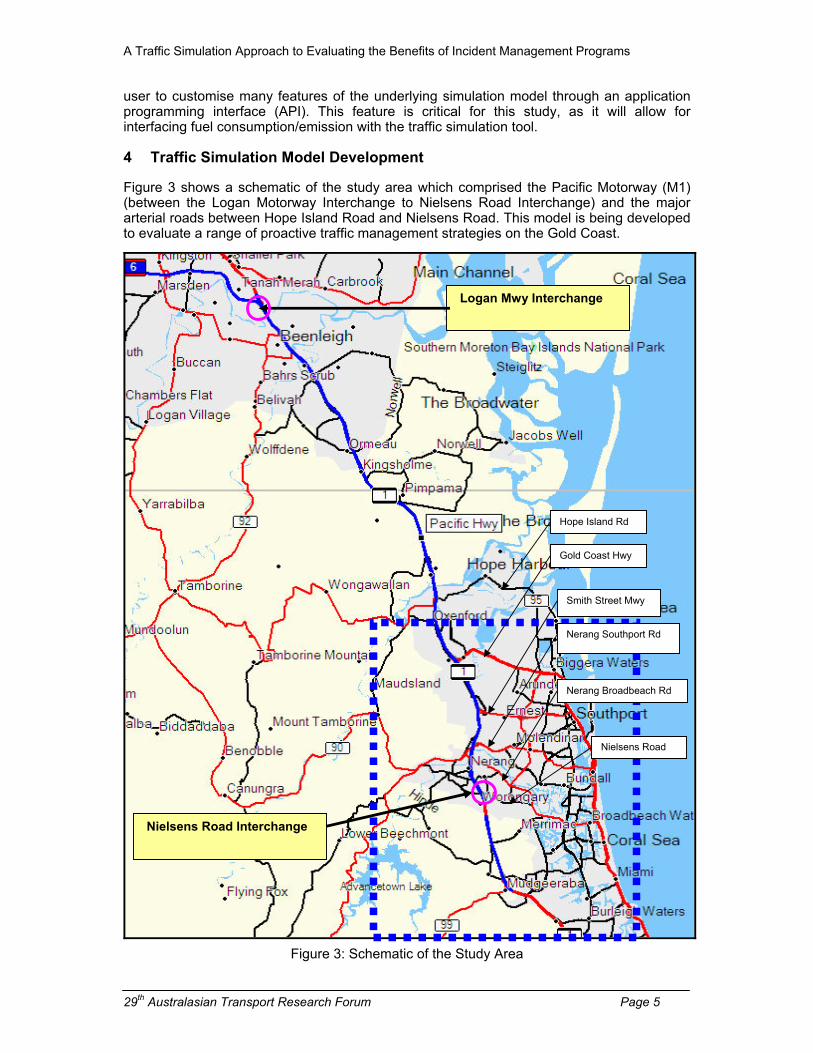
4 Traffic Simulation Model Development Figure 3 shows a schematic of the study area which comprised the Pacific Motorway (M1) (between the Logan Motorway Interchange to Nielsens Road Interchange) and the major arterial roads between Hope Island Road and Nielsens Road. This model is being developed to evaluate a range of proactive traffic management strategies on the Gold Coast.
Figure 3: Schematic of the Study Area
Nerang Broadbeach Rd
Logan Mwy Interchange
Nerang Southport Rd
Smith Street Mwy
Gold Coast Hwy
Nielsens Road
Hope Island Rd
Nielsens Road Interchange
A Traffic Simulation Approach to Evaluating the Benefits of Incident Management Programs
29
th Australasian Transport Research Forum Page 6
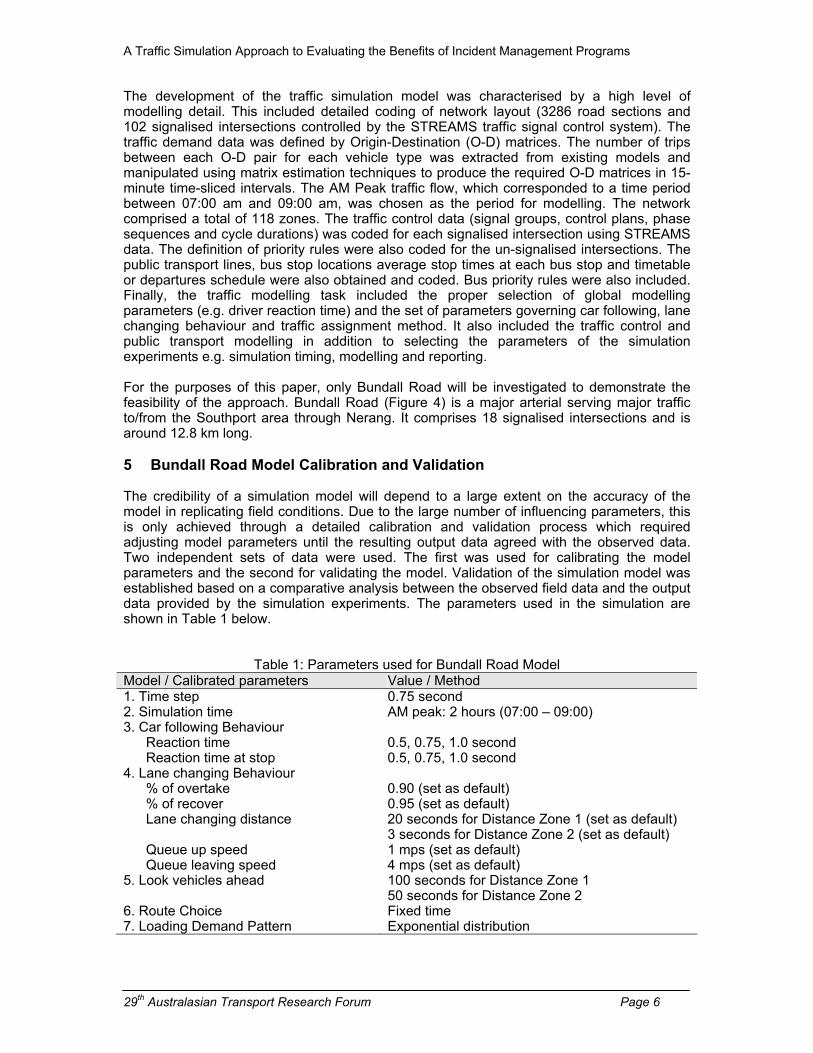
The development of the traffic simulation model was characterised by a high level of modelling detail. This included detailed coding of network layout (3286 road sections and 102 signalised intersections controlled by the STREAMS traffic signal control system). The traffic demand data was defined by Origin-Destination (O-D) matrices. The number of trips between each O-D pair for each vehicle type was extracted from existing models and manipulated using matrix estimation techniques to produce the required O-D matrices in 15-minute time-sliced intervals. The AM Peak traffic flow, which corresponded to a time period between 07:00 am and 09:00 am, was chosen as the period for modelling. The network comprised a total of 118 zones. The traffic control data (signal groups, control plans, phase sequences and cycle durations) was coded for each signalised intersection using STREAMS data. The definition of priority rules were also coded for the un-signalised intersections. The public transport lines, bus stop locations average stop times at each bus stop and timetable or departures schedule were also obtained and coded. Bus priority rules were also included. Finally, the traffic modelling task included the proper selection of global modelling parameters (e.g. driver reaction time) and the set of parameters governing car following, lane changing behaviour and traffic assignment method. It also included the traffic control and public transport modelling in addition to selecting the parameters of the simulation experiments e.g. simulation timing, modelling and reporting. For the purposes of this paper, only Bundall Road will be investigated to demonstrate the feasibility of the approach. Bundall Road (Figure 4) is a major arterial serving major traffic to/from the Southport area through Nerang. It comprises 18 signalised intersections and is around 12.8 km long. 5 Bundall Road Model Calibration and Validation The credibility of a simulation model will depend to a large extent on the accuracy of the model in replicating field conditions. Due to the large number of influencing parameters, this is only achieved through a detailed calibration and validation process which required adjusting model parameters until the resulting output data agreed with the observed data. Two independent sets of data were used. The first was used for calibrating the model parameters and the second for validating the model. Validation of the simulation model was established based on a comparative analysis between the observed field data and the output data provided by the simulation experiments. The parameters used in the simulation are shown in Table 1 below.
Table 1: Parameters used for Bundall Road Model Model / Calibrated parameters Value / Method 1. Time step 0.75 second 2. Simulation time AM peak: 2 hours (07:00 – 09:00) 3. Car following Behaviour
Reaction time 0.5, 0.75, 1.0 second Reaction time at stop 0.5, 0.75, 1.0 second
4. Lane changing Behaviour % of overtake 0.90 (set as default) % of recover 0.95 (set as default) Lane changing distance 20 seconds for Distance Zone 1 (set as default)
3 seconds for Distance Zone 2 (set as default) Queue up speed 1 mps (set as default) Queue leaving speed 4 mps (set as default)
5. Look vehicles ahead 100 seconds for Distance Zone 1 50 seconds for Distance Zone 2
6. Route Choice Fixed time 7. Loading Demand Pattern Exponential distribution
A Traffic Simulation Approach to Evaluating the Benefits of Incident Management Programs
29
th Australasian Transport Research Forum Page 7
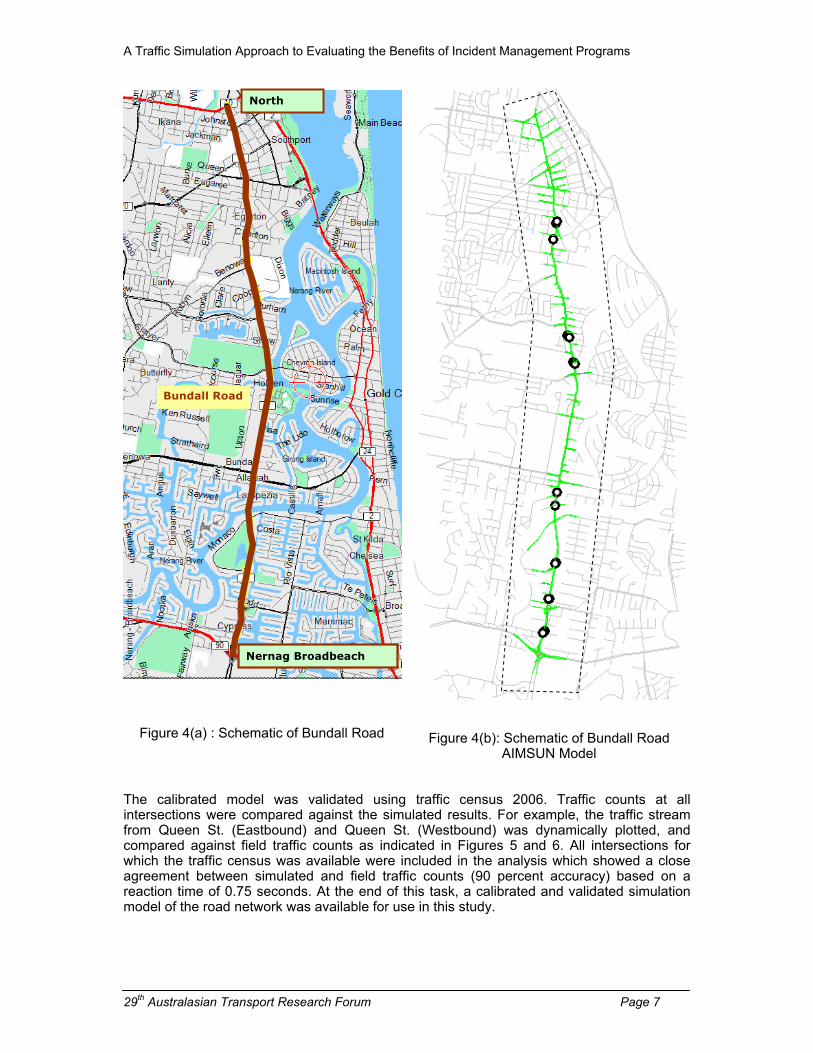
North
Nernag Broadbeach
Bundall Road
Figure 4(a) : Schematic of Bundall Road
Figure 4(b): Schematic of Bundall Road AIMSUN Model
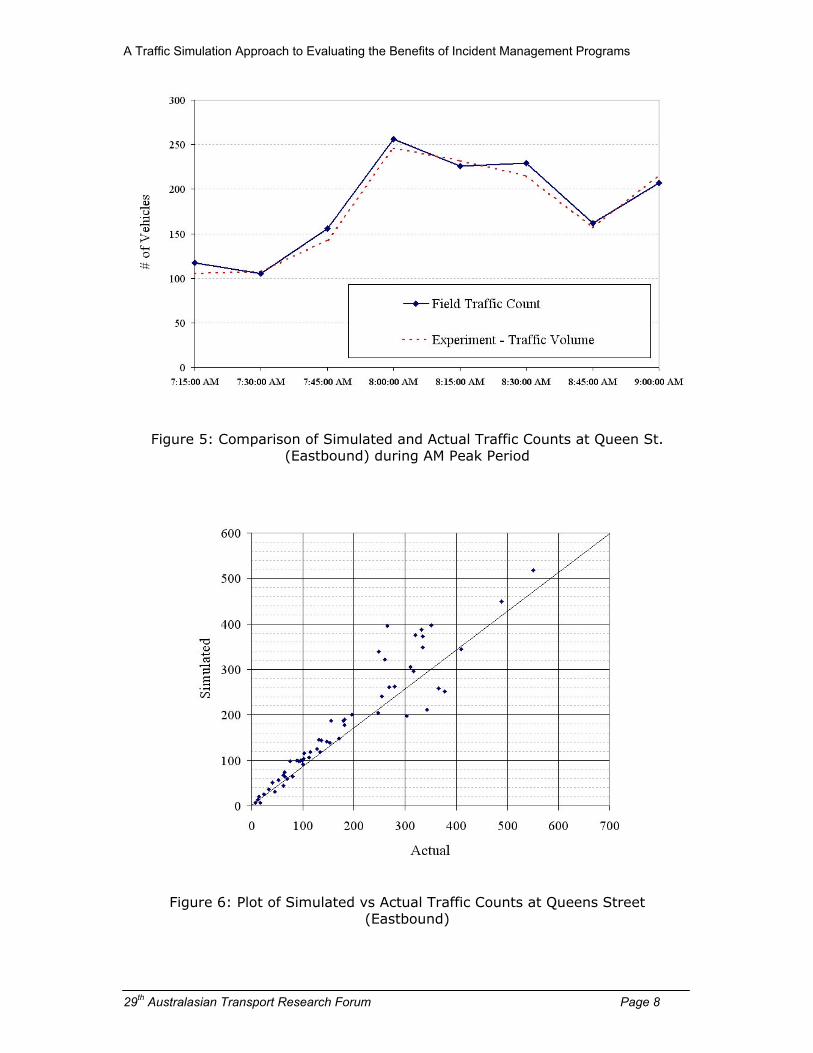
The calibrated model was validated using traffic census 2006. Traffic counts at all intersections were compared against the simulated results. For example, the traffic stream from Queen St. (Eastbound) and Queen St. (Westbound) was dynamically plotted, and compared against field traffic counts as indicated in Figures 5 and 6. All intersections for which the traffic census was available were included in the analysis which showed a close agreement between simulated and field traffic counts (90 percent accuracy) based on a reaction time of 0.75 seconds. At the end of this task, a calibrated and validated simulation model of the road network was available for use in this study.
A Traffic Simulation Approach to Evaluating the Benefits of Incident Management Programs
29
th Australasian Transport Research Forum Page 8
Figure 5: Comparison of Simulated and Actual Traffic Counts at Queen St.
(Eastbound) during AM Peak Period
Figure 6: Plot of Simulated vs Actual Traffic Counts at Queens Street (Eastbound)
A Traffic Simulation Approach to Evaluating the Benefits of Incident Management Programs
29
th Australasian Transport Research Forum Page 9
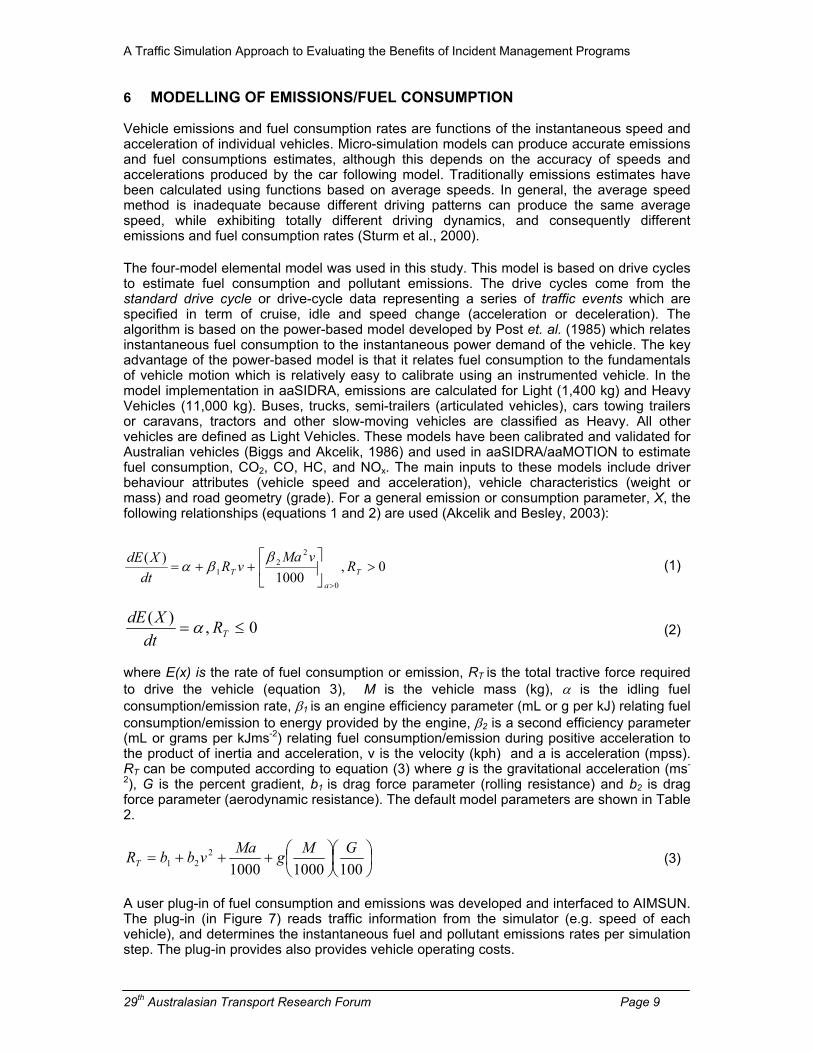
6 MODELLING OF EMISSIONS/FUEL CONSUMPTION Vehicle emissions and fuel consumption rates are functions of the instantaneous speed and acceleration of individual vehicles. Micro-simulation models can produce accurate emissions and fuel consumptions estimates, although this depends on the accuracy of speeds and accelerations produced by the car following model. Traditionally emissions estimates have been calculated using functions based on average speeds. In general, the average speed method is inadequate because different driving patterns can produce the same average speed, while exhibiting totally different driving dynamics, and consequently different emissions and fuel consumption rates (Sturm et al., 2000).
The four-model elemental model was used in this study. This model is based on drive cycles to estimate fuel consumption and pollutant emissions. The drive cycles come from the standard drive cycle or drive-cycle data representing a series of traffic events which are specified in term of cruise, idle and speed change (acceleration or deceleration). The algorithm is based on the power-based model developed by Post et. al. (1985) which relates instantaneous fuel consumption to the instantaneous power demand of the vehicle. The key advantage of the power-based model is that it relates fuel consumption to the fundamentals of vehicle motion which is relatively easy to calibrate using an instrumented vehicle. In the model implementation in aaSIDRA, emissions are calculated for Light (1,400 kg) and Heavy Vehicles (11,000 kg). Buses, trucks, semi-trailers (articulated vehicles), cars towing trailers or caravans, tractors and other slow-moving vehicles are classified as Heavy. All other vehicles are defined as Light Vehicles. These models have been calibrated and validated for Australian vehicles (Biggs and Akcelik, 1986) and used in aaSIDRA/aaMOTION to estimate fuel consumption, CO2, CO, HC, and NOx. The main inputs to these models include driver behaviour attributes (vehicle speed and acceleration), vehicle characteristics (weight or mass) and road geometry (grade). For a general emission or consumption parameter, X, the following relationships (equations 1 and 2) are used (Akcelik and Besley, 2003):
0,1000
)(
0
2
2
1 @ÙÚ
×ÈÉ
Ç--?
@
T
a
T RvMa
vRdt
XdE ddc (1)
0,)(
~? TRdt
XdE c (2)
where E(x) is the rate of fuel consumption or emission, RT is the total tractive force required to drive the vehicle (equation 3), M is the vehicle mass (kg), c is the idling fuel consumption/emission rate, d1 is an engine efficiency parameter (mL or g per kJ) relating fuel consumption/emission to energy provided by the engine, d2 is a second efficiency parameter (mL or grams per kJms-2) relating fuel consumption/emission during positive acceleration to the product of inertia and acceleration, v is the velocity (kph) and a is acceleration (mpss). RT can be computed according to equation (3) where g is the gravitational acceleration (ms-
2), G is the percent gradient, b1 is drag force parameter (rolling resistance) and b2 is drag force parameter (aerodynamic resistance). The default model parameters are shown in Table 2.
ÕÖÔ
ÄÅÃÕÖÔ
ÄÅÃ---?
10010001000
2
21
GMg
MavbbRT (3)
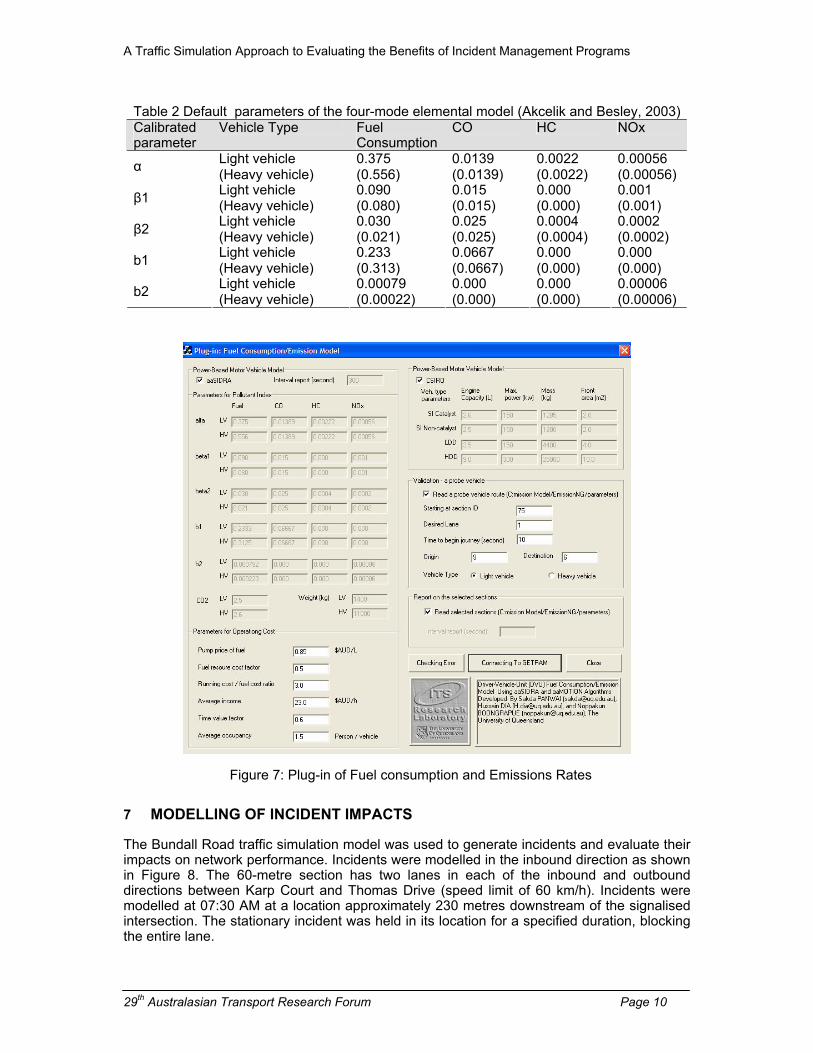
A user plug-in of fuel consumption and emissions was developed and interfaced to AIMSUN. The plug-in (in Figure 7) reads traffic information from the simulator (e.g. speed of each vehicle), and determines the instantaneous fuel and pollutant emissions rates per simulation step. The plug-in provides also provides vehicle operating costs.
A Traffic Simulation Approach to Evaluating the Benefits of Incident Management Programs
29
th Australasian Transport Research Forum Page 10
Table 2 Default parameters of the four-mode elemental model (Akcelik and Besley, 2003) Calibrated parameter
Vehicle Type Fuel Consumption
CO HC NOx
Light vehicle 0.375 0.0139 0.0022 0.00056 g (Heavy vehicle) (0.556) (0.0139) (0.0022) (0.00056) Light vehicle 0.090 0.015 0.000 0.001 く1 (Heavy vehicle) (0.080) (0.015) (0.000) (0.001) Light vehicle 0.030 0.025 0.0004 0.0002 く2 (Heavy vehicle) (0.021) (0.025) (0.0004) (0.0002) Light vehicle 0.233 0.0667 0.000 0.000
b1 (Heavy vehicle) (0.313) (0.0667) (0.000) (0.000) Light vehicle 0.00079 0.000 0.000 0.00006
b2 (Heavy vehicle) (0.00022) (0.000) (0.000) (0.00006)
Figure 7: Plug-in of Fuel consumption and Emissions Rates
7 MODELLING OF INCIDENT IMPACTS
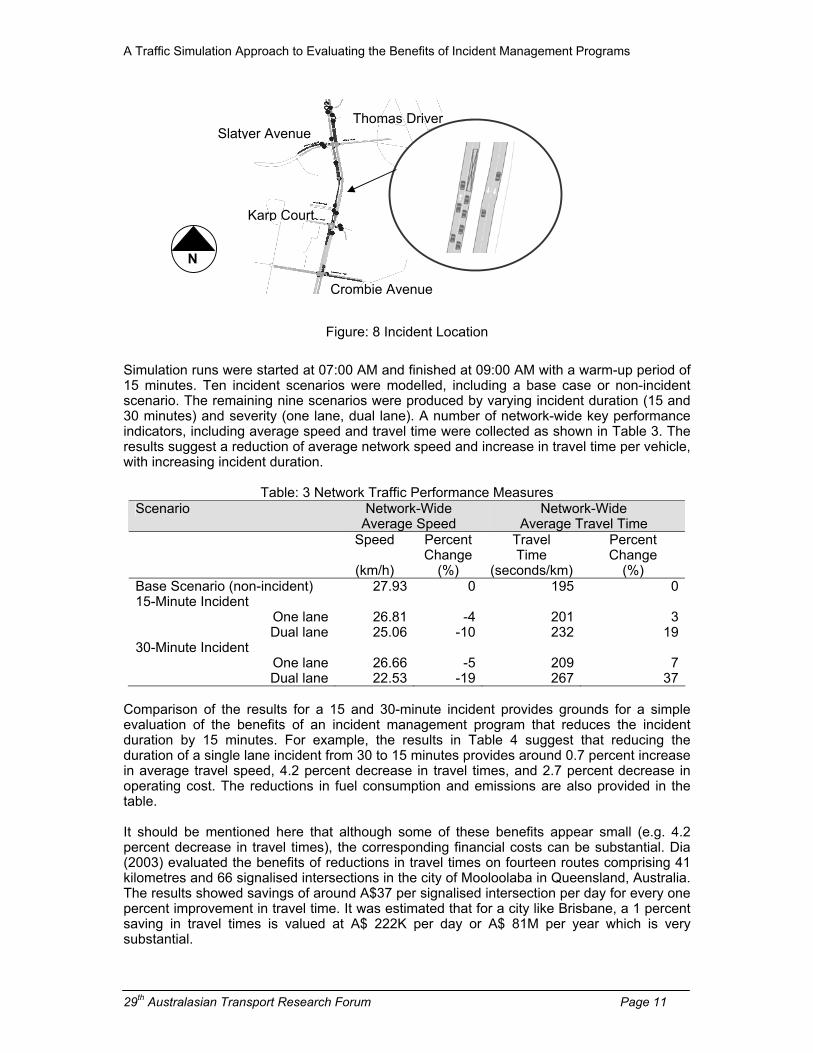
The Bundall Road traffic simulation model was used to generate incidents and evaluate their impacts on network performance. Incidents were modelled in the inbound direction as shown in Figure 8. The 60-metre section has two lanes in each of the inbound and outbound directions between Karp Court and Thomas Drive (speed limit of 60 km/h). Incidents were modelled at 07:30 AM at a location approximately 230 metres downstream of the signalised intersection. The stationary incident was held in its location for a specified duration, blocking the entire lane.
A Traffic Simulation Approach to Evaluating the Benefits of Incident Management Programs
29
th Australasian Transport Research Forum Page 11
Figure: 8 Incident Location
Simulation runs were started at 07:00 AM and finished at 09:00 AM with a warm-up period of 15 minutes. Ten incident scenarios were modelled, including a base case or non-incident scenario. The remaining nine scenarios were produced by varying incident duration (15 and 30 minutes) and severity (one lane, dual lane). A number of network-wide key performance indicators, including average speed and travel time were collected as shown in Table 3. The results suggest a reduction of average network speed and increase in travel time per vehicle, with increasing incident duration.
Table: 3 Network Traffic Performance Measures Scenario Network-Wide
Average Speed Network-Wide
Average Travel Time Speed
(km/h)
Percent Change
(%)
Travel Time
(seconds/km)
Percent Change
(%) Base Scenario (non-incident) 27.93 0 195 015-Minute Incident
One lane 26.81 -4 201 3Dual lane 25.06 -10 232 19
30-Minute Incident One lane 26.66 -5 209 7Dual lane 22.53 -19 267 37
Comparison of the results for a 15 and 30-minute incident provides grounds for a simple evaluation of the benefits of an incident management program that reduces the incident duration by 15 minutes. For example, the results in Table 4 suggest that reducing the duration of a single lane incident from 30 to 15 minutes provides around 0.7 percent increase in average travel speed, 4.2 percent decrease in travel times, and 2.7 percent decrease in operating cost. The reductions in fuel consumption and emissions are also provided in the table. It should be mentioned here that although some of these benefits appear small (e.g. 4.2 percent decrease in travel times), the corresponding financial costs can be substantial. Dia (2003) evaluated the benefits of reductions in travel times on fourteen routes comprising 41 kilometres and 66 signalised intersections in the city of Mooloolaba in Queensland, Australia. The results showed savings of around A$37 per signalised intersection per day for every one percent improvement in travel time. It was estimated that for a city like Brisbane, a 1 percent saving in travel times is valued at A$ 222K per day or A$ 81M per year which is very substantial.
Thomas DriverSlatyer Avenue
Karp Court
Crombie Avenue
N
A Traffic Simulation Approach to Evaluating the Benefits of Incident Management Programs
29
th Australasian Transport Research Forum Page 12
Table 4: Overall Benefits of Reducing Incident Duration (One Lane) from 30 to 15 Minutes Performance Measure
Base Scenario Non-incident
15-Minute Incident
30-Minute Incident
Benefits (%)
Speed (km/h) 27.93 26.81 26.62 0.7Travel Time (seconds/km) 195.25 201.13 210.00 -4.2Fuel Consumption (L/km) 87.61 89.40 93.87 -4.8CO (kg/km) 0.39 0.40 0.42 -4.9CO2 (kg/km) 219.97 224.50 235.70 -4.8HC (kg/km) 28.00 27.75 29.31 -5.3NOx (kg/km) 0.62 0.62 0.65 -5.1Operating Cost ($/km) 0.38 0.42 0.43 -2.7
Table 5 below lists selected network performance measures for incidents that blocked both lanes for 15 and 30 minutes. In this case, the benefits include 8.9 percent increase in speeds, 12.6 percent decrease in travel times, and 23.9 percent decrease in operating cost. The fuel consumption and emissions savings are also quite substantial.
Table 5: Benefits of Reducing Incident Duration (Dual Lanes) from 30 to 15 Minutes Performance Measure
Base Scenario Non-incident
15-Minute Incident
30-Minute Incident
Benefits (%)
Speed (km/h) 27.93 26.38 24.23 8.9Travel Time (seconds/km) 195.25 217.50 248.88 -12.6Fuel Consumption (L/km) 87.61 96.43 108.58 -11.2CO (kg/km) 0.39 0.43 0.49 -12.7CO2 (kg/km) 219.97 242.18 272.60 -11.2HC (kg/km) 28.00 29.62 30.92 -4.2NOx (kg/km) 0.62 0.66 0.69 -5.1Operating Cost ($/km) 0.38 0.48 0.63 -23.9
8 CONCLUSIONS This paper presented a simulation approach for modelling the impacts of Intelligent Transport Systems. In particular, the potential benefits of implementing incident management programs and their impacts on network performance were evaluated and presented for a major arterial road on the Gold Coast. The model’s calibration and validation results, based on real-world data, provided a good degree of confidence in the accuracy of the model and its suitability for use in this evaluation. Incident modelling results suggested that reductions in average travel speed of 5 percent can be expected due to a 30-minute single lane incident and 19 percent for a 30-minute dual lane incident. Travel times were similarly affected with increases between 7 and 37 percent for a 30-minute single and dual lane incidents, respectively. An incident management program that can reduce the duration of a dual lane incident from 30 to 15 minutes was found to have the potential to provide 8.9 percent improvement in average speeds, 12.6 percent saving in travel times and 23.9 percent decrease in vehicle operating costs. The environmental benefits were also substantial, showing 11.2 percent reduction in fuel consumption, 12.7 percent reduction in CO, 11.2 percent reduction in CO2, 4.2 percent reduction in HC, and 5.1 percent reduction in NOx production.
ACKNOWLEDGEMENTS The work reported in this paper is based on the Masters of Philosophy of the second author being completed at the University of Queensland.
A Traffic Simulation Approach to Evaluating the Benefits of Incident Management Programs
29
th Australasian Transport Research Forum Page 13
REFERENCES Akcelik, R. and Besley, M. (2003) Operating cost, fuel consumption, and emission models in
aaSIDRA and aaMOTION, 25th Conference of Australian Institutes of Transport Research (CAITR 2003), University of South Australia, Adelaide, Australia, 3-5 December 2003.
Akçelik, R. and Besley, M. (2001) Microsimulation and analytical methods for modelling urban traffic, Conference on Advanced Modeling Techniques and Quality of Service in Highway Capacity Analysis, Truckee, California, USA.
Barceló, J., Ferrer, J. L. and Martin, R. (1999) Simulation assisted design and assessment of vehicle guidance systems, International Transactions in Operations Research, 6, 123-143.
Biggs, D. C. and Akcelik, R. (1986) An energy-related model of instantaneous fuel consumption, Traffic Engineering & Control, 27, 320-325.
Bloomberg, L. and Dale, J. (2000) A comparison of the VISSIM and CORSIM traffic simulation models, the Institution of Transporation Engineers Annual Meeting, August, 2000.
Brackstone, M. and McDonald, M. (1999) Car-following: a historical review, Transportation Research Part F, 2, 181-196.
Chowdhury, D., Santen, L. and Schadschneider, A. (2000) Statistical physics of vehicular traffic and some related systems, Physics Reports, 329, 199-329.
Cottman, N., Dia, H. and Thomas, K. (2001) Assessment of incident-induced impacts on the performance of an arterial network, the 8th World Congress on Intelligent Transport Systems, Sydney, Australia.
Dale, J., Bauer, T., Bevan, T., McKinley, K. and Slind, T. (2000) Evaluating Arterial Street Transit Preferential Treatments, the 70th Annual Meeting of the Institute of Transportation Engineers, Nashville, TN.
Dia, H. (2002) An agent-based approach to modelling driver route choice behaviour under the influence of real-time information, Transportation Research Part C, 10C, 331-349.
Dia, H. (2003) Unpublished report to the Queensland Department of Main Roads, North Coast Hinterland.
Dia, H. and Panwai, S. (2006) Modelling Drivers' Compliance and Route Choice Behaviour in Response to Travel Information, Submitted to a Special Issue on Intelligent Transport Systems of the Journal Non-Linear Dynamics, November 2005.
Dia, H. and Rose, G. (1998) Development and evaluation of neural network freeway incident detection models using field data, Transportation Research Part C, 5, 313-31.
Gartner, N. H. and Hou, D. L. (1992) Comparative evaluation of alternative traffic control strategies, Transport Research Record, 1360.
Gazis, D. C. (1967) Science, 157, 273. Gipps, P. G. (1981) A behavioural car-following model for computer simulation,
Transportation Research B, 15, 105-111. Herman, R. and Gardels, K. (1963) Scientific American, 209, 35. Koka, M., Hourdakis, J. and Michalopoulus, P. G. (2000) Computer aided testing and
evaluation of adaptive ramp control strategies, the 79th Annual Meeting of the Transportation Research Board, Washington.
Korve-Engineers (1996) Contra Costa Transportation Authority. Lindley, J. A. (1987) Urban freeway congestion: quantification of the problem and
effectiveness of potential solutions, Institute of Transportation Engineers Journal, 57, 27-32.
Moen, B., Fitts, J., Carter, D. and Ouyang, Y. (2000) Parsons Transportation Group in Dallas Texas, USA.
Nigarnjanagool, S. and Dia, H. (2005) Evaluation of a Dynamic Signal Optimisation Control Model using Traffic Simulation, Journal of International Association of Traffic and Safety Sciences, 29, 22-30.
Panwai, S. and Dia, H. (2005) Comparative Evaluation of Microscopic Car Following Behaviour, IEEE Transactions on Intelligent Transport Systems, 6, 314-325.
A Traffic Simulation Approach to Evaluating the Benefits of Incident Management Programs
29
th Australasian Transport Research Forum Page 14
Panwai, S. and Dia, H. (2006) Neural Agent Car Following Behaviour, In press. Special Issue ITSC'05 - IEEE Transactions on Intelligent Transport Systems.
Post, K., Kent, J. H., Tomlin, J. and Carruthers, N. (1985) Fuel consumption and emission modelling by power demand and a comparison with other models, Transportation Research Part A, 18, 191-213.
PTV (2004) VISSIM User Manual Version 3.70. Quadstone (2005) Quadstone Paramics V5.0: Modeller Reference Manual, Quadstone, 16
Chester Street Edinburgh EH3 7RA Scotland. Rosswog, S., Wagner, P. and Eissfeldt, N. (2000) Microscopic Traffic Simulation Tools and
Their use for Emission Calculations, University of Cologne, Cologne. Rothery, R. W. (1998) In TRB special report 165: Traffic flow theory(Eds, Gartner, N.,
Messner, C. J. and Rathi, A. J.) Transportation Research Board. Skabardonis, A. (1997) Modeling framework for estimating emissions in large urban areas,
Transportation Research Record, 1587, 85-95. Sturm, P. J., Hausberger, S., Keller, M. and de Haan, P. (2000) Estimating real world
emissions from passenger cars - use and limitations of instantaneous emissions data, International Journal of Vehicle Design, 24, 19-33.
Thomas, K., Dia, H. and Cottman, N. J. (2001) Simulation of arterial incident detection using neural networks, the 8th World Congress on Intelligent Transport Systems.
TSS (2005) AIMSUN NG version 5.0 User's Manuals, Transport Simulation Systems (TSS). Velan, S. M. and Van Aerde, M. (1996) Gap acceptance and approach capacity at
unsignalized intersections, ITE Journal, 66, 40-45.