A Test Track Protocol for Assessing Forward Collision Warning
143
DOT HS 811 501 July 2011 A Test Track Protocol for Assessing Forward Collision Warning Driver-Vehicle Interface Effectiveness
Transcript of A Test Track Protocol for Assessing Forward Collision Warning

DOT HS 811 501 July 2011
A Test Track Protocol for Assessing Forward Collision Warning Driver-Vehicle Interface Effectiveness
DISCLAIMER
This publication is distributed by the US Department of Transportation National Highway Traffic Safety Administration in the interest of information exchange The opinions findings and conclusions expressed in this publication are those of the authors and not necessarily those of the Department of Transportation or the National Highway Traffic Safety Administration The United States Government assumes no liability for its contents or use thereof If trade names manufacturersrsquo names or specific products are mentioned it is because they are considered essential to the object of the publication and should not be construed as an endorsement The United States Government does not endorse products or manufacturers
i
TECHNICAL REPORT DOCUMENTATION PAGE
1 Report No DOT HS 811 501
2 Government Accession No 3 Recipients Catalog No
4 Title and Subtitle A Test Track Protocol for Assessing Forward Collision Warning Driver-Vehicle Interface Effectiveness
5 Report Date July 2011
6 Performing Organization Code
NHTSANVS-312
7 Author(s) Garrick Forkenbrock NHTSA Andrew Snyder Mark Heitz Richard L (Dick) Hoover Bryan OrsquoHarra Scott Vasko and Larry Smith Transportation Research Center Inc
8 Performing Organization Report No
9 Performing Organization Name and Address National Highway Traffic Safety Administration Vehicle Research and Test Center 10820 SR 347 PO Box B37 East Liberty OH 43319-0337
10 Work Unit No (TRAIS)
11 Contract or Grant No
12 Sponsoring Agency Name and Address National Highway Traffic Safety Administration 1200 New Jersey Avenue SE Washington DC 20590
13 Type of Report and Period Covered
Final Report 14 Sponsoring Agency Code
NHTSANVS-312 15 Supplementary Notes The authors acknowledge the support of Lisa Daniels Don Thompson Thomas Gerlach Jr Randy Landes John Martin Tim Van Buskirk Matt Hostetler Josh Orahood Patrick Biondillo and Ralph Fout for assistance with vehicle preparation instrumentation installation test conduct and data processing and Scott Baldwin and Tom Ranney for insights into experimental design
16 Abstract The primary objective of the work described in this report was to develop a protocol suitable for evaluating forward collision warning (FCW) driver-vehicle interface (DVI) effectiveness Specifically this protocol was developed to examine how distracted drivers respond to FCW alerts in a crash imminent scenario To validate the protocol a diverse sample of 64 drivers was recruited from central Ohio for participation in a small-scale test track based human factors study Each participant was asked to follow a moving lead vehicle (MLV) within the confines of a controlled test course and while attempting to maintain a constant headway instructed to perform a series of four distraction tasks intended to briefly divert their attention away from a forward-viewing position With the participant fully distracted during the final task the MLV was abruptly steered out of the travel lane revealing a stationary lead vehicle (SLV) in the participantrsquos immediate path (a realistic-looking full-size balloon car) At a nominal time-to-collision (TTC) of 21s from the stationary vehicle one of eight FCW alerts was presented to the distracted participant Each alert modality was intended to emulate one or more elements from those presently available in contemporary vehicles The timing of the critical events contained within the protocol appears to be repeatable appropriate and effective With respect to evaluation metrics the data produced during this study indicate that reaction time and crash outcome provide good measures of FCW alert effectiveness where reaction time is best defined as the onset of FCW to the instant the driverrsquos forward-facing view is reestablished Using these criteria the seat belt pretensioner-based FCW alerts used in this study elicited the most effective crash avoidance performance That said of the 32 trials performed with some form of seat belt pretensioner-based FCW alert 531 percent of them still resulted in a crash FCW modality had a significant effect on the participant reaction time from the onset of an FCW alert and on the speed reductions resulting from the participantsrsquo avoidance maneuvers (regardless of whether a collision ultimately occurred) Differences in participant response times from the instant their forward-facing view was reestablished to throttle release brake application and avoidance steer were not significant nor were brake application and avoidance steer magnitudes 17 Key Words
Crash Warning Interface Metrics (CWIM) Forward Collision Warning (FCW) Driver Vehicle Interface (DVI) Test Track Evaluation
18 Distribution Statement Document is available to the public from the National Technical Information Service wwwntisgov
19 Security Classif (of this report)
Unclassified 20 Security Classif (of this page)
Unclassified 21 No of Pages
143 22 Price
Form DOT F 17007 (8-72) Reproduction of completed page authorized
ii
CONVERSION FACTORS
iii
NOTE REGARDING COMPLIANCE WITH AMERICANS WITH DISABILITIES ACT SECTION 508 For the convenience of visually impaired readers of this report using text‐to‐speech software
additional descriptive text has been provided for graphical images contained in this report to
satisfy Section 508 of the Americans with Disabilities Act (ADA)
iv
TABLE OF CONTENTS CONVERSION FACTORS ii
NOTE REGARDING COMPLIANCE WITH AMERICANS WITH DISABILITIES ACT SECTION 508 iii
LIST OF FIGURES viii
LIST OF TABLES x
EXECUTIVE SUMMARY xiii
10 BACKGROUND 1
11 The Rear End Crash Problem 1
12 Forward Collision Warning (FCW) 1
13 The Crash Warning Interface Metrics (CWIM) Program 1
131 CWIM Phase I Research Performed at VRTCmdashStatic Tests 2
1311 Phase I Experimental Design 2
1312 Utility of the Phase I Results 6
132 CWIM Phase II Research Performed at VRTCmdashProtocol Refinement 6
1321 Phase II Experimental Design 6
1322 Phase II Distraction Task Interface 7
133 CWIM Phase III Research Performed at VRTCmdashFinal Protocol 8
20 OBJECTIVES 9
21 Protocol Overview 9
22 Evaluation Considerations 9
30 TEST APPARTATUS AND INSTRUMENTATION 10
31 Test Vehicles 10
311 Subject Vehicle (SV) 10
312 Moving Lead Vehicle (MLV) 10
313 Stationary Lead Vehicle (SLV) 11
32 Forward Collision Warning (FCW) Modalities 12
33 Task Displays 13
331 Headway Maintenance Monitor 13
332 Random Number Recall Display 13
34 Instrumentation 14
341 Subject Vehicle Instrumentation 14
342 Moving Lead Vehicle Instrumentation 15
343 Presentation of Auditory Commands and Alerts 15
344 Video Data Acquisition 15
40 TEST PROTOCOL 16
41 Overview 16
42 Participant Recruitment 17
43 Pre‐briefing and Informed Consent Meeting 17
44 Vehicle and Test Equipment Familiarization 17
441 Maintaining a Constant Headway 17
442 Random Number Recall 18
45 Study Compensation 18
v
TABLE OF CONTENTS (continued)
451 Base Pay 18
452 Incentive Pay 18
46 Pre‐test Forward Collision Warning Education and Familiarization 19
47 FCW Alert Modalities 20
48 Test Course 20
49 Experimental Test Drive 21
491 Pass 1 of 4 21
492 Pass 2 of 4 21
493 Pass 3 of 4 22
494 Pass 4 of 4 22
495 Participant Debriefing and Post‐Drive Survey Administration 23
50 Task Participation and Performance 24
51 Test Validity Requirements 24
52 Headway Maintenance 25
521 Overall Headway Maintenance Task Performance 25
522 Subject Vehicle Performance During Pass 4 26
523 Moving Lead Vehicle Performance During Pass 4 26
524 FCW Alert Modalities 28
525 Subject Vehicle Speed at FCW Onset 28
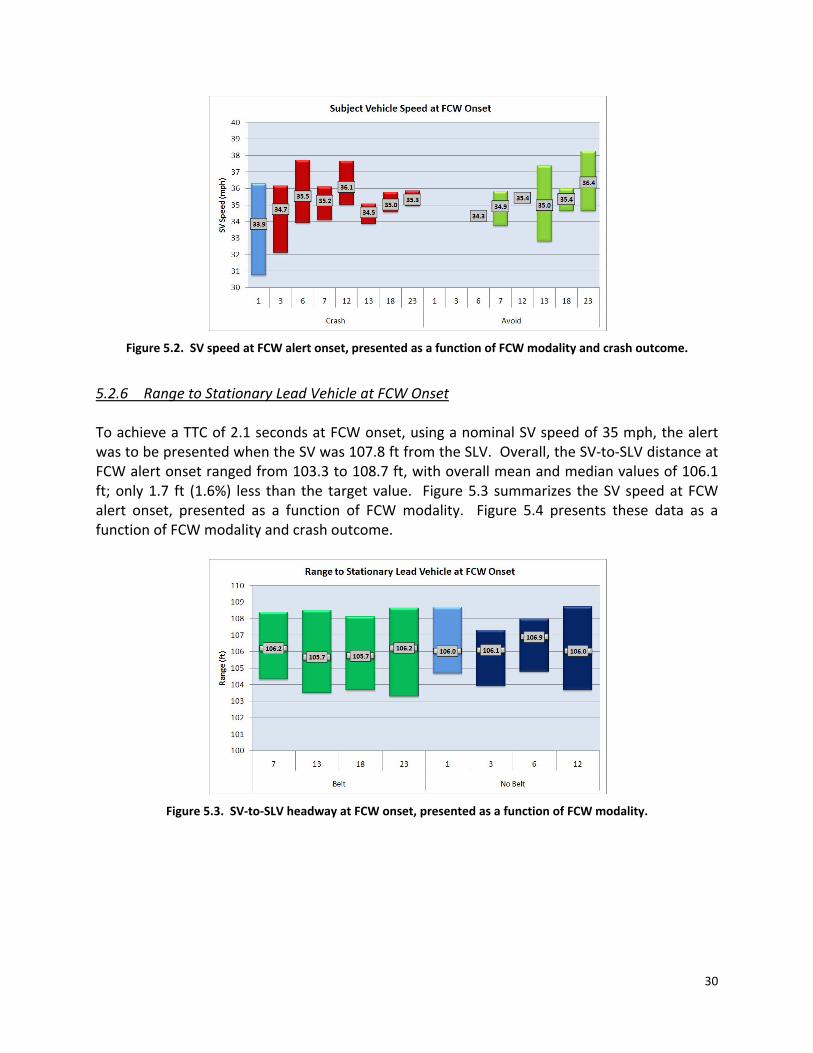
526 Range to Stationary Lead Vehicle at FCW Onset 30
527 Subject Vehicle‐to‐Stationary Lead Vehicle TTC at FCW Onset 31
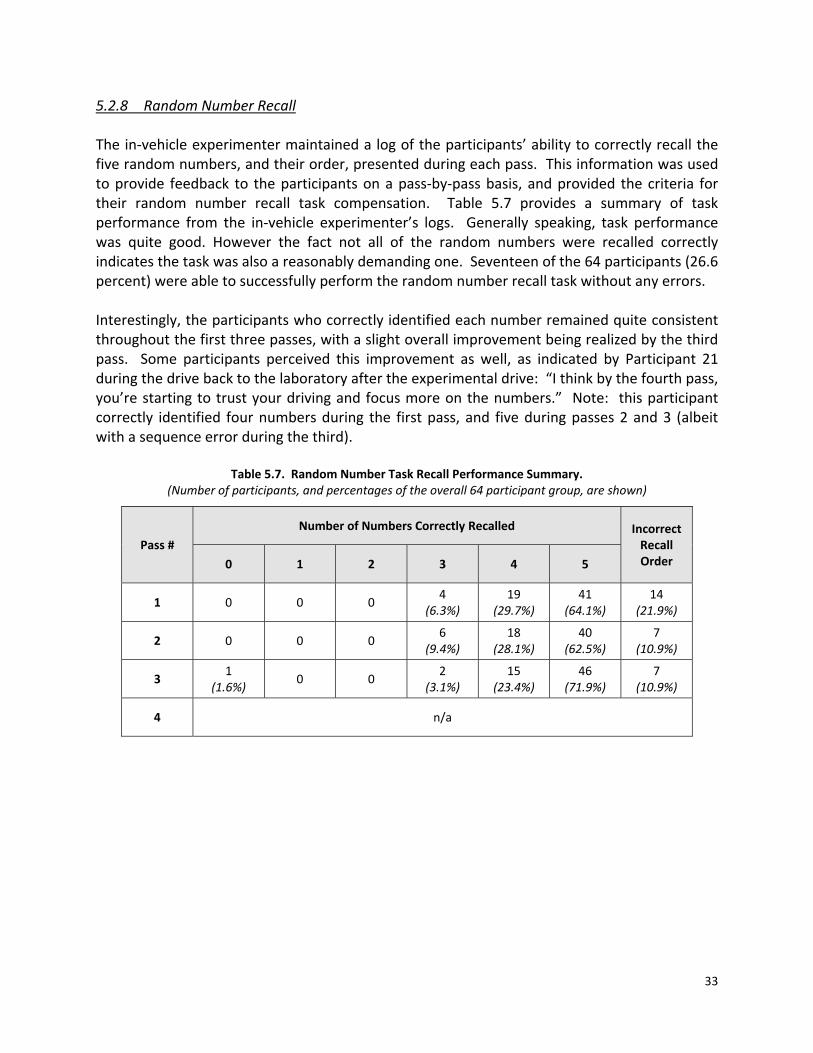
528 Random Number Recall 33
60 Crash Avoidance Response Times 34
61 Random Number Recall Task Instruction Response Time 34
62 Overall Visual Commitment Duration 36
63 Visual Commitment to Onset of FCW 37
64 Onset of FCW to End of Visual Commitment 38
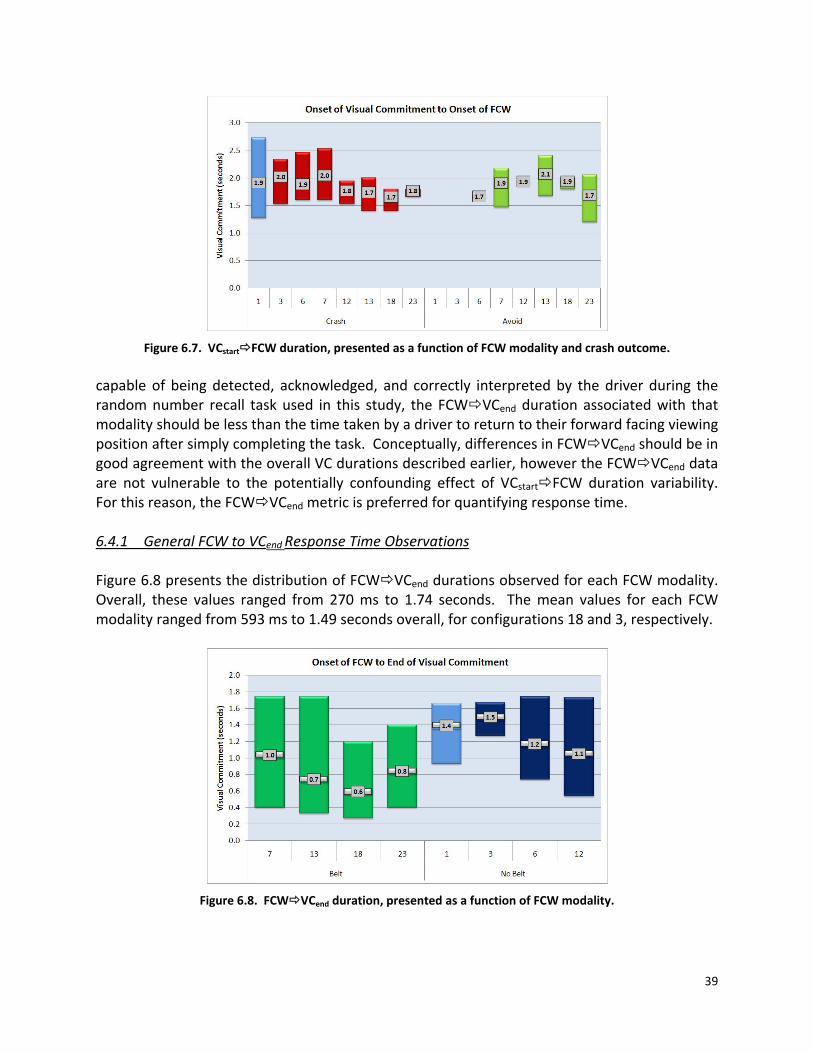
641 General FCW to VCend Response Time Observations 39
642 Statistical Assessment of FCW to VCend Response Times 40
65 Time‐to‐Collision (TTC) at End of Visual Commitment 44
651 General TTC at VCend Observations 44
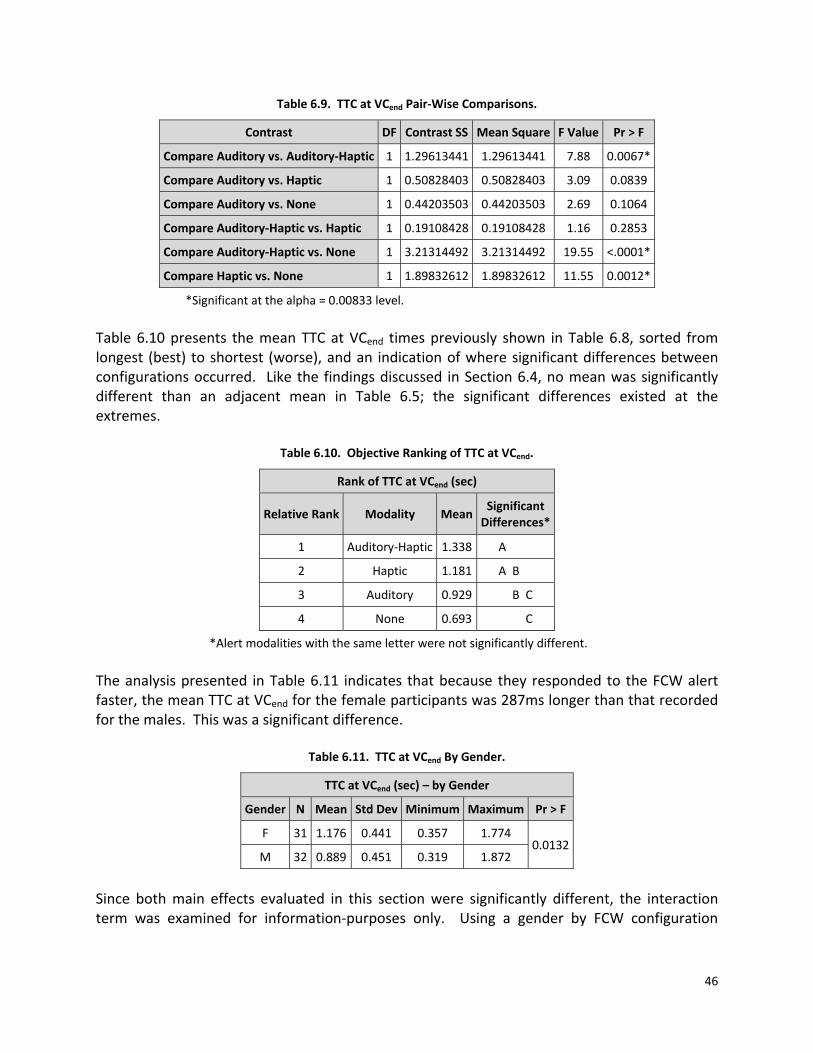
652 Statistical Assessment of TTC at VCend 45
66 Throttle Release Response Time 47
661 General Throttle Release Time Observations 48
6611 Onset of FCW to Throttle Release Time 48
6612 End of Visual Commitment to Throttle Release Time 49
662 Statistical Assessment of Throttle Release Times 50
6621 Throttle Release from FCW Onset 50
6622 Throttle Release from End of Visual Commitment 53
67 Brake Application Response Time 55
671 General Brake Application Response Time Observations 55
6711 Onset of FCW to Brake Application Response Time 55
6712 End of Visual Commitment to Brake Application Response Time 57
672 Statistical Assessment of Brake Application Response Times 58
vi
TABLE OF CONTENTS (continued)
6721 Brake Application Time from FCW Onset 58
6722 Brake Application Time from End of Visual Commitment 61
68 Avoidance Steer Response Time 62
681 General Avoidance Steer Response Time Observations 63
6811 Onset of FCW to Avoidance Steering Input 63
6812 End of Visual Commitment to An Avoidance Steering Input 64
682 Statistical Assessment of Avoidance Steer Response Times 66
6821 Onset of FCW to Avoidance Steer Response Time 66
6822 End of Visual Commitment to Avoidance Steer Response Time 68
70 Crash Avoidance Input Magnitudes 71
71 Peak Brake Pedal Force 71
711 General Assessment of Peak Brake Pedal Force 71
712 Statistical Assessment of Peak Brake Pedal Force 72
72 Peak Steering Wheel Angle 74
721 General Assessment of Peak Steering Wheel Angle 74
722 Statistical Assessment of Peak Steering Wheel Angle 76
80 Subject Vehicle Responses 78
81 Peak Longitudinal Deceleration 78
82 Peak Lateral Acceleration 78
90 Crash Avoidance and Mitigation Summary 81
91 Crash Avoidance 81
92 Likelihood of an FCW Alert Response 81
93 SV Speed Reduction 86
931 General SV Speed Reduction Observations 86
932 Statistical Assessment of FCW Modality on SV Speed Reductions 87
9321 Overall SV Speed Reductions Crash and Avoid 87
9322 SV Impact Speed Reductions (for Trials Resulting in a Crash) 91
100 CONCLUSIONS 95
101 Test Protocol 95
102 Evaluation Metrics 95
103 Crash Avoidance Maneuvers 96
104 Forward Collision Warning Modality Assessment 97
110 Future Considerations 98
111 Protocol Refinement (Time‐to‐Collision Based Triggering) 98
112 Protocol Validation 98
1121 Alternative Stationary Lead Vehicle Presentation Schedule 98
1122 Alternative Compensation Schedule 99
1123 Education and Training 100
113 Consideration of Additional FCW Modalities 100
1131 Alternative Seat Belt Pretensioner Magnitudes and Timing 100
1132 Low‐Magnitude Brake Pulse 101
114 Interactions with Other Advanced Technologies 101
1141 Crash‐Imminent Braking 101
1142 Dynamic Brake Support (DBS) 101
vii
TABLE OF CONTENTS (continued)
120 REFERENCES 103
130 APPENDICES 104
viii
LIST OF FIGURES
Figure 1 FCWVCend duration as a function of alert response likelihood and crash outcome xv
Figure 11 Visual alerts presented by the Volvo S80 Acura RL and Mercedes E350 (from left to right 3
Figure 12 Random number recall display (the red button was used only during Phase II trials) 7
Figure 31 2009 Acura RL the subject vehicle used in this study 10
Figure 32 2008 Buick Lucerne the moving lead vehicle used in this study 11
Figure 33 Inflatable balloon car used at the stationary lead vehicle in this study 11
Figure 34 Stationary lead vehicle restraint anchor 12
Figure 35 Volvo S80 FCW HUD hardware installed in the subject vehicle dashboard 12
Figure 36 Headway monitor installed in the SV 13
Figure 37 Load cell used to measure brake force Note adapter to increase throttle step height 14
Figure 41 Lead vehicle cut‐out scenario 16
Figure 42 Subject vehicle‐to‐stationary lead vehicle impact 16
Figure 43 TRC Skid Pad dimensional overview 20
Figure 44 Choreography used to assess participant responses to the various FCW modalities used in this study 22
Figure 51 SV speed at FCW alert onset presented as a function of FCW modality 29
Figure 52 SV speed at FCW alert onset presented as a function of FCW modality and crash outcome 30
Figure 53 SV‐to‐SLV headway at FCW onset presented as a function of FCW modality 30
Figure 54 SV‐to‐SLV headway at FCW onset presented as a function of FCW modality and crash outcome 31
Figure 55 SV‐to‐SLV TTC at FCW onset presented as a function of FCW modality 31
Figure 56 SV‐to‐SLV TTC at FCW onset presented as a function of FCW modality and crash outcome 32
Figure 61 Response time from recall task instruction to VCstart presented as a function of FCW modality 34
Figure 62 Visual commitment (VC) sequence 35
Figure 63 Response time from recall task instruction to VCstart presented as a function of FCW modality and crash outcome 36
Figure 64 Overall visual commitment duration presented as a function of FCW modality 37
Figure 65 Overall visual commitment duration presented as a function of FCW modality and crash outcome 37
Figure 66 VCstartFCW duration presented as a function of FCW modality 38
Figure 67 VCstartFCW duration presented as a function of FCW modality and crash outcome 39
Figure 68 FCWVCend duration presented as a function of FCW modality 39
Figure 69 FCWVCend duration presented as a function of FCW modality and crash outcome 40
Figure 610 TTC at VCend presented as a function of FCW modality 44
Figure 611 TTC at VCend presented as a function of FCW modality and crash outcome 45
Figure 612 Throttle release times presented as a function of FCW modality 48
Figure 613 Throttle release times presented as a function of FCW modality and crash outcome 49
Figure 614 Throttle release times presented from VCend as function of FCW modality and crash outcome 49
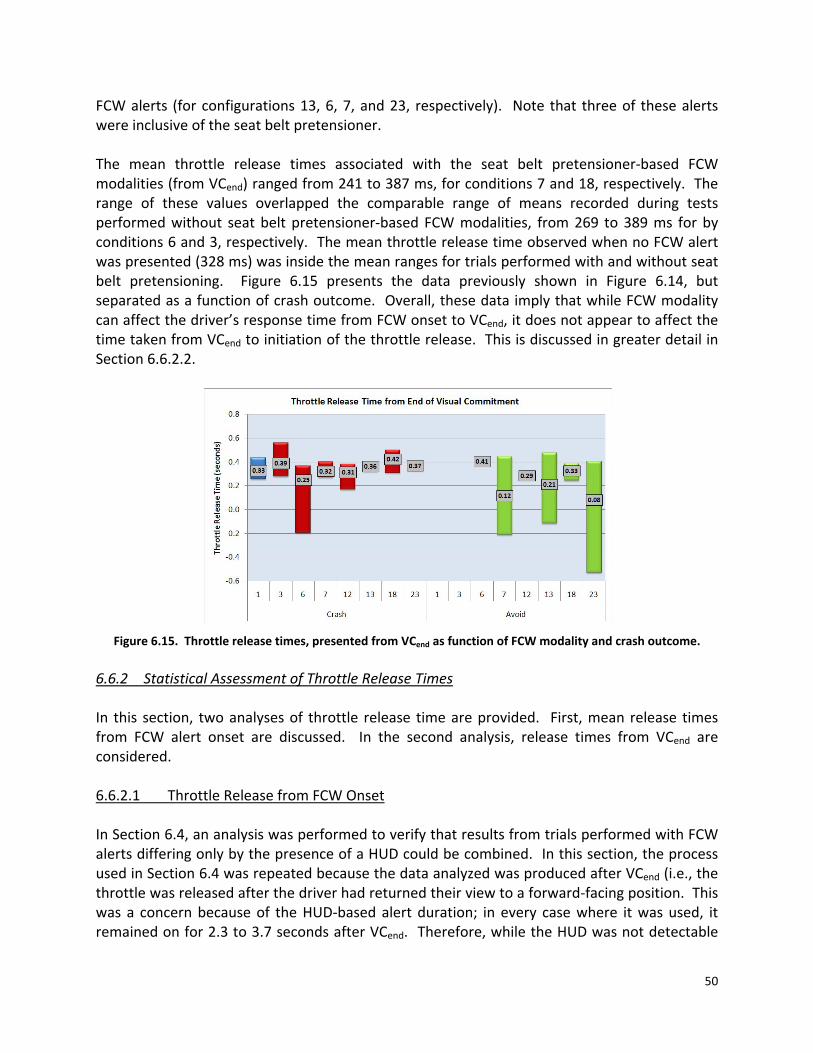
Figure 615 Throttle release times presented from VCend as function of FCW modality and crash outcome 50
Figure 616 Brake application times presented as a function of FCW modality 56
Figure 617 Brake application times presented as a function of FCW modality and crash outcome 56
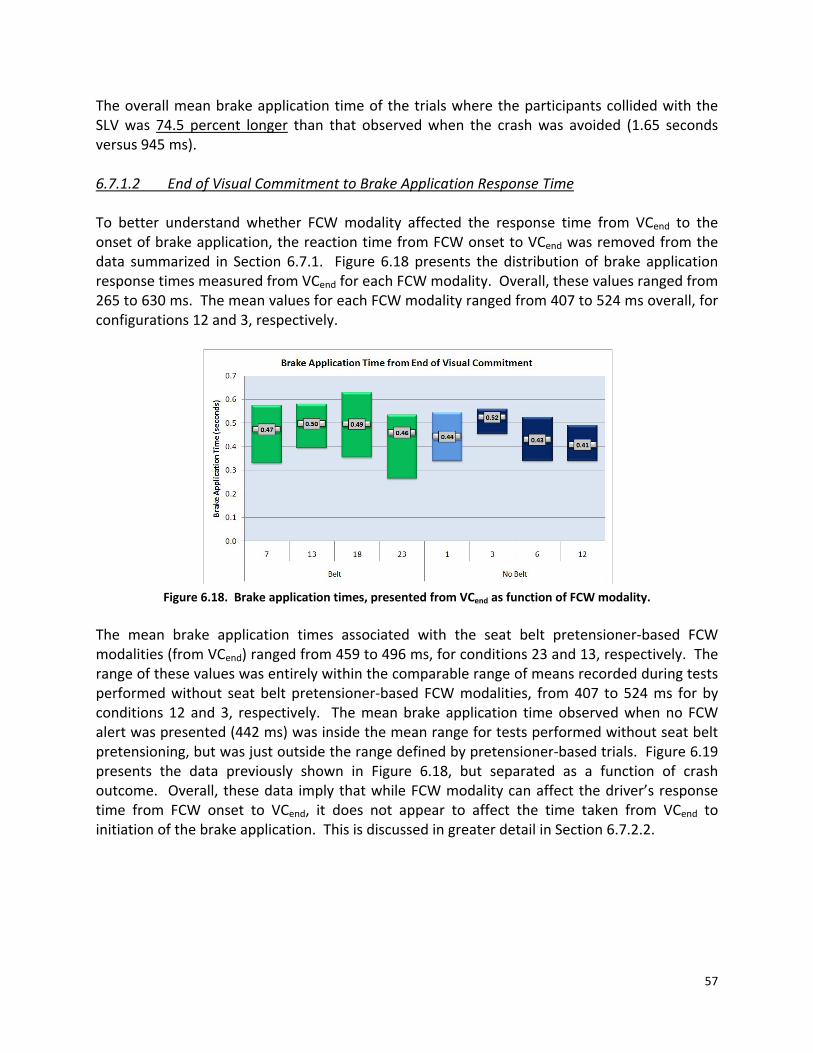
Figure 618 Brake application times presented from VCend as function of FCW modality 57
Figure 619 Brake application times presented from VCend as function of FCW modality and crash outcome 58
Figure 620 Avoidance steer response times presented as a function of FCW modality 63
Figure 621 Avoidance steer response times presented as a function of FCW modality and crash outcome 64
ix
LIST OF FIGURES (continued)
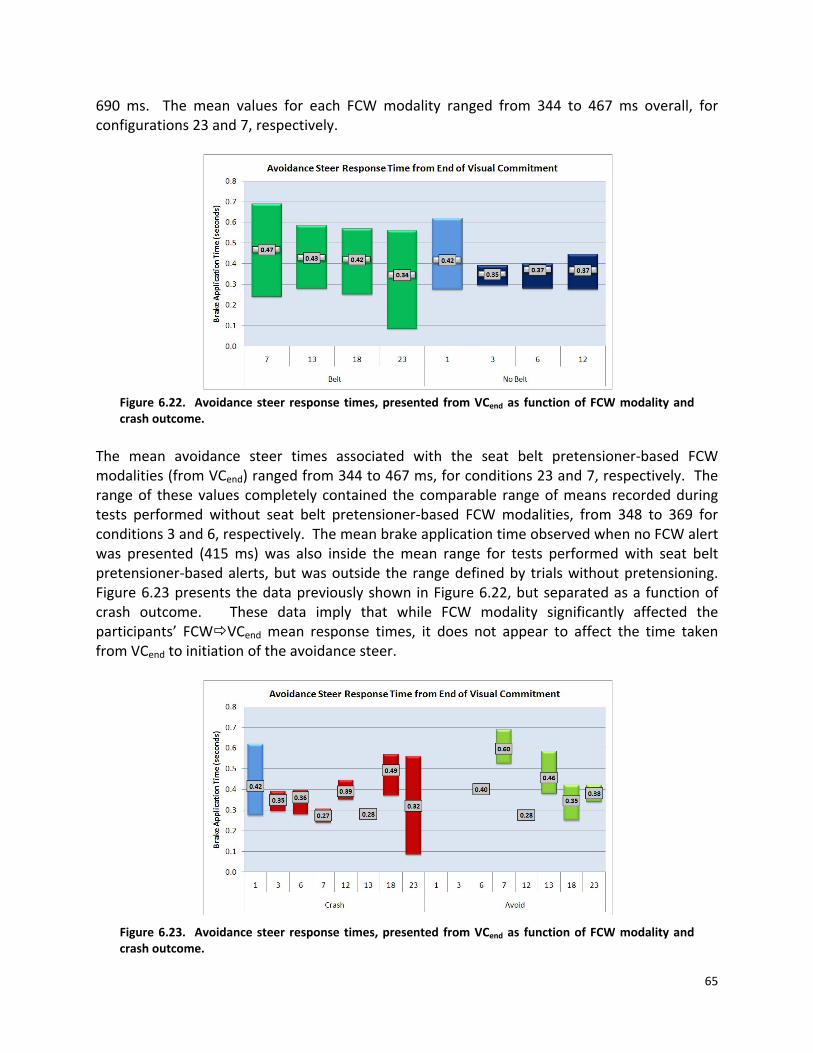
Figure 622 Avoidance steer response times presented from VCend as function of FCW modality and crash outcome 65
Figure 623 Avoidance steer response times presented from VCend as function of FCW modality and crash outcome 65
Figure 71 Peak brake pedal force presented as a function of FCW modality 72
Figure 72 Peak brake pedal force presented as a function of FCW modality and crash outcome 72
Figure 73 Peak steering angle presented as a function of FCW modality 75
Figure 74 Peak steering angle presented as a function of FCW modality and crash outcome 75
Figure 81 Peak deceleration magnitude presented as a function of FCW modality 78
Figure 82 Peak deceleration magnitude presented as a function of FCW modality and crash outcome 79
Figure 83 Peak lateral acceleration magnitude presented as a function of FCW modality 79
Figure 84 Peak lateral acceleration magnitude presented as a function of FCW modality and crash outcome 80
Figure 91 FCWVCend duration as a function of alert response likelihood and crash outcome 83
Figure 92 Speed reduction from onset of FCW alert presented as a function of FCW modality 86
Figure 93 Speed reduction from onset of FCW alert presented as a function of FCW modality and crash
outcome 87
x
LIST OF TABLES
Table 1 FCW Alert Modality Summary xiii
Table 2 FCW Alert Response Summary xv
Table 11 Crash Rankings By Frequency (2004 GES data) 1
Table 12 Example of Contemporary FCW Modalities 3
Table 13 FCW Alert Modalities Installed Into NHTSA Acura RL for the Phase I Pilot Tests 4
Table 14 Phase I Brake Reaction Time Summary (n =728) 5
Table 41 Task Payment Schedule 19
Table 42 FCW Alert Modality Summary 20
Table 51 Headway Maintenance Task Performance 25
Table 52 Repeatability of Key Participant and Test Equipment Inputs Observed During Pass 4 27
Table 53 Repeatability of Key Moving Lead Vehicle Inputs During Pass 4 28
Table 54 FCW Alert Modality Condition Numbers 29
Table 55 SV‐to‐SLV TTC At FCW Onset Comparison By Modality 32
Table 56 SV‐to‐SLV TTC At FCW Onset Comparison By Gender 32
Table 57 Random Number Task Recall Performance Summary 33
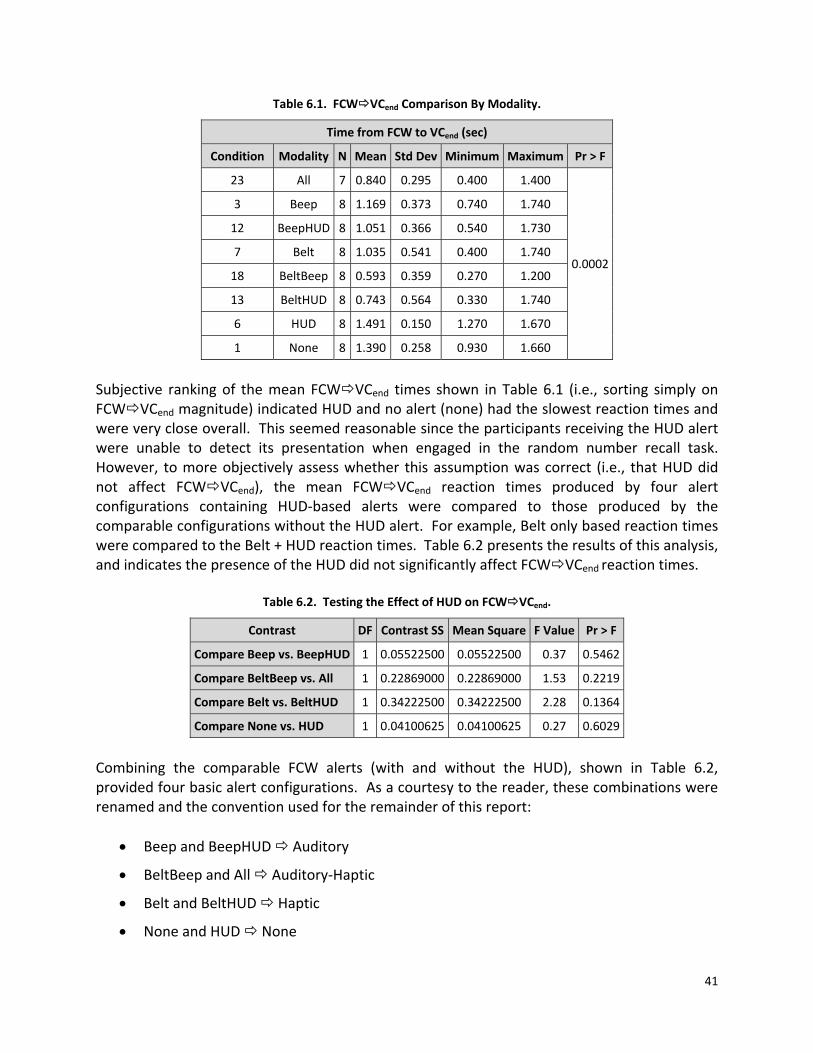
Table 61 FCWVCend Comparison By Modality 41
Table 62 Testing the Effect of HUD on FCWVCend 41
Table 63 FCWVCend Comparison By Modality Collapsed 42
Table 64 FCWVCend Pair‐Wise Comparisons 42
Table 65 Objective Ranking FCWVCend of Response Times 43
Table 66 FCWVCend Response Times By Gender 43
Table 67 FCWVCend Response Times and Gender Interaction 43
Table 68 TTC at VCend Comparison By Modality Collapsed 45
Table 69 TTC at VCend Pair‐Wise Comparisons 46
Table 610 Objective Ranking of TTC at VCend 46
Table 611 TTC at VCend By Gender 46
Table 612 TTC at VCend and Gender Interaction 47
Table 613 Crash Avoidance Response Summary (n=64) 47
Table 614 Throttle Release Response Time from FCW Onset 51
Table 615 Testing the Effect of HUD on Throttle Release Time from FCW Onset 51
Table 616 Throttle Release Time from FCW Onset Comparison By Modality Collapsed 52
Table 617 Throttle Release Time from FCW Onset Pair‐Wise Comparisons 52
Table 618 Objective Ranking of Throttle Release Time from FCW Onset 52
Table 619 Throttle Release Time from FCW Onset by Gender 53
Table 620 Throttle Release Time from FCW Onset and Gender Interaction 53
Table 621 Throttle Release Response Time from VCend 54
Table 622 Testing the Effect of HUD on Throttle Release Time from VCend 54
Table 623 Throttle Release Time from VCend Comparison By Modality Collapsed 54
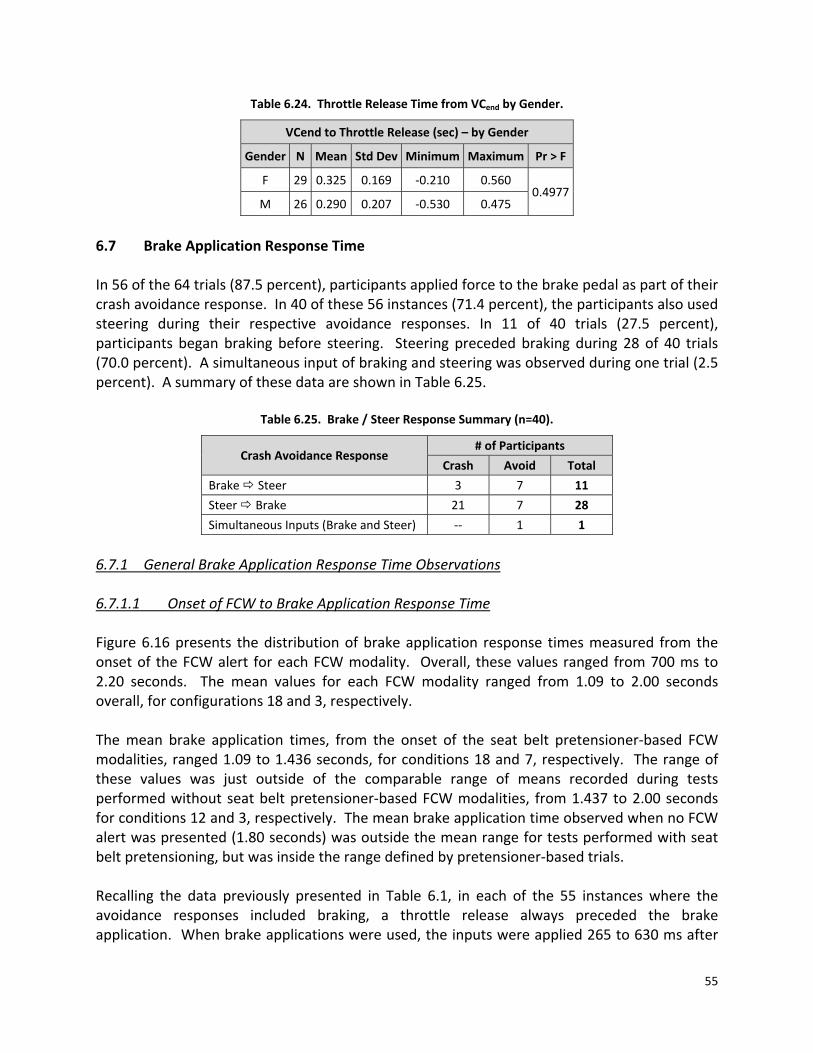
Table 624 Throttle Release Time from VCend by Gender 55
Table 625 Brake Steer Response Summary (n=40) 55
Table 626 Brake Application Time from FCW Onset 58
Table 627 Testing the Effect of HUD on Brake Application Time from FCW Onset 59
Table 628 Brake Application Time from FCW Onset Comparison By Modality Collapsed 59
Table 629 Brake Application Time from FCW Onset Pair‐Wise Comparisons 59
xi
LIST OF TABLES (continued)
Table 630 Objective Ranking of Brake Application Time from FCW Onset 60
Table 631 Brake Application Time from FCW Onset by Gender 60
Table 632 Brake Application Time from FCW Onset and Gender Interaction 60
Table 633 Brake Application Time from VCend 61
Table 634 Testing the Effect of HUD on Brake Application Time from VCend 61
Table 635 Brake Application Time from VCend Comparison By Modality Collapsed 62
Table 636 Brake Application Time from VCend by Gender 62
Table 637 Brake Application Time from VCend and Gender Interaction 62
Table 638 Direction of Steer Summary (n=42) 63
Table 639 Avoidance Steer Response Time from FCW Onset 66
Table 640 Testing the Effect of HUD on Avoidance Steer Response Time from FCW Onset 66
Table 641 Avoidance Steer Response Time from FCW Onset Comparison By Modality Collapsed 67
Table 642 Avoidance Steer Response Time from FCW Onset Pair‐Wise Comparisons 67
Table 643 Objective Ranking of Avoidance Steer Response Time from FCW Onset 68
Table 644 Avoidance Steer Response Time from FCW Onset by Gender 68
Table 645 Avoidance Steer Response Time from FCW Onset and Gender Interaction 68
Table 646 Avoidance Steer Response Time from VCend 69
Table 647 Testing the Effect of HUD on Avoidance Steer Response Time from VCend 69
Table 648 Avoidance Steer Response Time from VCend Comparison By Modality Collapsed 69
Table 649 Avoidance Steer Response Time from VCend by Gender 70
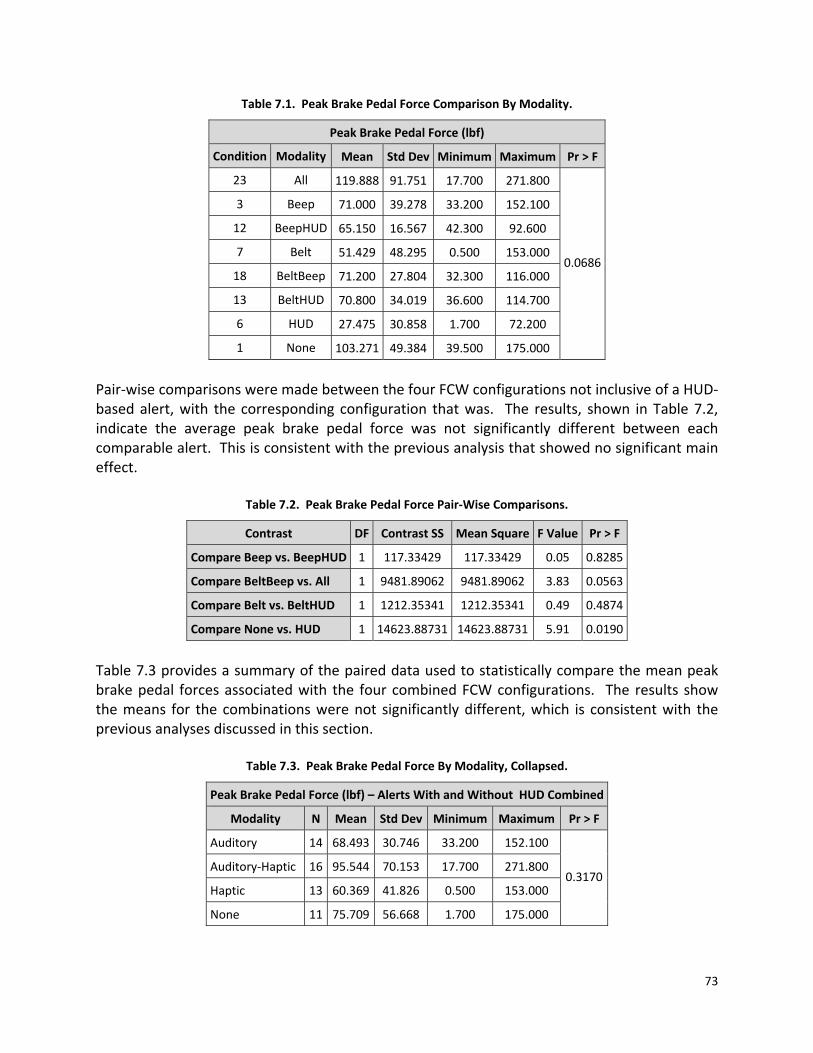
Table 71 Peak Brake Pedal Force Comparison By Modality 73
Table 72 Peak Brake Pedal Force Pair‐Wise Comparisons 73
Table 73 Peak Brake Pedal Force By Modality Collapsed 73
Table 74 Peak Brake Pedal Force By Gender 74
Table 75 Peak Steering Wheel Angle Comparison By Modality 76
Table 76 Peak Steering Wheel Angle Pair‐Wise Comparisons 76
Table 77 Peak Steering Wheel Angle By Modality Collapsed 77
Table 78 Peak Steering Wheel Angle By Gender 77
Table 91 Overall Crash Avoidance Summary 81
Table 92 Successful SLV Avoidance Summary 82
Table 93 Successful SLV Avoidance Summary Collapsed 82
Table 94 FCW Alert Response Summary 83
Table 95 FCW Alert Response Summary Collapsed 84
Table 96 FCW Response Likely But Crash Not Avoided Summary 85
Table 97 SV Speed Reduction Comparison By Modality 88
Table 98 Testing the Effect of HUD on SV Speed Reduction 88
Table 99 SV Speed Reduction Comparison By Modality Collapsed 88
Table 910 SV Speed Reduction Pair‐Wise Comparisons 89
Table 911 Objective Ranking of SV Speed Reductions 89
Table 912 SV Speed Reduction by Gender 89
Table 913 SV Speed Reduction and Gender Interaction 90
Table 914 SV Speed Reduction With and Without Seat Belt Pretensioning 90
Table 915 SV Speed Reduction With and Without Seat Belt Pretensioning and Gender Interaction 90
Table 916 SV Impact Speed Reduction Comparison By Modality 91
xii
LIST OF TABLES (continued)
Table 917 Testing the Effect of HUD on SV Impact Speed Reduction 91
Table 918 SV Impact Speed Reduction Comparison By Modality Collapsed 92
Table 919 SV Impact Speed Reduction Pair‐Wise Comparisons 92
Table 920 Objective Ranking of SV Impact Speed Reductions 92
Table 921 SV Impact Speed Reduction by Gender 93
Table 922 SV Impact Speed Reduction and Gender Interaction 93
Table 923 SV Impact Speed Reduction With and Without Seat Belt Pretensioning 94
Table 924 SV Impact Speed Reduction With and Without Seat Belt Pretensioning and Gender Interaction 94
Table A1 Phase I Static Pilot Post‐Test Questionnaire Responses 106
Table C1 RT3002 Channels and Accuracy Specifications 108
xiii
EXECUTIVE SUMMARY The current phase of the National Highway Traffic Safety Administrationrsquos (NHTSA) Crash Warning Interface Metrics (CWIM) program is intended to identify which alert modalities most effectively assist distracted drivers in forward collision and lane departure crash scenarios Once identified the program seeks to develop test protocols and evaluation metrics to help assess the safety benefits associated with these alerts Ultimately it is envisioned that NHTSA will use the outputs of the CWIM program to encourage vehicle manufacturers to implement FCW and Lane Departure Warning (LDW) alerts with a standardized interface design and operational characteristics The primary objective of the work described in this report was to develop a protocol suitable for evaluating forward collision warning (FCW) driver‐vehicle interface (DVI) effectiveness Specifically this protocol was developed to examine how distracted drivers respond to FCW alerts in a crash imminent scenario To validate the protocol a diverse sample of 64 drivers was recruited from central Ohio for participation in a small‐scale test track based human factors study Each participant was asked to follow a moving lead vehicle (MLV) within the confines of a controlled test course and while attempting to maintain a constant headway perform a series of four distraction tasks intended to briefly divert their attention away from a forward‐viewing position With the participant fully distracted during the final task the MLV was abruptly steered out of the travel lane revealing a stationary lead vehicle (SLV) in the participantrsquos immediate path (a realistic‐looking full‐size balloon car) At a nominal time‐to‐collision (TTC) of 21s from the SLV one of eight FCW alerts was presented to the distracted participant Each alert modality was intended to incorporate one or more elements from those presently available in contemporary vehicles Table 1 lists the alert modalities used in this study and the vehiclersquos they originated in
Table 1 FCW Alert Modality Summary
FCW Modality Alert Origin
None Baseline (no alert)
Visual Only 2008 Volvo S80 (HUD)
Auditory Only 2010 Mercedes E350 (repeated beeps)
Haptic Seat Belt 2009 Acura RL (reversible seat belt pretensioner)
Visual + Auditory 2008 Volvo S80 + 2010 Mercedes E350
Visual + Haptic Seat Belt 2008 Volvo S80 + 2009 Acura RL
Auditory + Haptic Seat Belt 2010 Mercedes E350 + 2009 Acura RL
Visual + Auditory +Haptic Seat Belt 2008 Volvo S80 + 2010 Mercedes E350 + 2009 Acura RL
The timing of the critical events contained within the protocol appears to be repeatable appropriate and effective Presentation of task instructions and FCW alerts was accurately
xiv
controlled and repeatable With very few exceptions participants maintained an acceptable headway began the random number recall task when instructed to do so and were fully distracted when presented with an FCW alert With respect to evaluation metrics the data produced during this study indicate that driver reaction time and crash outcome provide good measures of FCW alert effectiveness Many variants of reaction time were explored in this study however the interval defined by the onset of the FCW alert to the end of visual commitment (ie VCend the instant the driver returns their attention to a forward‐facing viewing position) appears to be the most appropriate While reaction time from FCW to throttle release brake application andor steering input also provide good indications of FCW alert effectiveness it is important to consider that drivers can use different techniques to arrive at a successful crash avoidance outcome (eg some drivers may use steering but no braking) Interestingly while FCW modality had a significant effect on the participant reaction time differences from the instant their forward‐facing view was reestablished to throttle release brake application and avoidance steer were not significant nor were brake application and avoidance steer magnitudes Overall 17 of the 64 participants avoided collisions with the SLV (266 percent) Fifteen of the successfully‐avoided crashes (882 percent) occurred during trials performed with the haptic alert or an alert combination inclusive of the haptic modality One crash (16 percent) was avoided during a trial performed with the auditory only alert one with a modality based on a combination of the auditory and visual alert These results clearly indicate the seat belt pretensioner‐based haptic alert used in this study offered better crash avoidance effectiveness than the other individual modalities on the test track However the authors emphasize that of the 32 trials performed with some form of this haptic alert 531 percent of them still resulted in a crash When considering the crash vs avoid data presented in this report it is important to recognize that being involved in a crash does not necessarily indicate the participant did not respond to the FCW modality used in their individual trial Although most participants crashed into the SLV because they failed to respond to the various FCW alerts used in this study (or were not presented with one) some crashed because their avoidance strategy was simply not effective To quantify this phenomenon the crash avoidance response of each participant was categorized in one of three ways
1 FCW alert response likely crash avoided
2 FCW alert response likely crash not avoided
3 FCW alert response not likely crash not avoided A summary of crash outcome presented as a function of FCW modality and crash avoidance response is shown in Table 2 Results of this categorization were used in conjunction with FCWVCend duration as a means of quantifying response time as shown in Figure 1 Here the
xv
range of response times where FCW alert responses were likely and the crash avoided was 270 to 870 ms For the cases where FCW alert responses were likely but the crash still occurred response times were between 330 ms to 10 second Finally for the instances where FCW alert responses were not likely response times were between 870 ms to 174 seconds If the participant did not respond to the FCW alert a crash always occurred
Table 2 FCW Alert Response Summary
FCW Alert Modality
of Participants
Response Likely
Crash Avoided
Response Likely
Crash Not Avoided
Response Not Likely
Crash Not Avoided
None (no alert) ‐‐ ‐‐ 8
Visual Only (Volvo HUD) ‐‐ ‐‐ 8
Auditory Only (Mercedes Beep) 1 3 4
Haptic Seat Belt Only (Acura Belt) 3 ‐‐ 5
Auditory + Visual 1 2 5
Visual + Haptic Seat Belt 5 1 2
Auditory + Haptic Seat Belt 3 2 3
Visual + Auditory + Haptic Seat Belt 31 3 1
Total (percent of 63 participants1)
161
(254)
11
(175)
36
(571)
1VCend video data not available for one of the 64 participants
Figure 1 FCWVCend duration as a function of alert response likelihood and crash outcome
1
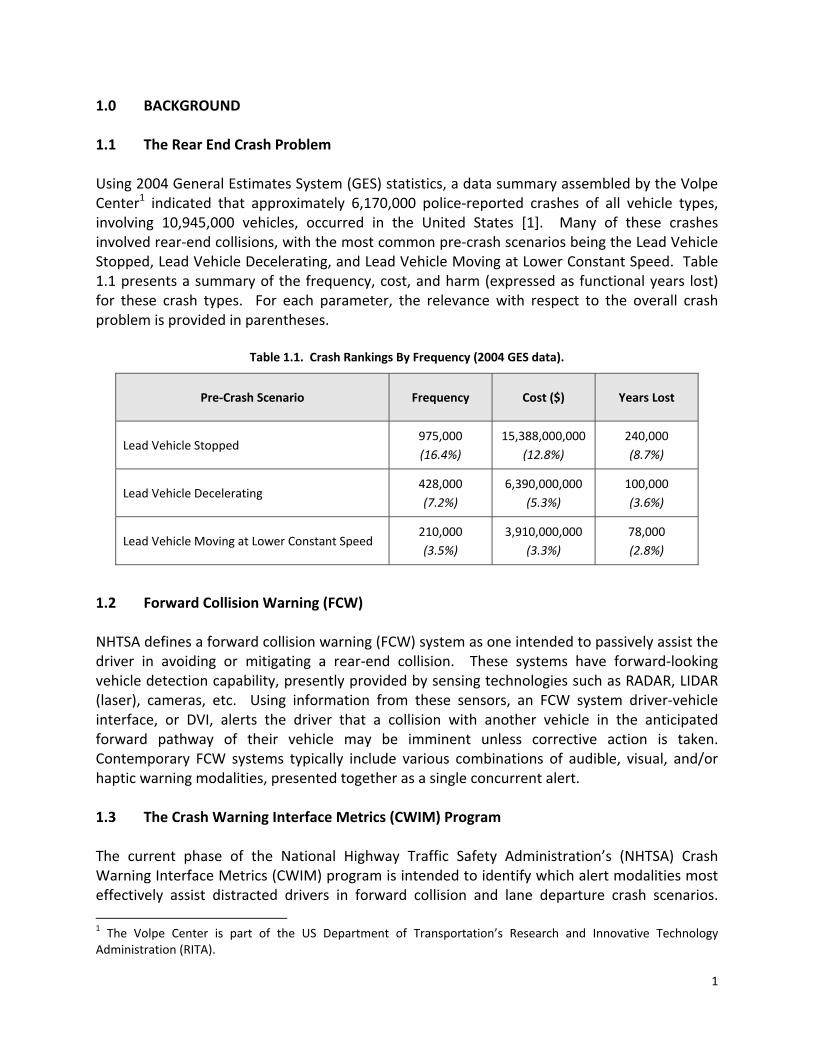
10 BACKGROUND 11 The Rear End Crash Problem Using 2004 General Estimates System (GES) statistics a data summary assembled by the Volpe Center1 indicated that approximately 6170000 police‐reported crashes of all vehicle types involving 10945000 vehicles occurred in the United States [1] Many of these crashes involved rear‐end collisions with the most common pre‐crash scenarios being the Lead Vehicle Stopped Lead Vehicle Decelerating and Lead Vehicle Moving at Lower Constant Speed Table 11 presents a summary of the frequency cost and harm (expressed as functional years lost) for these crash types For each parameter the relevance with respect to the overall crash problem is provided in parentheses
Table 11 Crash Rankings By Frequency (2004 GES data)
Pre‐Crash Scenario Frequency Cost ($) Years Lost
Lead Vehicle Stopped 975000
(164)
15388000000
(128)
240000
(87)
Lead Vehicle Decelerating 428000
(72)
6390000000
(53)
100000
(36)
Lead Vehicle Moving at Lower Constant Speed 210000
(35)
3910000000
(33)
78000
(28)
12 Forward Collision Warning (FCW) NHTSA defines a forward collision warning (FCW) system as one intended to passively assist the driver in avoiding or mitigating a rear‐end collision These systems have forward‐looking vehicle detection capability presently provided by sensing technologies such as RADAR LIDAR (laser) cameras etc Using information from these sensors an FCW system driver‐vehicle interface or DVI alerts the driver that a collision with another vehicle in the anticipated forward pathway of their vehicle may be imminent unless corrective action is taken Contemporary FCW systems typically include various combinations of audible visual andor haptic warning modalities presented together as a single concurrent alert 13 The Crash Warning Interface Metrics (CWIM) Program The current phase of the National Highway Traffic Safety Administrationrsquos (NHTSA) Crash Warning Interface Metrics (CWIM) program is intended to identify which alert modalities most effectively assist distracted drivers in forward collision and lane departure crash scenarios
1 The Volpe Center is part of the US Department of Transportationrsquos Research and Innovative Technology Administration (RITA)
2
Once identified the program seeks to develop test protocols and evaluation metrics to help assess the safety benefits associated with these alerts Ultimately it is envisioned that NHTSA will use the outputs of the CWIM program to encourage vehicle manufacturers to implement FCW and Lane Departure Warning (LDW) alerts with a standardized interface design and operational characteristics In support of the CWIM program the University of Iowa is presently using the National Advanced Driving Simulator (NADS) to develop test protocols relevant to the forward collision and lane departure safety concerns The work described in this report was the output of a concurrent program performed at NHTSArsquos Vehicle Research and Test Center (VRTC) designed to provide objective test track‐based data relevant to the forward collision problem This work was completed in three phases Phase I A small sample population was exposed to a large number of FCW alert modalities in a simple detection exercise using a repeated measure experimental design Results from these tests were used to reduce the number of FCW alert combinations used in Phase II Phase II A small sample of drivers recruited from the general public participated in an experimental drive on the test track Observations made during the conduct of this phase were used to refine the test protocol ultimately used in Phase III Phase III Sixty‐four drivers recruited from the general public participated in an experimental drive on the test track Seven FCW alert modality combinations and a baseline condition were used in this phase Data output from trials performed with each FCW alert were compared between test participants 131 CWIM Phase I Research Performed at VRTCmdashStatic Tests The CWIM work performed at VRTC began by identifying what FCW alert modalities existed on contemporary production vehicles A description of the systems representative of those available on US‐specification vehicles is presented in Table 12 Of significance is the diversity of the alerts At the time the tests described in this report were performed the number of contemporary light vehicles available in the United States with FCW was quite low
Since it was not feasible to perform a large‐scale evaluation inclusive of each FCW modality shown in Table 12 Phase I research consisted of a small static study designed to reduce the number of auditory and visual alerts to one apiece 1311 Phase I Experimental Design Preparation for the Phase I static study began with FCW alerts representative of each modality shown in Table 12 being installed into a common subject vehicle (SV) a 2009 Acura RL2 While
2 This retrofit only involved installation of multiple alerts not of the other hardware etc used to activate them
3
the authors are sensitive to the likelihood vehicle manufacturers design their respective FCW alerts to be integrated systems appropriate for the vehicle in which they were installed (eg the auditory alert was selected to complement the visual alert etc) installing multiple alert modalities into one vehicle removed the confounding effect of vehicle type from subsequent analyses
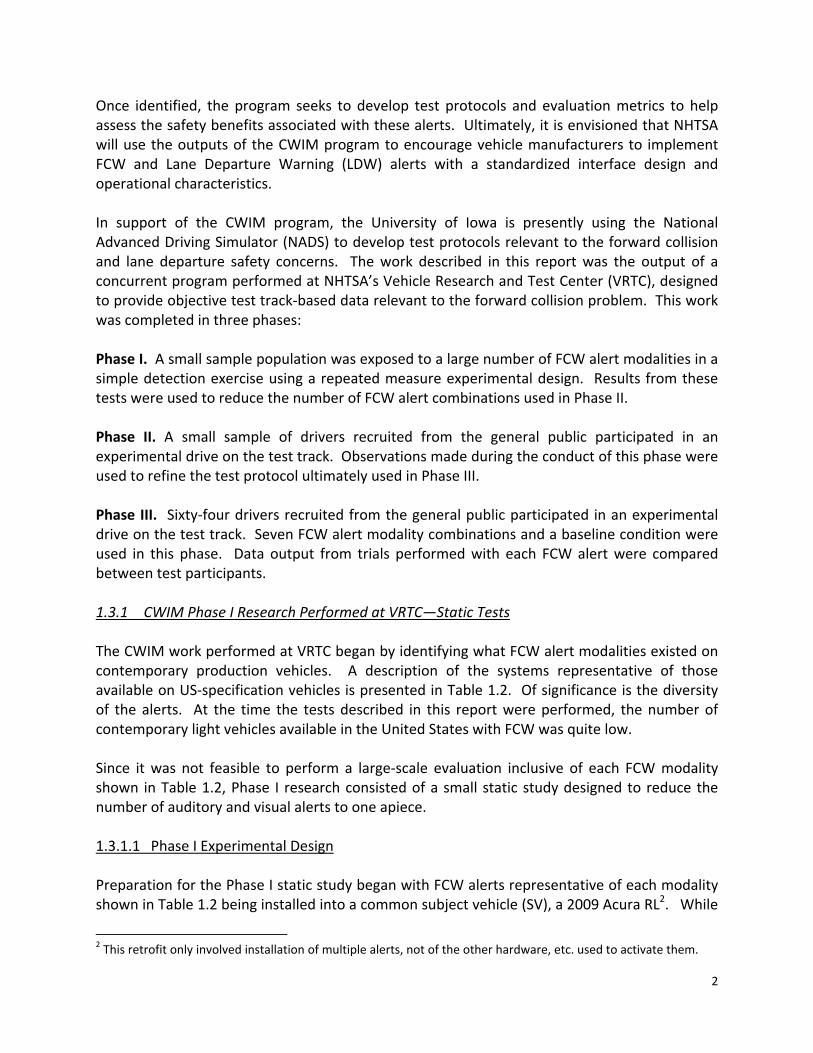
Table 12 Example of Contemporary FCW Modalities
Alert
Vehicle
2009 Acura RL
2010 Toyota Prius
2010 Mercedes E350
2008 Volvo S80
2010 Ford Taurus
2011 Audi A8
Haptic Seat Belt
Pretensioner ‐‐
Seat Belt Pretensioner
‐‐ ‐‐ Brake Pulse
(025g)
Visual ldquoBrakerdquo on the
MDC1
ldquoBrakerdquo on the MDC1
Small IC2 Icon LED HUD LED HUD ldquoBrake Guard Activatedrdquo on the MDC1
Auditory Beep Beep Beep Tone Tone Single Gong
1MDC = Message Display Center 2IC = Instrument Cluster
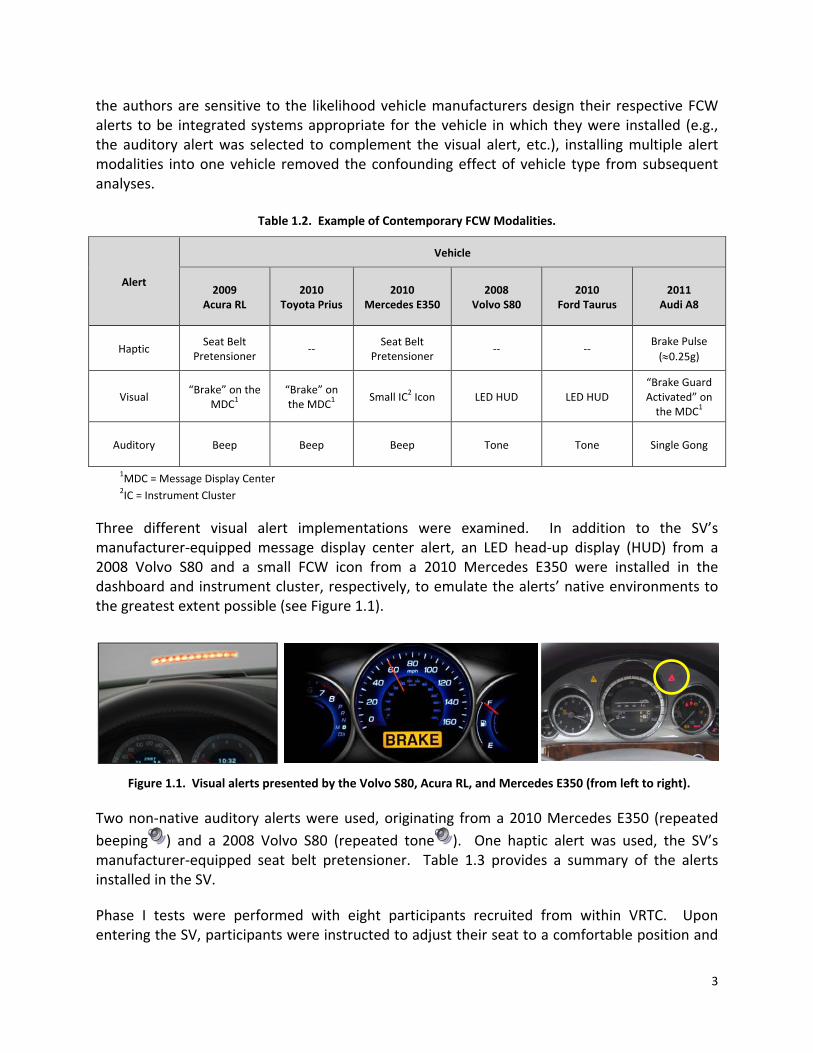
Three different visual alert implementations were examined In addition to the SVrsquos manufacturer‐equipped message display center alert an LED head‐up display (HUD) from a 2008 Volvo S80 and a small FCW icon from a 2010 Mercedes E350 were installed in the dashboard and instrument cluster respectively to emulate the alertsrsquo native environments to the greatest extent possible (see Figure 11)
Two non‐native auditory alerts were used originating from a 2010 Mercedes E350 (repeated
beeping ) and a 2008 Volvo S80 (repeated tone ) One haptic alert was used the SVrsquos manufacturer‐equipped seat belt pretensioner Table 13 provides a summary of the alerts installed in the SV
Phase I tests were performed with eight participants recruited from within VRTC Upon entering the SV participants were instructed to adjust their seat to a comfortable position and
Figure 11 Visual alerts presented by the Volvo S80 Acura RL and Mercedes E350 (from left to right)
4
drive to a test course isolated from other facility traffic Once at the course participants were instructed to stop the vehicle put the transmission in park and face forward with their hands at the 3 and 9 orsquoclock positions on the steering wheel Verbal instructions were provided to each participant by an in‐vehicle experimenter who occupied the left‐rear seat All Phase I tests were performed during daylight hours
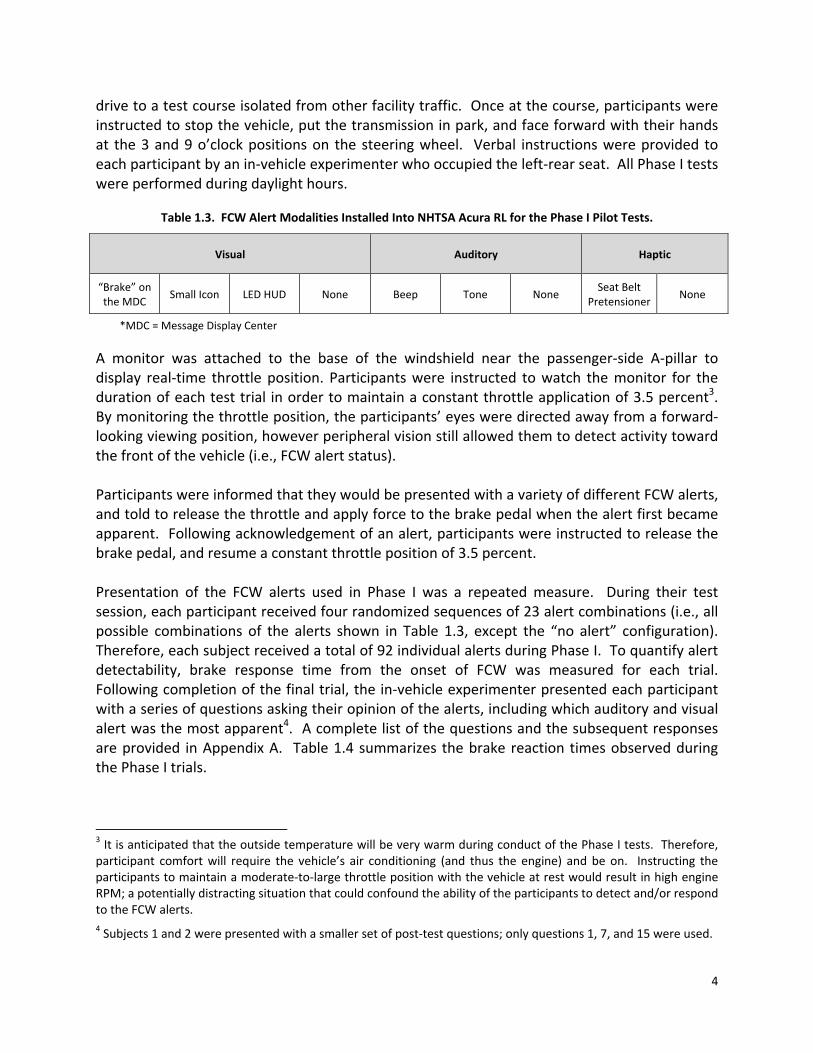
Table 13 FCW Alert Modalities Installed Into NHTSA Acura RL for the Phase I Pilot Tests
Visual Auditory Haptic
ldquoBrakerdquo on the MDC
Small Icon LED HUD None Beep Tone None Seat Belt
Pretensioner None
MDC = Message Display Center
A monitor was attached to the base of the windshield near the passenger‐side A‐pillar to display real‐time throttle position Participants were instructed to watch the monitor for the duration of each test trial in order to maintain a constant throttle application of 35 percent3 By monitoring the throttle position the participantsrsquo eyes were directed away from a forward‐looking viewing position however peripheral vision still allowed them to detect activity toward the front of the vehicle (ie FCW alert status) Participants were informed that they would be presented with a variety of different FCW alerts and told to release the throttle and apply force to the brake pedal when the alert first became apparent Following acknowledgement of an alert participants were instructed to release the brake pedal and resume a constant throttle position of 35 percent Presentation of the FCW alerts used in Phase I was a repeated measure During their test session each participant received four randomized sequences of 23 alert combinations (ie all possible combinations of the alerts shown in Table 13 except the ldquono alertrdquo configuration) Therefore each subject received a total of 92 individual alerts during Phase I To quantify alert detectability brake response time from the onset of FCW was measured for each trial Following completion of the final trial the in‐vehicle experimenter presented each participant with a series of questions asking their opinion of the alerts including which auditory and visual alert was the most apparent4 A complete list of the questions and the subsequent responses are provided in Appendix A Table 14 summarizes the brake reaction times observed during the Phase I trials
3 It is anticipated that the outside temperature will be very warm during conduct of the Phase I tests Therefore participant comfort will require the vehiclersquos air conditioning (and thus the engine) and be on Instructing the participants to maintain a moderate‐to‐large throttle position with the vehicle at rest would result in high engine RPM a potentially distracting situation that could confound the ability of the participants to detect andor respond to the FCW alerts
4 Subjects 1 and 2 were presented with a smaller set of post‐test questions only questions 1 7 and 15 were used
5
Table 14 Phase I Brake Reaction Time Summary (n =728)
Description Brake Reaction Time (seconds) Missed
Trials Min Max Mean Std Dev
Acura Belt Acura MDC 0325 0820 0507 0149 ‐‐
Acura Belt Mercedes Beep Mercedes IC 0330 0865 0516 0155 ‐‐
Acura Belt Volvo Tone 0285 1080 0518 0187 ‐‐
Acura Belt Mercedes Beep Volvo HUD 0310 0850 0520 0162 ‐‐
Acura Belt Mercedes Beep Acura MDC 0310 1120 0524 0170 ‐‐
Acura Belt 0320 0910 0527 0160 ‐‐
Acura Belt Volvo Tone Acura MDC 0290 0905 0529 0163 ‐‐
Acura Belt Volvo HUD 0315 1025 0532 0176 ‐‐
Acura Belt Mercedes IC 0330 0920 0534 0180 ‐‐
Acura Belt Mercedes Beep 0335 0950 0538 0188 ‐‐
Acura Belt Volvo Tone Mercedes IC 0290 1070 0540 0191 ‐‐
Acura Belt Volvo Tone Volvo HUD 0320 0990 0557 0200 ‐‐
Mercedes Beep Mercedes IC 0510 1085 0690 0143 ‐‐
Volvo Tone Volvo HUD 0465 1035 0705 0156 ‐‐
Volvo Tone Acura MDC 0470 1125 0708 0187 ‐‐
Mercedes Beep Volvo HUD 0460 1535 0713 0237 ‐‐
Mercedes Beep Acura MDC 0405 1425 0747 0245 ‐‐
Mercedes Beep 0495 1065 0752 0173 ‐‐
Volvo Tone Mercedes IC 0460 1535 0786 0281 ‐‐
Volvo Tone 0475 1365 0797 0200 ‐‐
Mercedes IC 0495 3395 1065 0563 4 of 32
Acura MDC 0500 4330 1088 0785 3 of 32
Volvo HUD 0505 2940 1158 0577 1 of 32
Note HUD = head‐up display IC = instrument cluster MDC = message display center
In Table 14 results from tests performed with auditory alerts only are highlighted in green Similarly tests performed with visual alerts only are highlighted in blue Results from alert configurations containing seat belt pretensioning (ie those containing ldquoAcura Beltrdquo in the description column) are shown in orange Note that a total of 728 data points are summarized in Table 14 Of the 736 tests performed (8 subjects 92 tests per subject) eight resulted in missed trials because the participants did not detect the presentation of the FCW alert Missed trials only occurred during one of the three visual‐only configurations
6
1312 Utility of the Phase I Results Depending on the analysis performed differences in brake reaction time observed in Phase I were either marginally significant or not statistically significant (an analysis is provided in Appendix B) Therefore the participantsrsquo subjective impressions of the two auditory alerts were used to determine which to include in subsequent test phases When asked which auditory alert was the most noticeable six of the eight responses indicated the ldquoMercedes Beeprdquo Two participants indicated both auditory alerts were equally apparent Five of the six participants indicated the Mercedes beep‐based alert was ldquoobviousrdquo ldquoattention gettingrdquo or ldquourgentrdquo Based on this feedback the ldquoMercedes Beeprdquo was retained for later use as the sole auditory alert The decision on which visual alert to include in subsequent test phases was confounded by the fact each visual‐only configuration produced missed trials Four of the eight participants considered the Acura message display center‐based visual alert to be the most apparent followed by the Volvo HUD (three participants) then the Mercedes instrument cluster‐based alert (one participant) Given that the differences in mean brake reaction time were not significantly different across visual alert type and since the number of missed trials was lowest for tests performed with the Volvo HUD only (ie when compared to the other visual‐only alerts) the Volvo HUD was retained for later use 132 CWIM Phase II Research Performed at VRTCmdashProtocol Refinement Once the reduced set of FCW modalities had been identified work to refine the protocol for evaluating driver‐vehicle interface (DVI) effectiveness was performed Unlike the static testing used in Phase I Phase II tests were highly dynamic placing participants recruited from the general public in a realistic crash imminent driving scenario 1321 Phase II Experimental Design At a high level the Phase II protocol asked participants to perform two tasks during an experimental drive on a controlled test course First they were instructed to maintain a constant distance between their vehicle and another being driven directly in front of them Second while maintaining a constant headway participants were asked to direct their attention away from the road to observe a series of three random numbers presented on an interface located near the right front seat headrest After the last number had been presented participants were told to return to a forward‐looking viewing position and repeat the numbers aloud to an in‐vehicle experimenter (who occupied the left‐rear seating position) Late in their drive during a period of distraction imposed by the random number recall task the leading vehicle performed an abrupt lane change that suddenly revealed a stationary lead vehicle directly in the path of the participantrsquos vehicle Shortly thereafter distracted participants were presented with an FCW alert selected from the reduced set of alerts output
7
from Phase I Unlike the repeated measures experimental design used in Phase I each Phase II participant only received one FCW alert 1322 Phase II Distraction Task Interface Of particular interest for Phase II was development of a way to direct the participantsrsquo forward‐facing view away from the road for as long as possible while retaining excellent task acceptance with a low likelihood of a forward‐looking glance A random number recall task was developed in an attempt to satisfy these criteria In Phase II the random number recall task was based on a 45rdquo x 35rdquo display installed to the left of the SV front passenger headrest as shown in Figure 12 As initially conceived the task required a participant to (1) push a red button to the right of the numerical display (2) be presented with three random single digit numbers (3) release the button and (4) repeat the numbers aloud to an in‐vehicle experimenter (in the order they were shown) Observing the numbers required the participant fully avert their forward‐facing view from the road Each number was presented for approximately 750 ms
Figure 12 Random number recall display (the red button was used only during Phase II trials)
Conceptually the Phase II random number recall task was appealing because it was believed to impose reasonable physical and mental commitments upon the participants while keeping their forward‐facing view away from the road for an extended period of time Pilot tests performed with subjects recruited from within VRTC produced encouraging results the task was generally considered to be challenging yet comfortable Unfortunately tests performed with members from the general public revealed a major deficiency in the task design Although the first participant fully engaged the physical (pushed the button) and cognitive (committed the random numbers to memory) elements of the task immediately after being instructed to do so the next seven did not Instead these participants divided the task into two separate components When instructed to begin the random number task these participants reached for the task display and located the task activation button
8
entirely by touch However since the participants were able to maintain their forward‐looking viewing position while engaged in this spatial detection they could observe the choreography intended to produce a surprise event near the end of their experimental drive (ie the suddenly revealed stationary lead vehicle) Since concealing this choreography was an integral part of the test protocol additional refinement was required 133 CWIM Phase III Research Performed at VRTCmdashFinal Protocol Using lessons learned from Phases I and II the authors developed the Phase III FCW evaluation protocol This protocol offered an excellent combination of participant acceptance performability objectivity and discriminatory capability The Phase III protocol was used to produce the data discussed in the remainder of this report A total of 64 subjects participated in the Phase III
9
20 OBJECTIVES The objectives of the Phase III CWIM FCW work performed at VRTC were to
1 Develop a robust protocol for evaluating FCW DVI effectiveness on the test track
2 Perform a small scale human factors study to validate the CWIM FCW protocol
3 Evaluate how different FCW alert modalities affect participant reaction times and crash avoidance behavior
21 Protocol Overview The protocol used in this study was developed to examine how distracted drivers responded to FCW alerts in a crash imminent scenario A diverse sample of drivers was recruited from central Ohio for participation in the study These participants using a government‐owned SV were instructed to follow a moving lead vehicle (MLV) through a test track‐based course while maintaining a specified speed and headway During the drive participants were instructed to complete a distraction task requiring them to look away from the road for the duration of the task To familiarize participants with the vehicle driving environment and distraction task they performed multiple ldquopassesrdquo through the test course During the final pass with the driver fully distracted the MLV unexpectedly swerved out of the lane of travel to reveal a stationary lead vehicle (SLV) in the participantrsquos path In this study the SLV was actually a full‐size realistic‐looking inflatable 22 Evaluation Considerations The data produced in this study were reduced and analyzed with methods that objectively described how the participants responded to different FCW modalities Evaluation metrics quantified differences in the timing and magnitude of driversrsquo avoidance maneuvers From a protocol assessment perspective the authors were interested in confirming that the experimental design and methodology used in this study could effectively objectively and repeatably quantify the participantsrsquo willingness to perform the protocolrsquos tasks and the ability of the protocol to discriminate between baseline (ie no alert presented) apparent and non‐apparent alerts From a driver performance perspective the primary data of interest straddled the crash imminent scenario (1) the TTC when participants returned to their forward‐looking viewing position (2) throttle release brake application and avoidance steer response times from FCW alert onset (3) the magnitudes of the participantsrsquo brake and steer inputs (4) the magnitudes of the SV speed reductions and accelerations and whether the test participants collided with the SLV
10
30 TEST APPARTATUS AND INSTRUMENTATION 31 Test Vehicles 311 Subject Vehicle (SV) The SV used in this study was a 2009 Acura RL shown in Figure 31 Originally‐equipped this four‐door sedan was equipped with all‐wheel drive four‐wheel anti‐lock disc brakes with brake assist electronic stability control (ESC) an FCW system and a crash imminent brake system (CIB) During conduct of the tests performed in this study an in‐vehicle experimenter occupied the left‐rear seating position To observe test data as it was being collected tabulate participant performance and manually activate elements of the test protocol during pre‐test familiarization an interface with the vehiclersquos data acquisition and audio system was installed behind the driver seat
312 Moving Lead Vehicle (MLV) The moving lead vehicle (MLV) used in this study was a 2008 Buick Lucerne shown in Figure 32 This mid‐sized sedan was selected primarily out of convenience it was available had been previously instrumented with much of the equipment required by the protocol described in this report and was large enough to effectively obscure the subjectrsquos view of the SLV prior to the surprise event presented at the end of the experimental drive Of note in Figure 32 is the solid black vertical panel installed behind the front seats This panel prevented participants from looking through the MLV during their drive thereby reducing the likelihood of the SLV being prematurely detected on approach For this study the MLV was driven by a professional test driver MLV speed was maintained using cruise control for much of the experimental drive
Figure 31 2009 Acura RL the subject vehicle used in this study
11
313 Stationary Lead Vehicle (SLV) The FCW alerts used in this study were presented at a TTC of 21 seconds a value believed to be representative of those used by algorithms installed in contemporary production vehicles Responding to an alert presented at this TTC was intended to provide participants with enough time to successfully avoid the SLV However since this study also included a baseline condition where no alerts were presented SV‐to‐SLV collisions were to be expected To insure participant safety a full‐size inflatable ldquoballoon carrdquo designed to emulate a 2009 Volkswagen GTI (shown in Figure 33) was used
The SLV was approximately 5 ft wide 5 ft tall 12 ft long and weighed 77 lbs It was strikeable inflatable in the field and secured to the ground with zip ties and concrete anchors The zip ties present at each corner of the SLV were strong enough to prevent the vehicle from moving in response to wind gusts but easily snapped during a SV‐to‐SLV collision The SLV restraints are shown in Figure 34
Figure 32 2008 Buick Lucerne the moving lead vehicle used in this study
Figure 33 Inflatable balloon car used at the stationary lead vehicle in this study
12
Figure 34 Stationary lead vehicle restraint anchor
32 Forward Collision Warning (FCW) Modalities As previously explained in Section 1312 the visual FCW alert originally installed in the SV was disabled in lieu of using that from a 2008 Volvo S80 Specifically the Volvo S80 visual alert consisted of a 6‐inch light bar that when activated flashed a series of twelve light‐emitting diodes (LED) using a 50 percent duty cycle for 4 seconds (100ms on 100ms off) A reflection of the light bar illumination was visible to the driver in the form of a head up display (HUD) on the windshield intended to reside in line‐of‐sight for easy detection Figure 35 shows where the hardware Volvo FCW HUD hardware was installed in the dash of the SV Also as explained in Section 1312 the auditory FCW alert originally installed in the SV was disabled in lieu of using that from a 2010 Mercedes E350 Specifically this auditory alert was comprised of ten sharp beeps using the audio clip provided in Section 1311 Although very similar to that installed in the SV use of the Mercedes‐based alert allowed the authors to diversify the origins of the FCW alerts used in this study
Figure 35 Volvo S80 FCW HUD hardware installed in the subject vehicle dashboard
13
The magnitude of the seat belt pretensioner activation used in this study was intended to closely emulate that of the original 2009 Acura RL‐based configuration However the timing of when the intervention occurred was adjusted to be in agreement with the auditory and visual alerts (ie the commanded onset of each alert was equivalent) Note Although the SV was equipped with a forward‐looking radar to provide range and range‐ rate data to the vehiclersquos FCW controller the authors opted to activate each FCW alert using an external control computer and positioned‐based trigger points This provided excellent activation repeatability and avoided the potential for the original sensing system being unable to acquire and respond to the SLV in the limited time available pre‐crash 33 Task Displays 331 Headway Maintenance Monitor To assist the participants with achieving and maintaining the appropriate distance to the MLV during each pass a 325rdquo x 20rdquo monitor displaying the real‐time headway was attached to the base of the windshield just above the SV dashboard (see Figure 36)
332 Random Number Recall Display During each pass and while maintaining the desired headway participants were instructed to complete a total of four random number recall tasks During the conduct of these tasks five randomly generated single digit numbers were presented on a 45rdquo x 35rdquo display installed to the left of the SV front passenger headrest (previously shown in Figure 12) The increase to five numbers from the three used during the preliminary Phase I and II research was made to increase task duration (ie the amount of time participants were required to look away from the road) without imposing excessive cognitive overhead [2] Each of the five random numbers was presented for 472 ms This duration which was approximately 371 percent less than that used during Phases I and II was short enough to
Figure 36 Headway monitor installed in the SV
14
strongly discourage glances away from the display (ie back to a forward‐facing view of the road) while still allowing each number to be easily observed and retained Observing the numbers required the participant fully avert their forward‐facing view from the road 34 Instrumentation The SV was instrumented with two data acquisition systems one for collecting inertial and highly accurate GPS position data the other for miscellaneous analog data Both systems were installed in the SV trunk to minimize participant distraction during the experimental drive The moving lead vehicle (MLV) was equipped with a similar GPS‐enhanced inertial sensing system to facilitate real‐time vehicle‐to‐vehicle range (eg SV‐to‐MLV headway) The balloon‐based SLV contained no instrumentation 341 Subject Vehicle Instrumentation
The basic analog measurements logged in the SV included brake pedal force throttle position steering wheel angle brake line pressure the state of the vehicle and various data flags To measure the force applied to the brake pedal a load cell was clamped onto the front surface of the pedal as show in Figure 37 To offset the difference in step height imposed by installation of the load cell a light‐weight adapter was attached to the throttle pedal
Figure 37 Load cell used to measure brake force Note adapter to increase throttle step height
Throttle position data were collected through a direct tap of the vehiclersquos throttle position sensor (TPS) Under the dash a potentiometer was attached to the steering column and configured to measure steering wheel angle Transducers were installed at the bleeder screw of each brake caliper to measure brake line pressure The SV positions velocities rotational rates and accelerations were measured with a GPS‐enhanced inertial platform installed in the truck and were resolved to the vehiclersquos center of gravity (see Appendix C for a detailed description of this system) Finally data flags indicating initiation of the random number recall task instructions random number recall task duration FCW onset and the state of each FCW modality were recorded
15
342 Moving Lead Vehicle Instrumentation In a manner similar to that used for the SV the MLV positions velocities rotational rates and accelerations were measured with a GPS‐enhanced inertial platform Although this unit was installed in the cabin these data were still resolved to the vehiclersquos center of gravity Using a wireless communication package integrated with the inertial platforms installed in each vehicle the state of the MLV was broadcast to the SV The relative position of the MLV with respect to the SV (ie the real‐time headway) was one of these data channels To assist the MLV driver with maintaining the desired velocities a speed display was secured to the inside of the windshield just above the dashboard 343 Presentation of Auditory Commands and Alerts
An automated system was developed to produce audible instructions and FCW alerts in the SV during the experimental test drive This system used a trunk‐mounted laptop PC to play wav files through a center‐mounted speaker installed in the SVrsquos dashboard Specifically the
instruction ldquoBegin Task Nowrdquo directed the participant to begin the random number recall task Software provided with the a GPS‐enhanced inertial platform installed in the SV was used to automatically initiate presentation of the audible instructions and FCW using positioned‐based trigger points 344 Video Data Acquisition Four small video cameras were mounted inside the cabin of the SV to observe driver activity during the experimental test drive One camera was mounted to the underside of the dash near the center console to record throttle and brake pedal activity The pedals were illuminated by a ldquolight striprdquo containing 20 infrared LEDs A second camera was mounted to the rear window interior trim facing forward to observe how the driver engaged with the random number recall task display Two cameras were mounted to the rearview mirror (1) a forward‐facing camera was mounted to the back side of the interior rearview mirror to observe SV lane keeping SV‐to‐MLV headway and how the SV approached the SLV during the final pass of the experimental drive and (2) a rear‐facing camera used to observe the participants eye glance activity and physical reactions to the suddenly appearing SLV A small microphone was mounted in the interior trim above the driverrsquos head The microphone signal was amplified to achieve good reception of driver comments experimenterrsquos instructions and FCW alerts where applicable
16
40 TEST PROTOCOL 41 Overview Real drivers ages 25 to 55 years old were recruited from the general public for participation in this study Each participant was asked to follow the MLV within the confines of a controlled test course while attempting to maintain a constant headway and instructed to perform a series of four distraction tasks intended to briefly divert their attention away from a forward‐viewing position With the participant fully distracted during the final task the MLV was abruptly steered out of the travel lane to reveal a realistic‐looking full‐size balloon car acting as the SLV in the immediate path of the SV
At a nominal TTC of 21s from the SV one of eight FCW alerts was presented to the distracted participant The manner in which the driver responded to the FCW alert was used to assess driver‐vehicle interface (DVI) effectiveness The ldquoLead Vehicle Cut‐Outrdquo scenario as viewed from inside the SV is shown in Figure 41 An example of a rear‐end impact with the SLV is shown in Figure 42
Figure 41 Lead vehicle cut‐out scenario
Figure 42 Subject vehicle‐to‐stationary lead vehicle impact
17
42 Participant Recruitment
Participant recruitment was accomplished by publishing advertisements in local newspapers and online via Craigslist In these advertisements shown in Appendix D prospective subjects were instructed to contact NHTSArsquos VRTC if interested in study participation Respondents were screened to ensure they satisfied the health and eligibility criteria described in Appendix E If these criteria were satisfied the respondents were provided with additional study details and more specific personal information was collected from them 43 Pre‐briefing and Informed Consent Meeting Upon arriving at VRTC participants were greeted and escorted to a conference room Here each participant was provided with an informed consent form describing the purpose of the study to be an evaluation of how interfacing with an electronic device may affect their ability to maintain a consistent distance between their vehicle and one being driven directly in front of them The informed consent form shown in Appendix E explained that a windshield‐mounted display would be used to report the distance between the two vehicles (the headway monitor) and that the study participants would be asked to interface with the electronic device (a random number display) four times during their test drive 44 Vehicle and Test Equipment Familiarization Following completion of the pre‐briefing participants were escorted to the Government‐owned SV Each participant was instructed to turn their cell phone off secure their seat belt adjust the seat and mirrors to comfortable positions and to familiarize themselves with the orientation of the basic vehicle controls (eg throttle brake pedal turn signal indicators etc) Participantsrsquo use of sunglasses while in the SV was not allowed An in‐vehicle experimenter who sat behind the participant in the left rear seating position for the duration of the experimental drive described the location and functionality of the headway monitor and random number display to the participant and asked that they be adjusted to insure a comfortable viewing position5 During this process the in‐vehicle experimenter described details pertaining to the two types of tasks being used during the experimental drive headway maintenance and random number recall Together these tasks were ultimately used to facilitate the choreography designed to evaluate how the participants responded to the various FCW modalities unexpectedly presented at the end of their drive 441 Maintaining a Constant Headway For a majority of their drive participants were instructed to maintain a constant distance of 110 ft between the front of their vehicle to the rear of the MLV being driven at 35 mph The magnitude of this distance or headway was selected to best balance participant safety
5 The attachment points of the headway monitor and random number display were not adjustable only the viewing angles
18
participant compliance (eg their willingness to maintain a close proximity to the MLV) and the ability of the MLV to effectively obstruct the participantsrsquo view ahead of it Participants were not permitted to use cruise control while attempting to maintain a constant SV‐to‐MLV headway However participants were encouraged to use the headway maintenance monitor described in Section 311 to assist them with this task Although the participants were instructed to maintain a headway of 110 ft while driving on the straight sections of the test course (subsequently referred to as a ldquopassrdquo) they were also told that a tolerance of plusmn15 ft (ie a headway between 95 to 125 ft) was acceptable If the in‐vehicle experimenter observed that the actual headway was outside of this range during the experimental drive the participant was reminded what the acceptable performance was and encouraged to increasedecrease the SV speed to tightenlengthen their following gap Sustained non‐compliance with this request resulted in a deduction of the task incentive pay described in Section 452 442 Random Number Recall During each pass participants were instructed to complete a total of four random number recall tasks Using the display previously shown in Figure 12 presentation of five random numbers was initiated 10 second after conclusion of the instruction to begin the random number recall task and approximately 77 seconds after establishing lane position on the test course (ie the onset of a given pass) To minimize variability the random number recall task instruction and presentation of the random number recall task numbers were automatically triggered at the desired points on the test course using a GPS‐based closed‐loop feedback control algorithm 45 Study Compensation 451 Base Pay Test subjects received a nominal compensation of $3500 for participation in the study and $050 per mile for each mile driven from their residence to the study site 452 Incentive Pay To encourage good performance an incentive schedule was used for each task If they were able to maintain a consistent headway when instructed to do so a factor critical to choreography participants received up to $2000 more than their base pay Specifically participants received $500 per pass if a majority of that pass was within a range of 95‐125 ft This incentive was awarded on a pass‐to‐pass basis performance observed during any single pass had no influence on the earning potential of the other passes If a participant successfully completed all aspects of the random number recall task they received an additional $4500 This incentive was larger than that associated with headway
19
maintenance since it was imperative the participants be fully distracted ahead of (and during) the Lead Vehicle Cut‐Out maneuver and the subsequent presentation of the FCW alert During the first pass participants were awarded $150 per number successfully recalled in the order presented For the second and third passes participants were awarded $250 per number correctly recalled Due to the presence of the SLV all participants received the maximum task compensation ($1250) regardless of task performance during the final pass If the number sequence indicated by the participant was not correct for a given pass there was a $100 penalty imposed for the task compensation earned during that pass Table 41 summarizes the incentive pay schedule used in this study Appendix G presents the log sheet used by the in‐vehicle experimenter to tabulate the participantsrsquo performance
Table 41 Task Payment Schedule
Pass Headway
Maintenance
Random Number Recall
Task‐Based Payment Correct
Compensation Incorrect Order
Deduction
1 $5 if within range $150 per correct ‐$1 per order error Total for pass 1
2 $5 if within range $250 per correct ‐$1 per order error Total for pass 2
3 $5 if within range $250 per correct ‐$1 per order error Total for pass 3
4 $5 if within range $250 per correct ‐$1 per order error Total for pass 4
Total Compensation Sum of pass totals
Throughout the experimental drive the in‐vehicle experimenter informed the participant of their task performance shortly after conclusion of the pass during which the compensation was earned This feedback was used to keep participants motivated (eg ldquoYou did well during that passrdquo) to indicate how acceptable their performance was (ie how much of the maximum payment was awarded) and to provide a means for suggesting how task performance may be improved during subsequent passes (eg ldquoYour headway was a bit too long during the last trial Please try to drive closer to the lead vehicle during the next passrdquo) 46 Pre‐test Forward Collision Warning Education and Familiarization No pre‐test FCW education familiarization or instruction was provided to the participants recruited for this study Time and budgetary constraints and the desire to have a reasonable number of participants per test condition imposed a limitation that either all subjects would or would not receive information regarding FCW before the experimental drive So as to observe the most genuine untrained responses to the various FCW modalities responses not artificially influenced by receiving statements or descriptions of an unfamiliar technology less than an hour before receiving the alert during their drive the authors opted to exclude FCW education or familiarization from the protocol used for this study
20
47 FCW Alert Modalities Table 42 provides a summary of the eight FCW modalities used in this study As previously explained the basis for including these alerts was twofold prevalence in contemporary FCW implementations and positive results from the Phase I static test
Table 42 FCW Alert Modality Summary
FCW Modality Alert Origin
None Baseline (no alert)
Visual Only 2008 Volvo S80 (HUD)
Auditory Only 2010 Mercedes E350 (repeated beeps)
Haptic Seat Belt 2009 Acura RL (reversible seat belt pretensioner)
Visual + Auditory 2008 Volvo S80 + 2010 Mercedes E350
Visual + Haptic Seat Belt 2008 Volvo S80 + 2009 Acura RL
Auditory + Haptic Seat Belt 2010 Mercedes E350 + 2009 Acura RL
Visual + Auditory +Haptic Seat Belt 2008 Volvo S80 + 2010 Mercedes E350 + 2009 Acura RL
48 Test Course The studyrsquos primary driving task was performed on Lane 4 of the Transportation Research Center Inc (TRC) Skid Pad An overview of the Skid Pad and the key logistics associated with the experimental design is provided in Figure 43
Since the participants were members of the general public exclusive use of the entire Skid Pad was used during the periods of test conduct to maximize safety Performing tests on the Skid Pad provided the subjects with an opportunity to use significant avoidance steering should
North Loop South Loop
Beginning of lane delineations
Presentation of distraction task when subject vehicle is heading north
Presentation of distraction task when subject vehicle is heading south
Figure 43 TRC Skid Pad dimensional overview
21
they deem it necessary without risk of a road departure or impact with other vehicles foreign objects etc Tests were performed during daylight hours with good visibility 49 Experimental Test Drive The experimental drive used in this study began and concluded with the SV and MLV staged in a VRTC parking lot Following the vehicle and test equipment familiarization and task orientation the in‐vehicle experimenter indicated the ldquolead vehiclerdquo to the participant (ie the MLV) and instructed them to follow it to the test course The brief drive to the test course from VRTC was performed at 25 mph 10 mph less than that specified for a valid straight‐line pass during the experimental drive The low speed of the pre‐study drive served two purposes (1) to increase the participantrsquos familiarization with the headway monitor operation in a benign operating condition and (2) to give the participant an opportunity to practice the task of maintaining a desired headway to the MLV in a non‐threatening environment 491 Pass 1 of 4 Following their test vehicle and equipment familiarization the in‐vehicle experimenter instructed the participants to establish position on Skid Pad Lane 4 heading south following the MLV with a headway of 110 ft using the windshield‐mounted headway monitor as a guide At a location approximately 075‐miles from the point where lane position was first established and while the participant was driving the participant was automatically instructed to begin the random number recall task when prompted by a pre‐recorded message played through the SV audio system As described in the task orientation once the fifth number had been presented the subject was to tell the in‐vehicle experimenter what five numbers were shown in the order they were presented After completing the first random number recall task participants were instructed to continue following the MLV around the Skid Padrsquos south curve After emerging from the curve heading north they were told to follow the MLV back into Lane 4 heading north and re‐establish a nominal headway of 110 ft using the windshield‐mounted distance display as a guide 492 Pass 2 of 4 After approximately 075‐miles from the point where lane position heading north was first established the participant was automatically instructed to begin their second random number recall task As before the task was deemed complete once the subject had told the in‐vehicle experimenter what five numbers were shown in the order they were presented After completing the second random number recall task the in‐vehicle experimenter instructed the participants to continue following the MLV around the Skid Padrsquos north curve After emerging from the curve heading south they were instructed to follow the MLV back into Lane
22
4 heading south and to re‐establish a headway of 110 ft using the windshield‐mounted distance display as a guide 493 Pass 3 of 4 From this point the sequence of driving south performing and completing the random number recall task and following the MLV around the south Skid Pad curve was repeated As before headway was then established and the participants instructed to drive north 494 Pass 4 of 4 After approximately 075‐miles from the point where lane position was first established the participants were automatically instructed to begin their fourth random number recall task By this time the participants were generally quite familiar and comfortable with the SV the driving environment their ability to maintain a constant headway to the MLV and their ability to complete the random number recall task During the fourth and final random number recall task the MLV was abruptly steered out of the travel lane revealing the SLV in the immediate path of the SV6 At a nominal TTC of 21s from the SLV one of eight FCW alerts was presented to the distracted participant Figure 44 presents an overview of the choreography used near the end of the fourth pass
Since it had not been incorporated into any of the first three passes during their drive and all other aspects of the driving experience were identical participants did not anticipate presentation of an FCW alert during the fourth pass This factor allowed the study protocol to discriminate which FCW alert modalities were capable of effectively redirecting the attention of a distracted driver back to the driving task Furthermore since the presence of SLV was a
6 In the event that the participant collided with the balloon car it merely bounced off the front of the subject vehicle Given the low vehicle speed used for this study (nominally 35 mph) and the strikeable design of the balloon car the risk of harm to the participant during a test where an impact occurs did not differ from a test where it does not
Figure 44 Choreography used to assess participant responses to the various FCW modalities used in this study
23
surprise the protocol allowed the authors to quantify how the various FCW modalities affected the participantsrsquo crash avoidance behavior 495 Participant Debriefing and Post‐Drive Survey Administration Within five seconds of either avoiding or striking the SLV participants were asked to stop the SV (if still moving) and place the transmission in park At this time the in‐vehicle experimenter read a short debrief script to the participant (provided in Appendix H) Participants were then instructed to follow the MLV back to VRTC Once parked the in‐vehicle experimenter escorted the test participants back to the conference room where they had received their pre‐test briefing During a final debriefing participants were asked to complete a brief survey containing questions about their experience in the study their comfort in performing the headway maintenance and random number recall tasks anticipation of the final conflict event (if any) and their opinions about FCW systems (see Appendix I) Participants were asked not to discuss the main purpose of the study with anyone through the end of October 2010 the end of the study period The participants were then provided with their compensation and thanked for participating in the study
24
50 TASK PARTICIPATION AND PERFORMANCE 51 Test Validity Requirements Given the effort used to obtain participants the test trial validity requirements used for this study were intended to be as accommodating as possible In a sense all driving activity leading up to presentation of the FCW alert was performed to groom the participants for comfortably achieving a vehicle speed of 35 mph at two critical times the onset of the random number recall task instruction and the onset of the FCW alert Here ldquocomfortablyrdquo refers to a general sense of ease while performing their commanded tasks (maintaining the proper headway to the MLV and recalling the random numbers after they had been displayed) Therefore the validity requirements were limited to
1 The participant not detecting the SLV before presentation of the FCW
2 The participant maintaining a SV speed of at least 30 mph until (1) responding to the FCW or (2) completion of the random number recall task
3 The participant achieving an SV‐to‐MLV headway between 95 to 125 ft at the onset of the random number recall task instruction
For this study achieving eight samples per FCW modality required valid data from 64 subjects This ultimately required the scheduling of 74 participants The 10 ldquoextrardquo subjects were needed for the following reasons
Three subjects failed to report to the test site as scheduled
Three participants failed to begin the random number recall task when instructed due to inattentiveness
One participant deliberately postponed beginning the number recall task until they believed the number presentation would begin (ie this individual realized and adapted to the 10 second pause between the end of the task instructions and revelation of the first number)
Two participants glanced back to the forward‐facing viewing position during the random number recall task
The SV speed at the end of visual commitment7 (VCend) was deemed too low (298 mph) for one participant
Disregarding the three subjects that did not arrive for the study six of the seven non‐valid trials involved participants observing the MLV steer or begin to steer around the SLV Prematurely detecting the presence of the SLV spoiled the surprise nature of the studyrsquos ruse and caused the
7 In the context of this study the authors defined visual commitment as the time from when the driver first averts their forward‐facing view from the road to the time this view was first recovered
25
participants to avoid it with little effort This invalidated the participantrsquos response to the FCW alert since they were (1) no longer fully distracted and (2) pre‐occupied with avoiding the rapidly approaching SLV Of the seven non‐valid trials three participants failed to participate in the random number recall task when instructed to do so Review of the video data and post‐test interviews associated with these participants indicated inattentiveness was the most probable explanation for this behavior In the case where the SV speed was too low the participant was able to successfully recall each of the five random numbers and comfortably avoid collision with the SLV The authors believe the vehicle speed observed at VCend for this particular trial reduced the scenario severity to a level not representative or comparable with the other trials performed in this study 52 Headway Maintenance Nominally participants were instructed to maintain a SV‐to‐MLV headway of 110 ft during each pass Once established and given the excellent consistency of the MLV speed maintaining this headway would result in a SV speed of 35 mph for the duration of each pass Maintaining the proper headway and speed during the final pass insured the surprise event could be successfully executed 521 Overall Headway Maintenance Task Performance The in‐vehicle experimenter maintained a log of acceptable headway maintenance during each pass This information was used to provide feedback to the participants on a pass‐by‐pass basis and provided the criteria for their headway maintenance task compensation Table 51 provides a summary of these logs Note that the in‐vehicle experimenter did not record headway performance during the final pass since all participants received the maximum compensation for the final pass due to the presence of the SLV Fifty‐three of the 64 participants (828 percent) were able to successfully perform the headway maintenance task for each of the first three passes
Table 51 Headway Maintenance Task Performance
Acceptable Headway
Pass 1 Pass 2 Pass 3 Pass 4
Yes No Yes No Yes No Yes No
55 9 63 1 62 2 na
Overall compliance with the headway maintenance requirement was quite good particularly for the second and third passes Acceptable headway maintenance task performance was achieved by 859 984 and 969 percent of the participants for first second and third passes
26
respectfully Note that the only participant with unacceptable headway performance during the second pass also had unacceptable performance during the third 522 Subject Vehicle Performance During Pass 4 Table 52 summarizes key test participant and test equipment inputs observed during the fourth pass of the experimental drive These data can be used to describe the robustness of the protocol The two primary groupings are SV speed and the SV‐to‐SLV distance (relevant during the final pass) These independent data were used to calculate the values shown in the third grouping SV‐to‐SLV TTC Within each grouping the data associated with four instances in time are shown (1) initiation of the automated instruction telling the participant to begin the random number recall task (2) the presentation the first number of random number recall task was shown (3) the onset of the FCW alert and (4) conclusion of the participantsrsquo VC Subject vehicle speed was controlled entirely by the participantsrsquo modulation of throttle and brake The use of cruise control was not permitted during the conduct of the test trials With the exception of the data shown in the ldquoVC Concludesrdquo column of Table 52 the SV‐to‐SLV distances were the product of automation At a nominal distance to the SLV the various events were automatically trigged via use of GPS‐based position and closed‐loop feedback Subject vehicle to SLV TTC data reflects the participantrsquos ability to maintain the desired test speed (nominally 35 mph achieved indirectly by attempting to maintain a consistent headway to the rear of the MLV) and the ability of the test equipment to accurately and repeatably initiate events during a participantrsquos drive The range and TTC data presented in the ldquoVC Concludesrdquo columns depended strongly on whether a participant responded to the FCW alert prior to completing the random number recall task Given the choreography of the experimental design a participant that effectively responded to the FCW alert would end their VC before a participant that tried to observe each of the five numbers presented during the random number recall task The earlier the VC concluded the further the participant was from the SLV This in turn resulted in a longer TTC 523 Moving Lead Vehicle Performance During Pass 4 Consistent MLV operation played an import role in insuring the SV was being driven at the correct speed at the time of the FCW alert Table 53 summarizes the MLV speed at the onset of random number recall task instruction during the final pass of the test drive and for key elements of the MLV avoidance maneuver around the SLV The avoidance maneuver onset was determined from analysis of MLV lateral acceleration data The period of data considered for peak MLV lateral acceleration and lateral deviation ranged from onset of random number recall task instruction to two seconds after FCW presentation occurred in the SV
27
Table 52 Repeatability of Key Participant and Test Equipment Inputs Observed During Pass 4
Description
SV Speed (mph)
SV‐to‐SLV Distance (feet)
SV‐to‐SLV TTC (seconds)
Task Instruction
Random Numbers Presented
FCW Alert VC
Concludes Task
Instruction
Random Numbers Presented
FCW Alert VC
Concludes Task
Instruction
Random Numbers Presented
FCW Alert VC
Concludes
Min 330 311 308 308 2785 1507 1033 164 5070 2758 1879 0319
Max 375 381 383 382 2793 1705 1087 945 5765 3743 2325 1872
Mean 352 352 351 349 2789 1605 1061 527 5412 3117 2064 1030
Std Dev 11 13 14 15 02 40 15 239 0165 0186 0094 0466
Median 352 352 352 351 2789 1602 1061 500 5410 3112 2055 0927
Nominal 350 350 350 350 2823 1724 1078 Subject
Dependent 55 34 21 Subject
Dependent
VC = Visual Commitment defined as the instant the driver returns their vision to a forward‐looking position
28
Table 53 Repeatability of Key Moving Lead Vehicle Inputs During Pass 4
Description
MLV Speed
at Onset of Task Instruction
(mph)
MLV Avoidance Maneuver
Longitudinal MLV‐to‐SLV
Distance at Onset (ft)
Peak Lateral Acceleration
(g)
Maximum Lateral Deviation
(ft)
Min 349 552 048 97
Max 358 1035 086 155
Mean 355 743 068 127
Std Dev 02 107 0074 13
Median 354 718 069 129
Nominal 350 As close as possible Low enough to
prevent tire squall 13
(one lane width)
The range of MLV speeds was very tight during the experimental drive (only 09 mph) making it unlikely to have confounded the ability of the participants to maintain a constant SV‐to‐MLV headway Similarly while it is uncertain whether the manner in which the MLV was steered around the SLV affected the participantsrsquo crash avoidance maneuvers it is unlikely MLV avoidance path variability confounded the study outcome Each MLV avoidance maneuver was performed to the left of the SLV and the range of MLV maximum lateral deviations was very narrow 524 FCW Alert Modalities For the duration of this report test results are commonly summarized via use of histograms The data presented in these charts are organized in two ways (1) sorted by FCW condition number as a function of whether the respective modality included seat belt pre‐tensioning (ie ldquoBeltrdquo vs ldquoNo Beltrdquo) and (2) sorted by FCW condition number as a function of whether the SV came in contact with the SLV (ie ldquoCrashrdquo vs ldquoAvoidrdquo) In both chart types the baseline data (ie that produced during tests performed without any form of FCW alert presentation) are shown in light blue In these charts and in the subsequent discussions based on them FCW alert modalities are referred to by condition number (see Table 54) In addition to the general overviews of the data statistical analyses were performed Due to the manner in which these analyses were performed and the pairing of certain data sets to increase the number of participants per test condition short descriptions were used to describe each modality also described in Table 54 525 Subject Vehicle Speed at FCW Onset Since the speed of the MLV was tightly controlled requiring the participants maintain a constant SV‐to‐MLV headway provided a means to encourage constant SV speed during each
29
Table 54 FCW Alert Modality Condition Numbers
FCW Alert Modality Condition Used For General Analyses
Descriptions Used For Statistical Analyses
No alert 1 None
Volvo HUD 3 Beep
Mercedes Beep 6 HUD
Acura Belt 7 Belt
Mercedes Beep Volvo HUD 12 BeepHUD
Acura Belt Volvo HUD 13 BeltHUD
Acura Belt Mercedes Beep 18 BeltBeep
Acura Belt Mercedes Beep Volvo HUD 23 All
pass of the experimental drive As presentation of the random number recall task instructions random number recall numbers and FCW alert were each initiated at predefined SV‐to‐SLV distances variations of SV speed directly affected the TTC at which they occurred Of particular interest was the state of the SV at the time of FCW alert Figure 51 summarizes the SV speed at FCW alert onset presented as a function of FCW modality Figure 52 presents these data as a function of FCW modality and crash outcome Subject vehicle speeds at FCW alert onset ranged from 308 to 383 mph with overall mean and median values of 351 and 352 mph respectively Therefore the overall mean and median SV speeds were only 01 mph (03 percent) and 02 mph (06 percent) greater than the respective target values
Figure 51 SV speed at FCW alert onset presented as a function of FCW modality
30
Figure 52 SV speed at FCW alert onset presented as a function of FCW modality and crash outcome
526 Range to Stationary Lead Vehicle at FCW Onset To achieve a TTC of 21 seconds at FCW onset using a nominal SV speed of 35 mph the alert was to be presented when the SV was 1078 ft from the SLV Overall the SV‐to‐SLV distance at FCW alert onset ranged from 1033 to 1087 ft with overall mean and median values of 1061 ft only 17 ft (16) less than the target value Figure 53 summarizes the SV speed at FCW alert onset presented as a function of FCW modality Figure 54 presents these data as a function of FCW modality and crash outcome
Figure 53 SV‐to‐SLV headway at FCW onset presented as a function of FCW modality
31
Figure 54 SV‐to‐SLV headway at FCW onset presented as a function of FCW modality and crash outcome
527 Subject Vehicle‐to‐Stationary Lead Vehicle TTC at FCW Onset Nominally presentation of the FCW alerts used in this study was to occur at TTC = 21 seconds Overall these TTC values ranged from 188 to 233 seconds with overall mean and median values of 2064 and 2055 seconds respectively Therefore the overall mean and median TTCs at FCW onset were only 36 ms (17 percent) and 45 ms (06 percent) less than the respective target values Figure 55 summarizes the SV‐to‐SLV TTCs at FCW alert onset presented as a function of FCW modality Figure 56 presents these data as a function of FCW modality and crash outcome
Figure 55 SV‐to‐SLV TTC at FCW onset presented as a function of FCW modality
32
Figure 56 SV‐to‐SLV TTC at FCW onset presented as a function of FCW modality and crash outcome
Table 55 provides a summary of the data used to statistically compare the mean SV‐to‐SLV TTCs shown in Figures 55 As expected (ie given the tight distribution of the data) the means were not found to be significantly different Similarly the data shown in Table 56 indicate the mean TTCs of the FCW alerts presented to male participants was not significantly different than that of the female participants
Table 55 SV‐to‐SLV TTC At FCW Onset Comparison By Modality
TTC at FCW Onset (sec)
Condition Modality N Mean Std Dev Minimum Maximum Pr gt F
23 All 8 2023 0076 1906 2112
01487
3 Beep 8 2063 0082 1902 2156
12 BeepHUD 8 2010 0078 1879 2117
7 Belt 8 2062 0052 1970 2143
18 BeltBeep 8 2052 0043 1987 2127
13 BeltHUD 8 2071 0086 1938 2184
6 HUD 8 2087 0117 1982 2278
1 None 8 2144 0148 1971 2325
Table 56 SV‐to‐SLV TTC At FCW Onset Comparison By Gender
TTC at FCW Onset (sec) ndash by Gender
Gender N Mean Std Dev Minimum Maximum Pr gt F
F 31 2081 0088 1938 2325 01986
M 32 2051 0098 1879 2304
33
528 Random Number Recall The in‐vehicle experimenter maintained a log of the participantsrsquo ability to correctly recall the five random numbers and their order presented during each pass This information was used to provide feedback to the participants on a pass‐by‐pass basis and provided the criteria for their random number recall task compensation Table 57 provides a summary of task performance from the in‐vehicle experimenterrsquos logs Generally speaking task performance was quite good However the fact not all of the random numbers were recalled correctly indicates the task was also a reasonably demanding one Seventeen of the 64 participants (266 percent) were able to successfully perform the random number recall task without any errors Interestingly the participants who correctly identified each number remained quite consistent throughout the first three passes with a slight overall improvement being realized by the third pass Some participants perceived this improvement as well as indicated by Participant 21 during the drive back to the laboratory after the experimental drive ldquoI think by the fourth pass yoursquore starting to trust your driving and focus more on the numbersrdquo Note this participant correctly identified four numbers during the first pass and five during passes 2 and 3 (albeit with a sequence error during the third)
Table 57 Random Number Task Recall Performance Summary (Number of participants and percentages of the overall 64 participant group are shown)
Pass
Number of Numbers Correctly Recalled Incorrect Recall Order 0 1 2 3 4 5
1 0 0 0 4
(63) 19
(297) 41
(641) 14
(219)
2 0 0 0 6
(94) 18
(281) 40
(625) 7
(109)
3 1
(16) 0 0
2 (31)
15 (234)
46 (719)
7 (109)
4 na
34
60 CRASH AVOIDANCE RESPONSE TIMES In this section different ways to assess the participantsrsquo crash avoidance response times are provided This includes an examination of how long participants took to respond to the random number recall task instruction a detailed breakdown of elements pertaining to different aspects of visual commitment (VC) the interaction between presentation of the FCW and VC and the TTC at the end of VC (recall the protocol choreography previously shown in Figure 44) Throttle release brake application and avoidance steering initiation times measured with respect to end of VC and FCW onset are also provided 61 Random Number Recall Task Instruction Response Time To better understand the variability associated with each stage of the VC process the authors began by quantifying how long the participants took to respond to the random number recall task instruction measured from instruction onset to onset of visual commitment (VCstart) Since VCstart always occurred before presentation of the FCW this parameter was expected to remain consistent across all participants An example of the VC sequence is provided on page 36 Figure 61 presents the distribution of response times to the random number recall task instructions observed in this study for each FCW modality Overall these response times ranged from 760 ms to 213 seconds8 with overall mean and median values of 148 and 149 seconds respectively The mean values for each FCW modality ranged from 136 to 160 seconds overall for configurations 3 and 23 respectively
Figure 61 Response time from recall task instruction to VCstart presented as a function of FCW modality
The overall random number recall task instruction response time means observed during tests performed with seat belt pretensioner‐based FCW modalities ranged from 1364 to 1600
8 The duration of the random number recall task instruction from onset to completion was 108 seconds Four participants initiated their visual commitment during the task instruction
35
Figure 62 Visual commitment (VC) sequence
Random number recall task
Onset of visual commitment
(VCstart)
Forward‐facing view
Completion of visual commitment
(VCend)
FCW onset
36
seconds for conditions 7 and 23 respectively These values very nearly contained the entire range of comparable means established during tests performed without seat belt pretensioner‐based FCW modalities whose range was from 1363 to 1520 seconds established by conditions 3 and 12 respectively The mean value of the trials performed with no FCW alert (1529 seconds) resided within the mean range of trials performed with seat belt pretensioning but was just outside the range of means established without pretensioning As expected the data shown in Figure 63 indicate response time to the random number recall task instructions had no apparent affect on crash outcome The overall task instruction response time means of the trials with and without collisions with the SLV were 1489 and 1456 seconds respectively differing by only 23 percent
Figure 63 Response time from recall task instruction to VCstart presented as a function of FCW modality and crash outcome
62 Overall Visual Commitment Duration Developing a way to promote sustained VC was an essential component of the experimental design since a quick forward‐looking glance back to the road in the presence of the SLV before the FCW alert was presented would likely invalidate that test trial In other words to insure the authors were able to attribute the return of the driverrsquos forward‐facing view to either (1) responding to the FCW alert or (2) completion of the random number recall task the experimental design required methodology that suppressed the driverrsquos temptation to glance Figure 64 presents the distribution of overall VC durations observed in this study for each FCW modality The overall VC durations ranged from 127 to 433 seconds The mean values for each FCW modality ranged from 235 to 351 seconds overall for configurations 18 and 3 respectively The overall VC duration means observed during tests performed with seat belt pretensioner‐based FCW modalities ranged from 235 to 287 seconds for conditions 18 and 7 respectively These values overlapped the comparable range of means recorded during tests performed
37
without seat belt pretensioner‐based FCW modalities which ranged from 284 to 351 seconds for conditions 12 and 3 respectively The mean value of the trials performed with no FCW alert (330 seconds) resided outside of the mean range established by the trials performed with seat belt pretensioning but within that observed without
Figure 64 Overall visual commitment duration presented as a function of FCW modality
The data shown in Figure 65 provide an indication that shorter periods of overall VC are closely associated with the ability of the participantsrsquo to avoid a crash The overall mean VC of the trials where the participants collided with the SLV was 354 percent longer than that observed when the crash was avoided (310 versus 229 seconds)
Figure 65 Overall visual commitment duration presented as a function of FCW modality and crash outcome
63 Visual Commitment to Onset of FCW Overall visual commitment can be broken down into two components the time from the onset of VC to the onset of the FCW (ie VCstartFCW) and from the onset of the FCW to completion of the VC (ie FCWVCend) Although it is certainly conceivable an FCW may affect the later of
38
these components it should not affect the former In other words regardless of what (if any) FCW modality was used for a particular trial the alert was always presented after VC had been initiated Assuming a normal distribution of drivers existed within and across the various FCW configurations type of FCW alert should be incapable of affecting when the driver was ultimately presented with it Figure 66 presents the distribution of VCstartFCW durations observed in this study Overall these durations ranged from 120 to 273 seconds with the mean values for each FCW modality ranging from 172 (configuration 23) to 202 seconds (configuration 3)
Figure 66 VCstartFCW duration presented as a function of FCW modality
Mean VCstartFCW durations observed during tests performed with seat belt pretensioner‐based FCW modalities ranged from 172 to 199 seconds for conditions 23 and 7 respectively These values overlapped the comparable (and nearly identical) range established during tests performed without seat belt pretensioner‐based FCW modalities from 178 to 202 seconds established during the conduct of conditions 12 and 3 The mean value of the trials performed with no FCW alert (191 seconds) resided within the ranges established by the trials performed with and without seat belt pretensioning The data shown in Figure 67 demonstrate good VCstartFCW consistency across each FCW modality regardless of whether the trials ultimately resulted in a crash or not and indicates the pre‐FCW alert driving behavior encouraged by the experimental design would not confound the analysis of crash outcome The mean VCstartFCW duration of the trials where the participants collided with the SLV (187 seconds) was nearly identical to that observed when the crash was avoided (189 seconds) differing by only 14 percent 64 Onset of FCW to End of Visual Commitment The data produced during this study indicate FCWVCend duration (ie response time) may be the most important time interval for determining the effectiveness of an FCW DVI If an FCW is
39
Figure 67 VCstartFCW duration presented as a function of FCW modality and crash outcome
capable of being detected acknowledged and correctly interpreted by the driver during the random number recall task used in this study the FCWVCend duration associated with that modality should be less than the time taken by a driver to return to their forward facing viewing position after simply completing the task Conceptually differences in FCWVCend should be in good agreement with the overall VC durations described earlier however the FCWVCend data are not vulnerable to the potentially confounding effect of VCstartFCW duration variability For this reason the FCWVCend metric is preferred for quantifying response time 641 General FCW to VCend Response Time Observations Figure 68 presents the distribution of FCWVCend durations observed for each FCW modality Overall these values ranged from 270 ms to 174 seconds The mean values for each FCW modality ranged from 593 ms to 149 seconds overall for configurations 18 and 3 respectively
Figure 68 FCWVCend duration presented as a function of FCW modality
40
Mean FCWVCend durations observed during tests performed with seat belt pretensioner‐based FCW modalities ranged from 593 ms to 104 seconds for conditions 18 and 7 respectively These values overlapped the comparable range of means established during tests performed without seat belt pretensioner‐based FCW modalities from 114 to 149 seconds recorded for conditions 12 and 3 respectively The mean value of the trials performed with no FCW alert (139 seconds) resided outside of the mean range established by the trials performed with seat belt pretensioning but within that observed without As expected the data shown in Figure 69 continue to indicate that shorter FCWVCend durations are closely associated with the ability of the participantsrsquo to avoid a crash The overall mean FCWVCend duration of the trials where the participants collided with the SLV was 1632 percent longer than that observed when the crash was avoided (124 seconds versus 470 ms)
Figure 69 FCWVCend duration presented as a function of FCW modality and crash outcome
642 Statistical Assessment of FCW to VCend Response Times Table 61 provides a summary of the data used to statistically compare the mean FCWVCend times shown in Figure 68 In this case the means associated with the FCW modality were found to be significantly different Typically the next step in this analysis would be to objectively rank with statistical significance the mean FCWVCend times in order from lowest (quickest response to the alert) to highest (slowest response to the alert) This was not possible because of the low number of subjects per condition (n) and because there are 28 possible unique pair‐wise comparisons between the eight different FCW alerts (8 nCr 2 = 28) Controlling the family‐wise error rate at alpha = 005 would have meant testing at alpha = 00528 or 000179 This would be particularly stringent given the low number of subjects To address the limitations imposed by the small sample size steps were taken to collapse across certain FCW modalities This process was intended to increase the number of samples per cell and to reduce the number of comparisons
41
Table 61 FCWVCend Comparison By Modality
Time from FCW to VCend (sec)
Condition Modality N Mean Std Dev Minimum Maximum Pr gt F
23 All 7 0840 0295 0400 1400
00002
3 Beep 8 1169 0373 0740 1740
12 BeepHUD 8 1051 0366 0540 1730
7 Belt 8 1035 0541 0400 1740
18 BeltBeep 8 0593 0359 0270 1200
13 BeltHUD 8 0743 0564 0330 1740
6 HUD 8 1491 0150 1270 1670
1 None 8 1390 0258 0930 1660
Subjective ranking of the mean FCWVCend times shown in Table 61 (ie sorting simply on FCWVCend magnitude) indicated HUD and no alert (none) had the slowest reaction times and were very close overall This seemed reasonable since the participants receiving the HUD alert were unable to detect its presentation when engaged in the random number recall task However to more objectively assess whether this assumption was correct (ie that HUD did not affect FCWVCend) the mean FCWVCend reaction times produced by four alert configurations containing HUD‐based alerts were compared to those produced by the comparable configurations without the HUD alert For example Belt only based reaction times were compared to the Belt + HUD reaction times Table 62 presents the results of this analysis and indicates the presence of the HUD did not significantly affect FCWVCend reaction times
Table 62 Testing the Effect of HUD on FCWVCend
Contrast DF Contrast SS Mean Square F Value Pr gt F
Compare Beep vs BeepHUD 1 005522500 005522500 037 05462
Compare BeltBeep vs All 1 022869000 022869000 153 02219
Compare Belt vs BeltHUD 1 034222500 034222500 228 01364
Compare None vs HUD 1 004100625 004100625 027 06029
Combining the comparable FCW alerts (with and without the HUD) shown in Table 62 provided four basic alert configurations As a courtesy to the reader these combinations were renamed and the convention used for the remainder of this report
Beep and BeepHUD Auditory
BeltBeep and All Auditory‐Haptic
Belt and BeltHUD Haptic
None and HUD None
42
Table 63 provides a statistical comparison of the mean FCWVCend reaction times for these four FCW configurations and indicates they were significantly different
Table 63 FCWVCend Comparison By Modality Collapsed
Time from FCW to VCend (sec) ndash Alerts With and Without HUD Combined
Modality N Mean Std Dev Minimum Maximum Pr gt F
Auditory 16 1110 0362 0540 1740
lt0001 Auditory‐Haptic 15 0708 0344 0270 1400
Haptic 16 0889 0555 0330 1740
None 16 1441 0210 0930 1670
With 15 to 16 samples per condition and only six possible unique pair‐wise comparisons between the four FCW alert configurations (4 nCr 2 = 6) it was possible to examine all pair‐wise comparisons and objectively rank mean FCWVCend reaction times The family‐wise error rate was again controlled at alpha = 005 meaning significant main effects would be less than alpha = 0056 or 000833 As indicated () in Table 64 three of these comparisons were significantly different
Table 64 FCWVCend Pair‐Wise Comparisons
Contrast DF Contrast SS Mean Square F Value Pr gt F
Compare Auditory vs Auditory‐Haptic 1 125112774 125112774 829 00055
Compare Auditory vs Haptic 1 039161250 039161250 259 01126
Compare Auditory vs None 1 087450313 087450313 579 00192
Compare Auditory‐Haptic vs Haptic 1 025293339 025293339 168 02005
Compare Auditory‐Haptic vs None 1 415540173 415540173 2753 lt0001
Compare Haptic vs None 1 243652813 243652813 1614 00002
Significant at the alpha = 000833 level
Table 65 presents the mean FCWVCend times previously shown in Table 63 sorted from quickest to slowest and an indication of where significant differences between configurations occurred In this table no mean was significantly different than an adjacent mean The significant differences exist at the extremes For example the mean FCWVCend times of the Auditory‐Haptic and Auditory only configurations were significantly different but the Auditory‐Haptic and Haptic only mean FCWVCend times were not
43
Table 65 Objective Ranking FCWVCend of Response Times
Rank of FCW to VCend (sec)
Relative Rank Modality MeanSignificant Differences
1 Auditory‐Haptic 0708 A B C
2 Haptic 0889 A B C
3 Auditory 1110 A B C
4 None 1441 A B C
Alert modalities with the same letter were not significantly different
The analysis presented in Table 66 indicates that on average women responded to the FCW configurations shown in Table 65 254 ms quicker than men and that this was a significant difference
Table 66 FCWVCend Response Times By Gender
Time from FCW to VCend (sec) ndash by Gender
Gender N Mean Std Dev Minimum Maximum Pr gt F
F 31 0913 0456 0330 1730 00294
M 32 1167 0451 0270 1740
Since both main effects evaluated in this section were significantly different the interaction term was examined for information‐purposes only Using a gender by FCW configuration model a significant interaction between gender and alert type was shown to exist The means from each gender by modality combination are shown in Table 67
Table 67 FCWVCend Response Times and Gender Interaction
Time from FCW to VCend (sec) ndash Modality by Gender
Modality Gender N Mean Std Dev Minimum Maximum Pr gt F
Auditory F 8 1001 0408 0540 1730
lt0001
M 8 1219 0295 0930 1740
Auditory‐Haptic F 7 0687 0335 0330 1200
M 8 0726 0374 0270 1400
Haptic F 8 0551 0302 0330 1070
M 8 1226 0555 0330 1740
None F 8 1383 0277 0930 1670
M 8 1499 0102 1330 1600
44
65 Time‐to‐Collision (TTC) at End of Visual Commitment In the previous section FCWVCend duration was mentioned as a good way to objectively quantify how quickly the participants responded to the various FCW alert modalities However once VCend had occurred knowing how the participants responded was also of interest To begin analysis of the participantsrsquo crash avoidance responses the TTC at VCend was considered This provided a way to describe how much time was available for the participants to avoid a collision with the SLV 651 General TTC at VCend Observations Figure 610 presents the distribution of TTC at VCend times observed in this study for each FCW modality Overall these values ranged from 319 ms to 187 seconds The mean values for each FCW modality ranged from 608 ms to 146 seconds overall for configurations 3 and 18 respectively
Figure 610 TTC at VCend presented as a function of FCW modality
The mean TTCs at VCend observed during tests performed with seat belt pretensioner‐based FCW modalities ranged from 103 to 146 seconds for conditions 7 and 18 respectively These values were outside of the comparable range of means recorded during tests performed without seat belt pretensioner‐based FCW modalities from 608 to 955 ms for conditions 3 and 12 respectively The mean TTC at VCend time observed when no FCW alert was presented (779 ms) was outside the mean range for tests performed with seat belt pretensioning but was inside the range defined by non‐pretensioner based trials Figures 65 and 69 presented previously indicated that VC duration adversely affected the likelihood that participants would avoid colliding with the SLV One benefit of the reduced VC duration is shown in Figure 611 the earlier VCend occurs the longer the TTC (assuming each subject uses a common vehicle speed) In other words the less time the driver spent with their eyes away from the road the more time they had available to decide on an appropriate
45
crash avoidance countermeasure Based on the data shown in Figure 611 the overall mean TTC at VCend of the trials resulting in a collision with the SLV was 908 percent shorter than that observed when the crash was avoided (837 ms versus 160 seconds)
Figure 611 TTC at VCend presented as a function of FCW modality and crash outcome
652 Statistical Assessment of TTC at VCend The statistical analysis provided in Section 64 demonstrated that the mean FCWVCend reaction times of ldquocomparablerdquo FCW alerts (with and without the HUD) can be combined Since TTC at VCend is based on the same VCend data used in this previous analysis (they have the same units but consider different intervals) re‐testing the validity of combining data in this manner was not necessary Table 68 provides a summary of the data used to statistically compare the mean TTC at VCend times shown in Figure 610 The results show the means of these four FCW configurations were significantly different which was consistent with the previous analyses
Table 68 TTC at VCend Comparison By Modality Collapsed
TTC at VCend (sec) ndash Alerts With and Without HUD Combined
Modality N Mean Std Dev Minimum Maximum Pr gt F
Auditory 16 0929 0359 0384 1501
00002 Auditory‐Haptic 15 1338 0351 0689 1872
Haptic 16 1181 0567 0319 1844
None 16 0693 0284 0357 1384
The six possible pair‐wise comparisons between the four FCW configurations were examined and the FCW alert modalities ranked Family‐wise error rate was controlled at alpha = 005 meaning significant main effects were less than alpha = 0056 or 000833 The results show that three of these comparisons were significantly different as indicated () in Table 69
46
Table 69 TTC at VCend Pair‐Wise Comparisons
Contrast DF Contrast SS Mean Square F Value Pr gt F
Compare Auditory vs Auditory‐Haptic 1 129613441 129613441 788 00067
Compare Auditory vs Haptic 1 050828403 050828403 309 00839
Compare Auditory vs None 1 044203503 044203503 269 01064
Compare Auditory‐Haptic vs Haptic 1 019108428 019108428 116 02853
Compare Auditory‐Haptic vs None 1 321314492 321314492 1955 lt0001
Compare Haptic vs None 1 189832612 189832612 1155 00012
Significant at the alpha = 000833 level
Table 610 presents the mean TTC at VCend times previously shown in Table 68 sorted from longest (best) to shortest (worse) and an indication of where significant differences between configurations occurred Like the findings discussed in Section 64 no mean was significantly different than an adjacent mean in Table 65 the significant differences existed at the extremes
Table 610 Objective Ranking of TTC at VCend
Rank of TTC at VCend (sec)
Relative Rank Modality MeanSignificant Differences
1 Auditory‐Haptic 1338 A B C
2 Haptic 1181 A B C
3 Auditory 0929 A B C
4 None 0693 A B C
Alert modalities with the same letter were not significantly different
The analysis presented in Table 611 indicates that because they responded to the FCW alert faster the mean TTC at VCend for the female participants was 287ms longer than that recorded for the males This was a significant difference
Table 611 TTC at VCend By Gender
TTC at VCend (sec) ndash by Gender
Gender N Mean Std Dev Minimum Maximum Pr gt F
F 31 1176 0441 0357 1774 00132
M 32 0889 0451 0319 1872
Since both main effects evaluated in this section were significantly different the interaction term was examined for information‐purposes only Using a gender by FCW configuration
47
model a significant interaction between gender and alert type was shown to exist The means from each gender by modality combination are shown in Table 612
Table 612 TTC at VCend and Gender Interaction
TTC at VCend (sec) ndash Modality by Gender
Modality Gender N Mean Std Dev Minimum Maximum Pr gt F
Auditory F 8 1073 0420 0384 1501
lt0001
M 8 0784 0229 0430 1120
Auditory‐Haptic F 7 1349 0347 0834 1729
M 8 1328 0379 0689 1872
Haptic F 8 1512 0295 1039 1774
M 8 0850 0593 0319 1844
None F 8 0793 0360 0357 1384
M 8 0594 0144 0378 0755
66 Throttle Release Response Time Acknowledgement of a SLV directly in the path of their vehicle occurred shortly after participants returned their view to a forward‐looking position From this point eight crash avoidance responses were possible ranging from nothing (ie no avoidance was attempted) to the various combinations of throttle release braking and steering An overall summary of these responses is provided in Table 613 In 59 of the 64 trials (922 percent) participants fully released the throttle as part of their crash avoidance response
Table 613 Crash Avoidance Response Summary (n=64)
Crash Avoidance Response of Participants
Crash Avoid Total
No Response 3 ‐‐ 3
Throttle Release Only 3 ‐‐ 3
Braking Only 1 ‐‐ 1
Steering Only ‐‐ 1 1
Throttle Release Braking 14 1 15
Throttle Release Steering 1 ‐‐ 1
Braking and Steering ‐‐ ‐‐ ‐‐
Throttle Release Braking Steering 25 15 40
During an attempt to release the throttle and apply the brakes one participant was unable to fully release the throttle before crashing into the SLV
48
661 General Throttle Release Time Observations 6611 Onset of FCW to Throttle Release Time Figure 612 presents the distribution of throttle release times measured from the onset of the FCW alert for each FCW modality Overall these values ranged from 260 ms to 205 seconds The mean values for each FCW modality ranged from 896 ms to 188 seconds overall for configurations 13 and 3 respectively The mean throttle release times from the onset of the seat belt pretensioner‐based FCW modalities ranged from 896 ms to 116 seconds for conditions 13 and 7 respectively The range of these values was outside of the comparable range of means recorded during tests performed without seat belt pretensioner‐based FCW modalities from 136 to 188 seconds for conditions 12 and 3 respectively The mean throttle release time observed when no FCW alert was presented (169 seconds) was outside the mean range for tests performed with seat belt pretensioning but was inside the range defined by pretensioner‐based trials
Figure 612 Throttle release times presented as a function of FCW modality
Given that most participants released the throttle shortly after VCend9 it is not surprising that
the throttle release data shown in Figure 613 closely resembles the FCWVCend duration data previously presented in Figure 65 both figures use the onset of FCW as the reference by which duration (Figure 65) or release time (Figure 613) was calculated The overall mean throttle release time of the trials where the participants collided with the SLV was 1173 percent longer than that observed when the crash was avoided (153 seconds versus 705 ms)
9 Three participants fully released the throttle before the FCW alert was presented Although it is unclear whether this was in response to being committed to the random number recall task or being used as an attempt to maintain the desired headway to the moving lead vehicle the throttle release was certainly not part of the participantsrsquo respective avoidance responses For this reason these three release times have been omitted from the throttle drop based charts and analyses discussed in this section so as to provide a more accurate portrayal of the relevant throttle‐brake phasing
49
Figure 613 Throttle release times presented as a function of FCW modality and crash outcome
6612 End of Visual Commitment to Throttle Release Time To better understand whether FCW modality affected the response time from VCend to the onset of throttle release the reaction time from FCW onset to VCend was removed from the data summarized in Section 661 Figure 614 presents the distribution of throttle release times measured from VCend for each FCW modality Overall these values ranged from ‐530 to 560 ms The mean values for each FCW modality ranged from 241 to 389 ms overall for configurations 7 and 13 respectively
Figure 614 Throttle release times presented from VCend as function of FCW modality and crash outcome
The negative release times shown in Figure 614 indicate some participants released the throttle before returning to a forward‐facing viewing position and do not include data from the three trials where the participants were not on the throttle at the time the FCW alert was presented (as previously mentioned in Section 6611) Not considering these data a total of four participants released throttle before VCend with response times of ‐115 ‐195 ‐210 and ‐530 ms These participants released the throttle 270 to 805 ms after receiving their respective
50
FCW alerts (for configurations 13 6 7 and 23 respectively) Note that three of these alerts were inclusive of the seat belt pretensioner The mean throttle release times associated with the seat belt pretensioner‐based FCW modalities (from VCend) ranged from 241 to 387 ms for conditions 7 and 18 respectively The range of these values overlapped the comparable range of means recorded during tests performed without seat belt pretensioner‐based FCW modalities from 269 to 389 ms for by conditions 6 and 3 respectively The mean throttle release time observed when no FCW alert was presented (328 ms) was inside the mean ranges for trials performed with and without seat belt pretensioning Figure 615 presents the data previously shown in Figure 614 but separated as a function of crash outcome Overall these data imply that while FCW modality can affect the driverrsquos response time from FCW onset to VCend it does not appear to affect the time taken from VCend to initiation of the throttle release This is discussed in greater detail in Section 6622
Figure 615 Throttle release times presented from VCend as function of FCW modality and crash outcome
662 Statistical Assessment of Throttle Release Times In this section two analyses of throttle release time are provided First mean release times from FCW alert onset are discussed In the second analysis release times from VCend are considered 6621 Throttle Release from FCW Onset In Section 64 an analysis was performed to verify that results from trials performed with FCW alerts differing only by the presence of a HUD could be combined In this section the process used in Section 64 was repeated because the data analyzed was produced after VCend (ie the throttle was released after the driver had returned their view to a forward‐facing position This was a concern because of the HUD‐based alert duration in every case where it was used it remained on for 23 to 37 seconds after VCend Therefore while the HUD was not detectable
51
by participants engaged in the random number recall task participants did have an opportunity to notice and respond to the HUD shortly after task completion (but before crashing into the SLV) Had this occurred time to throttle release brake application andor to avoidance steering may have been affected Table 614 provides a summary of the data used to statistically compare the mean throttle release times shown in Figure 612 The results show the means of these eight FCW modalities were significantly different
Table 614 Throttle Release Response Time from FCW Onset
Time from FCW to Throttle Release (sec)
Condition Modality N Mean Std Dev Minimum Maximum Pr gt F
23 All 8 1061 0424 0270 1730
00002
3 Beep 8 1438 0419 0805 2050
12 BeepHUD 8 1361 0377 0825 2020
7 Belt 5 1163 0609 0260 1740
18 BeltBeep 8 0979 0345 0615 1510
13 BeltHUD 6 0896 0571 0285 1720
6 HUD 8 1880 0098 1740 2020
1 None 5 1686 0262 1365 1915
Pair‐wise comparisons were made between the four FCW modalities not inclusive of the HUD with the corresponding configurations that were The results shown in Table 615 indicate the mean throttle release times of comparable alerts were not significantly different
Table 615 Testing the Effect of HUD on Throttle Release Time from FCW Onset
Contrast DF Contrast SS Mean Square F Value Pr gt F
Compare Beep vs BeepHUD 1 002325625 002325625 014 07064
Compare BeltBeep vs All 1 002681406 002681406 017 06859
Compare Belt vs BeltHUD 1 019466735 019466735 120 02784
Compare None vs HUD 1 011580308 011580308 071 04020
Table 616 provides a summary of the paired data used to statistically compare the mean throttle release times associated with the four combined FCW modalities The results show the means were significantly different which is consistent with the first analysis discussed in this section
52
Table 616 Throttle Release Time from FCW Onset Comparison By Modality Collapsed
FCW to Throttle Release (sec) ndash Alerts With and Without HUD Combined
Modality N Mean Std Dev Minimum Maximum Pr gt F
Auditory 16 1399 0387 0805 2050
lt0001 Auditory‐Haptic 15 1020 0376 0270 1730
Haptic 16 1017 0575 0260 1740
None 16 1805 0195 1365 2020
Six possible pair‐wise comparisons between the four FCW‐alert combinations were examined and the FCW alert modalities ranked Family‐wise error rate was controlled at alpha = 005 meaning significant main effects would be less than alpha = 0056 or 000833 The results show that three of these comparisons were significantly different they are marked with an () in Table 617
Table 617 Throttle Release Time from FCW Onset Pair‐Wise Comparisons
Contrast DF Contrast SS Mean Square F Value Pr gt F
Compare Auditory vs Auditory‐Haptic 1 114950703 114950703 735 00091
Compare Auditory vs Haptic 1 095171770 095171770 608 00170
Compare Auditory vs None 1 118232800 118232800 756 00082
Compare Auditory‐Haptic vs Haptic 1 000006023 000006023 000 09844
Compare Auditory‐Haptic vs None 1 442063280 442063280 2825 lt0001
Compare Haptic vs None 1 370084207 370084207 2365 lt0001
Significant at the alpha = 000833 level
Table 618 presents the mean throttle release times previously shown in Table 616 sorted from lowest (best) to highest (worse) and an indication of where significant differences between modalities occurred
Table 618 Objective Ranking of Throttle Release Time from FCW Onset
Rank of FCW to Throttle Release (sec)
Relative Rank
Modality MeanSignificant Differences
1 Haptic 1017 A B C
2 Auditory‐Haptic 1020 A B C
3 Auditory 1399 A B C
4 None 1805 A B C
Alert modalities with the same letter were not significantly different
53
The analysis presented in Table 619 indicates that there was no significant difference between the mean throttle release times from FCW onset for the male and female participants
Table 619 Throttle Release Time from FCW Onset by Gender
FCW to Throttle Release (sec) ndash by Gender
Gender N Mean Std Dev Minimum Maximum Pr gt F
F 30 1231 0501 0260 2020 02062
M 26 1402 0492 0270 2050
Since one of the main effects evaluated in this section was significantly different the interaction term was examined for information‐purposes only Using a gender by FCW configuration model a significant interaction between gender and alert type was shown to exist The means from each gender by modality combination are shown in Table 620
Table 620 Throttle Release Time from FCW Onset and Gender Interaction
FCW to Throttle Release (sec) ndash Modality by Gender
Modality Gender N Mean Std Dev Minimum Maximum Pr gt F
Auditory F 8 1331 0384 0825 2020
lt0001
M 8 1468 0404 0805 2050
Auditory‐Haptic F 8 1070 0271 0805 1510
M 8 0971 0473 0270 1730
Haptic F 7 0761 0491 0260 1405
M 4 1466 0445 0805 1740
None F 7 1772 0259 1365 2020
M 6 1844 0090 1740 1960
6622 Throttle Release from End of Visual Commitment Table 621 provides a summary of the data used to statistically compare the mean throttle release times from VCend shown in Figure 614 The results show the means of these eight FCW configurations were not significantly different indicating the significant release time differences described in Section 6621 were the result of the significant differences in FCWVCend durations discussed in Section 64
54
Table 621 Throttle Release Response Time from VCend
Time from VCend to Throttle Release (sec)
Condition Modality Mean Std Dev Minimum Maximum Pr gt F
23 All 0246 0343 ‐0530 0405
06703
3 Beep 0269 0194 ‐0195 0405
12 BeepHUD 0310 0068 0170 0380
7 Belt 0241 0262 ‐0210 0445
18 BeltBeep 0387 0084 0245 0500
13 BeltHUD 0263 0252 ‐0115 0475
6 HUD 0389 0080 0280 0560
1 None 0328 0066 0255 0435
Pair‐wise comparisons were made between the four FCW configurations not based on the HUD with the corresponding configurations that were The results shown in Table 622 indicate the mean throttle release times from VCend of comparable alerts were not significantly different
Table 622 Testing the Effect of HUD on Throttle Release Time from VCend
Contrast DF Contrast SS Mean Square F Value Pr gt F
Compare Beep vs BeepHUD 1 000680625 000680625 019 06669
Compare BeltBeep vs All 1 007439170 007439170 205 01588
Compare Belt vs BeltHUD 1 000126068 000126068 003 08529
Compare None vs HUD 1 001135558 001135558 031 05786
Table 623 provides a summary of the paired data used to statistically compare the mean throttle release times from VCend associated with the four combined FCW configurations The results show the means were not significantly different which is consistent with the first analysis discussed in this section
Table 623 Throttle Release Time from VCend Comparison By Modality Collapsed
VCend to Throttle Release (sec) ndash Alerts With and Without HUD Combined
Modality N Mean Std Dev Minimum Maximum Pr gt F
Auditory 16 0289 0142 ‐0195 0405
05007 Auditory‐Haptic 15 0321 0244 ‐0530 0500
Haptic 11 0253 0244 ‐0210 0475
None 13 0365 0078 0255 0560
The analysis presented in Table 624 indicates that there was no significant difference between the mean throttle release times from VCend for the male and female participants
55
Table 624 Throttle Release Time from VCend by Gender
VCend to Throttle Release (sec) ndash by Gender
Gender N Mean Std Dev Minimum Maximum Pr gt F
F 29 0325 0169 ‐0210 0560 04977
M 26 0290 0207 ‐0530 0475
67 Brake Application Response Time In 56 of the 64 trials (875 percent) participants applied force to the brake pedal as part of their crash avoidance response In 40 of these 56 instances (714 percent) the participants also used steering during their respective avoidance responses In 11 of 40 trials (275 percent) participants began braking before steering Steering preceded braking during 28 of 40 trials (700 percent) A simultaneous input of braking and steering was observed during one trial (25 percent) A summary of these data are shown in Table 625
Table 625 Brake Steer Response Summary (n=40)
Crash Avoidance Response of Participants
Crash Avoid Total
Brake Steer 3 7 11
Steer Brake 21 7 28
Simultaneous Inputs (Brake and Steer) ‐‐ 1 1
671 General Brake Application Response Time Observations 6711 Onset of FCW to Brake Application Response Time Figure 616 presents the distribution of brake application response times measured from the onset of the FCW alert for each FCW modality Overall these values ranged from 700 ms to 220 seconds The mean values for each FCW modality ranged from 109 to 200 seconds overall for configurations 18 and 3 respectively The mean brake application times from the onset of the seat belt pretensioner‐based FCW modalities ranged 109 to 1436 seconds for conditions 18 and 7 respectively The range of these values was just outside of the comparable range of means recorded during tests performed without seat belt pretensioner‐based FCW modalities from 1437 to 200 seconds for conditions 12 and 3 respectively The mean brake application time observed when no FCW alert was presented (180 seconds) was outside the mean range for tests performed with seat belt pretensioning but was inside the range defined by pretensioner‐based trials Recalling the data previously presented in Table 61 in each of the 55 instances where the avoidance responses included braking a throttle release always preceded the brake application When brake applications were used the inputs were applied 265 to 630 ms after
56
VCend (as described in Section 6712) and 40 to 795 ms after the throttle was fully released10 Mean reaction times from VCend and throttle release were 464 and 167 ms respectively11
Figure 616 Brake application times presented as a function of FCW modality
Given the close proximity of the brake application to VCend and the time of throttle release it is not surprising that presentation of the brake application data shown in Figure 617 closely resembles the FCWVCend duration and FCWthrottle release time data previously presented in Figures 69 and 613 respectively
Figure 617 Brake application times presented as a function of FCW modality and crash outcome
10 During an attempt to release the throttle and apply the brakes one participant was unable to fully release the throttle This attempt was classified as ldquoBraking Onlyrdquo in Table 613 11 Three participants fully released the throttle before the FCW alert was presented Although it is unclear whether this was in response to being committed to the random number recall task or being used as an attempt to maintain the desired headway to the moving lead vehicle the throttle release was certainly not part of the participantsrsquo respective avoidance responses For this reason these three release times have been omitted from the throttle drop based charts and analyses discussed in this section so as to provide a more accurate portrayal of the relevant throttle‐steer phasing
57
The overall mean brake application time of the trials where the participants collided with the SLV was 745 percent longer than that observed when the crash was avoided (165 seconds versus 945 ms) 6712 End of Visual Commitment to Brake Application Response Time To better understand whether FCW modality affected the response time from VCend to the onset of brake application the reaction time from FCW onset to VCend was removed from the data summarized in Section 671 Figure 618 presents the distribution of brake application response times measured from VCend for each FCW modality Overall these values ranged from 265 to 630 ms The mean values for each FCW modality ranged from 407 to 524 ms overall for configurations 12 and 3 respectively
Figure 618 Brake application times presented from VCend as function of FCW modality
The mean brake application times associated with the seat belt pretensioner‐based FCW modalities (from VCend) ranged from 459 to 496 ms for conditions 23 and 13 respectively The range of these values was entirely within the comparable range of means recorded during tests performed without seat belt pretensioner‐based FCW modalities from 407 to 524 ms for by conditions 12 and 3 respectively The mean brake application time observed when no FCW alert was presented (442 ms) was inside the mean range for tests performed without seat belt pretensioning but was just outside the range defined by pretensioner‐based trials Figure 619 presents the data previously shown in Figure 618 but separated as a function of crash outcome Overall these data imply that while FCW modality can affect the driverrsquos response time from FCW onset to VCend it does not appear to affect the time taken from VCend to initiation of the brake application This is discussed in greater detail in Section 6722
58
Figure 619 Brake application times presented from VCend as function of FCW modality and crash outcome
672 Statistical Assessment of Brake Application Response Times In a manner consistent with that used to discuss the statistical significance of throttle release time this section provides two analyses of brake application response time First mean application times from FCW alert onset are discussed In the second analysis application times from VCend are considered 6721 Brake Application Time from FCW Onset Table 626 provides a summary of the data used to statistically compare the mean FCW to brake application times shown in Figure 616 The results show the means of these eight FCW configurations were significantly different
Table 626 Brake Application Time from FCW Onset
Time from FCW to Brake Application (sec)
Condition Modality N Mean Std Dev Minimum Maximum Pr gt F
23 All 8 1263 0320 0750 1825
00002
3 Beep 8 1598 0351 1260 2140
12 BeepHUD 7 1437 0384 0905 2070
7 Belt 7 1436 0489 0895 2070
18 BeltBeep 8 1087 0362 0700 1645
13 BeltHUD 6 1129 0428 0775 1795
6 HUD 5 2002 0129 1840 2195
1 None 7 1802 0207 1475 2000
Pair‐wise comparisons were made between the four FCW configurations not inclusive of the HUD with the corresponding configurations that were The results shown in Table 627
59
indicate the mean FCW to brake application times of comparable alerts were not significantly different
Table 627 Testing the Effect of HUD on Brake Application Time from FCW Onset
Contrast DF Contrast SS Mean Square F Value Pr gt F
Compare Beep vs BeepHUD 1 009600048 009600048 076 03872
Compare BeltBeep vs All 1 012425625 012425625 099 03258
Compare Belt vs BeltHUD 1 030501653 030501653 242 01264
Compare None vs HUD 1 011650006 011650006 092 03413
Table 628 provides a summary of the paired data used to statistically compare the mean brake application times associated with the four combined FCW configurations The results show the means were significantly different which is consistent with the first analysis discussed in this section
Table 628 Brake Application Time from FCW Onset Comparison By Modality Collapsed
FCW to Brake Application (sec) ndash Alerts With and Without HUD Combined
Modality N Mean Std Dev Minimum Maximum Pr gt F
Auditory 15 1523 0363 0905 2140
lt0001 Auditory‐Haptic 16 1175 0342 0700 1825
Haptic 13 1295 0470 0775 2070
None 12 1885 0200 1475 2195
Six possible pair‐wise comparisons between the four FCW‐alert combinations were examined and the FCW alert modalities ranked Family‐wise error rate was controlled at alpha = 005 meaning significant main effects would be less than alpha = 0056 or 000833 The results show that two of these comparisons were significantly different they are marked with an () in Table 629
Table 629 Brake Application Time from FCW Onset Pair‐Wise Comparisons
Contrast DF Contrast SS Mean Square F Value Pr gt F
Compare Auditory vs Auditory‐Haptic 1 093578409 093578409 727 00094
Compare Auditory vs Haptic 1 036219430 036219430 281 00995
Compare Auditory vs None 1 087725042 087725042 681 00118
Compare Auditory‐Haptic vs Haptic 1 010262175 010262175 080 03761
Compare Auditory‐Haptic vs None 1 346074405 346074405 2688 lt0001
Compare Haptic vs None 1 217804801 217804801 1692 00001
Significant at the alpha = 000833 level
60
Table 630 presents the mean FCW to brake application times previously shown in Table 628 sorted from lowest (best) to highest (worse) and an indication of where significant differences between configurations occurred
Table 630 Objective Ranking of Brake Application Time from FCW Onset
Rank of FCW to Brake Application (sec)
Relative Rank
Modality MeanSignificantDifferences
1 Auditory‐Haptic 1175 A B C
2 Haptic 1295 A B C
3 Auditory 1523 A B C
4 None 1885 A B C
Alert modalities with the same letter were not significantly different
The analysis presented in Table 631 indicates that there was no significant difference between the mean throttle release times from FCW onset for the male and female participants
Table 631 Brake Application Time from FCW Onset by Gender
FCW to Brake Application (sec) ndash by Gender
Gender N Mean Std Dev Minimum Maximum Pr gt F
F 30 1360 0407 0775 2195 01047
M 26 1550 0458 0700 2140
Since one of the main effects evaluated in this section was significantly different the interaction term was examined for information‐purposes only Using a gender by FCW‐alert combination model a significant interaction between gender and modality was shown to exist The means from each gender by modality combination are shown in the Table 632
Table 632 Brake Application Time from FCW Onset and Gender Interaction
FCW to Brake Application (sec) ndash Modality by Gender
Modality Gender N Mean Std Dev Minimum Maximum Pr gt F
Auditory F 8 1428 0377 0905 2070
lt0001
M 7 1631 0338 1320 2140
Auditory‐Haptic F 8 1234 0262 0930 1645
M 8 1116 0418 0700 1825
Haptic F 8 1056 0302 0775 1540
M 5 1677 0455 0895 2070
None F 6 1842 0282 1475 2195
M 6 1929 0061 1840 1995
61
6722 Brake Application Time from End of Visual Commitment Table 633 provides a summary of the data used to statistically compare the mean brake application times from VCend shown in Figure 618 The results show the means of these eight FCW configurations were not significantly different indicating the significant application time differences described in Section 6721 were the result of the significant differences in the FCWVCend durations discussed in Section 64
Table 633 Brake Application Time from VCend
Time from VCend to Brake Application (sec)
Condition Modality Mean Std Dev Minimum Maximum Pr gt F
23 All 0459 0092 0265 0535
01205
3 Beep 0429 0059 0340 0525
12 BeepHUD 0407 0057 0340 0490
7 Belt 0472 0083 0330 0575
18 BeltBeep 0494 0093 0355 0630
13 BeltHUD 0496 0076 0395 0580
6 HUD 0524 0044 0455 0560
1 None 0442 0068 0340 0545
Pair‐wise comparisons were made between the four FCW configurations not based on the HUD with the corresponding configurations that were The results shown in Table 634 indicate the VCend to brake application times of comparable alerts were not significantly different
Table 634 Testing the Effect of HUD on Brake Application Time from VCend
Contrast DF Contrast SS Mean Square F Value Pr gt F
Compare Beep vs BeepHUD 1 000174298 000174298 031 05778
Compare BeltBeep vs All 1 000478574 000478574 086 03577
Compare Belt vs BeltHUD 1 000181323 000181323 033 05702
Compare None vs HUD 1 001954339 001954339 352 00667
Table 635 provides a summary of the paired data used to statistically compare the mean VCend to brake application times associated with the four combined FCW configurations The results show the means were not significantly different which is consistent with the first analysis discussed in this section The analysis presented in Table 636 indicates that following VCend male participants applied force to the brake pedal an average of 50 ms quicker than the females This was a marginally significant difference
62
Table 635 Brake Application Time from VCend Comparison By Modality Collapsed
VCend to Brake Application (sec) ndash Alerts With and Without HUD Combined
Modality N Mean Std Dev Minimum Maximum Pr gt F
Auditory 15 0419 0057 0340 0525
00825 Auditory‐Haptic 15 0478 0091 0265 0630
Haptic 13 0483 0077 0330 0580
None 12 0476 0071 0340 0560
Table 636 Brake Application Time from VCend by Gender
VCend to Brake Application (sec) ndash by Gender
Gender N Mean Std Dev Minimum Maximum Pr gt F
F 29 0486 0074 0340 0630 00153
M 26 0436 0074 0265 0565
Since one of the main effects evaluated in this section was significantly different the interaction term was examined for information‐purposes only Using a gender by FCW configuration model a significant interaction between gender and alert type was shown to exist The means from each gender by modality combination are shown in Table 637
Table 637 Brake Application Time from VCend and Gender Interaction
VCend to Brake Application (sec) ndash Modality by Gender
Modality Gender N Mean Std Dev Minimum Maximum Pr gt F
Auditory F 8 0426 0063 0340 0525
00228
M 7 0410 0053 0340 0490
Auditory‐Haptic F 7 0533 0064 0445 0630
M 8 0429 0086 0265 0530
Haptic F 8 0504 0054 0445 0580
M 5 0449 0102 0330 0565
None F 6 0488 0084 0340 0560
M 6 0464 0060 0395 0560
68 Avoidance Steer Response Time In 42 of the 64 trials (656 percent) participants used steering inputs as part of their crash avoidance response During 40 of 42 trials (952 percent) these responses also included braking In 33 of the 42 trials with steering (786 percent) the participantsrsquo primary avoidance attempt was to the left of the SLV (ie following the path of the MLV around the SLV) A direction of steer response summary is shown in Table 638
63
Table 638 Direction of Steer Summary (n=42)
Crash Avoidance Response
of Participants
Left Steer Right Steer
Crash Avoid Total Crash Avoid Total
Steering Only ‐‐ 1 1 ‐‐ ‐‐ ‐‐
Throttle Release and Steering 1 ‐‐ 1 ‐‐ ‐‐ ‐‐
Brake Steer 3 6 9 1 1 2
Steer Brake 17 3 21 3 4 7
Simultaneous Inputs (Brake and Steer) ‐‐ 1 1 ‐‐ ‐‐ ‐‐
Overall 33 9
681 General Avoidance Steer Response Time Observations 6811 Onset of FCW to Avoidance Steering Input Figure 620 presents the distribution of avoidance steer response times measured from the onset of the FCW alert for each FCW modality Overall these values ranged from 635 ms to 214 seconds The mean values for each FCW modality ranged from 960 ms to 180 seconds overall for configurations 13 and 3 respectively
Figure 620 Avoidance steer response times presented as a function of FCW modality
The range of mean avoidance steer response times from the onset of the seat belt pretensioner‐based FCW modalities ranged 960 ms to 130 seconds for conditions 13 and 23 respectively The range of these values overlapped that of the comparable range of means recorded during tests performed without seat belt pretensioner‐based FCW modalities from 124 to 180 seconds for conditions 12 and 3 respectively The mean avoidance steer time observed when no FCW alert was presented (173 seconds) was outside the mean range for tests performed with seat belt pretensioning but was inside the range defined by pretensioner‐based trials
64
For the 42 of the 64 participants who used steering inputs the initiation of these inputs occurred 85 to 690 ms after VCend (described in greater detail in Section 682) with a mean gap time of 395 ms Unlike the trend observed when evaluating the relationship of throttle release and brake application not all participants released the throttle before initiating their avoidance steer inputs For 15 trials initiation of steering preceded release of the throttle by 5 to 315 ms with a mean gap time of 69 ms For 23 trials12 initiation of steering occurred 5 to 950 ms after the throttle was fully released with a mean gap time of 195 ms Figure 621 presents the distribution of avoidance steer response times presented as a function of FCW modality and crash outcome Given the close proximity of the avoidance steer initiation to VCend and the time of throttle release it is not surprising that presentation of the steering response time data shown in Figure 619 closely resembles the FCWVCend duration FCWthrottle release time and FCWbrake application time data previously presented in Figures 69 613 and 617 respectively The overall mean avoidance steer response time of the trials where the participants collided with the SLV was 663 percent longer than that observed when the crash was avoided (156 seconds versus 939 ms)
Figure 621 Avoidance steer response times presented as a function of FCW modality and crash outcome
6812 End of Visual Commitment to An Avoidance Steering Input To better understand whether FCW modality affected the response time from VCend to the onset of avoidance steering the reaction time from FCWVCend was removed from the data summarized in Section 681 Figure 622 presents the distribution of avoidance steer response times measured from the VCend for each FCW modality Overall these values ranged from 85 to
12 Three participants fully released the throttle before the FCW alert was presented Although it is unclear whether this was in response to being committed to the random number recall task or being used as an attempt to maintain the desired headway to the moving lead vehicle the throttle release was certainly not part of the participantsrsquo respective avoidance responses For this reason these three release times have been omitted from the throttle drop based charts and analyses discussed in this section so as to provide a more accurate portrayal of the relevant throttle‐steer phasing
65
690 ms The mean values for each FCW modality ranged from 344 to 467 ms overall for configurations 23 and 7 respectively
Figure 622 Avoidance steer response times presented from VCend as function of FCW modality and crash outcome
The mean avoidance steer times associated with the seat belt pretensioner‐based FCW modalities (from VCend) ranged from 344 to 467 ms for conditions 23 and 7 respectively The range of these values completely contained the comparable range of means recorded during tests performed without seat belt pretensioner‐based FCW modalities from 348 to 369 for conditions 3 and 6 respectively The mean brake application time observed when no FCW alert was presented (415 ms) was also inside the mean range for tests performed with seat belt pretensioner‐based alerts but was outside the range defined by trials without pretensioning Figure 623 presents the data previously shown in Figure 622 but separated as a function of crash outcome These data imply that while FCW modality significantly affected the participantsrsquo FCWVCend mean response times it does not appear to affect the time taken from VCend to initiation of the avoidance steer
Figure 623 Avoidance steer response times presented from VCend as function of FCW modality and crash outcome
66
682 Statistical Assessment of Avoidance Steer Response Times In a manner consistent with that used to discuss the statistical significance of throttle release and brake application times this section provides two analyses of avoidance steer response time First mean response times from FCW alert onset are discussed In the second analysis response times from VCend are considered 6821 Onset of FCW to Avoidance Steer Response Time Table 639 provides a summary of the data used to statistically compare the mean FCW to avoidance steer response times shown in Figure 620 The results show the means of these eight FCW configurations were significantly different
Table 639 Avoidance Steer Response Time from FCW Onset
Time from FCW to Steering Input (sec)
Condition Modality Mean Std Dev Minimum Maximum Pr gt F
23 All 1300 0251 0955 1715
00006
3 Beep 1533 0408 1140 2135
12 BeepHUD 1235 0299 0815 1565
7 Belt 1255 0325 0975 1635
18 BeltBeep 1007 0417 0635 1570
13 BeltHUD 0960 0358 0740 1680
6 HUD 1800 0124 1660 1955
1 None 1733 0147 1550 1875
Pair‐wise comparisons were made between the four FCW configurations not inclusive of the HUD with the corresponding configurations that were The results shown in Table 640 indicate the mean FCW to avoidance steer response times of comparable alerts were not significantly different
Table 640 Testing the Effect of HUD on Avoidance Steer Response Time from FCW Onset
Contrast DF Contrast SS Mean Square F Value Pr gt F
Compare Beep vs BeepHUD 1 022201000 022201000 222 01456
Compare BeltBeep vs All 1 025813333 025813333 258 01176
Compare Belt vs BeltHUD 1 023734091 023734091 237 01329
Compare None vs HUD 1 001012500 001012500 010 07524
67
Table 641 provides a summary of the paired data used to statistically compare the mean avoidance steer response times associated with the four combined FCW configurations The results show the means were significantly different which is consistent with the first analysis discussed in this section
Table 641 Avoidance Steer Response Time from FCW Onset Comparison By Modality Collapsed
FCW to Steering Input (sec) ndash Alerts With and Without HUD Combined
Modality N Mean Std Dev Minimum Maximum Pr gt F
Auditory 10 1384 0372 0815 2135
00002 Auditory‐Haptic 12 1153 0362 0635 1715
Haptic 11 1094 0361 0740 1680
None 9 1770 0131 1550 1955
Six possible pair‐wise comparisons between the four FCW‐alert combinations were examined and the FCW alert modalities ranked Family‐wise error rate was controlled at alpha = 005 meaning significant main effects would be less than alpha = 0056 or 000833 The results show that two of these comparisons were significantly different they are marked with an () in Table 642
Table 642 Avoidance Steer Response Time from FCW Onset Pair‐Wise Comparisons
Contrast DF Contrast SS Mean Square F Value Pr gt F
Compare Auditory vs Auditory‐Haptic 1 029022061 029022061 267 01105
Compare Auditory vs Haptic 1 044024766 044024766 405 00513
Compare Auditory vs None 1 070577053 070577053 649 00150
Compare Auditory‐Haptic vs Haptic 1 002014242 002014242 019 06693
Compare Auditory‐Haptic vs None 1 195571429 195571429 1799 00001
Compare Haptic vs None 1 226142284 226142284 2080 lt0001
Significant at the alpha = 000833 level
Table 643 presents the mean FCW to avoidance steer response times previously shown in Table 641 sorted from lowest (best) to highest (worse) and an indication of where significant differences between configurations occurred The analysis presented in Table 644 indicates there was no significant difference between the mean avoidance steer response times from FCW onset for the male and female participants Since one of the main effects was significantly different the interaction term was examined for information‐purposes only Using a gender by FCW‐alert combination model a significant interaction between gender and modality was shown to exist The means from each gender by modality combination are shown in Table 645
68
Table 643 Objective Ranking of Avoidance Steer Response Time from FCW Onset
Rank of FCW to Steering Input (sec)
Relative Rank
Modality MeanSignificant Differences
1 Haptic 1094 A B C
2 Auditory‐Haptic 1153 A B C
3 Auditory 1384 A B C
4 None 1770 A B C
Alert modalities with the same letter were not significantly different
Table 644 Avoidance Steer Response Time from FCW Onset by Gender
FCW to Steering Input (sec) ndash by Gender
Gender N Mean Std Dev Minimum Maximum Pr gt F
F 21 1249 0386 0740 1955 02350
M 21 1401 0429 0635 2135
Table 645 Avoidance Steer Response Time from FCW Onset and Gender Interaction
FCW to Steering Input (sec) ndash Modality by Gender
Modality Gender N Mean Std Dev Minimum Maximum Pr gt F
Auditory F 6 1241 0323 0815 1680
00003
M 4 1599 0373 1280 2135
Auditory‐Haptic F 4 1198 0341 0865 1570
M 8 1131 0393 0635 1715
Haptic F 6 0894 0144 0740 1090
M 5 1334 0410 0860 1680
None F 5 1726 0153 1550 1955
M 4 1825 0085 1705 1895
6822 End of Visual Commitment to Avoidance Steer Response Time Table 646 provides a summary of the data used to statistically compare the mean avoidance steer response times from VCend shown in Figure 622 The results show the means of these eight FCW configurations were not significantly different indicating the significant release time differences described in Section 6821 were the result of the significant differences in FCWVCend duration discussed in Section 64
69
Table 646 Avoidance Steer Response Time from VCend
Time from VCend to Steering Input (sec)
Condition Modality Mean Std Dev Minimum Maximum Pr gt F
23 All 0344 0173 0085 0560
06980
3 Beep 0369 0051 0280 0400
12 BeepHUD 0367 0063 0275 0445
7 Belt 0467 0189 0240 0690
18 BeltBeep 0418 0118 0250 0570
13 BeltHUD 0427 0100 0280 0585
6 HUD 0348 0041 0295 0390
1 None 0415 0147 0275 0620
Pair‐wise comparisons were made between the four FCW configurations not inclusive of the HUD with the corresponding configurations that were The results shown in Table 647 indicate the VCend to avoidance steer response times of comparable alerts were not significantly different
Table 647 Testing the Effect of HUD on Avoidance Steer Response Time from VCend
Contrast DF Contrast SS Mean Square F Value Pr gt F
Compare Beep vs BeepHUD 1 000001000 000001000 000 09793
Compare BeltBeep vs All 1 001506939 001506939 103 03170
Compare Belt vs BeltHUD 1 000443667 000443667 030 05851
Compare None vs HUD 1 000997556 000997556 068 04143
Table 648 provides a summary of the paired data used to statistically compare the mean VCend to avoidance steer response times associated with the four combined FCW configurations The results show the means were not significantly different which is consistent with the previous analyses discussed in this section
Table 648 Avoidance Steer Response Time from VCend Comparison By Modality Collapsed
VCend to Steering Input (sec) ndash Alerts With and Without HUD Combined
Modality N Mean Std Dev Minimum Maximum Pr gt F
Auditory 10 0368 0054 0275 0445
04346 Auditory‐Haptic 11 0385 0143 0085 0570
Haptic 11 0445 0141 0240 0690
None 9 0378 0101 0275 0620
70
The analysis presented in Table 649 indicates that there was no significant difference between the mean VCend to avoidance steer response times for the male and female participants
Table 649 Avoidance Steer Response Time from VCend by Gender
VCend to Steering Input (sec) ndash by Gender
Gender N Mean Std Dev Minimum Maximum Pr gt F
F 20 0407 0136 0085 0690 05377
M 21 0384 0099 0240 0585
71
70 CRASH AVOIDANCE INPUT MAGNITUDES To quantify the magnitudes of the participantsrsquo crash avoidance attempts peak steering and brake force inputs were considered The effect of FCW alert modality on these parameters is discussed in this section 71 Peak Brake Pedal Force 711 General Assessment of Peak Brake Pedal Force As previously stated 875 percent applied force to the brake pedal in an attempt to avoid the SLV Similar to the process used to assess peak steering wheel angle peak force was measured from the onset of the FCW alert through the time when the front of the SV crossed the vertical plane established by the rear of the SLV 13 For some participants this process reported a brake force magnitude less than the absolute maximum value observed during their respective trial With respect to crash avoidance this was deemed acceptable since any post‐crash input applied by a driver would have no real world relevance However understanding how the authors used this process is important as it explains how it was possible for an application with a very low ldquopeakrdquo input to still be categorized as an avoidance attempt Consider for example the case of a participant who began braking only 40 ms before they impacted the SLV Since the period of consideration for peak force magnitude ends at when the longitudinal range from the SV to the SLV was zero there was only enough time for an application magnitude of 05 lbs to be applied before the impact occurred Figure 71 presents the distribution of peak brake force magnitudes observed during this study14 Overall these values ranged from 05 to 2718 lbf and 946 percent of these magnitudes (53 of 56 trials) resided within the range of inputs established with configuration 23 (from 177 to 2718 lbf) The mean values for each FCW modality ranged from 275 to 1199 lbf overall for configurations 3 and 23 respectively The mean peak brake forces associated with the seat belt pretensioner‐based FCW modalities ranged from 514 to 1199 lbf for conditions 7 and 23 respectively The range of these values overlapped the comparable range of means recorded during tests performed without seat belt pretensioner‐based FCW modalities from 275 to 710 for conditions 3 and 12 respectively The mean peak brake force observed when no FCW alert was presented (1013 lbf) was outside the mean range for tests performed without seat belt pretensioning but was inside the range defined by pretensioner‐based trials
13 In three cases the SV came to a stop before the SV headway became zero For these trials the measured period was from the onset of the FCW alert to the time when the SV came to a stop
14 Two participants applied force away from the load cell used to measure force magnitude As a result no valid force data were available for these trials
72
Figure 71 Peak brake pedal force presented as a function of FCW modality
Figure 72 presents the distribution of brake pedal force applications presented as a function of FCW modality and crash outcome The overall mean peak forces of the trials where the participants collided with the SLV (752 lbf) was nearly identical to that observed when the crash was avoided (780 lbf) differing by only 04 percent This finding is in contrast to the trends previous shown in Figures 612 through 619 where FCW modality was shown to affect crash avoidance via reduced response times These data imply that while FCW modality significantly affected the participantsrsquo mean FCW to brake application response times it does not appear to affect the magnitude of the pedal force application as discussed later in this section
Figure 72 Peak brake pedal force presented as a function of FCW modality and crash outcome
712 Statistical Assessment of Peak Brake Pedal Force Table 71 provides a summary of the data used to statistically compare the mean peak brake pedal force magnitudes shown in Figure 71 The results show the means for the eight FCW configurations were not significantly different
73
Table 71 Peak Brake Pedal Force Comparison By Modality
Peak Brake Pedal Force (lbf)
Condition Modality Mean Std Dev Minimum Maximum Pr gt F
23 All 119888 91751 17700 271800
00686
3 Beep 71000 39278 33200 152100
12 BeepHUD 65150 16567 42300 92600
7 Belt 51429 48295 0500 153000
18 BeltBeep 71200 27804 32300 116000
13 BeltHUD 70800 34019 36600 114700
6 HUD 27475 30858 1700 72200
1 None 103271 49384 39500 175000
Pair‐wise comparisons were made between the four FCW configurations not inclusive of a HUD‐based alert with the corresponding configuration that was The results shown in Table 72 indicate the average peak brake pedal force was not significantly different between each comparable alert This is consistent with the previous analysis that showed no significant main effect
Table 72 Peak Brake Pedal Force Pair‐Wise Comparisons
Contrast DF Contrast SS Mean Square F Value Pr gt F
Compare Beep vs BeepHUD 1 11733429 11733429 005 08285
Compare BeltBeep vs All 1 948189062 948189062 383 00563
Compare Belt vs BeltHUD 1 121235341 121235341 049 04874
Compare None vs HUD 1 1462388731 1462388731 591 00190
Table 73 provides a summary of the paired data used to statistically compare the mean peak brake pedal forces associated with the four combined FCW configurations The results show the means for the combinations were not significantly different which is consistent with the previous analyses discussed in this section
Table 73 Peak Brake Pedal Force By Modality Collapsed
Peak Brake Pedal Force (lbf) ndash Alerts With and Without HUD Combined
Modality N Mean Std Dev Minimum Maximum Pr gt F
Auditory 14 68493 30746 33200 152100
03170 Auditory‐Haptic 16 95544 70153 17700 271800
Haptic 13 60369 41826 0500 153000
None 11 75709 56668 1700 175000
74
The analysis presented in Table 74 indicates that there was no significant difference between male and female participantsrsquo peak brake pedal force magnitude
Table 74 Peak Brake Pedal Force By Gender
Peak Brake Pedal Force (lbf) ndash by Gender
Gender N Mean Std Dev Minimum Maximum Pr gt F
F 29 73007 46805 15500 221800 06573
M 25 79520 60341 0500 271800
72 Peak Steering Wheel Angle 721 General Assessment of Peak Steering Wheel Angle As previously stated 42 of the 64 participants (656 percent) used steering wheel inputs in an attempt to avoid the SLV For this study peak steering angle was measured from the onset of the FCW alert through the time when the front of the SV crosses the vertical plane established by the rear of the SLV15 Figure 73 presents the distribution of peak steering wheel angles observed during this study Overall these values ranged from 94 to 2297 degrees The mean values for each FCW modality ranged from 426 to 860 degrees overall for configurations 7 and 23 respectively Although 905 percent of these magnitudes (38 of 42 trials) resided within the range of inputs established with FCW configuration 23 (from 177 to 2297 degrees) it should be noted that the descriptive statistics of the condition 23 steering inputs were strongly affected by the presence of a 2297 degree input whose magnitude was much larger than any other observed in this study (eg 926 degrees greater or 675 percent than the second largest peak steering angle) When the 2297 degree input is omitted the mean peak steering angle for condition 23 becomes 573 degrees The mean peak steering wheel angles associated with seat belt pretensioner‐based FCW modalities ranged from 426 to 860 degrees for conditions 7 and 23 respectively The range of these values entirely contained the comparable range of means recorded during tests performed without seat belt pretensioner‐based FCW modalities from 558 to 813 degrees for conditions 6 and 12 respectively as well as the mean value of the trials performed with no FCW alert (609 degrees) This finding is in contrast to the trends previously shown in Figures 612 through 617 where FCW modality appears to affect crash avoidance via reduced response times These data imply that while FCW modality significantly affected the participantsrsquo mean FCW to avoidance steer response times it does not appear to affect the magnitude of the avoidance steer angle as discussed later in this section
15 In three cases the SV came to a stop before the SV headway became zero For these trials the measured period was from the onset of the FCW alert to the time when the SV came to a stop
75
Figure 73 Peak steering angle presented as a function of FCW modality
Figure 74 presents the distribution of peak steering wheel angles presented as a function of FCW modality and crash outcome The overall mean peak input of the trials where the participants collided with the SLV (524 degrees) was less than that observed when the crash was avoided (790 degrees) differing by 508 percent Omitting the 2297 degree input observed during the ldquono‐crashrdquo configuration 23 test reduces the related group mean to 690 degrees and the ldquocrash vs avoidrdquo peak steering input disparity to 241 percent
Figure 74 Peak steering angle presented as a function of FCW modality and crash outcome
Note As part of an avoidance input that included a peak steering input of 835 degrees one participant braked to nearly a full stop (to 13 mph) 60 inches from a vertical plane defined by the rear of the SLV before releasing force from the brake pedal This participant who received FCW alert configuration 23 ultimately avoided the crash by steering to the right but braking was the dominate input
76
722 Statistical Assessment of Peak Steering Wheel Angle Table 75 provides a summary of the data used to statistically compare the mean peak steering wheel angles shown in Figure 73 The results show the means for the eight FCW configurations were not significantly different
Table 75 Peak Steering Wheel Angle Comparison By Modality
Peak Steering Wheel Angle (degrees)
Condition Modality Mean Std Dev Minimum Maximum Pr gt F
23 All 86033 85040 17700 229700
07541
3 Beep 55780 40237 10800 91100
12 BeepHUD 81300 38113 43300 137100
7 Belt 42580 31233 9400 76300
18 BeltBeep 57500 26825 18600 96700
13 BeltHUD 57100 21917 26100 83500
6 HUD 56280 24780 19200 81100
1 None 60925 31232 17500 88400
Pair‐wise comparisons were made between the four FCW configurations not inclusive of a HUD‐based alert with the corresponding configuration that was The results shown in Table 76 indicate the average peak steering wheel angle was not significantly different between each comparable alert This is consistent with the previous analysis that showed no significant main effect
Table 76 Peak Steering Wheel Angle Pair‐Wise Comparisons
Contrast DF Contrast SS Mean Square F Value Pr gt F
Compare Beep vs BeepHUD 1 1628176000 1628176000 087 03579
Compare BeltBeep vs All 1 2442453333 2442453333 130 02616
Compare Belt vs BeltHUD 1 574992000 574992000 031 05833
Compare None vs HUD 1 47946722 47946722 003 08739
Table 77 provides a summary of the paired data used to statistically compare the mean peak steering wheel angles associated with the four combined FCW configurations The results show the means for the combinations were not significantly different which is consistent with the previous analyses discussed in this section
77
Table 77 Peak Steering Wheel Angle By Modality Collapsed
Peak Steering Wheel Angle (degrees)ndash Alerts With and Without HUD Combined
Modality N Mean Std Dev Minimum Maximum Pr gt F
Auditory 10 68540 39320 10800 137100
06316 Auditory‐Haptic 12 71767 61938 17700 229700
Haptic 11 50500 26227 9400 83500
None 9 58344 26054 17500 88400
The analysis presented in Table 78 indicates that there was no significant difference between male and female participantsrsquo peak steering wheel angle
Table 78 Peak Steering Wheel Angle By Gender
FCW to Brake Application (sec) ndash by Gender
Gender N Mean Std Dev Minimum Maximum Pr gt F
F 21 57838 31021 9400 126300 04714
M 21 67267 50684 13300 229700
78
80 SUBJECT VEHICLE RESPONSES 81 Peak Longitudinal Deceleration The longitudinal acceleration (ie deceleration) results presented in this section were obtained by considering the same time interval used to assess peak steering angle and brake pedal force Figure 81 presents a distribution of the peak decelerations produced by the 56 participants who used braking as part of their crash avoidance maneuver Overall these values ranged from 002 (observed during a trial that included a brake pedal misapplication) to 113 g The mean values for each FCW modality ranged from 023 to 080 g overall for configurations 3 and 23 respectively
Figure 81 Peak deceleration magnitude presented as a function of FCW modality
The mean peak decelerations associated with the seat belt pretensioner‐based FCW modalities ranged from 057 g to 080 g for conditions 7 and 23 respectively The range of these values overlapped the comparable range of means recorded during tests performed without seat belt pretensioner‐based FCW modalities from 023 to 063 g for conditions 3 and 12 respectively and contains the mean value of the trials performed with no FCW alert (074 g) Figure 82 presents the distribution of peak decelerations presented as a function of FCW modality and crash outcome The overall peak means of the trials where the participants collided with the SLV (063 g) was less than that observed when the crash was avoided (070 g) differing by 99 percent 82 Peak Lateral Acceleration The lateral acceleration results presented in this section were obtained by considering the same time interval used to assess peak steering angle and brake pedal force and have been collapsed across direction of steer no distinction between steering to the left or right has been made
79
Figure 82 Peak deceleration magnitude presented as a function of FCW modality and crash outcome
Figure 83 presents a distribution of the peak lateral accelerations produced by the 42 participants who used steering as part of their crash avoidance maneuver Overall these values ranged from 003 to 077 g The mean values for each FCW modality ranged from 0259 to 044 g degrees overall for configurations 1 and 23 respectively
Figure 83 Peak lateral acceleration magnitude presented as a function of FCW modality
The mean peak lateral accelerations associated with the seat belt pretensioner‐based FCW modalities ranged from 0264 g to 044 g for conditions 7 and 23 respectively The range of these values almost entirely overlapped the comparable range of means recorded during tests performed without seat belt pretensioner‐based FCW modalities from 0261 to 041 g for conditions 3 and 12 respectively as well as the mean value of the trials performed with no FCW alert (0259 g) Figure 84 presents the distribution of peak lateral accelerations presented as a function of FCW modality and crash outcome The overall peak means of the trials where the participants
80
collided with the SLV (0267 g) was less than that observed when the crash was avoided (0473 g) differing by 435 percent
Figure 84 Peak lateral acceleration magnitude presented as a function of FCW modality and crash outcome
81
90 CRASH AVOIDANCE AND MITIGATION SUMMARY 91 Crash Avoidance Although it is not the intent of this study to identify the ldquobestrdquo FCW alert modality (ie the objective of the work was to develop a protocol suitable for evaluating FCW DVI effectiveness) the protocol indicates a potential for good discriminatory capability and its output can be used for high‐level crash avoidance comparisons Table 91 provides an overall summary of how many participants were able to avoid crashing into the SLV as a function of FCW modality
Table 91 Overall Crash Avoidance Summary
Condition FCW Alert Modality
of Participants
Belt No Belt
Crash Avoid Crash Avoid
1 No alert ‐‐ ‐‐ 8 0
3 Visual Only (Volvo HUD) ‐‐ ‐‐ 8 0
6 Auditory Only (Mercedes Beep) ‐‐ ‐‐ 7 1
7 Haptic Seat Belt Only (Acura Belt) 5 3 ‐‐ ‐‐
12 Auditory + Visual ‐‐ ‐‐ 7 1
13 Visual + Haptic Seat Belt 3 5 ‐‐ ‐‐
18 Auditory + Haptic Seat Belt 5 3 ‐‐ ‐‐
23 Visual + Auditory + Haptic Seat Belt 4 4 ‐‐ ‐‐
Total
(percent of 64 participants)
17
(266)
15
(234)
30
(469)
2
(31)
A total of 17 participants (266 percent) avoided a collision with the SLV Of these 17 instances the FCW modality present in 15 included seat belt pretensioning (882 percent) For the FCW modalities that supported successful crash avoidance the success rate is shown in Table 92 Table 93 presents the data shown in Table 92 but collapsed by FCW alert modality 92 Likelihood of an FCW Alert Response When considering the crashavoid data previously presented in this report the authors emphasize that being involved in a crash does not necessarily indicate the participant did not respond to the FCW modality used in their individual trial Although most participants crashed into the SLV because they failed to respond to the various FCW alerts used in this study (or were not presented with one) some crashed because their avoidance strategy was simply not effective
82
Table 92 Successful SLV Avoidance Summary
Condition FCW Alert Modality Avoidance Summary
Ratio Percentage
6 Auditory Only 1 of 8 125
12 Auditory + Visual 1 of 8 125
7 Haptic Seat Belt Only 3 of 8 375
18 Haptic Seat Belt + Auditory 3 of 8 375
13 Haptic Seat Belt + Visual 5 of 8 625
23 Haptic Seat Belt + Visual + Auditory 4 of 8 500
7 13 18 23 All Haptic Seat Belt‐Based 15 of 32 469
Table 93 Successful SLV Avoidance Summary Collapsed
Condition FCW Alert Modality Avoidance Summary
Ratio Percentage
6 12 Auditory 2 of 16 125
18 23 Auditory‐Haptic 7 of 16 438
7 13 Haptic 8 of 16 500
To quantify this phenomenon the authors reviewed video recorded during each trial Facial expressions the manner in which the participant re‐established their forward‐looking view throttle release brake application steering inputs etc were all considered in this assessment Ultimately each subject was categorized in one of three ways
1 FCW alert response likely crash avoided
2 FCW alert response likely crash not avoided
3 FCW alert response not likely crash not avoided Results of this categorization were used in conjunction with FCWVCend duration to further dissect response time As shown in Figure 91 the range of response times where FCW alert responses were likely and the crash avoided was 270 to 870 ms For the cases where FCW alert responses were likely but the crash still occurred response times were between 330 ms to 10 second Finally for the instances where FCW alert responses were not likely response times were between 870 ms to 174 seconds As previously stated if there was no FCW response a crash always occurred Note that Figure 91 presents data from 63 valid trials Although this study had 64 valid participants video data was not available for one
s46_c18_0270swmv
s1_c23_0740swmv
s56_c7_1740swmv

DISCLAIMER
This publication is distributed by the US Department of Transportation National Highway Traffic Safety Administration in the interest of information exchange The opinions findings and conclusions expressed in this publication are those of the authors and not necessarily those of the Department of Transportation or the National Highway Traffic Safety Administration The United States Government assumes no liability for its contents or use thereof If trade names manufacturersrsquo names or specific products are mentioned it is because they are considered essential to the object of the publication and should not be construed as an endorsement The United States Government does not endorse products or manufacturers
i
TECHNICAL REPORT DOCUMENTATION PAGE
1 Report No DOT HS 811 501
2 Government Accession No 3 Recipients Catalog No
4 Title and Subtitle A Test Track Protocol for Assessing Forward Collision Warning Driver-Vehicle Interface Effectiveness
5 Report Date July 2011
6 Performing Organization Code
NHTSANVS-312
7 Author(s) Garrick Forkenbrock NHTSA Andrew Snyder Mark Heitz Richard L (Dick) Hoover Bryan OrsquoHarra Scott Vasko and Larry Smith Transportation Research Center Inc
8 Performing Organization Report No
9 Performing Organization Name and Address National Highway Traffic Safety Administration Vehicle Research and Test Center 10820 SR 347 PO Box B37 East Liberty OH 43319-0337
10 Work Unit No (TRAIS)
11 Contract or Grant No
12 Sponsoring Agency Name and Address National Highway Traffic Safety Administration 1200 New Jersey Avenue SE Washington DC 20590
13 Type of Report and Period Covered
Final Report 14 Sponsoring Agency Code
NHTSANVS-312 15 Supplementary Notes The authors acknowledge the support of Lisa Daniels Don Thompson Thomas Gerlach Jr Randy Landes John Martin Tim Van Buskirk Matt Hostetler Josh Orahood Patrick Biondillo and Ralph Fout for assistance with vehicle preparation instrumentation installation test conduct and data processing and Scott Baldwin and Tom Ranney for insights into experimental design
16 Abstract The primary objective of the work described in this report was to develop a protocol suitable for evaluating forward collision warning (FCW) driver-vehicle interface (DVI) effectiveness Specifically this protocol was developed to examine how distracted drivers respond to FCW alerts in a crash imminent scenario To validate the protocol a diverse sample of 64 drivers was recruited from central Ohio for participation in a small-scale test track based human factors study Each participant was asked to follow a moving lead vehicle (MLV) within the confines of a controlled test course and while attempting to maintain a constant headway instructed to perform a series of four distraction tasks intended to briefly divert their attention away from a forward-viewing position With the participant fully distracted during the final task the MLV was abruptly steered out of the travel lane revealing a stationary lead vehicle (SLV) in the participantrsquos immediate path (a realistic-looking full-size balloon car) At a nominal time-to-collision (TTC) of 21s from the stationary vehicle one of eight FCW alerts was presented to the distracted participant Each alert modality was intended to emulate one or more elements from those presently available in contemporary vehicles The timing of the critical events contained within the protocol appears to be repeatable appropriate and effective With respect to evaluation metrics the data produced during this study indicate that reaction time and crash outcome provide good measures of FCW alert effectiveness where reaction time is best defined as the onset of FCW to the instant the driverrsquos forward-facing view is reestablished Using these criteria the seat belt pretensioner-based FCW alerts used in this study elicited the most effective crash avoidance performance That said of the 32 trials performed with some form of seat belt pretensioner-based FCW alert 531 percent of them still resulted in a crash FCW modality had a significant effect on the participant reaction time from the onset of an FCW alert and on the speed reductions resulting from the participantsrsquo avoidance maneuvers (regardless of whether a collision ultimately occurred) Differences in participant response times from the instant their forward-facing view was reestablished to throttle release brake application and avoidance steer were not significant nor were brake application and avoidance steer magnitudes 17 Key Words
Crash Warning Interface Metrics (CWIM) Forward Collision Warning (FCW) Driver Vehicle Interface (DVI) Test Track Evaluation
18 Distribution Statement Document is available to the public from the National Technical Information Service wwwntisgov
19 Security Classif (of this report)
Unclassified 20 Security Classif (of this page)
Unclassified 21 No of Pages
143 22 Price
Form DOT F 17007 (8-72) Reproduction of completed page authorized
ii
CONVERSION FACTORS
iii
NOTE REGARDING COMPLIANCE WITH AMERICANS WITH DISABILITIES ACT SECTION 508 For the convenience of visually impaired readers of this report using text‐to‐speech software
additional descriptive text has been provided for graphical images contained in this report to
satisfy Section 508 of the Americans with Disabilities Act (ADA)
iv
TABLE OF CONTENTS CONVERSION FACTORS ii
NOTE REGARDING COMPLIANCE WITH AMERICANS WITH DISABILITIES ACT SECTION 508 iii
LIST OF FIGURES viii
LIST OF TABLES x
EXECUTIVE SUMMARY xiii
10 BACKGROUND 1
11 The Rear End Crash Problem 1
12 Forward Collision Warning (FCW) 1
13 The Crash Warning Interface Metrics (CWIM) Program 1
131 CWIM Phase I Research Performed at VRTCmdashStatic Tests 2
1311 Phase I Experimental Design 2
1312 Utility of the Phase I Results 6
132 CWIM Phase II Research Performed at VRTCmdashProtocol Refinement 6
1321 Phase II Experimental Design 6
1322 Phase II Distraction Task Interface 7
133 CWIM Phase III Research Performed at VRTCmdashFinal Protocol 8
20 OBJECTIVES 9
21 Protocol Overview 9
22 Evaluation Considerations 9
30 TEST APPARTATUS AND INSTRUMENTATION 10
31 Test Vehicles 10
311 Subject Vehicle (SV) 10
312 Moving Lead Vehicle (MLV) 10
313 Stationary Lead Vehicle (SLV) 11
32 Forward Collision Warning (FCW) Modalities 12
33 Task Displays 13
331 Headway Maintenance Monitor 13
332 Random Number Recall Display 13
34 Instrumentation 14
341 Subject Vehicle Instrumentation 14
342 Moving Lead Vehicle Instrumentation 15
343 Presentation of Auditory Commands and Alerts 15
344 Video Data Acquisition 15
40 TEST PROTOCOL 16
41 Overview 16
42 Participant Recruitment 17
43 Pre‐briefing and Informed Consent Meeting 17
44 Vehicle and Test Equipment Familiarization 17
441 Maintaining a Constant Headway 17
442 Random Number Recall 18
45 Study Compensation 18
v
TABLE OF CONTENTS (continued)
451 Base Pay 18
452 Incentive Pay 18
46 Pre‐test Forward Collision Warning Education and Familiarization 19
47 FCW Alert Modalities 20
48 Test Course 20
49 Experimental Test Drive 21
491 Pass 1 of 4 21
492 Pass 2 of 4 21
493 Pass 3 of 4 22
494 Pass 4 of 4 22
495 Participant Debriefing and Post‐Drive Survey Administration 23
50 Task Participation and Performance 24
51 Test Validity Requirements 24
52 Headway Maintenance 25
521 Overall Headway Maintenance Task Performance 25
522 Subject Vehicle Performance During Pass 4 26
523 Moving Lead Vehicle Performance During Pass 4 26
524 FCW Alert Modalities 28
525 Subject Vehicle Speed at FCW Onset 28
526 Range to Stationary Lead Vehicle at FCW Onset 30
527 Subject Vehicle‐to‐Stationary Lead Vehicle TTC at FCW Onset 31
528 Random Number Recall 33
60 Crash Avoidance Response Times 34
61 Random Number Recall Task Instruction Response Time 34
62 Overall Visual Commitment Duration 36
63 Visual Commitment to Onset of FCW 37
64 Onset of FCW to End of Visual Commitment 38
641 General FCW to VCend Response Time Observations 39
642 Statistical Assessment of FCW to VCend Response Times 40
65 Time‐to‐Collision (TTC) at End of Visual Commitment 44
651 General TTC at VCend Observations 44
652 Statistical Assessment of TTC at VCend 45
66 Throttle Release Response Time 47
661 General Throttle Release Time Observations 48
6611 Onset of FCW to Throttle Release Time 48
6612 End of Visual Commitment to Throttle Release Time 49
662 Statistical Assessment of Throttle Release Times 50
6621 Throttle Release from FCW Onset 50
6622 Throttle Release from End of Visual Commitment 53
67 Brake Application Response Time 55
671 General Brake Application Response Time Observations 55
6711 Onset of FCW to Brake Application Response Time 55
6712 End of Visual Commitment to Brake Application Response Time 57
672 Statistical Assessment of Brake Application Response Times 58
vi
TABLE OF CONTENTS (continued)
6721 Brake Application Time from FCW Onset 58
6722 Brake Application Time from End of Visual Commitment 61
68 Avoidance Steer Response Time 62
681 General Avoidance Steer Response Time Observations 63
6811 Onset of FCW to Avoidance Steering Input 63
6812 End of Visual Commitment to An Avoidance Steering Input 64
682 Statistical Assessment of Avoidance Steer Response Times 66
6821 Onset of FCW to Avoidance Steer Response Time 66
6822 End of Visual Commitment to Avoidance Steer Response Time 68
70 Crash Avoidance Input Magnitudes 71
71 Peak Brake Pedal Force 71
711 General Assessment of Peak Brake Pedal Force 71
712 Statistical Assessment of Peak Brake Pedal Force 72
72 Peak Steering Wheel Angle 74
721 General Assessment of Peak Steering Wheel Angle 74
722 Statistical Assessment of Peak Steering Wheel Angle 76
80 Subject Vehicle Responses 78
81 Peak Longitudinal Deceleration 78
82 Peak Lateral Acceleration 78
90 Crash Avoidance and Mitigation Summary 81
91 Crash Avoidance 81
92 Likelihood of an FCW Alert Response 81
93 SV Speed Reduction 86
931 General SV Speed Reduction Observations 86
932 Statistical Assessment of FCW Modality on SV Speed Reductions 87
9321 Overall SV Speed Reductions Crash and Avoid 87
9322 SV Impact Speed Reductions (for Trials Resulting in a Crash) 91
100 CONCLUSIONS 95
101 Test Protocol 95
102 Evaluation Metrics 95
103 Crash Avoidance Maneuvers 96
104 Forward Collision Warning Modality Assessment 97
110 Future Considerations 98
111 Protocol Refinement (Time‐to‐Collision Based Triggering) 98
112 Protocol Validation 98
1121 Alternative Stationary Lead Vehicle Presentation Schedule 98
1122 Alternative Compensation Schedule 99
1123 Education and Training 100
113 Consideration of Additional FCW Modalities 100
1131 Alternative Seat Belt Pretensioner Magnitudes and Timing 100
1132 Low‐Magnitude Brake Pulse 101
114 Interactions with Other Advanced Technologies 101
1141 Crash‐Imminent Braking 101
1142 Dynamic Brake Support (DBS) 101
vii
TABLE OF CONTENTS (continued)
120 REFERENCES 103
130 APPENDICES 104
viii
LIST OF FIGURES
Figure 1 FCWVCend duration as a function of alert response likelihood and crash outcome xv
Figure 11 Visual alerts presented by the Volvo S80 Acura RL and Mercedes E350 (from left to right 3
Figure 12 Random number recall display (the red button was used only during Phase II trials) 7
Figure 31 2009 Acura RL the subject vehicle used in this study 10
Figure 32 2008 Buick Lucerne the moving lead vehicle used in this study 11
Figure 33 Inflatable balloon car used at the stationary lead vehicle in this study 11
Figure 34 Stationary lead vehicle restraint anchor 12
Figure 35 Volvo S80 FCW HUD hardware installed in the subject vehicle dashboard 12
Figure 36 Headway monitor installed in the SV 13
Figure 37 Load cell used to measure brake force Note adapter to increase throttle step height 14
Figure 41 Lead vehicle cut‐out scenario 16
Figure 42 Subject vehicle‐to‐stationary lead vehicle impact 16
Figure 43 TRC Skid Pad dimensional overview 20
Figure 44 Choreography used to assess participant responses to the various FCW modalities used in this study 22
Figure 51 SV speed at FCW alert onset presented as a function of FCW modality 29
Figure 52 SV speed at FCW alert onset presented as a function of FCW modality and crash outcome 30
Figure 53 SV‐to‐SLV headway at FCW onset presented as a function of FCW modality 30
Figure 54 SV‐to‐SLV headway at FCW onset presented as a function of FCW modality and crash outcome 31
Figure 55 SV‐to‐SLV TTC at FCW onset presented as a function of FCW modality 31
Figure 56 SV‐to‐SLV TTC at FCW onset presented as a function of FCW modality and crash outcome 32
Figure 61 Response time from recall task instruction to VCstart presented as a function of FCW modality 34
Figure 62 Visual commitment (VC) sequence 35
Figure 63 Response time from recall task instruction to VCstart presented as a function of FCW modality and crash outcome 36
Figure 64 Overall visual commitment duration presented as a function of FCW modality 37
Figure 65 Overall visual commitment duration presented as a function of FCW modality and crash outcome 37
Figure 66 VCstartFCW duration presented as a function of FCW modality 38
Figure 67 VCstartFCW duration presented as a function of FCW modality and crash outcome 39
Figure 68 FCWVCend duration presented as a function of FCW modality 39
Figure 69 FCWVCend duration presented as a function of FCW modality and crash outcome 40
Figure 610 TTC at VCend presented as a function of FCW modality 44
Figure 611 TTC at VCend presented as a function of FCW modality and crash outcome 45
Figure 612 Throttle release times presented as a function of FCW modality 48
Figure 613 Throttle release times presented as a function of FCW modality and crash outcome 49
Figure 614 Throttle release times presented from VCend as function of FCW modality and crash outcome 49
Figure 615 Throttle release times presented from VCend as function of FCW modality and crash outcome 50
Figure 616 Brake application times presented as a function of FCW modality 56
Figure 617 Brake application times presented as a function of FCW modality and crash outcome 56
Figure 618 Brake application times presented from VCend as function of FCW modality 57
Figure 619 Brake application times presented from VCend as function of FCW modality and crash outcome 58
Figure 620 Avoidance steer response times presented as a function of FCW modality 63
Figure 621 Avoidance steer response times presented as a function of FCW modality and crash outcome 64
ix
LIST OF FIGURES (continued)
Figure 622 Avoidance steer response times presented from VCend as function of FCW modality and crash outcome 65
Figure 623 Avoidance steer response times presented from VCend as function of FCW modality and crash outcome 65
Figure 71 Peak brake pedal force presented as a function of FCW modality 72
Figure 72 Peak brake pedal force presented as a function of FCW modality and crash outcome 72
Figure 73 Peak steering angle presented as a function of FCW modality 75
Figure 74 Peak steering angle presented as a function of FCW modality and crash outcome 75
Figure 81 Peak deceleration magnitude presented as a function of FCW modality 78
Figure 82 Peak deceleration magnitude presented as a function of FCW modality and crash outcome 79
Figure 83 Peak lateral acceleration magnitude presented as a function of FCW modality 79
Figure 84 Peak lateral acceleration magnitude presented as a function of FCW modality and crash outcome 80
Figure 91 FCWVCend duration as a function of alert response likelihood and crash outcome 83
Figure 92 Speed reduction from onset of FCW alert presented as a function of FCW modality 86
Figure 93 Speed reduction from onset of FCW alert presented as a function of FCW modality and crash
outcome 87
x
LIST OF TABLES
Table 1 FCW Alert Modality Summary xiii
Table 2 FCW Alert Response Summary xv
Table 11 Crash Rankings By Frequency (2004 GES data) 1
Table 12 Example of Contemporary FCW Modalities 3
Table 13 FCW Alert Modalities Installed Into NHTSA Acura RL for the Phase I Pilot Tests 4
Table 14 Phase I Brake Reaction Time Summary (n =728) 5
Table 41 Task Payment Schedule 19
Table 42 FCW Alert Modality Summary 20
Table 51 Headway Maintenance Task Performance 25
Table 52 Repeatability of Key Participant and Test Equipment Inputs Observed During Pass 4 27
Table 53 Repeatability of Key Moving Lead Vehicle Inputs During Pass 4 28
Table 54 FCW Alert Modality Condition Numbers 29
Table 55 SV‐to‐SLV TTC At FCW Onset Comparison By Modality 32
Table 56 SV‐to‐SLV TTC At FCW Onset Comparison By Gender 32
Table 57 Random Number Task Recall Performance Summary 33
Table 61 FCWVCend Comparison By Modality 41
Table 62 Testing the Effect of HUD on FCWVCend 41
Table 63 FCWVCend Comparison By Modality Collapsed 42
Table 64 FCWVCend Pair‐Wise Comparisons 42
Table 65 Objective Ranking FCWVCend of Response Times 43
Table 66 FCWVCend Response Times By Gender 43
Table 67 FCWVCend Response Times and Gender Interaction 43
Table 68 TTC at VCend Comparison By Modality Collapsed 45
Table 69 TTC at VCend Pair‐Wise Comparisons 46
Table 610 Objective Ranking of TTC at VCend 46
Table 611 TTC at VCend By Gender 46
Table 612 TTC at VCend and Gender Interaction 47
Table 613 Crash Avoidance Response Summary (n=64) 47
Table 614 Throttle Release Response Time from FCW Onset 51
Table 615 Testing the Effect of HUD on Throttle Release Time from FCW Onset 51
Table 616 Throttle Release Time from FCW Onset Comparison By Modality Collapsed 52
Table 617 Throttle Release Time from FCW Onset Pair‐Wise Comparisons 52
Table 618 Objective Ranking of Throttle Release Time from FCW Onset 52
Table 619 Throttle Release Time from FCW Onset by Gender 53
Table 620 Throttle Release Time from FCW Onset and Gender Interaction 53
Table 621 Throttle Release Response Time from VCend 54
Table 622 Testing the Effect of HUD on Throttle Release Time from VCend 54
Table 623 Throttle Release Time from VCend Comparison By Modality Collapsed 54
Table 624 Throttle Release Time from VCend by Gender 55
Table 625 Brake Steer Response Summary (n=40) 55
Table 626 Brake Application Time from FCW Onset 58
Table 627 Testing the Effect of HUD on Brake Application Time from FCW Onset 59
Table 628 Brake Application Time from FCW Onset Comparison By Modality Collapsed 59
Table 629 Brake Application Time from FCW Onset Pair‐Wise Comparisons 59
xi
LIST OF TABLES (continued)
Table 630 Objective Ranking of Brake Application Time from FCW Onset 60
Table 631 Brake Application Time from FCW Onset by Gender 60
Table 632 Brake Application Time from FCW Onset and Gender Interaction 60
Table 633 Brake Application Time from VCend 61
Table 634 Testing the Effect of HUD on Brake Application Time from VCend 61
Table 635 Brake Application Time from VCend Comparison By Modality Collapsed 62
Table 636 Brake Application Time from VCend by Gender 62
Table 637 Brake Application Time from VCend and Gender Interaction 62
Table 638 Direction of Steer Summary (n=42) 63
Table 639 Avoidance Steer Response Time from FCW Onset 66
Table 640 Testing the Effect of HUD on Avoidance Steer Response Time from FCW Onset 66
Table 641 Avoidance Steer Response Time from FCW Onset Comparison By Modality Collapsed 67
Table 642 Avoidance Steer Response Time from FCW Onset Pair‐Wise Comparisons 67
Table 643 Objective Ranking of Avoidance Steer Response Time from FCW Onset 68
Table 644 Avoidance Steer Response Time from FCW Onset by Gender 68
Table 645 Avoidance Steer Response Time from FCW Onset and Gender Interaction 68
Table 646 Avoidance Steer Response Time from VCend 69
Table 647 Testing the Effect of HUD on Avoidance Steer Response Time from VCend 69
Table 648 Avoidance Steer Response Time from VCend Comparison By Modality Collapsed 69
Table 649 Avoidance Steer Response Time from VCend by Gender 70
Table 71 Peak Brake Pedal Force Comparison By Modality 73
Table 72 Peak Brake Pedal Force Pair‐Wise Comparisons 73
Table 73 Peak Brake Pedal Force By Modality Collapsed 73
Table 74 Peak Brake Pedal Force By Gender 74
Table 75 Peak Steering Wheel Angle Comparison By Modality 76
Table 76 Peak Steering Wheel Angle Pair‐Wise Comparisons 76
Table 77 Peak Steering Wheel Angle By Modality Collapsed 77
Table 78 Peak Steering Wheel Angle By Gender 77
Table 91 Overall Crash Avoidance Summary 81
Table 92 Successful SLV Avoidance Summary 82
Table 93 Successful SLV Avoidance Summary Collapsed 82
Table 94 FCW Alert Response Summary 83
Table 95 FCW Alert Response Summary Collapsed 84
Table 96 FCW Response Likely But Crash Not Avoided Summary 85
Table 97 SV Speed Reduction Comparison By Modality 88
Table 98 Testing the Effect of HUD on SV Speed Reduction 88
Table 99 SV Speed Reduction Comparison By Modality Collapsed 88
Table 910 SV Speed Reduction Pair‐Wise Comparisons 89
Table 911 Objective Ranking of SV Speed Reductions 89
Table 912 SV Speed Reduction by Gender 89
Table 913 SV Speed Reduction and Gender Interaction 90
Table 914 SV Speed Reduction With and Without Seat Belt Pretensioning 90
Table 915 SV Speed Reduction With and Without Seat Belt Pretensioning and Gender Interaction 90
Table 916 SV Impact Speed Reduction Comparison By Modality 91
xii
LIST OF TABLES (continued)
Table 917 Testing the Effect of HUD on SV Impact Speed Reduction 91
Table 918 SV Impact Speed Reduction Comparison By Modality Collapsed 92
Table 919 SV Impact Speed Reduction Pair‐Wise Comparisons 92
Table 920 Objective Ranking of SV Impact Speed Reductions 92
Table 921 SV Impact Speed Reduction by Gender 93
Table 922 SV Impact Speed Reduction and Gender Interaction 93
Table 923 SV Impact Speed Reduction With and Without Seat Belt Pretensioning 94
Table 924 SV Impact Speed Reduction With and Without Seat Belt Pretensioning and Gender Interaction 94
Table A1 Phase I Static Pilot Post‐Test Questionnaire Responses 106
Table C1 RT3002 Channels and Accuracy Specifications 108
xiii
EXECUTIVE SUMMARY The current phase of the National Highway Traffic Safety Administrationrsquos (NHTSA) Crash Warning Interface Metrics (CWIM) program is intended to identify which alert modalities most effectively assist distracted drivers in forward collision and lane departure crash scenarios Once identified the program seeks to develop test protocols and evaluation metrics to help assess the safety benefits associated with these alerts Ultimately it is envisioned that NHTSA will use the outputs of the CWIM program to encourage vehicle manufacturers to implement FCW and Lane Departure Warning (LDW) alerts with a standardized interface design and operational characteristics The primary objective of the work described in this report was to develop a protocol suitable for evaluating forward collision warning (FCW) driver‐vehicle interface (DVI) effectiveness Specifically this protocol was developed to examine how distracted drivers respond to FCW alerts in a crash imminent scenario To validate the protocol a diverse sample of 64 drivers was recruited from central Ohio for participation in a small‐scale test track based human factors study Each participant was asked to follow a moving lead vehicle (MLV) within the confines of a controlled test course and while attempting to maintain a constant headway perform a series of four distraction tasks intended to briefly divert their attention away from a forward‐viewing position With the participant fully distracted during the final task the MLV was abruptly steered out of the travel lane revealing a stationary lead vehicle (SLV) in the participantrsquos immediate path (a realistic‐looking full‐size balloon car) At a nominal time‐to‐collision (TTC) of 21s from the SLV one of eight FCW alerts was presented to the distracted participant Each alert modality was intended to incorporate one or more elements from those presently available in contemporary vehicles Table 1 lists the alert modalities used in this study and the vehiclersquos they originated in
Table 1 FCW Alert Modality Summary
FCW Modality Alert Origin
None Baseline (no alert)
Visual Only 2008 Volvo S80 (HUD)
Auditory Only 2010 Mercedes E350 (repeated beeps)
Haptic Seat Belt 2009 Acura RL (reversible seat belt pretensioner)
Visual + Auditory 2008 Volvo S80 + 2010 Mercedes E350
Visual + Haptic Seat Belt 2008 Volvo S80 + 2009 Acura RL
Auditory + Haptic Seat Belt 2010 Mercedes E350 + 2009 Acura RL
Visual + Auditory +Haptic Seat Belt 2008 Volvo S80 + 2010 Mercedes E350 + 2009 Acura RL
The timing of the critical events contained within the protocol appears to be repeatable appropriate and effective Presentation of task instructions and FCW alerts was accurately
xiv
controlled and repeatable With very few exceptions participants maintained an acceptable headway began the random number recall task when instructed to do so and were fully distracted when presented with an FCW alert With respect to evaluation metrics the data produced during this study indicate that driver reaction time and crash outcome provide good measures of FCW alert effectiveness Many variants of reaction time were explored in this study however the interval defined by the onset of the FCW alert to the end of visual commitment (ie VCend the instant the driver returns their attention to a forward‐facing viewing position) appears to be the most appropriate While reaction time from FCW to throttle release brake application andor steering input also provide good indications of FCW alert effectiveness it is important to consider that drivers can use different techniques to arrive at a successful crash avoidance outcome (eg some drivers may use steering but no braking) Interestingly while FCW modality had a significant effect on the participant reaction time differences from the instant their forward‐facing view was reestablished to throttle release brake application and avoidance steer were not significant nor were brake application and avoidance steer magnitudes Overall 17 of the 64 participants avoided collisions with the SLV (266 percent) Fifteen of the successfully‐avoided crashes (882 percent) occurred during trials performed with the haptic alert or an alert combination inclusive of the haptic modality One crash (16 percent) was avoided during a trial performed with the auditory only alert one with a modality based on a combination of the auditory and visual alert These results clearly indicate the seat belt pretensioner‐based haptic alert used in this study offered better crash avoidance effectiveness than the other individual modalities on the test track However the authors emphasize that of the 32 trials performed with some form of this haptic alert 531 percent of them still resulted in a crash When considering the crash vs avoid data presented in this report it is important to recognize that being involved in a crash does not necessarily indicate the participant did not respond to the FCW modality used in their individual trial Although most participants crashed into the SLV because they failed to respond to the various FCW alerts used in this study (or were not presented with one) some crashed because their avoidance strategy was simply not effective To quantify this phenomenon the crash avoidance response of each participant was categorized in one of three ways
1 FCW alert response likely crash avoided
2 FCW alert response likely crash not avoided
3 FCW alert response not likely crash not avoided A summary of crash outcome presented as a function of FCW modality and crash avoidance response is shown in Table 2 Results of this categorization were used in conjunction with FCWVCend duration as a means of quantifying response time as shown in Figure 1 Here the
xv
range of response times where FCW alert responses were likely and the crash avoided was 270 to 870 ms For the cases where FCW alert responses were likely but the crash still occurred response times were between 330 ms to 10 second Finally for the instances where FCW alert responses were not likely response times were between 870 ms to 174 seconds If the participant did not respond to the FCW alert a crash always occurred
Table 2 FCW Alert Response Summary
FCW Alert Modality
of Participants
Response Likely
Crash Avoided
Response Likely
Crash Not Avoided
Response Not Likely
Crash Not Avoided
None (no alert) ‐‐ ‐‐ 8
Visual Only (Volvo HUD) ‐‐ ‐‐ 8
Auditory Only (Mercedes Beep) 1 3 4
Haptic Seat Belt Only (Acura Belt) 3 ‐‐ 5
Auditory + Visual 1 2 5
Visual + Haptic Seat Belt 5 1 2
Auditory + Haptic Seat Belt 3 2 3
Visual + Auditory + Haptic Seat Belt 31 3 1
Total (percent of 63 participants1)
161
(254)
11
(175)
36
(571)
1VCend video data not available for one of the 64 participants
Figure 1 FCWVCend duration as a function of alert response likelihood and crash outcome
1
10 BACKGROUND 11 The Rear End Crash Problem Using 2004 General Estimates System (GES) statistics a data summary assembled by the Volpe Center1 indicated that approximately 6170000 police‐reported crashes of all vehicle types involving 10945000 vehicles occurred in the United States [1] Many of these crashes involved rear‐end collisions with the most common pre‐crash scenarios being the Lead Vehicle Stopped Lead Vehicle Decelerating and Lead Vehicle Moving at Lower Constant Speed Table 11 presents a summary of the frequency cost and harm (expressed as functional years lost) for these crash types For each parameter the relevance with respect to the overall crash problem is provided in parentheses
Table 11 Crash Rankings By Frequency (2004 GES data)
Pre‐Crash Scenario Frequency Cost ($) Years Lost
Lead Vehicle Stopped 975000
(164)
15388000000
(128)
240000
(87)
Lead Vehicle Decelerating 428000
(72)
6390000000
(53)
100000
(36)
Lead Vehicle Moving at Lower Constant Speed 210000
(35)
3910000000
(33)
78000
(28)
12 Forward Collision Warning (FCW) NHTSA defines a forward collision warning (FCW) system as one intended to passively assist the driver in avoiding or mitigating a rear‐end collision These systems have forward‐looking vehicle detection capability presently provided by sensing technologies such as RADAR LIDAR (laser) cameras etc Using information from these sensors an FCW system driver‐vehicle interface or DVI alerts the driver that a collision with another vehicle in the anticipated forward pathway of their vehicle may be imminent unless corrective action is taken Contemporary FCW systems typically include various combinations of audible visual andor haptic warning modalities presented together as a single concurrent alert 13 The Crash Warning Interface Metrics (CWIM) Program The current phase of the National Highway Traffic Safety Administrationrsquos (NHTSA) Crash Warning Interface Metrics (CWIM) program is intended to identify which alert modalities most effectively assist distracted drivers in forward collision and lane departure crash scenarios
1 The Volpe Center is part of the US Department of Transportationrsquos Research and Innovative Technology Administration (RITA)
2
Once identified the program seeks to develop test protocols and evaluation metrics to help assess the safety benefits associated with these alerts Ultimately it is envisioned that NHTSA will use the outputs of the CWIM program to encourage vehicle manufacturers to implement FCW and Lane Departure Warning (LDW) alerts with a standardized interface design and operational characteristics In support of the CWIM program the University of Iowa is presently using the National Advanced Driving Simulator (NADS) to develop test protocols relevant to the forward collision and lane departure safety concerns The work described in this report was the output of a concurrent program performed at NHTSArsquos Vehicle Research and Test Center (VRTC) designed to provide objective test track‐based data relevant to the forward collision problem This work was completed in three phases Phase I A small sample population was exposed to a large number of FCW alert modalities in a simple detection exercise using a repeated measure experimental design Results from these tests were used to reduce the number of FCW alert combinations used in Phase II Phase II A small sample of drivers recruited from the general public participated in an experimental drive on the test track Observations made during the conduct of this phase were used to refine the test protocol ultimately used in Phase III Phase III Sixty‐four drivers recruited from the general public participated in an experimental drive on the test track Seven FCW alert modality combinations and a baseline condition were used in this phase Data output from trials performed with each FCW alert were compared between test participants 131 CWIM Phase I Research Performed at VRTCmdashStatic Tests The CWIM work performed at VRTC began by identifying what FCW alert modalities existed on contemporary production vehicles A description of the systems representative of those available on US‐specification vehicles is presented in Table 12 Of significance is the diversity of the alerts At the time the tests described in this report were performed the number of contemporary light vehicles available in the United States with FCW was quite low
Since it was not feasible to perform a large‐scale evaluation inclusive of each FCW modality shown in Table 12 Phase I research consisted of a small static study designed to reduce the number of auditory and visual alerts to one apiece 1311 Phase I Experimental Design Preparation for the Phase I static study began with FCW alerts representative of each modality shown in Table 12 being installed into a common subject vehicle (SV) a 2009 Acura RL2 While
2 This retrofit only involved installation of multiple alerts not of the other hardware etc used to activate them
3
the authors are sensitive to the likelihood vehicle manufacturers design their respective FCW alerts to be integrated systems appropriate for the vehicle in which they were installed (eg the auditory alert was selected to complement the visual alert etc) installing multiple alert modalities into one vehicle removed the confounding effect of vehicle type from subsequent analyses
Table 12 Example of Contemporary FCW Modalities
Alert
Vehicle
2009 Acura RL
2010 Toyota Prius
2010 Mercedes E350
2008 Volvo S80
2010 Ford Taurus
2011 Audi A8
Haptic Seat Belt
Pretensioner ‐‐
Seat Belt Pretensioner
‐‐ ‐‐ Brake Pulse
(025g)
Visual ldquoBrakerdquo on the
MDC1
ldquoBrakerdquo on the MDC1
Small IC2 Icon LED HUD LED HUD ldquoBrake Guard Activatedrdquo on the MDC1
Auditory Beep Beep Beep Tone Tone Single Gong
1MDC = Message Display Center 2IC = Instrument Cluster
Three different visual alert implementations were examined In addition to the SVrsquos manufacturer‐equipped message display center alert an LED head‐up display (HUD) from a 2008 Volvo S80 and a small FCW icon from a 2010 Mercedes E350 were installed in the dashboard and instrument cluster respectively to emulate the alertsrsquo native environments to the greatest extent possible (see Figure 11)
Two non‐native auditory alerts were used originating from a 2010 Mercedes E350 (repeated
beeping ) and a 2008 Volvo S80 (repeated tone ) One haptic alert was used the SVrsquos manufacturer‐equipped seat belt pretensioner Table 13 provides a summary of the alerts installed in the SV
Phase I tests were performed with eight participants recruited from within VRTC Upon entering the SV participants were instructed to adjust their seat to a comfortable position and
Figure 11 Visual alerts presented by the Volvo S80 Acura RL and Mercedes E350 (from left to right)
4
drive to a test course isolated from other facility traffic Once at the course participants were instructed to stop the vehicle put the transmission in park and face forward with their hands at the 3 and 9 orsquoclock positions on the steering wheel Verbal instructions were provided to each participant by an in‐vehicle experimenter who occupied the left‐rear seat All Phase I tests were performed during daylight hours
Table 13 FCW Alert Modalities Installed Into NHTSA Acura RL for the Phase I Pilot Tests
Visual Auditory Haptic
ldquoBrakerdquo on the MDC
Small Icon LED HUD None Beep Tone None Seat Belt
Pretensioner None
MDC = Message Display Center
A monitor was attached to the base of the windshield near the passenger‐side A‐pillar to display real‐time throttle position Participants were instructed to watch the monitor for the duration of each test trial in order to maintain a constant throttle application of 35 percent3 By monitoring the throttle position the participantsrsquo eyes were directed away from a forward‐looking viewing position however peripheral vision still allowed them to detect activity toward the front of the vehicle (ie FCW alert status) Participants were informed that they would be presented with a variety of different FCW alerts and told to release the throttle and apply force to the brake pedal when the alert first became apparent Following acknowledgement of an alert participants were instructed to release the brake pedal and resume a constant throttle position of 35 percent Presentation of the FCW alerts used in Phase I was a repeated measure During their test session each participant received four randomized sequences of 23 alert combinations (ie all possible combinations of the alerts shown in Table 13 except the ldquono alertrdquo configuration) Therefore each subject received a total of 92 individual alerts during Phase I To quantify alert detectability brake response time from the onset of FCW was measured for each trial Following completion of the final trial the in‐vehicle experimenter presented each participant with a series of questions asking their opinion of the alerts including which auditory and visual alert was the most apparent4 A complete list of the questions and the subsequent responses are provided in Appendix A Table 14 summarizes the brake reaction times observed during the Phase I trials
3 It is anticipated that the outside temperature will be very warm during conduct of the Phase I tests Therefore participant comfort will require the vehiclersquos air conditioning (and thus the engine) and be on Instructing the participants to maintain a moderate‐to‐large throttle position with the vehicle at rest would result in high engine RPM a potentially distracting situation that could confound the ability of the participants to detect andor respond to the FCW alerts
4 Subjects 1 and 2 were presented with a smaller set of post‐test questions only questions 1 7 and 15 were used
5
Table 14 Phase I Brake Reaction Time Summary (n =728)
Description Brake Reaction Time (seconds) Missed
Trials Min Max Mean Std Dev
Acura Belt Acura MDC 0325 0820 0507 0149 ‐‐
Acura Belt Mercedes Beep Mercedes IC 0330 0865 0516 0155 ‐‐
Acura Belt Volvo Tone 0285 1080 0518 0187 ‐‐
Acura Belt Mercedes Beep Volvo HUD 0310 0850 0520 0162 ‐‐
Acura Belt Mercedes Beep Acura MDC 0310 1120 0524 0170 ‐‐
Acura Belt 0320 0910 0527 0160 ‐‐
Acura Belt Volvo Tone Acura MDC 0290 0905 0529 0163 ‐‐
Acura Belt Volvo HUD 0315 1025 0532 0176 ‐‐
Acura Belt Mercedes IC 0330 0920 0534 0180 ‐‐
Acura Belt Mercedes Beep 0335 0950 0538 0188 ‐‐
Acura Belt Volvo Tone Mercedes IC 0290 1070 0540 0191 ‐‐
Acura Belt Volvo Tone Volvo HUD 0320 0990 0557 0200 ‐‐
Mercedes Beep Mercedes IC 0510 1085 0690 0143 ‐‐
Volvo Tone Volvo HUD 0465 1035 0705 0156 ‐‐
Volvo Tone Acura MDC 0470 1125 0708 0187 ‐‐
Mercedes Beep Volvo HUD 0460 1535 0713 0237 ‐‐
Mercedes Beep Acura MDC 0405 1425 0747 0245 ‐‐
Mercedes Beep 0495 1065 0752 0173 ‐‐
Volvo Tone Mercedes IC 0460 1535 0786 0281 ‐‐
Volvo Tone 0475 1365 0797 0200 ‐‐
Mercedes IC 0495 3395 1065 0563 4 of 32
Acura MDC 0500 4330 1088 0785 3 of 32
Volvo HUD 0505 2940 1158 0577 1 of 32
Note HUD = head‐up display IC = instrument cluster MDC = message display center
In Table 14 results from tests performed with auditory alerts only are highlighted in green Similarly tests performed with visual alerts only are highlighted in blue Results from alert configurations containing seat belt pretensioning (ie those containing ldquoAcura Beltrdquo in the description column) are shown in orange Note that a total of 728 data points are summarized in Table 14 Of the 736 tests performed (8 subjects 92 tests per subject) eight resulted in missed trials because the participants did not detect the presentation of the FCW alert Missed trials only occurred during one of the three visual‐only configurations
6
1312 Utility of the Phase I Results Depending on the analysis performed differences in brake reaction time observed in Phase I were either marginally significant or not statistically significant (an analysis is provided in Appendix B) Therefore the participantsrsquo subjective impressions of the two auditory alerts were used to determine which to include in subsequent test phases When asked which auditory alert was the most noticeable six of the eight responses indicated the ldquoMercedes Beeprdquo Two participants indicated both auditory alerts were equally apparent Five of the six participants indicated the Mercedes beep‐based alert was ldquoobviousrdquo ldquoattention gettingrdquo or ldquourgentrdquo Based on this feedback the ldquoMercedes Beeprdquo was retained for later use as the sole auditory alert The decision on which visual alert to include in subsequent test phases was confounded by the fact each visual‐only configuration produced missed trials Four of the eight participants considered the Acura message display center‐based visual alert to be the most apparent followed by the Volvo HUD (three participants) then the Mercedes instrument cluster‐based alert (one participant) Given that the differences in mean brake reaction time were not significantly different across visual alert type and since the number of missed trials was lowest for tests performed with the Volvo HUD only (ie when compared to the other visual‐only alerts) the Volvo HUD was retained for later use 132 CWIM Phase II Research Performed at VRTCmdashProtocol Refinement Once the reduced set of FCW modalities had been identified work to refine the protocol for evaluating driver‐vehicle interface (DVI) effectiveness was performed Unlike the static testing used in Phase I Phase II tests were highly dynamic placing participants recruited from the general public in a realistic crash imminent driving scenario 1321 Phase II Experimental Design At a high level the Phase II protocol asked participants to perform two tasks during an experimental drive on a controlled test course First they were instructed to maintain a constant distance between their vehicle and another being driven directly in front of them Second while maintaining a constant headway participants were asked to direct their attention away from the road to observe a series of three random numbers presented on an interface located near the right front seat headrest After the last number had been presented participants were told to return to a forward‐looking viewing position and repeat the numbers aloud to an in‐vehicle experimenter (who occupied the left‐rear seating position) Late in their drive during a period of distraction imposed by the random number recall task the leading vehicle performed an abrupt lane change that suddenly revealed a stationary lead vehicle directly in the path of the participantrsquos vehicle Shortly thereafter distracted participants were presented with an FCW alert selected from the reduced set of alerts output
7
from Phase I Unlike the repeated measures experimental design used in Phase I each Phase II participant only received one FCW alert 1322 Phase II Distraction Task Interface Of particular interest for Phase II was development of a way to direct the participantsrsquo forward‐facing view away from the road for as long as possible while retaining excellent task acceptance with a low likelihood of a forward‐looking glance A random number recall task was developed in an attempt to satisfy these criteria In Phase II the random number recall task was based on a 45rdquo x 35rdquo display installed to the left of the SV front passenger headrest as shown in Figure 12 As initially conceived the task required a participant to (1) push a red button to the right of the numerical display (2) be presented with three random single digit numbers (3) release the button and (4) repeat the numbers aloud to an in‐vehicle experimenter (in the order they were shown) Observing the numbers required the participant fully avert their forward‐facing view from the road Each number was presented for approximately 750 ms
Figure 12 Random number recall display (the red button was used only during Phase II trials)
Conceptually the Phase II random number recall task was appealing because it was believed to impose reasonable physical and mental commitments upon the participants while keeping their forward‐facing view away from the road for an extended period of time Pilot tests performed with subjects recruited from within VRTC produced encouraging results the task was generally considered to be challenging yet comfortable Unfortunately tests performed with members from the general public revealed a major deficiency in the task design Although the first participant fully engaged the physical (pushed the button) and cognitive (committed the random numbers to memory) elements of the task immediately after being instructed to do so the next seven did not Instead these participants divided the task into two separate components When instructed to begin the random number task these participants reached for the task display and located the task activation button
8
entirely by touch However since the participants were able to maintain their forward‐looking viewing position while engaged in this spatial detection they could observe the choreography intended to produce a surprise event near the end of their experimental drive (ie the suddenly revealed stationary lead vehicle) Since concealing this choreography was an integral part of the test protocol additional refinement was required 133 CWIM Phase III Research Performed at VRTCmdashFinal Protocol Using lessons learned from Phases I and II the authors developed the Phase III FCW evaluation protocol This protocol offered an excellent combination of participant acceptance performability objectivity and discriminatory capability The Phase III protocol was used to produce the data discussed in the remainder of this report A total of 64 subjects participated in the Phase III
9
20 OBJECTIVES The objectives of the Phase III CWIM FCW work performed at VRTC were to
1 Develop a robust protocol for evaluating FCW DVI effectiveness on the test track
2 Perform a small scale human factors study to validate the CWIM FCW protocol
3 Evaluate how different FCW alert modalities affect participant reaction times and crash avoidance behavior
21 Protocol Overview The protocol used in this study was developed to examine how distracted drivers responded to FCW alerts in a crash imminent scenario A diverse sample of drivers was recruited from central Ohio for participation in the study These participants using a government‐owned SV were instructed to follow a moving lead vehicle (MLV) through a test track‐based course while maintaining a specified speed and headway During the drive participants were instructed to complete a distraction task requiring them to look away from the road for the duration of the task To familiarize participants with the vehicle driving environment and distraction task they performed multiple ldquopassesrdquo through the test course During the final pass with the driver fully distracted the MLV unexpectedly swerved out of the lane of travel to reveal a stationary lead vehicle (SLV) in the participantrsquos path In this study the SLV was actually a full‐size realistic‐looking inflatable 22 Evaluation Considerations The data produced in this study were reduced and analyzed with methods that objectively described how the participants responded to different FCW modalities Evaluation metrics quantified differences in the timing and magnitude of driversrsquo avoidance maneuvers From a protocol assessment perspective the authors were interested in confirming that the experimental design and methodology used in this study could effectively objectively and repeatably quantify the participantsrsquo willingness to perform the protocolrsquos tasks and the ability of the protocol to discriminate between baseline (ie no alert presented) apparent and non‐apparent alerts From a driver performance perspective the primary data of interest straddled the crash imminent scenario (1) the TTC when participants returned to their forward‐looking viewing position (2) throttle release brake application and avoidance steer response times from FCW alert onset (3) the magnitudes of the participantsrsquo brake and steer inputs (4) the magnitudes of the SV speed reductions and accelerations and whether the test participants collided with the SLV
10
30 TEST APPARTATUS AND INSTRUMENTATION 31 Test Vehicles 311 Subject Vehicle (SV) The SV used in this study was a 2009 Acura RL shown in Figure 31 Originally‐equipped this four‐door sedan was equipped with all‐wheel drive four‐wheel anti‐lock disc brakes with brake assist electronic stability control (ESC) an FCW system and a crash imminent brake system (CIB) During conduct of the tests performed in this study an in‐vehicle experimenter occupied the left‐rear seating position To observe test data as it was being collected tabulate participant performance and manually activate elements of the test protocol during pre‐test familiarization an interface with the vehiclersquos data acquisition and audio system was installed behind the driver seat
312 Moving Lead Vehicle (MLV) The moving lead vehicle (MLV) used in this study was a 2008 Buick Lucerne shown in Figure 32 This mid‐sized sedan was selected primarily out of convenience it was available had been previously instrumented with much of the equipment required by the protocol described in this report and was large enough to effectively obscure the subjectrsquos view of the SLV prior to the surprise event presented at the end of the experimental drive Of note in Figure 32 is the solid black vertical panel installed behind the front seats This panel prevented participants from looking through the MLV during their drive thereby reducing the likelihood of the SLV being prematurely detected on approach For this study the MLV was driven by a professional test driver MLV speed was maintained using cruise control for much of the experimental drive
Figure 31 2009 Acura RL the subject vehicle used in this study
11
313 Stationary Lead Vehicle (SLV) The FCW alerts used in this study were presented at a TTC of 21 seconds a value believed to be representative of those used by algorithms installed in contemporary production vehicles Responding to an alert presented at this TTC was intended to provide participants with enough time to successfully avoid the SLV However since this study also included a baseline condition where no alerts were presented SV‐to‐SLV collisions were to be expected To insure participant safety a full‐size inflatable ldquoballoon carrdquo designed to emulate a 2009 Volkswagen GTI (shown in Figure 33) was used
The SLV was approximately 5 ft wide 5 ft tall 12 ft long and weighed 77 lbs It was strikeable inflatable in the field and secured to the ground with zip ties and concrete anchors The zip ties present at each corner of the SLV were strong enough to prevent the vehicle from moving in response to wind gusts but easily snapped during a SV‐to‐SLV collision The SLV restraints are shown in Figure 34
Figure 32 2008 Buick Lucerne the moving lead vehicle used in this study
Figure 33 Inflatable balloon car used at the stationary lead vehicle in this study
12
Figure 34 Stationary lead vehicle restraint anchor
32 Forward Collision Warning (FCW) Modalities As previously explained in Section 1312 the visual FCW alert originally installed in the SV was disabled in lieu of using that from a 2008 Volvo S80 Specifically the Volvo S80 visual alert consisted of a 6‐inch light bar that when activated flashed a series of twelve light‐emitting diodes (LED) using a 50 percent duty cycle for 4 seconds (100ms on 100ms off) A reflection of the light bar illumination was visible to the driver in the form of a head up display (HUD) on the windshield intended to reside in line‐of‐sight for easy detection Figure 35 shows where the hardware Volvo FCW HUD hardware was installed in the dash of the SV Also as explained in Section 1312 the auditory FCW alert originally installed in the SV was disabled in lieu of using that from a 2010 Mercedes E350 Specifically this auditory alert was comprised of ten sharp beeps using the audio clip provided in Section 1311 Although very similar to that installed in the SV use of the Mercedes‐based alert allowed the authors to diversify the origins of the FCW alerts used in this study
Figure 35 Volvo S80 FCW HUD hardware installed in the subject vehicle dashboard
13
The magnitude of the seat belt pretensioner activation used in this study was intended to closely emulate that of the original 2009 Acura RL‐based configuration However the timing of when the intervention occurred was adjusted to be in agreement with the auditory and visual alerts (ie the commanded onset of each alert was equivalent) Note Although the SV was equipped with a forward‐looking radar to provide range and range‐ rate data to the vehiclersquos FCW controller the authors opted to activate each FCW alert using an external control computer and positioned‐based trigger points This provided excellent activation repeatability and avoided the potential for the original sensing system being unable to acquire and respond to the SLV in the limited time available pre‐crash 33 Task Displays 331 Headway Maintenance Monitor To assist the participants with achieving and maintaining the appropriate distance to the MLV during each pass a 325rdquo x 20rdquo monitor displaying the real‐time headway was attached to the base of the windshield just above the SV dashboard (see Figure 36)
332 Random Number Recall Display During each pass and while maintaining the desired headway participants were instructed to complete a total of four random number recall tasks During the conduct of these tasks five randomly generated single digit numbers were presented on a 45rdquo x 35rdquo display installed to the left of the SV front passenger headrest (previously shown in Figure 12) The increase to five numbers from the three used during the preliminary Phase I and II research was made to increase task duration (ie the amount of time participants were required to look away from the road) without imposing excessive cognitive overhead [2] Each of the five random numbers was presented for 472 ms This duration which was approximately 371 percent less than that used during Phases I and II was short enough to
Figure 36 Headway monitor installed in the SV
14
strongly discourage glances away from the display (ie back to a forward‐facing view of the road) while still allowing each number to be easily observed and retained Observing the numbers required the participant fully avert their forward‐facing view from the road 34 Instrumentation The SV was instrumented with two data acquisition systems one for collecting inertial and highly accurate GPS position data the other for miscellaneous analog data Both systems were installed in the SV trunk to minimize participant distraction during the experimental drive The moving lead vehicle (MLV) was equipped with a similar GPS‐enhanced inertial sensing system to facilitate real‐time vehicle‐to‐vehicle range (eg SV‐to‐MLV headway) The balloon‐based SLV contained no instrumentation 341 Subject Vehicle Instrumentation
The basic analog measurements logged in the SV included brake pedal force throttle position steering wheel angle brake line pressure the state of the vehicle and various data flags To measure the force applied to the brake pedal a load cell was clamped onto the front surface of the pedal as show in Figure 37 To offset the difference in step height imposed by installation of the load cell a light‐weight adapter was attached to the throttle pedal
Figure 37 Load cell used to measure brake force Note adapter to increase throttle step height
Throttle position data were collected through a direct tap of the vehiclersquos throttle position sensor (TPS) Under the dash a potentiometer was attached to the steering column and configured to measure steering wheel angle Transducers were installed at the bleeder screw of each brake caliper to measure brake line pressure The SV positions velocities rotational rates and accelerations were measured with a GPS‐enhanced inertial platform installed in the truck and were resolved to the vehiclersquos center of gravity (see Appendix C for a detailed description of this system) Finally data flags indicating initiation of the random number recall task instructions random number recall task duration FCW onset and the state of each FCW modality were recorded
15
342 Moving Lead Vehicle Instrumentation In a manner similar to that used for the SV the MLV positions velocities rotational rates and accelerations were measured with a GPS‐enhanced inertial platform Although this unit was installed in the cabin these data were still resolved to the vehiclersquos center of gravity Using a wireless communication package integrated with the inertial platforms installed in each vehicle the state of the MLV was broadcast to the SV The relative position of the MLV with respect to the SV (ie the real‐time headway) was one of these data channels To assist the MLV driver with maintaining the desired velocities a speed display was secured to the inside of the windshield just above the dashboard 343 Presentation of Auditory Commands and Alerts
An automated system was developed to produce audible instructions and FCW alerts in the SV during the experimental test drive This system used a trunk‐mounted laptop PC to play wav files through a center‐mounted speaker installed in the SVrsquos dashboard Specifically the
instruction ldquoBegin Task Nowrdquo directed the participant to begin the random number recall task Software provided with the a GPS‐enhanced inertial platform installed in the SV was used to automatically initiate presentation of the audible instructions and FCW using positioned‐based trigger points 344 Video Data Acquisition Four small video cameras were mounted inside the cabin of the SV to observe driver activity during the experimental test drive One camera was mounted to the underside of the dash near the center console to record throttle and brake pedal activity The pedals were illuminated by a ldquolight striprdquo containing 20 infrared LEDs A second camera was mounted to the rear window interior trim facing forward to observe how the driver engaged with the random number recall task display Two cameras were mounted to the rearview mirror (1) a forward‐facing camera was mounted to the back side of the interior rearview mirror to observe SV lane keeping SV‐to‐MLV headway and how the SV approached the SLV during the final pass of the experimental drive and (2) a rear‐facing camera used to observe the participants eye glance activity and physical reactions to the suddenly appearing SLV A small microphone was mounted in the interior trim above the driverrsquos head The microphone signal was amplified to achieve good reception of driver comments experimenterrsquos instructions and FCW alerts where applicable
16
40 TEST PROTOCOL 41 Overview Real drivers ages 25 to 55 years old were recruited from the general public for participation in this study Each participant was asked to follow the MLV within the confines of a controlled test course while attempting to maintain a constant headway and instructed to perform a series of four distraction tasks intended to briefly divert their attention away from a forward‐viewing position With the participant fully distracted during the final task the MLV was abruptly steered out of the travel lane to reveal a realistic‐looking full‐size balloon car acting as the SLV in the immediate path of the SV
At a nominal TTC of 21s from the SV one of eight FCW alerts was presented to the distracted participant The manner in which the driver responded to the FCW alert was used to assess driver‐vehicle interface (DVI) effectiveness The ldquoLead Vehicle Cut‐Outrdquo scenario as viewed from inside the SV is shown in Figure 41 An example of a rear‐end impact with the SLV is shown in Figure 42
Figure 41 Lead vehicle cut‐out scenario
Figure 42 Subject vehicle‐to‐stationary lead vehicle impact
17
42 Participant Recruitment
Participant recruitment was accomplished by publishing advertisements in local newspapers and online via Craigslist In these advertisements shown in Appendix D prospective subjects were instructed to contact NHTSArsquos VRTC if interested in study participation Respondents were screened to ensure they satisfied the health and eligibility criteria described in Appendix E If these criteria were satisfied the respondents were provided with additional study details and more specific personal information was collected from them 43 Pre‐briefing and Informed Consent Meeting Upon arriving at VRTC participants were greeted and escorted to a conference room Here each participant was provided with an informed consent form describing the purpose of the study to be an evaluation of how interfacing with an electronic device may affect their ability to maintain a consistent distance between their vehicle and one being driven directly in front of them The informed consent form shown in Appendix E explained that a windshield‐mounted display would be used to report the distance between the two vehicles (the headway monitor) and that the study participants would be asked to interface with the electronic device (a random number display) four times during their test drive 44 Vehicle and Test Equipment Familiarization Following completion of the pre‐briefing participants were escorted to the Government‐owned SV Each participant was instructed to turn their cell phone off secure their seat belt adjust the seat and mirrors to comfortable positions and to familiarize themselves with the orientation of the basic vehicle controls (eg throttle brake pedal turn signal indicators etc) Participantsrsquo use of sunglasses while in the SV was not allowed An in‐vehicle experimenter who sat behind the participant in the left rear seating position for the duration of the experimental drive described the location and functionality of the headway monitor and random number display to the participant and asked that they be adjusted to insure a comfortable viewing position5 During this process the in‐vehicle experimenter described details pertaining to the two types of tasks being used during the experimental drive headway maintenance and random number recall Together these tasks were ultimately used to facilitate the choreography designed to evaluate how the participants responded to the various FCW modalities unexpectedly presented at the end of their drive 441 Maintaining a Constant Headway For a majority of their drive participants were instructed to maintain a constant distance of 110 ft between the front of their vehicle to the rear of the MLV being driven at 35 mph The magnitude of this distance or headway was selected to best balance participant safety
5 The attachment points of the headway monitor and random number display were not adjustable only the viewing angles
18
participant compliance (eg their willingness to maintain a close proximity to the MLV) and the ability of the MLV to effectively obstruct the participantsrsquo view ahead of it Participants were not permitted to use cruise control while attempting to maintain a constant SV‐to‐MLV headway However participants were encouraged to use the headway maintenance monitor described in Section 311 to assist them with this task Although the participants were instructed to maintain a headway of 110 ft while driving on the straight sections of the test course (subsequently referred to as a ldquopassrdquo) they were also told that a tolerance of plusmn15 ft (ie a headway between 95 to 125 ft) was acceptable If the in‐vehicle experimenter observed that the actual headway was outside of this range during the experimental drive the participant was reminded what the acceptable performance was and encouraged to increasedecrease the SV speed to tightenlengthen their following gap Sustained non‐compliance with this request resulted in a deduction of the task incentive pay described in Section 452 442 Random Number Recall During each pass participants were instructed to complete a total of four random number recall tasks Using the display previously shown in Figure 12 presentation of five random numbers was initiated 10 second after conclusion of the instruction to begin the random number recall task and approximately 77 seconds after establishing lane position on the test course (ie the onset of a given pass) To minimize variability the random number recall task instruction and presentation of the random number recall task numbers were automatically triggered at the desired points on the test course using a GPS‐based closed‐loop feedback control algorithm 45 Study Compensation 451 Base Pay Test subjects received a nominal compensation of $3500 for participation in the study and $050 per mile for each mile driven from their residence to the study site 452 Incentive Pay To encourage good performance an incentive schedule was used for each task If they were able to maintain a consistent headway when instructed to do so a factor critical to choreography participants received up to $2000 more than their base pay Specifically participants received $500 per pass if a majority of that pass was within a range of 95‐125 ft This incentive was awarded on a pass‐to‐pass basis performance observed during any single pass had no influence on the earning potential of the other passes If a participant successfully completed all aspects of the random number recall task they received an additional $4500 This incentive was larger than that associated with headway
19
maintenance since it was imperative the participants be fully distracted ahead of (and during) the Lead Vehicle Cut‐Out maneuver and the subsequent presentation of the FCW alert During the first pass participants were awarded $150 per number successfully recalled in the order presented For the second and third passes participants were awarded $250 per number correctly recalled Due to the presence of the SLV all participants received the maximum task compensation ($1250) regardless of task performance during the final pass If the number sequence indicated by the participant was not correct for a given pass there was a $100 penalty imposed for the task compensation earned during that pass Table 41 summarizes the incentive pay schedule used in this study Appendix G presents the log sheet used by the in‐vehicle experimenter to tabulate the participantsrsquo performance
Table 41 Task Payment Schedule
Pass Headway
Maintenance
Random Number Recall
Task‐Based Payment Correct
Compensation Incorrect Order
Deduction
1 $5 if within range $150 per correct ‐$1 per order error Total for pass 1
2 $5 if within range $250 per correct ‐$1 per order error Total for pass 2
3 $5 if within range $250 per correct ‐$1 per order error Total for pass 3
4 $5 if within range $250 per correct ‐$1 per order error Total for pass 4
Total Compensation Sum of pass totals
Throughout the experimental drive the in‐vehicle experimenter informed the participant of their task performance shortly after conclusion of the pass during which the compensation was earned This feedback was used to keep participants motivated (eg ldquoYou did well during that passrdquo) to indicate how acceptable their performance was (ie how much of the maximum payment was awarded) and to provide a means for suggesting how task performance may be improved during subsequent passes (eg ldquoYour headway was a bit too long during the last trial Please try to drive closer to the lead vehicle during the next passrdquo) 46 Pre‐test Forward Collision Warning Education and Familiarization No pre‐test FCW education familiarization or instruction was provided to the participants recruited for this study Time and budgetary constraints and the desire to have a reasonable number of participants per test condition imposed a limitation that either all subjects would or would not receive information regarding FCW before the experimental drive So as to observe the most genuine untrained responses to the various FCW modalities responses not artificially influenced by receiving statements or descriptions of an unfamiliar technology less than an hour before receiving the alert during their drive the authors opted to exclude FCW education or familiarization from the protocol used for this study
20
47 FCW Alert Modalities Table 42 provides a summary of the eight FCW modalities used in this study As previously explained the basis for including these alerts was twofold prevalence in contemporary FCW implementations and positive results from the Phase I static test
Table 42 FCW Alert Modality Summary
FCW Modality Alert Origin
None Baseline (no alert)
Visual Only 2008 Volvo S80 (HUD)
Auditory Only 2010 Mercedes E350 (repeated beeps)
Haptic Seat Belt 2009 Acura RL (reversible seat belt pretensioner)
Visual + Auditory 2008 Volvo S80 + 2010 Mercedes E350
Visual + Haptic Seat Belt 2008 Volvo S80 + 2009 Acura RL
Auditory + Haptic Seat Belt 2010 Mercedes E350 + 2009 Acura RL
Visual + Auditory +Haptic Seat Belt 2008 Volvo S80 + 2010 Mercedes E350 + 2009 Acura RL
48 Test Course The studyrsquos primary driving task was performed on Lane 4 of the Transportation Research Center Inc (TRC) Skid Pad An overview of the Skid Pad and the key logistics associated with the experimental design is provided in Figure 43
Since the participants were members of the general public exclusive use of the entire Skid Pad was used during the periods of test conduct to maximize safety Performing tests on the Skid Pad provided the subjects with an opportunity to use significant avoidance steering should
North Loop South Loop
Beginning of lane delineations
Presentation of distraction task when subject vehicle is heading north
Presentation of distraction task when subject vehicle is heading south
Figure 43 TRC Skid Pad dimensional overview
21
they deem it necessary without risk of a road departure or impact with other vehicles foreign objects etc Tests were performed during daylight hours with good visibility 49 Experimental Test Drive The experimental drive used in this study began and concluded with the SV and MLV staged in a VRTC parking lot Following the vehicle and test equipment familiarization and task orientation the in‐vehicle experimenter indicated the ldquolead vehiclerdquo to the participant (ie the MLV) and instructed them to follow it to the test course The brief drive to the test course from VRTC was performed at 25 mph 10 mph less than that specified for a valid straight‐line pass during the experimental drive The low speed of the pre‐study drive served two purposes (1) to increase the participantrsquos familiarization with the headway monitor operation in a benign operating condition and (2) to give the participant an opportunity to practice the task of maintaining a desired headway to the MLV in a non‐threatening environment 491 Pass 1 of 4 Following their test vehicle and equipment familiarization the in‐vehicle experimenter instructed the participants to establish position on Skid Pad Lane 4 heading south following the MLV with a headway of 110 ft using the windshield‐mounted headway monitor as a guide At a location approximately 075‐miles from the point where lane position was first established and while the participant was driving the participant was automatically instructed to begin the random number recall task when prompted by a pre‐recorded message played through the SV audio system As described in the task orientation once the fifth number had been presented the subject was to tell the in‐vehicle experimenter what five numbers were shown in the order they were presented After completing the first random number recall task participants were instructed to continue following the MLV around the Skid Padrsquos south curve After emerging from the curve heading north they were told to follow the MLV back into Lane 4 heading north and re‐establish a nominal headway of 110 ft using the windshield‐mounted distance display as a guide 492 Pass 2 of 4 After approximately 075‐miles from the point where lane position heading north was first established the participant was automatically instructed to begin their second random number recall task As before the task was deemed complete once the subject had told the in‐vehicle experimenter what five numbers were shown in the order they were presented After completing the second random number recall task the in‐vehicle experimenter instructed the participants to continue following the MLV around the Skid Padrsquos north curve After emerging from the curve heading south they were instructed to follow the MLV back into Lane
22
4 heading south and to re‐establish a headway of 110 ft using the windshield‐mounted distance display as a guide 493 Pass 3 of 4 From this point the sequence of driving south performing and completing the random number recall task and following the MLV around the south Skid Pad curve was repeated As before headway was then established and the participants instructed to drive north 494 Pass 4 of 4 After approximately 075‐miles from the point where lane position was first established the participants were automatically instructed to begin their fourth random number recall task By this time the participants were generally quite familiar and comfortable with the SV the driving environment their ability to maintain a constant headway to the MLV and their ability to complete the random number recall task During the fourth and final random number recall task the MLV was abruptly steered out of the travel lane revealing the SLV in the immediate path of the SV6 At a nominal TTC of 21s from the SLV one of eight FCW alerts was presented to the distracted participant Figure 44 presents an overview of the choreography used near the end of the fourth pass
Since it had not been incorporated into any of the first three passes during their drive and all other aspects of the driving experience were identical participants did not anticipate presentation of an FCW alert during the fourth pass This factor allowed the study protocol to discriminate which FCW alert modalities were capable of effectively redirecting the attention of a distracted driver back to the driving task Furthermore since the presence of SLV was a
6 In the event that the participant collided with the balloon car it merely bounced off the front of the subject vehicle Given the low vehicle speed used for this study (nominally 35 mph) and the strikeable design of the balloon car the risk of harm to the participant during a test where an impact occurs did not differ from a test where it does not
Figure 44 Choreography used to assess participant responses to the various FCW modalities used in this study
23
surprise the protocol allowed the authors to quantify how the various FCW modalities affected the participantsrsquo crash avoidance behavior 495 Participant Debriefing and Post‐Drive Survey Administration Within five seconds of either avoiding or striking the SLV participants were asked to stop the SV (if still moving) and place the transmission in park At this time the in‐vehicle experimenter read a short debrief script to the participant (provided in Appendix H) Participants were then instructed to follow the MLV back to VRTC Once parked the in‐vehicle experimenter escorted the test participants back to the conference room where they had received their pre‐test briefing During a final debriefing participants were asked to complete a brief survey containing questions about their experience in the study their comfort in performing the headway maintenance and random number recall tasks anticipation of the final conflict event (if any) and their opinions about FCW systems (see Appendix I) Participants were asked not to discuss the main purpose of the study with anyone through the end of October 2010 the end of the study period The participants were then provided with their compensation and thanked for participating in the study
24
50 TASK PARTICIPATION AND PERFORMANCE 51 Test Validity Requirements Given the effort used to obtain participants the test trial validity requirements used for this study were intended to be as accommodating as possible In a sense all driving activity leading up to presentation of the FCW alert was performed to groom the participants for comfortably achieving a vehicle speed of 35 mph at two critical times the onset of the random number recall task instruction and the onset of the FCW alert Here ldquocomfortablyrdquo refers to a general sense of ease while performing their commanded tasks (maintaining the proper headway to the MLV and recalling the random numbers after they had been displayed) Therefore the validity requirements were limited to
1 The participant not detecting the SLV before presentation of the FCW
2 The participant maintaining a SV speed of at least 30 mph until (1) responding to the FCW or (2) completion of the random number recall task
3 The participant achieving an SV‐to‐MLV headway between 95 to 125 ft at the onset of the random number recall task instruction
For this study achieving eight samples per FCW modality required valid data from 64 subjects This ultimately required the scheduling of 74 participants The 10 ldquoextrardquo subjects were needed for the following reasons
Three subjects failed to report to the test site as scheduled
Three participants failed to begin the random number recall task when instructed due to inattentiveness
One participant deliberately postponed beginning the number recall task until they believed the number presentation would begin (ie this individual realized and adapted to the 10 second pause between the end of the task instructions and revelation of the first number)
Two participants glanced back to the forward‐facing viewing position during the random number recall task
The SV speed at the end of visual commitment7 (VCend) was deemed too low (298 mph) for one participant
Disregarding the three subjects that did not arrive for the study six of the seven non‐valid trials involved participants observing the MLV steer or begin to steer around the SLV Prematurely detecting the presence of the SLV spoiled the surprise nature of the studyrsquos ruse and caused the
7 In the context of this study the authors defined visual commitment as the time from when the driver first averts their forward‐facing view from the road to the time this view was first recovered
25
participants to avoid it with little effort This invalidated the participantrsquos response to the FCW alert since they were (1) no longer fully distracted and (2) pre‐occupied with avoiding the rapidly approaching SLV Of the seven non‐valid trials three participants failed to participate in the random number recall task when instructed to do so Review of the video data and post‐test interviews associated with these participants indicated inattentiveness was the most probable explanation for this behavior In the case where the SV speed was too low the participant was able to successfully recall each of the five random numbers and comfortably avoid collision with the SLV The authors believe the vehicle speed observed at VCend for this particular trial reduced the scenario severity to a level not representative or comparable with the other trials performed in this study 52 Headway Maintenance Nominally participants were instructed to maintain a SV‐to‐MLV headway of 110 ft during each pass Once established and given the excellent consistency of the MLV speed maintaining this headway would result in a SV speed of 35 mph for the duration of each pass Maintaining the proper headway and speed during the final pass insured the surprise event could be successfully executed 521 Overall Headway Maintenance Task Performance The in‐vehicle experimenter maintained a log of acceptable headway maintenance during each pass This information was used to provide feedback to the participants on a pass‐by‐pass basis and provided the criteria for their headway maintenance task compensation Table 51 provides a summary of these logs Note that the in‐vehicle experimenter did not record headway performance during the final pass since all participants received the maximum compensation for the final pass due to the presence of the SLV Fifty‐three of the 64 participants (828 percent) were able to successfully perform the headway maintenance task for each of the first three passes
Table 51 Headway Maintenance Task Performance
Acceptable Headway
Pass 1 Pass 2 Pass 3 Pass 4
Yes No Yes No Yes No Yes No
55 9 63 1 62 2 na
Overall compliance with the headway maintenance requirement was quite good particularly for the second and third passes Acceptable headway maintenance task performance was achieved by 859 984 and 969 percent of the participants for first second and third passes
26
respectfully Note that the only participant with unacceptable headway performance during the second pass also had unacceptable performance during the third 522 Subject Vehicle Performance During Pass 4 Table 52 summarizes key test participant and test equipment inputs observed during the fourth pass of the experimental drive These data can be used to describe the robustness of the protocol The two primary groupings are SV speed and the SV‐to‐SLV distance (relevant during the final pass) These independent data were used to calculate the values shown in the third grouping SV‐to‐SLV TTC Within each grouping the data associated with four instances in time are shown (1) initiation of the automated instruction telling the participant to begin the random number recall task (2) the presentation the first number of random number recall task was shown (3) the onset of the FCW alert and (4) conclusion of the participantsrsquo VC Subject vehicle speed was controlled entirely by the participantsrsquo modulation of throttle and brake The use of cruise control was not permitted during the conduct of the test trials With the exception of the data shown in the ldquoVC Concludesrdquo column of Table 52 the SV‐to‐SLV distances were the product of automation At a nominal distance to the SLV the various events were automatically trigged via use of GPS‐based position and closed‐loop feedback Subject vehicle to SLV TTC data reflects the participantrsquos ability to maintain the desired test speed (nominally 35 mph achieved indirectly by attempting to maintain a consistent headway to the rear of the MLV) and the ability of the test equipment to accurately and repeatably initiate events during a participantrsquos drive The range and TTC data presented in the ldquoVC Concludesrdquo columns depended strongly on whether a participant responded to the FCW alert prior to completing the random number recall task Given the choreography of the experimental design a participant that effectively responded to the FCW alert would end their VC before a participant that tried to observe each of the five numbers presented during the random number recall task The earlier the VC concluded the further the participant was from the SLV This in turn resulted in a longer TTC 523 Moving Lead Vehicle Performance During Pass 4 Consistent MLV operation played an import role in insuring the SV was being driven at the correct speed at the time of the FCW alert Table 53 summarizes the MLV speed at the onset of random number recall task instruction during the final pass of the test drive and for key elements of the MLV avoidance maneuver around the SLV The avoidance maneuver onset was determined from analysis of MLV lateral acceleration data The period of data considered for peak MLV lateral acceleration and lateral deviation ranged from onset of random number recall task instruction to two seconds after FCW presentation occurred in the SV
27
Table 52 Repeatability of Key Participant and Test Equipment Inputs Observed During Pass 4
Description
SV Speed (mph)
SV‐to‐SLV Distance (feet)
SV‐to‐SLV TTC (seconds)
Task Instruction
Random Numbers Presented
FCW Alert VC
Concludes Task
Instruction
Random Numbers Presented
FCW Alert VC
Concludes Task
Instruction
Random Numbers Presented
FCW Alert VC
Concludes
Min 330 311 308 308 2785 1507 1033 164 5070 2758 1879 0319
Max 375 381 383 382 2793 1705 1087 945 5765 3743 2325 1872
Mean 352 352 351 349 2789 1605 1061 527 5412 3117 2064 1030
Std Dev 11 13 14 15 02 40 15 239 0165 0186 0094 0466
Median 352 352 352 351 2789 1602 1061 500 5410 3112 2055 0927
Nominal 350 350 350 350 2823 1724 1078 Subject
Dependent 55 34 21 Subject
Dependent
VC = Visual Commitment defined as the instant the driver returns their vision to a forward‐looking position
28
Table 53 Repeatability of Key Moving Lead Vehicle Inputs During Pass 4
Description
MLV Speed
at Onset of Task Instruction
(mph)
MLV Avoidance Maneuver
Longitudinal MLV‐to‐SLV
Distance at Onset (ft)
Peak Lateral Acceleration
(g)
Maximum Lateral Deviation
(ft)
Min 349 552 048 97
Max 358 1035 086 155
Mean 355 743 068 127
Std Dev 02 107 0074 13
Median 354 718 069 129
Nominal 350 As close as possible Low enough to
prevent tire squall 13
(one lane width)
The range of MLV speeds was very tight during the experimental drive (only 09 mph) making it unlikely to have confounded the ability of the participants to maintain a constant SV‐to‐MLV headway Similarly while it is uncertain whether the manner in which the MLV was steered around the SLV affected the participantsrsquo crash avoidance maneuvers it is unlikely MLV avoidance path variability confounded the study outcome Each MLV avoidance maneuver was performed to the left of the SLV and the range of MLV maximum lateral deviations was very narrow 524 FCW Alert Modalities For the duration of this report test results are commonly summarized via use of histograms The data presented in these charts are organized in two ways (1) sorted by FCW condition number as a function of whether the respective modality included seat belt pre‐tensioning (ie ldquoBeltrdquo vs ldquoNo Beltrdquo) and (2) sorted by FCW condition number as a function of whether the SV came in contact with the SLV (ie ldquoCrashrdquo vs ldquoAvoidrdquo) In both chart types the baseline data (ie that produced during tests performed without any form of FCW alert presentation) are shown in light blue In these charts and in the subsequent discussions based on them FCW alert modalities are referred to by condition number (see Table 54) In addition to the general overviews of the data statistical analyses were performed Due to the manner in which these analyses were performed and the pairing of certain data sets to increase the number of participants per test condition short descriptions were used to describe each modality also described in Table 54 525 Subject Vehicle Speed at FCW Onset Since the speed of the MLV was tightly controlled requiring the participants maintain a constant SV‐to‐MLV headway provided a means to encourage constant SV speed during each
29
Table 54 FCW Alert Modality Condition Numbers
FCW Alert Modality Condition Used For General Analyses
Descriptions Used For Statistical Analyses
No alert 1 None
Volvo HUD 3 Beep
Mercedes Beep 6 HUD
Acura Belt 7 Belt
Mercedes Beep Volvo HUD 12 BeepHUD
Acura Belt Volvo HUD 13 BeltHUD
Acura Belt Mercedes Beep 18 BeltBeep
Acura Belt Mercedes Beep Volvo HUD 23 All
pass of the experimental drive As presentation of the random number recall task instructions random number recall numbers and FCW alert were each initiated at predefined SV‐to‐SLV distances variations of SV speed directly affected the TTC at which they occurred Of particular interest was the state of the SV at the time of FCW alert Figure 51 summarizes the SV speed at FCW alert onset presented as a function of FCW modality Figure 52 presents these data as a function of FCW modality and crash outcome Subject vehicle speeds at FCW alert onset ranged from 308 to 383 mph with overall mean and median values of 351 and 352 mph respectively Therefore the overall mean and median SV speeds were only 01 mph (03 percent) and 02 mph (06 percent) greater than the respective target values
Figure 51 SV speed at FCW alert onset presented as a function of FCW modality
30
Figure 52 SV speed at FCW alert onset presented as a function of FCW modality and crash outcome
526 Range to Stationary Lead Vehicle at FCW Onset To achieve a TTC of 21 seconds at FCW onset using a nominal SV speed of 35 mph the alert was to be presented when the SV was 1078 ft from the SLV Overall the SV‐to‐SLV distance at FCW alert onset ranged from 1033 to 1087 ft with overall mean and median values of 1061 ft only 17 ft (16) less than the target value Figure 53 summarizes the SV speed at FCW alert onset presented as a function of FCW modality Figure 54 presents these data as a function of FCW modality and crash outcome
Figure 53 SV‐to‐SLV headway at FCW onset presented as a function of FCW modality
31
Figure 54 SV‐to‐SLV headway at FCW onset presented as a function of FCW modality and crash outcome
527 Subject Vehicle‐to‐Stationary Lead Vehicle TTC at FCW Onset Nominally presentation of the FCW alerts used in this study was to occur at TTC = 21 seconds Overall these TTC values ranged from 188 to 233 seconds with overall mean and median values of 2064 and 2055 seconds respectively Therefore the overall mean and median TTCs at FCW onset were only 36 ms (17 percent) and 45 ms (06 percent) less than the respective target values Figure 55 summarizes the SV‐to‐SLV TTCs at FCW alert onset presented as a function of FCW modality Figure 56 presents these data as a function of FCW modality and crash outcome
Figure 55 SV‐to‐SLV TTC at FCW onset presented as a function of FCW modality
32
Figure 56 SV‐to‐SLV TTC at FCW onset presented as a function of FCW modality and crash outcome
Table 55 provides a summary of the data used to statistically compare the mean SV‐to‐SLV TTCs shown in Figures 55 As expected (ie given the tight distribution of the data) the means were not found to be significantly different Similarly the data shown in Table 56 indicate the mean TTCs of the FCW alerts presented to male participants was not significantly different than that of the female participants
Table 55 SV‐to‐SLV TTC At FCW Onset Comparison By Modality
TTC at FCW Onset (sec)
Condition Modality N Mean Std Dev Minimum Maximum Pr gt F
23 All 8 2023 0076 1906 2112
01487
3 Beep 8 2063 0082 1902 2156
12 BeepHUD 8 2010 0078 1879 2117
7 Belt 8 2062 0052 1970 2143
18 BeltBeep 8 2052 0043 1987 2127
13 BeltHUD 8 2071 0086 1938 2184
6 HUD 8 2087 0117 1982 2278
1 None 8 2144 0148 1971 2325
Table 56 SV‐to‐SLV TTC At FCW Onset Comparison By Gender
TTC at FCW Onset (sec) ndash by Gender
Gender N Mean Std Dev Minimum Maximum Pr gt F
F 31 2081 0088 1938 2325 01986
M 32 2051 0098 1879 2304
33
528 Random Number Recall The in‐vehicle experimenter maintained a log of the participantsrsquo ability to correctly recall the five random numbers and their order presented during each pass This information was used to provide feedback to the participants on a pass‐by‐pass basis and provided the criteria for their random number recall task compensation Table 57 provides a summary of task performance from the in‐vehicle experimenterrsquos logs Generally speaking task performance was quite good However the fact not all of the random numbers were recalled correctly indicates the task was also a reasonably demanding one Seventeen of the 64 participants (266 percent) were able to successfully perform the random number recall task without any errors Interestingly the participants who correctly identified each number remained quite consistent throughout the first three passes with a slight overall improvement being realized by the third pass Some participants perceived this improvement as well as indicated by Participant 21 during the drive back to the laboratory after the experimental drive ldquoI think by the fourth pass yoursquore starting to trust your driving and focus more on the numbersrdquo Note this participant correctly identified four numbers during the first pass and five during passes 2 and 3 (albeit with a sequence error during the third)
Table 57 Random Number Task Recall Performance Summary (Number of participants and percentages of the overall 64 participant group are shown)
Pass
Number of Numbers Correctly Recalled Incorrect Recall Order 0 1 2 3 4 5
1 0 0 0 4
(63) 19
(297) 41
(641) 14
(219)
2 0 0 0 6
(94) 18
(281) 40
(625) 7
(109)
3 1
(16) 0 0
2 (31)
15 (234)
46 (719)
7 (109)
4 na
34
60 CRASH AVOIDANCE RESPONSE TIMES In this section different ways to assess the participantsrsquo crash avoidance response times are provided This includes an examination of how long participants took to respond to the random number recall task instruction a detailed breakdown of elements pertaining to different aspects of visual commitment (VC) the interaction between presentation of the FCW and VC and the TTC at the end of VC (recall the protocol choreography previously shown in Figure 44) Throttle release brake application and avoidance steering initiation times measured with respect to end of VC and FCW onset are also provided 61 Random Number Recall Task Instruction Response Time To better understand the variability associated with each stage of the VC process the authors began by quantifying how long the participants took to respond to the random number recall task instruction measured from instruction onset to onset of visual commitment (VCstart) Since VCstart always occurred before presentation of the FCW this parameter was expected to remain consistent across all participants An example of the VC sequence is provided on page 36 Figure 61 presents the distribution of response times to the random number recall task instructions observed in this study for each FCW modality Overall these response times ranged from 760 ms to 213 seconds8 with overall mean and median values of 148 and 149 seconds respectively The mean values for each FCW modality ranged from 136 to 160 seconds overall for configurations 3 and 23 respectively
Figure 61 Response time from recall task instruction to VCstart presented as a function of FCW modality
The overall random number recall task instruction response time means observed during tests performed with seat belt pretensioner‐based FCW modalities ranged from 1364 to 1600
8 The duration of the random number recall task instruction from onset to completion was 108 seconds Four participants initiated their visual commitment during the task instruction
35
Figure 62 Visual commitment (VC) sequence
Random number recall task
Onset of visual commitment
(VCstart)
Forward‐facing view
Completion of visual commitment
(VCend)
FCW onset
36
seconds for conditions 7 and 23 respectively These values very nearly contained the entire range of comparable means established during tests performed without seat belt pretensioner‐based FCW modalities whose range was from 1363 to 1520 seconds established by conditions 3 and 12 respectively The mean value of the trials performed with no FCW alert (1529 seconds) resided within the mean range of trials performed with seat belt pretensioning but was just outside the range of means established without pretensioning As expected the data shown in Figure 63 indicate response time to the random number recall task instructions had no apparent affect on crash outcome The overall task instruction response time means of the trials with and without collisions with the SLV were 1489 and 1456 seconds respectively differing by only 23 percent
Figure 63 Response time from recall task instruction to VCstart presented as a function of FCW modality and crash outcome
62 Overall Visual Commitment Duration Developing a way to promote sustained VC was an essential component of the experimental design since a quick forward‐looking glance back to the road in the presence of the SLV before the FCW alert was presented would likely invalidate that test trial In other words to insure the authors were able to attribute the return of the driverrsquos forward‐facing view to either (1) responding to the FCW alert or (2) completion of the random number recall task the experimental design required methodology that suppressed the driverrsquos temptation to glance Figure 64 presents the distribution of overall VC durations observed in this study for each FCW modality The overall VC durations ranged from 127 to 433 seconds The mean values for each FCW modality ranged from 235 to 351 seconds overall for configurations 18 and 3 respectively The overall VC duration means observed during tests performed with seat belt pretensioner‐based FCW modalities ranged from 235 to 287 seconds for conditions 18 and 7 respectively These values overlapped the comparable range of means recorded during tests performed
37
without seat belt pretensioner‐based FCW modalities which ranged from 284 to 351 seconds for conditions 12 and 3 respectively The mean value of the trials performed with no FCW alert (330 seconds) resided outside of the mean range established by the trials performed with seat belt pretensioning but within that observed without
Figure 64 Overall visual commitment duration presented as a function of FCW modality
The data shown in Figure 65 provide an indication that shorter periods of overall VC are closely associated with the ability of the participantsrsquo to avoid a crash The overall mean VC of the trials where the participants collided with the SLV was 354 percent longer than that observed when the crash was avoided (310 versus 229 seconds)
Figure 65 Overall visual commitment duration presented as a function of FCW modality and crash outcome
63 Visual Commitment to Onset of FCW Overall visual commitment can be broken down into two components the time from the onset of VC to the onset of the FCW (ie VCstartFCW) and from the onset of the FCW to completion of the VC (ie FCWVCend) Although it is certainly conceivable an FCW may affect the later of
38
these components it should not affect the former In other words regardless of what (if any) FCW modality was used for a particular trial the alert was always presented after VC had been initiated Assuming a normal distribution of drivers existed within and across the various FCW configurations type of FCW alert should be incapable of affecting when the driver was ultimately presented with it Figure 66 presents the distribution of VCstartFCW durations observed in this study Overall these durations ranged from 120 to 273 seconds with the mean values for each FCW modality ranging from 172 (configuration 23) to 202 seconds (configuration 3)
Figure 66 VCstartFCW duration presented as a function of FCW modality
Mean VCstartFCW durations observed during tests performed with seat belt pretensioner‐based FCW modalities ranged from 172 to 199 seconds for conditions 23 and 7 respectively These values overlapped the comparable (and nearly identical) range established during tests performed without seat belt pretensioner‐based FCW modalities from 178 to 202 seconds established during the conduct of conditions 12 and 3 The mean value of the trials performed with no FCW alert (191 seconds) resided within the ranges established by the trials performed with and without seat belt pretensioning The data shown in Figure 67 demonstrate good VCstartFCW consistency across each FCW modality regardless of whether the trials ultimately resulted in a crash or not and indicates the pre‐FCW alert driving behavior encouraged by the experimental design would not confound the analysis of crash outcome The mean VCstartFCW duration of the trials where the participants collided with the SLV (187 seconds) was nearly identical to that observed when the crash was avoided (189 seconds) differing by only 14 percent 64 Onset of FCW to End of Visual Commitment The data produced during this study indicate FCWVCend duration (ie response time) may be the most important time interval for determining the effectiveness of an FCW DVI If an FCW is
39
Figure 67 VCstartFCW duration presented as a function of FCW modality and crash outcome
capable of being detected acknowledged and correctly interpreted by the driver during the random number recall task used in this study the FCWVCend duration associated with that modality should be less than the time taken by a driver to return to their forward facing viewing position after simply completing the task Conceptually differences in FCWVCend should be in good agreement with the overall VC durations described earlier however the FCWVCend data are not vulnerable to the potentially confounding effect of VCstartFCW duration variability For this reason the FCWVCend metric is preferred for quantifying response time 641 General FCW to VCend Response Time Observations Figure 68 presents the distribution of FCWVCend durations observed for each FCW modality Overall these values ranged from 270 ms to 174 seconds The mean values for each FCW modality ranged from 593 ms to 149 seconds overall for configurations 18 and 3 respectively
Figure 68 FCWVCend duration presented as a function of FCW modality
40
Mean FCWVCend durations observed during tests performed with seat belt pretensioner‐based FCW modalities ranged from 593 ms to 104 seconds for conditions 18 and 7 respectively These values overlapped the comparable range of means established during tests performed without seat belt pretensioner‐based FCW modalities from 114 to 149 seconds recorded for conditions 12 and 3 respectively The mean value of the trials performed with no FCW alert (139 seconds) resided outside of the mean range established by the trials performed with seat belt pretensioning but within that observed without As expected the data shown in Figure 69 continue to indicate that shorter FCWVCend durations are closely associated with the ability of the participantsrsquo to avoid a crash The overall mean FCWVCend duration of the trials where the participants collided with the SLV was 1632 percent longer than that observed when the crash was avoided (124 seconds versus 470 ms)
Figure 69 FCWVCend duration presented as a function of FCW modality and crash outcome
642 Statistical Assessment of FCW to VCend Response Times Table 61 provides a summary of the data used to statistically compare the mean FCWVCend times shown in Figure 68 In this case the means associated with the FCW modality were found to be significantly different Typically the next step in this analysis would be to objectively rank with statistical significance the mean FCWVCend times in order from lowest (quickest response to the alert) to highest (slowest response to the alert) This was not possible because of the low number of subjects per condition (n) and because there are 28 possible unique pair‐wise comparisons between the eight different FCW alerts (8 nCr 2 = 28) Controlling the family‐wise error rate at alpha = 005 would have meant testing at alpha = 00528 or 000179 This would be particularly stringent given the low number of subjects To address the limitations imposed by the small sample size steps were taken to collapse across certain FCW modalities This process was intended to increase the number of samples per cell and to reduce the number of comparisons
41
Table 61 FCWVCend Comparison By Modality
Time from FCW to VCend (sec)
Condition Modality N Mean Std Dev Minimum Maximum Pr gt F
23 All 7 0840 0295 0400 1400
00002
3 Beep 8 1169 0373 0740 1740
12 BeepHUD 8 1051 0366 0540 1730
7 Belt 8 1035 0541 0400 1740
18 BeltBeep 8 0593 0359 0270 1200
13 BeltHUD 8 0743 0564 0330 1740
6 HUD 8 1491 0150 1270 1670
1 None 8 1390 0258 0930 1660
Subjective ranking of the mean FCWVCend times shown in Table 61 (ie sorting simply on FCWVCend magnitude) indicated HUD and no alert (none) had the slowest reaction times and were very close overall This seemed reasonable since the participants receiving the HUD alert were unable to detect its presentation when engaged in the random number recall task However to more objectively assess whether this assumption was correct (ie that HUD did not affect FCWVCend) the mean FCWVCend reaction times produced by four alert configurations containing HUD‐based alerts were compared to those produced by the comparable configurations without the HUD alert For example Belt only based reaction times were compared to the Belt + HUD reaction times Table 62 presents the results of this analysis and indicates the presence of the HUD did not significantly affect FCWVCend reaction times
Table 62 Testing the Effect of HUD on FCWVCend
Contrast DF Contrast SS Mean Square F Value Pr gt F
Compare Beep vs BeepHUD 1 005522500 005522500 037 05462
Compare BeltBeep vs All 1 022869000 022869000 153 02219
Compare Belt vs BeltHUD 1 034222500 034222500 228 01364
Compare None vs HUD 1 004100625 004100625 027 06029
Combining the comparable FCW alerts (with and without the HUD) shown in Table 62 provided four basic alert configurations As a courtesy to the reader these combinations were renamed and the convention used for the remainder of this report
Beep and BeepHUD Auditory
BeltBeep and All Auditory‐Haptic
Belt and BeltHUD Haptic
None and HUD None
42
Table 63 provides a statistical comparison of the mean FCWVCend reaction times for these four FCW configurations and indicates they were significantly different
Table 63 FCWVCend Comparison By Modality Collapsed
Time from FCW to VCend (sec) ndash Alerts With and Without HUD Combined
Modality N Mean Std Dev Minimum Maximum Pr gt F
Auditory 16 1110 0362 0540 1740
lt0001 Auditory‐Haptic 15 0708 0344 0270 1400
Haptic 16 0889 0555 0330 1740
None 16 1441 0210 0930 1670
With 15 to 16 samples per condition and only six possible unique pair‐wise comparisons between the four FCW alert configurations (4 nCr 2 = 6) it was possible to examine all pair‐wise comparisons and objectively rank mean FCWVCend reaction times The family‐wise error rate was again controlled at alpha = 005 meaning significant main effects would be less than alpha = 0056 or 000833 As indicated () in Table 64 three of these comparisons were significantly different
Table 64 FCWVCend Pair‐Wise Comparisons
Contrast DF Contrast SS Mean Square F Value Pr gt F
Compare Auditory vs Auditory‐Haptic 1 125112774 125112774 829 00055
Compare Auditory vs Haptic 1 039161250 039161250 259 01126
Compare Auditory vs None 1 087450313 087450313 579 00192
Compare Auditory‐Haptic vs Haptic 1 025293339 025293339 168 02005
Compare Auditory‐Haptic vs None 1 415540173 415540173 2753 lt0001
Compare Haptic vs None 1 243652813 243652813 1614 00002
Significant at the alpha = 000833 level
Table 65 presents the mean FCWVCend times previously shown in Table 63 sorted from quickest to slowest and an indication of where significant differences between configurations occurred In this table no mean was significantly different than an adjacent mean The significant differences exist at the extremes For example the mean FCWVCend times of the Auditory‐Haptic and Auditory only configurations were significantly different but the Auditory‐Haptic and Haptic only mean FCWVCend times were not
43
Table 65 Objective Ranking FCWVCend of Response Times
Rank of FCW to VCend (sec)
Relative Rank Modality MeanSignificant Differences
1 Auditory‐Haptic 0708 A B C
2 Haptic 0889 A B C
3 Auditory 1110 A B C
4 None 1441 A B C
Alert modalities with the same letter were not significantly different
The analysis presented in Table 66 indicates that on average women responded to the FCW configurations shown in Table 65 254 ms quicker than men and that this was a significant difference
Table 66 FCWVCend Response Times By Gender
Time from FCW to VCend (sec) ndash by Gender
Gender N Mean Std Dev Minimum Maximum Pr gt F
F 31 0913 0456 0330 1730 00294
M 32 1167 0451 0270 1740
Since both main effects evaluated in this section were significantly different the interaction term was examined for information‐purposes only Using a gender by FCW configuration model a significant interaction between gender and alert type was shown to exist The means from each gender by modality combination are shown in Table 67
Table 67 FCWVCend Response Times and Gender Interaction
Time from FCW to VCend (sec) ndash Modality by Gender
Modality Gender N Mean Std Dev Minimum Maximum Pr gt F
Auditory F 8 1001 0408 0540 1730
lt0001
M 8 1219 0295 0930 1740
Auditory‐Haptic F 7 0687 0335 0330 1200
M 8 0726 0374 0270 1400
Haptic F 8 0551 0302 0330 1070
M 8 1226 0555 0330 1740
None F 8 1383 0277 0930 1670
M 8 1499 0102 1330 1600
44
65 Time‐to‐Collision (TTC) at End of Visual Commitment In the previous section FCWVCend duration was mentioned as a good way to objectively quantify how quickly the participants responded to the various FCW alert modalities However once VCend had occurred knowing how the participants responded was also of interest To begin analysis of the participantsrsquo crash avoidance responses the TTC at VCend was considered This provided a way to describe how much time was available for the participants to avoid a collision with the SLV 651 General TTC at VCend Observations Figure 610 presents the distribution of TTC at VCend times observed in this study for each FCW modality Overall these values ranged from 319 ms to 187 seconds The mean values for each FCW modality ranged from 608 ms to 146 seconds overall for configurations 3 and 18 respectively
Figure 610 TTC at VCend presented as a function of FCW modality
The mean TTCs at VCend observed during tests performed with seat belt pretensioner‐based FCW modalities ranged from 103 to 146 seconds for conditions 7 and 18 respectively These values were outside of the comparable range of means recorded during tests performed without seat belt pretensioner‐based FCW modalities from 608 to 955 ms for conditions 3 and 12 respectively The mean TTC at VCend time observed when no FCW alert was presented (779 ms) was outside the mean range for tests performed with seat belt pretensioning but was inside the range defined by non‐pretensioner based trials Figures 65 and 69 presented previously indicated that VC duration adversely affected the likelihood that participants would avoid colliding with the SLV One benefit of the reduced VC duration is shown in Figure 611 the earlier VCend occurs the longer the TTC (assuming each subject uses a common vehicle speed) In other words the less time the driver spent with their eyes away from the road the more time they had available to decide on an appropriate
45
crash avoidance countermeasure Based on the data shown in Figure 611 the overall mean TTC at VCend of the trials resulting in a collision with the SLV was 908 percent shorter than that observed when the crash was avoided (837 ms versus 160 seconds)
Figure 611 TTC at VCend presented as a function of FCW modality and crash outcome
652 Statistical Assessment of TTC at VCend The statistical analysis provided in Section 64 demonstrated that the mean FCWVCend reaction times of ldquocomparablerdquo FCW alerts (with and without the HUD) can be combined Since TTC at VCend is based on the same VCend data used in this previous analysis (they have the same units but consider different intervals) re‐testing the validity of combining data in this manner was not necessary Table 68 provides a summary of the data used to statistically compare the mean TTC at VCend times shown in Figure 610 The results show the means of these four FCW configurations were significantly different which was consistent with the previous analyses
Table 68 TTC at VCend Comparison By Modality Collapsed
TTC at VCend (sec) ndash Alerts With and Without HUD Combined
Modality N Mean Std Dev Minimum Maximum Pr gt F
Auditory 16 0929 0359 0384 1501
00002 Auditory‐Haptic 15 1338 0351 0689 1872
Haptic 16 1181 0567 0319 1844
None 16 0693 0284 0357 1384
The six possible pair‐wise comparisons between the four FCW configurations were examined and the FCW alert modalities ranked Family‐wise error rate was controlled at alpha = 005 meaning significant main effects were less than alpha = 0056 or 000833 The results show that three of these comparisons were significantly different as indicated () in Table 69
46
Table 69 TTC at VCend Pair‐Wise Comparisons
Contrast DF Contrast SS Mean Square F Value Pr gt F
Compare Auditory vs Auditory‐Haptic 1 129613441 129613441 788 00067
Compare Auditory vs Haptic 1 050828403 050828403 309 00839
Compare Auditory vs None 1 044203503 044203503 269 01064
Compare Auditory‐Haptic vs Haptic 1 019108428 019108428 116 02853
Compare Auditory‐Haptic vs None 1 321314492 321314492 1955 lt0001
Compare Haptic vs None 1 189832612 189832612 1155 00012
Significant at the alpha = 000833 level
Table 610 presents the mean TTC at VCend times previously shown in Table 68 sorted from longest (best) to shortest (worse) and an indication of where significant differences between configurations occurred Like the findings discussed in Section 64 no mean was significantly different than an adjacent mean in Table 65 the significant differences existed at the extremes
Table 610 Objective Ranking of TTC at VCend
Rank of TTC at VCend (sec)
Relative Rank Modality MeanSignificant Differences
1 Auditory‐Haptic 1338 A B C
2 Haptic 1181 A B C
3 Auditory 0929 A B C
4 None 0693 A B C
Alert modalities with the same letter were not significantly different
The analysis presented in Table 611 indicates that because they responded to the FCW alert faster the mean TTC at VCend for the female participants was 287ms longer than that recorded for the males This was a significant difference
Table 611 TTC at VCend By Gender
TTC at VCend (sec) ndash by Gender
Gender N Mean Std Dev Minimum Maximum Pr gt F
F 31 1176 0441 0357 1774 00132
M 32 0889 0451 0319 1872
Since both main effects evaluated in this section were significantly different the interaction term was examined for information‐purposes only Using a gender by FCW configuration
47
model a significant interaction between gender and alert type was shown to exist The means from each gender by modality combination are shown in Table 612
Table 612 TTC at VCend and Gender Interaction
TTC at VCend (sec) ndash Modality by Gender
Modality Gender N Mean Std Dev Minimum Maximum Pr gt F
Auditory F 8 1073 0420 0384 1501
lt0001
M 8 0784 0229 0430 1120
Auditory‐Haptic F 7 1349 0347 0834 1729
M 8 1328 0379 0689 1872
Haptic F 8 1512 0295 1039 1774
M 8 0850 0593 0319 1844
None F 8 0793 0360 0357 1384
M 8 0594 0144 0378 0755
66 Throttle Release Response Time Acknowledgement of a SLV directly in the path of their vehicle occurred shortly after participants returned their view to a forward‐looking position From this point eight crash avoidance responses were possible ranging from nothing (ie no avoidance was attempted) to the various combinations of throttle release braking and steering An overall summary of these responses is provided in Table 613 In 59 of the 64 trials (922 percent) participants fully released the throttle as part of their crash avoidance response
Table 613 Crash Avoidance Response Summary (n=64)
Crash Avoidance Response of Participants
Crash Avoid Total
No Response 3 ‐‐ 3
Throttle Release Only 3 ‐‐ 3
Braking Only 1 ‐‐ 1
Steering Only ‐‐ 1 1
Throttle Release Braking 14 1 15
Throttle Release Steering 1 ‐‐ 1
Braking and Steering ‐‐ ‐‐ ‐‐
Throttle Release Braking Steering 25 15 40
During an attempt to release the throttle and apply the brakes one participant was unable to fully release the throttle before crashing into the SLV
48
661 General Throttle Release Time Observations 6611 Onset of FCW to Throttle Release Time Figure 612 presents the distribution of throttle release times measured from the onset of the FCW alert for each FCW modality Overall these values ranged from 260 ms to 205 seconds The mean values for each FCW modality ranged from 896 ms to 188 seconds overall for configurations 13 and 3 respectively The mean throttle release times from the onset of the seat belt pretensioner‐based FCW modalities ranged from 896 ms to 116 seconds for conditions 13 and 7 respectively The range of these values was outside of the comparable range of means recorded during tests performed without seat belt pretensioner‐based FCW modalities from 136 to 188 seconds for conditions 12 and 3 respectively The mean throttle release time observed when no FCW alert was presented (169 seconds) was outside the mean range for tests performed with seat belt pretensioning but was inside the range defined by pretensioner‐based trials
Figure 612 Throttle release times presented as a function of FCW modality
Given that most participants released the throttle shortly after VCend9 it is not surprising that
the throttle release data shown in Figure 613 closely resembles the FCWVCend duration data previously presented in Figure 65 both figures use the onset of FCW as the reference by which duration (Figure 65) or release time (Figure 613) was calculated The overall mean throttle release time of the trials where the participants collided with the SLV was 1173 percent longer than that observed when the crash was avoided (153 seconds versus 705 ms)
9 Three participants fully released the throttle before the FCW alert was presented Although it is unclear whether this was in response to being committed to the random number recall task or being used as an attempt to maintain the desired headway to the moving lead vehicle the throttle release was certainly not part of the participantsrsquo respective avoidance responses For this reason these three release times have been omitted from the throttle drop based charts and analyses discussed in this section so as to provide a more accurate portrayal of the relevant throttle‐brake phasing
49
Figure 613 Throttle release times presented as a function of FCW modality and crash outcome
6612 End of Visual Commitment to Throttle Release Time To better understand whether FCW modality affected the response time from VCend to the onset of throttle release the reaction time from FCW onset to VCend was removed from the data summarized in Section 661 Figure 614 presents the distribution of throttle release times measured from VCend for each FCW modality Overall these values ranged from ‐530 to 560 ms The mean values for each FCW modality ranged from 241 to 389 ms overall for configurations 7 and 13 respectively
Figure 614 Throttle release times presented from VCend as function of FCW modality and crash outcome
The negative release times shown in Figure 614 indicate some participants released the throttle before returning to a forward‐facing viewing position and do not include data from the three trials where the participants were not on the throttle at the time the FCW alert was presented (as previously mentioned in Section 6611) Not considering these data a total of four participants released throttle before VCend with response times of ‐115 ‐195 ‐210 and ‐530 ms These participants released the throttle 270 to 805 ms after receiving their respective
50
FCW alerts (for configurations 13 6 7 and 23 respectively) Note that three of these alerts were inclusive of the seat belt pretensioner The mean throttle release times associated with the seat belt pretensioner‐based FCW modalities (from VCend) ranged from 241 to 387 ms for conditions 7 and 18 respectively The range of these values overlapped the comparable range of means recorded during tests performed without seat belt pretensioner‐based FCW modalities from 269 to 389 ms for by conditions 6 and 3 respectively The mean throttle release time observed when no FCW alert was presented (328 ms) was inside the mean ranges for trials performed with and without seat belt pretensioning Figure 615 presents the data previously shown in Figure 614 but separated as a function of crash outcome Overall these data imply that while FCW modality can affect the driverrsquos response time from FCW onset to VCend it does not appear to affect the time taken from VCend to initiation of the throttle release This is discussed in greater detail in Section 6622
Figure 615 Throttle release times presented from VCend as function of FCW modality and crash outcome
662 Statistical Assessment of Throttle Release Times In this section two analyses of throttle release time are provided First mean release times from FCW alert onset are discussed In the second analysis release times from VCend are considered 6621 Throttle Release from FCW Onset In Section 64 an analysis was performed to verify that results from trials performed with FCW alerts differing only by the presence of a HUD could be combined In this section the process used in Section 64 was repeated because the data analyzed was produced after VCend (ie the throttle was released after the driver had returned their view to a forward‐facing position This was a concern because of the HUD‐based alert duration in every case where it was used it remained on for 23 to 37 seconds after VCend Therefore while the HUD was not detectable
51
by participants engaged in the random number recall task participants did have an opportunity to notice and respond to the HUD shortly after task completion (but before crashing into the SLV) Had this occurred time to throttle release brake application andor to avoidance steering may have been affected Table 614 provides a summary of the data used to statistically compare the mean throttle release times shown in Figure 612 The results show the means of these eight FCW modalities were significantly different
Table 614 Throttle Release Response Time from FCW Onset
Time from FCW to Throttle Release (sec)
Condition Modality N Mean Std Dev Minimum Maximum Pr gt F
23 All 8 1061 0424 0270 1730
00002
3 Beep 8 1438 0419 0805 2050
12 BeepHUD 8 1361 0377 0825 2020
7 Belt 5 1163 0609 0260 1740
18 BeltBeep 8 0979 0345 0615 1510
13 BeltHUD 6 0896 0571 0285 1720
6 HUD 8 1880 0098 1740 2020
1 None 5 1686 0262 1365 1915
Pair‐wise comparisons were made between the four FCW modalities not inclusive of the HUD with the corresponding configurations that were The results shown in Table 615 indicate the mean throttle release times of comparable alerts were not significantly different
Table 615 Testing the Effect of HUD on Throttle Release Time from FCW Onset
Contrast DF Contrast SS Mean Square F Value Pr gt F
Compare Beep vs BeepHUD 1 002325625 002325625 014 07064
Compare BeltBeep vs All 1 002681406 002681406 017 06859
Compare Belt vs BeltHUD 1 019466735 019466735 120 02784
Compare None vs HUD 1 011580308 011580308 071 04020
Table 616 provides a summary of the paired data used to statistically compare the mean throttle release times associated with the four combined FCW modalities The results show the means were significantly different which is consistent with the first analysis discussed in this section
52
Table 616 Throttle Release Time from FCW Onset Comparison By Modality Collapsed
FCW to Throttle Release (sec) ndash Alerts With and Without HUD Combined
Modality N Mean Std Dev Minimum Maximum Pr gt F
Auditory 16 1399 0387 0805 2050
lt0001 Auditory‐Haptic 15 1020 0376 0270 1730
Haptic 16 1017 0575 0260 1740
None 16 1805 0195 1365 2020
Six possible pair‐wise comparisons between the four FCW‐alert combinations were examined and the FCW alert modalities ranked Family‐wise error rate was controlled at alpha = 005 meaning significant main effects would be less than alpha = 0056 or 000833 The results show that three of these comparisons were significantly different they are marked with an () in Table 617
Table 617 Throttle Release Time from FCW Onset Pair‐Wise Comparisons
Contrast DF Contrast SS Mean Square F Value Pr gt F
Compare Auditory vs Auditory‐Haptic 1 114950703 114950703 735 00091
Compare Auditory vs Haptic 1 095171770 095171770 608 00170
Compare Auditory vs None 1 118232800 118232800 756 00082
Compare Auditory‐Haptic vs Haptic 1 000006023 000006023 000 09844
Compare Auditory‐Haptic vs None 1 442063280 442063280 2825 lt0001
Compare Haptic vs None 1 370084207 370084207 2365 lt0001
Significant at the alpha = 000833 level
Table 618 presents the mean throttle release times previously shown in Table 616 sorted from lowest (best) to highest (worse) and an indication of where significant differences between modalities occurred
Table 618 Objective Ranking of Throttle Release Time from FCW Onset
Rank of FCW to Throttle Release (sec)
Relative Rank
Modality MeanSignificant Differences
1 Haptic 1017 A B C
2 Auditory‐Haptic 1020 A B C
3 Auditory 1399 A B C
4 None 1805 A B C
Alert modalities with the same letter were not significantly different
53
The analysis presented in Table 619 indicates that there was no significant difference between the mean throttle release times from FCW onset for the male and female participants
Table 619 Throttle Release Time from FCW Onset by Gender
FCW to Throttle Release (sec) ndash by Gender
Gender N Mean Std Dev Minimum Maximum Pr gt F
F 30 1231 0501 0260 2020 02062
M 26 1402 0492 0270 2050
Since one of the main effects evaluated in this section was significantly different the interaction term was examined for information‐purposes only Using a gender by FCW configuration model a significant interaction between gender and alert type was shown to exist The means from each gender by modality combination are shown in Table 620
Table 620 Throttle Release Time from FCW Onset and Gender Interaction
FCW to Throttle Release (sec) ndash Modality by Gender
Modality Gender N Mean Std Dev Minimum Maximum Pr gt F
Auditory F 8 1331 0384 0825 2020
lt0001
M 8 1468 0404 0805 2050
Auditory‐Haptic F 8 1070 0271 0805 1510
M 8 0971 0473 0270 1730
Haptic F 7 0761 0491 0260 1405
M 4 1466 0445 0805 1740
None F 7 1772 0259 1365 2020
M 6 1844 0090 1740 1960
6622 Throttle Release from End of Visual Commitment Table 621 provides a summary of the data used to statistically compare the mean throttle release times from VCend shown in Figure 614 The results show the means of these eight FCW configurations were not significantly different indicating the significant release time differences described in Section 6621 were the result of the significant differences in FCWVCend durations discussed in Section 64
54
Table 621 Throttle Release Response Time from VCend
Time from VCend to Throttle Release (sec)
Condition Modality Mean Std Dev Minimum Maximum Pr gt F
23 All 0246 0343 ‐0530 0405
06703
3 Beep 0269 0194 ‐0195 0405
12 BeepHUD 0310 0068 0170 0380
7 Belt 0241 0262 ‐0210 0445
18 BeltBeep 0387 0084 0245 0500
13 BeltHUD 0263 0252 ‐0115 0475
6 HUD 0389 0080 0280 0560
1 None 0328 0066 0255 0435
Pair‐wise comparisons were made between the four FCW configurations not based on the HUD with the corresponding configurations that were The results shown in Table 622 indicate the mean throttle release times from VCend of comparable alerts were not significantly different
Table 622 Testing the Effect of HUD on Throttle Release Time from VCend
Contrast DF Contrast SS Mean Square F Value Pr gt F
Compare Beep vs BeepHUD 1 000680625 000680625 019 06669
Compare BeltBeep vs All 1 007439170 007439170 205 01588
Compare Belt vs BeltHUD 1 000126068 000126068 003 08529
Compare None vs HUD 1 001135558 001135558 031 05786
Table 623 provides a summary of the paired data used to statistically compare the mean throttle release times from VCend associated with the four combined FCW configurations The results show the means were not significantly different which is consistent with the first analysis discussed in this section
Table 623 Throttle Release Time from VCend Comparison By Modality Collapsed
VCend to Throttle Release (sec) ndash Alerts With and Without HUD Combined
Modality N Mean Std Dev Minimum Maximum Pr gt F
Auditory 16 0289 0142 ‐0195 0405
05007 Auditory‐Haptic 15 0321 0244 ‐0530 0500
Haptic 11 0253 0244 ‐0210 0475
None 13 0365 0078 0255 0560
The analysis presented in Table 624 indicates that there was no significant difference between the mean throttle release times from VCend for the male and female participants
55
Table 624 Throttle Release Time from VCend by Gender
VCend to Throttle Release (sec) ndash by Gender
Gender N Mean Std Dev Minimum Maximum Pr gt F
F 29 0325 0169 ‐0210 0560 04977
M 26 0290 0207 ‐0530 0475
67 Brake Application Response Time In 56 of the 64 trials (875 percent) participants applied force to the brake pedal as part of their crash avoidance response In 40 of these 56 instances (714 percent) the participants also used steering during their respective avoidance responses In 11 of 40 trials (275 percent) participants began braking before steering Steering preceded braking during 28 of 40 trials (700 percent) A simultaneous input of braking and steering was observed during one trial (25 percent) A summary of these data are shown in Table 625
Table 625 Brake Steer Response Summary (n=40)
Crash Avoidance Response of Participants
Crash Avoid Total
Brake Steer 3 7 11
Steer Brake 21 7 28
Simultaneous Inputs (Brake and Steer) ‐‐ 1 1
671 General Brake Application Response Time Observations 6711 Onset of FCW to Brake Application Response Time Figure 616 presents the distribution of brake application response times measured from the onset of the FCW alert for each FCW modality Overall these values ranged from 700 ms to 220 seconds The mean values for each FCW modality ranged from 109 to 200 seconds overall for configurations 18 and 3 respectively The mean brake application times from the onset of the seat belt pretensioner‐based FCW modalities ranged 109 to 1436 seconds for conditions 18 and 7 respectively The range of these values was just outside of the comparable range of means recorded during tests performed without seat belt pretensioner‐based FCW modalities from 1437 to 200 seconds for conditions 12 and 3 respectively The mean brake application time observed when no FCW alert was presented (180 seconds) was outside the mean range for tests performed with seat belt pretensioning but was inside the range defined by pretensioner‐based trials Recalling the data previously presented in Table 61 in each of the 55 instances where the avoidance responses included braking a throttle release always preceded the brake application When brake applications were used the inputs were applied 265 to 630 ms after
56
VCend (as described in Section 6712) and 40 to 795 ms after the throttle was fully released10 Mean reaction times from VCend and throttle release were 464 and 167 ms respectively11
Figure 616 Brake application times presented as a function of FCW modality
Given the close proximity of the brake application to VCend and the time of throttle release it is not surprising that presentation of the brake application data shown in Figure 617 closely resembles the FCWVCend duration and FCWthrottle release time data previously presented in Figures 69 and 613 respectively
Figure 617 Brake application times presented as a function of FCW modality and crash outcome
10 During an attempt to release the throttle and apply the brakes one participant was unable to fully release the throttle This attempt was classified as ldquoBraking Onlyrdquo in Table 613 11 Three participants fully released the throttle before the FCW alert was presented Although it is unclear whether this was in response to being committed to the random number recall task or being used as an attempt to maintain the desired headway to the moving lead vehicle the throttle release was certainly not part of the participantsrsquo respective avoidance responses For this reason these three release times have been omitted from the throttle drop based charts and analyses discussed in this section so as to provide a more accurate portrayal of the relevant throttle‐steer phasing
57
The overall mean brake application time of the trials where the participants collided with the SLV was 745 percent longer than that observed when the crash was avoided (165 seconds versus 945 ms) 6712 End of Visual Commitment to Brake Application Response Time To better understand whether FCW modality affected the response time from VCend to the onset of brake application the reaction time from FCW onset to VCend was removed from the data summarized in Section 671 Figure 618 presents the distribution of brake application response times measured from VCend for each FCW modality Overall these values ranged from 265 to 630 ms The mean values for each FCW modality ranged from 407 to 524 ms overall for configurations 12 and 3 respectively
Figure 618 Brake application times presented from VCend as function of FCW modality
The mean brake application times associated with the seat belt pretensioner‐based FCW modalities (from VCend) ranged from 459 to 496 ms for conditions 23 and 13 respectively The range of these values was entirely within the comparable range of means recorded during tests performed without seat belt pretensioner‐based FCW modalities from 407 to 524 ms for by conditions 12 and 3 respectively The mean brake application time observed when no FCW alert was presented (442 ms) was inside the mean range for tests performed without seat belt pretensioning but was just outside the range defined by pretensioner‐based trials Figure 619 presents the data previously shown in Figure 618 but separated as a function of crash outcome Overall these data imply that while FCW modality can affect the driverrsquos response time from FCW onset to VCend it does not appear to affect the time taken from VCend to initiation of the brake application This is discussed in greater detail in Section 6722
58
Figure 619 Brake application times presented from VCend as function of FCW modality and crash outcome
672 Statistical Assessment of Brake Application Response Times In a manner consistent with that used to discuss the statistical significance of throttle release time this section provides two analyses of brake application response time First mean application times from FCW alert onset are discussed In the second analysis application times from VCend are considered 6721 Brake Application Time from FCW Onset Table 626 provides a summary of the data used to statistically compare the mean FCW to brake application times shown in Figure 616 The results show the means of these eight FCW configurations were significantly different
Table 626 Brake Application Time from FCW Onset
Time from FCW to Brake Application (sec)
Condition Modality N Mean Std Dev Minimum Maximum Pr gt F
23 All 8 1263 0320 0750 1825
00002
3 Beep 8 1598 0351 1260 2140
12 BeepHUD 7 1437 0384 0905 2070
7 Belt 7 1436 0489 0895 2070
18 BeltBeep 8 1087 0362 0700 1645
13 BeltHUD 6 1129 0428 0775 1795
6 HUD 5 2002 0129 1840 2195
1 None 7 1802 0207 1475 2000
Pair‐wise comparisons were made between the four FCW configurations not inclusive of the HUD with the corresponding configurations that were The results shown in Table 627
59
indicate the mean FCW to brake application times of comparable alerts were not significantly different
Table 627 Testing the Effect of HUD on Brake Application Time from FCW Onset
Contrast DF Contrast SS Mean Square F Value Pr gt F
Compare Beep vs BeepHUD 1 009600048 009600048 076 03872
Compare BeltBeep vs All 1 012425625 012425625 099 03258
Compare Belt vs BeltHUD 1 030501653 030501653 242 01264
Compare None vs HUD 1 011650006 011650006 092 03413
Table 628 provides a summary of the paired data used to statistically compare the mean brake application times associated with the four combined FCW configurations The results show the means were significantly different which is consistent with the first analysis discussed in this section
Table 628 Brake Application Time from FCW Onset Comparison By Modality Collapsed
FCW to Brake Application (sec) ndash Alerts With and Without HUD Combined
Modality N Mean Std Dev Minimum Maximum Pr gt F
Auditory 15 1523 0363 0905 2140
lt0001 Auditory‐Haptic 16 1175 0342 0700 1825
Haptic 13 1295 0470 0775 2070
None 12 1885 0200 1475 2195
Six possible pair‐wise comparisons between the four FCW‐alert combinations were examined and the FCW alert modalities ranked Family‐wise error rate was controlled at alpha = 005 meaning significant main effects would be less than alpha = 0056 or 000833 The results show that two of these comparisons were significantly different they are marked with an () in Table 629
Table 629 Brake Application Time from FCW Onset Pair‐Wise Comparisons
Contrast DF Contrast SS Mean Square F Value Pr gt F
Compare Auditory vs Auditory‐Haptic 1 093578409 093578409 727 00094
Compare Auditory vs Haptic 1 036219430 036219430 281 00995
Compare Auditory vs None 1 087725042 087725042 681 00118
Compare Auditory‐Haptic vs Haptic 1 010262175 010262175 080 03761
Compare Auditory‐Haptic vs None 1 346074405 346074405 2688 lt0001
Compare Haptic vs None 1 217804801 217804801 1692 00001
Significant at the alpha = 000833 level
60
Table 630 presents the mean FCW to brake application times previously shown in Table 628 sorted from lowest (best) to highest (worse) and an indication of where significant differences between configurations occurred
Table 630 Objective Ranking of Brake Application Time from FCW Onset
Rank of FCW to Brake Application (sec)
Relative Rank
Modality MeanSignificantDifferences
1 Auditory‐Haptic 1175 A B C
2 Haptic 1295 A B C
3 Auditory 1523 A B C
4 None 1885 A B C
Alert modalities with the same letter were not significantly different
The analysis presented in Table 631 indicates that there was no significant difference between the mean throttle release times from FCW onset for the male and female participants
Table 631 Brake Application Time from FCW Onset by Gender
FCW to Brake Application (sec) ndash by Gender
Gender N Mean Std Dev Minimum Maximum Pr gt F
F 30 1360 0407 0775 2195 01047
M 26 1550 0458 0700 2140
Since one of the main effects evaluated in this section was significantly different the interaction term was examined for information‐purposes only Using a gender by FCW‐alert combination model a significant interaction between gender and modality was shown to exist The means from each gender by modality combination are shown in the Table 632
Table 632 Brake Application Time from FCW Onset and Gender Interaction
FCW to Brake Application (sec) ndash Modality by Gender
Modality Gender N Mean Std Dev Minimum Maximum Pr gt F
Auditory F 8 1428 0377 0905 2070
lt0001
M 7 1631 0338 1320 2140
Auditory‐Haptic F 8 1234 0262 0930 1645
M 8 1116 0418 0700 1825
Haptic F 8 1056 0302 0775 1540
M 5 1677 0455 0895 2070
None F 6 1842 0282 1475 2195
M 6 1929 0061 1840 1995
61
6722 Brake Application Time from End of Visual Commitment Table 633 provides a summary of the data used to statistically compare the mean brake application times from VCend shown in Figure 618 The results show the means of these eight FCW configurations were not significantly different indicating the significant application time differences described in Section 6721 were the result of the significant differences in the FCWVCend durations discussed in Section 64
Table 633 Brake Application Time from VCend
Time from VCend to Brake Application (sec)
Condition Modality Mean Std Dev Minimum Maximum Pr gt F
23 All 0459 0092 0265 0535
01205
3 Beep 0429 0059 0340 0525
12 BeepHUD 0407 0057 0340 0490
7 Belt 0472 0083 0330 0575
18 BeltBeep 0494 0093 0355 0630
13 BeltHUD 0496 0076 0395 0580
6 HUD 0524 0044 0455 0560
1 None 0442 0068 0340 0545
Pair‐wise comparisons were made between the four FCW configurations not based on the HUD with the corresponding configurations that were The results shown in Table 634 indicate the VCend to brake application times of comparable alerts were not significantly different
Table 634 Testing the Effect of HUD on Brake Application Time from VCend
Contrast DF Contrast SS Mean Square F Value Pr gt F
Compare Beep vs BeepHUD 1 000174298 000174298 031 05778
Compare BeltBeep vs All 1 000478574 000478574 086 03577
Compare Belt vs BeltHUD 1 000181323 000181323 033 05702
Compare None vs HUD 1 001954339 001954339 352 00667
Table 635 provides a summary of the paired data used to statistically compare the mean VCend to brake application times associated with the four combined FCW configurations The results show the means were not significantly different which is consistent with the first analysis discussed in this section The analysis presented in Table 636 indicates that following VCend male participants applied force to the brake pedal an average of 50 ms quicker than the females This was a marginally significant difference
62
Table 635 Brake Application Time from VCend Comparison By Modality Collapsed
VCend to Brake Application (sec) ndash Alerts With and Without HUD Combined
Modality N Mean Std Dev Minimum Maximum Pr gt F
Auditory 15 0419 0057 0340 0525
00825 Auditory‐Haptic 15 0478 0091 0265 0630
Haptic 13 0483 0077 0330 0580
None 12 0476 0071 0340 0560
Table 636 Brake Application Time from VCend by Gender
VCend to Brake Application (sec) ndash by Gender
Gender N Mean Std Dev Minimum Maximum Pr gt F
F 29 0486 0074 0340 0630 00153
M 26 0436 0074 0265 0565
Since one of the main effects evaluated in this section was significantly different the interaction term was examined for information‐purposes only Using a gender by FCW configuration model a significant interaction between gender and alert type was shown to exist The means from each gender by modality combination are shown in Table 637
Table 637 Brake Application Time from VCend and Gender Interaction
VCend to Brake Application (sec) ndash Modality by Gender
Modality Gender N Mean Std Dev Minimum Maximum Pr gt F
Auditory F 8 0426 0063 0340 0525
00228
M 7 0410 0053 0340 0490
Auditory‐Haptic F 7 0533 0064 0445 0630
M 8 0429 0086 0265 0530
Haptic F 8 0504 0054 0445 0580
M 5 0449 0102 0330 0565
None F 6 0488 0084 0340 0560
M 6 0464 0060 0395 0560
68 Avoidance Steer Response Time In 42 of the 64 trials (656 percent) participants used steering inputs as part of their crash avoidance response During 40 of 42 trials (952 percent) these responses also included braking In 33 of the 42 trials with steering (786 percent) the participantsrsquo primary avoidance attempt was to the left of the SLV (ie following the path of the MLV around the SLV) A direction of steer response summary is shown in Table 638
63
Table 638 Direction of Steer Summary (n=42)
Crash Avoidance Response
of Participants
Left Steer Right Steer
Crash Avoid Total Crash Avoid Total
Steering Only ‐‐ 1 1 ‐‐ ‐‐ ‐‐
Throttle Release and Steering 1 ‐‐ 1 ‐‐ ‐‐ ‐‐
Brake Steer 3 6 9 1 1 2
Steer Brake 17 3 21 3 4 7
Simultaneous Inputs (Brake and Steer) ‐‐ 1 1 ‐‐ ‐‐ ‐‐
Overall 33 9
681 General Avoidance Steer Response Time Observations 6811 Onset of FCW to Avoidance Steering Input Figure 620 presents the distribution of avoidance steer response times measured from the onset of the FCW alert for each FCW modality Overall these values ranged from 635 ms to 214 seconds The mean values for each FCW modality ranged from 960 ms to 180 seconds overall for configurations 13 and 3 respectively
Figure 620 Avoidance steer response times presented as a function of FCW modality
The range of mean avoidance steer response times from the onset of the seat belt pretensioner‐based FCW modalities ranged 960 ms to 130 seconds for conditions 13 and 23 respectively The range of these values overlapped that of the comparable range of means recorded during tests performed without seat belt pretensioner‐based FCW modalities from 124 to 180 seconds for conditions 12 and 3 respectively The mean avoidance steer time observed when no FCW alert was presented (173 seconds) was outside the mean range for tests performed with seat belt pretensioning but was inside the range defined by pretensioner‐based trials
64
For the 42 of the 64 participants who used steering inputs the initiation of these inputs occurred 85 to 690 ms after VCend (described in greater detail in Section 682) with a mean gap time of 395 ms Unlike the trend observed when evaluating the relationship of throttle release and brake application not all participants released the throttle before initiating their avoidance steer inputs For 15 trials initiation of steering preceded release of the throttle by 5 to 315 ms with a mean gap time of 69 ms For 23 trials12 initiation of steering occurred 5 to 950 ms after the throttle was fully released with a mean gap time of 195 ms Figure 621 presents the distribution of avoidance steer response times presented as a function of FCW modality and crash outcome Given the close proximity of the avoidance steer initiation to VCend and the time of throttle release it is not surprising that presentation of the steering response time data shown in Figure 619 closely resembles the FCWVCend duration FCWthrottle release time and FCWbrake application time data previously presented in Figures 69 613 and 617 respectively The overall mean avoidance steer response time of the trials where the participants collided with the SLV was 663 percent longer than that observed when the crash was avoided (156 seconds versus 939 ms)
Figure 621 Avoidance steer response times presented as a function of FCW modality and crash outcome
6812 End of Visual Commitment to An Avoidance Steering Input To better understand whether FCW modality affected the response time from VCend to the onset of avoidance steering the reaction time from FCWVCend was removed from the data summarized in Section 681 Figure 622 presents the distribution of avoidance steer response times measured from the VCend for each FCW modality Overall these values ranged from 85 to
12 Three participants fully released the throttle before the FCW alert was presented Although it is unclear whether this was in response to being committed to the random number recall task or being used as an attempt to maintain the desired headway to the moving lead vehicle the throttle release was certainly not part of the participantsrsquo respective avoidance responses For this reason these three release times have been omitted from the throttle drop based charts and analyses discussed in this section so as to provide a more accurate portrayal of the relevant throttle‐steer phasing
65
690 ms The mean values for each FCW modality ranged from 344 to 467 ms overall for configurations 23 and 7 respectively
Figure 622 Avoidance steer response times presented from VCend as function of FCW modality and crash outcome
The mean avoidance steer times associated with the seat belt pretensioner‐based FCW modalities (from VCend) ranged from 344 to 467 ms for conditions 23 and 7 respectively The range of these values completely contained the comparable range of means recorded during tests performed without seat belt pretensioner‐based FCW modalities from 348 to 369 for conditions 3 and 6 respectively The mean brake application time observed when no FCW alert was presented (415 ms) was also inside the mean range for tests performed with seat belt pretensioner‐based alerts but was outside the range defined by trials without pretensioning Figure 623 presents the data previously shown in Figure 622 but separated as a function of crash outcome These data imply that while FCW modality significantly affected the participantsrsquo FCWVCend mean response times it does not appear to affect the time taken from VCend to initiation of the avoidance steer
Figure 623 Avoidance steer response times presented from VCend as function of FCW modality and crash outcome
66
682 Statistical Assessment of Avoidance Steer Response Times In a manner consistent with that used to discuss the statistical significance of throttle release and brake application times this section provides two analyses of avoidance steer response time First mean response times from FCW alert onset are discussed In the second analysis response times from VCend are considered 6821 Onset of FCW to Avoidance Steer Response Time Table 639 provides a summary of the data used to statistically compare the mean FCW to avoidance steer response times shown in Figure 620 The results show the means of these eight FCW configurations were significantly different
Table 639 Avoidance Steer Response Time from FCW Onset
Time from FCW to Steering Input (sec)
Condition Modality Mean Std Dev Minimum Maximum Pr gt F
23 All 1300 0251 0955 1715
00006
3 Beep 1533 0408 1140 2135
12 BeepHUD 1235 0299 0815 1565
7 Belt 1255 0325 0975 1635
18 BeltBeep 1007 0417 0635 1570
13 BeltHUD 0960 0358 0740 1680
6 HUD 1800 0124 1660 1955
1 None 1733 0147 1550 1875
Pair‐wise comparisons were made between the four FCW configurations not inclusive of the HUD with the corresponding configurations that were The results shown in Table 640 indicate the mean FCW to avoidance steer response times of comparable alerts were not significantly different
Table 640 Testing the Effect of HUD on Avoidance Steer Response Time from FCW Onset
Contrast DF Contrast SS Mean Square F Value Pr gt F
Compare Beep vs BeepHUD 1 022201000 022201000 222 01456
Compare BeltBeep vs All 1 025813333 025813333 258 01176
Compare Belt vs BeltHUD 1 023734091 023734091 237 01329
Compare None vs HUD 1 001012500 001012500 010 07524
67
Table 641 provides a summary of the paired data used to statistically compare the mean avoidance steer response times associated with the four combined FCW configurations The results show the means were significantly different which is consistent with the first analysis discussed in this section
Table 641 Avoidance Steer Response Time from FCW Onset Comparison By Modality Collapsed
FCW to Steering Input (sec) ndash Alerts With and Without HUD Combined
Modality N Mean Std Dev Minimum Maximum Pr gt F
Auditory 10 1384 0372 0815 2135
00002 Auditory‐Haptic 12 1153 0362 0635 1715
Haptic 11 1094 0361 0740 1680
None 9 1770 0131 1550 1955
Six possible pair‐wise comparisons between the four FCW‐alert combinations were examined and the FCW alert modalities ranked Family‐wise error rate was controlled at alpha = 005 meaning significant main effects would be less than alpha = 0056 or 000833 The results show that two of these comparisons were significantly different they are marked with an () in Table 642
Table 642 Avoidance Steer Response Time from FCW Onset Pair‐Wise Comparisons
Contrast DF Contrast SS Mean Square F Value Pr gt F
Compare Auditory vs Auditory‐Haptic 1 029022061 029022061 267 01105
Compare Auditory vs Haptic 1 044024766 044024766 405 00513
Compare Auditory vs None 1 070577053 070577053 649 00150
Compare Auditory‐Haptic vs Haptic 1 002014242 002014242 019 06693
Compare Auditory‐Haptic vs None 1 195571429 195571429 1799 00001
Compare Haptic vs None 1 226142284 226142284 2080 lt0001
Significant at the alpha = 000833 level
Table 643 presents the mean FCW to avoidance steer response times previously shown in Table 641 sorted from lowest (best) to highest (worse) and an indication of where significant differences between configurations occurred The analysis presented in Table 644 indicates there was no significant difference between the mean avoidance steer response times from FCW onset for the male and female participants Since one of the main effects was significantly different the interaction term was examined for information‐purposes only Using a gender by FCW‐alert combination model a significant interaction between gender and modality was shown to exist The means from each gender by modality combination are shown in Table 645
68
Table 643 Objective Ranking of Avoidance Steer Response Time from FCW Onset
Rank of FCW to Steering Input (sec)
Relative Rank
Modality MeanSignificant Differences
1 Haptic 1094 A B C
2 Auditory‐Haptic 1153 A B C
3 Auditory 1384 A B C
4 None 1770 A B C
Alert modalities with the same letter were not significantly different
Table 644 Avoidance Steer Response Time from FCW Onset by Gender
FCW to Steering Input (sec) ndash by Gender
Gender N Mean Std Dev Minimum Maximum Pr gt F
F 21 1249 0386 0740 1955 02350
M 21 1401 0429 0635 2135
Table 645 Avoidance Steer Response Time from FCW Onset and Gender Interaction
FCW to Steering Input (sec) ndash Modality by Gender
Modality Gender N Mean Std Dev Minimum Maximum Pr gt F
Auditory F 6 1241 0323 0815 1680
00003
M 4 1599 0373 1280 2135
Auditory‐Haptic F 4 1198 0341 0865 1570
M 8 1131 0393 0635 1715
Haptic F 6 0894 0144 0740 1090
M 5 1334 0410 0860 1680
None F 5 1726 0153 1550 1955
M 4 1825 0085 1705 1895
6822 End of Visual Commitment to Avoidance Steer Response Time Table 646 provides a summary of the data used to statistically compare the mean avoidance steer response times from VCend shown in Figure 622 The results show the means of these eight FCW configurations were not significantly different indicating the significant release time differences described in Section 6821 were the result of the significant differences in FCWVCend duration discussed in Section 64
69
Table 646 Avoidance Steer Response Time from VCend
Time from VCend to Steering Input (sec)
Condition Modality Mean Std Dev Minimum Maximum Pr gt F
23 All 0344 0173 0085 0560
06980
3 Beep 0369 0051 0280 0400
12 BeepHUD 0367 0063 0275 0445
7 Belt 0467 0189 0240 0690
18 BeltBeep 0418 0118 0250 0570
13 BeltHUD 0427 0100 0280 0585
6 HUD 0348 0041 0295 0390
1 None 0415 0147 0275 0620
Pair‐wise comparisons were made between the four FCW configurations not inclusive of the HUD with the corresponding configurations that were The results shown in Table 647 indicate the VCend to avoidance steer response times of comparable alerts were not significantly different
Table 647 Testing the Effect of HUD on Avoidance Steer Response Time from VCend
Contrast DF Contrast SS Mean Square F Value Pr gt F
Compare Beep vs BeepHUD 1 000001000 000001000 000 09793
Compare BeltBeep vs All 1 001506939 001506939 103 03170
Compare Belt vs BeltHUD 1 000443667 000443667 030 05851
Compare None vs HUD 1 000997556 000997556 068 04143
Table 648 provides a summary of the paired data used to statistically compare the mean VCend to avoidance steer response times associated with the four combined FCW configurations The results show the means were not significantly different which is consistent with the previous analyses discussed in this section
Table 648 Avoidance Steer Response Time from VCend Comparison By Modality Collapsed
VCend to Steering Input (sec) ndash Alerts With and Without HUD Combined
Modality N Mean Std Dev Minimum Maximum Pr gt F
Auditory 10 0368 0054 0275 0445
04346 Auditory‐Haptic 11 0385 0143 0085 0570
Haptic 11 0445 0141 0240 0690
None 9 0378 0101 0275 0620
70
The analysis presented in Table 649 indicates that there was no significant difference between the mean VCend to avoidance steer response times for the male and female participants
Table 649 Avoidance Steer Response Time from VCend by Gender
VCend to Steering Input (sec) ndash by Gender
Gender N Mean Std Dev Minimum Maximum Pr gt F
F 20 0407 0136 0085 0690 05377
M 21 0384 0099 0240 0585
71
70 CRASH AVOIDANCE INPUT MAGNITUDES To quantify the magnitudes of the participantsrsquo crash avoidance attempts peak steering and brake force inputs were considered The effect of FCW alert modality on these parameters is discussed in this section 71 Peak Brake Pedal Force 711 General Assessment of Peak Brake Pedal Force As previously stated 875 percent applied force to the brake pedal in an attempt to avoid the SLV Similar to the process used to assess peak steering wheel angle peak force was measured from the onset of the FCW alert through the time when the front of the SV crossed the vertical plane established by the rear of the SLV 13 For some participants this process reported a brake force magnitude less than the absolute maximum value observed during their respective trial With respect to crash avoidance this was deemed acceptable since any post‐crash input applied by a driver would have no real world relevance However understanding how the authors used this process is important as it explains how it was possible for an application with a very low ldquopeakrdquo input to still be categorized as an avoidance attempt Consider for example the case of a participant who began braking only 40 ms before they impacted the SLV Since the period of consideration for peak force magnitude ends at when the longitudinal range from the SV to the SLV was zero there was only enough time for an application magnitude of 05 lbs to be applied before the impact occurred Figure 71 presents the distribution of peak brake force magnitudes observed during this study14 Overall these values ranged from 05 to 2718 lbf and 946 percent of these magnitudes (53 of 56 trials) resided within the range of inputs established with configuration 23 (from 177 to 2718 lbf) The mean values for each FCW modality ranged from 275 to 1199 lbf overall for configurations 3 and 23 respectively The mean peak brake forces associated with the seat belt pretensioner‐based FCW modalities ranged from 514 to 1199 lbf for conditions 7 and 23 respectively The range of these values overlapped the comparable range of means recorded during tests performed without seat belt pretensioner‐based FCW modalities from 275 to 710 for conditions 3 and 12 respectively The mean peak brake force observed when no FCW alert was presented (1013 lbf) was outside the mean range for tests performed without seat belt pretensioning but was inside the range defined by pretensioner‐based trials
13 In three cases the SV came to a stop before the SV headway became zero For these trials the measured period was from the onset of the FCW alert to the time when the SV came to a stop
14 Two participants applied force away from the load cell used to measure force magnitude As a result no valid force data were available for these trials
72
Figure 71 Peak brake pedal force presented as a function of FCW modality
Figure 72 presents the distribution of brake pedal force applications presented as a function of FCW modality and crash outcome The overall mean peak forces of the trials where the participants collided with the SLV (752 lbf) was nearly identical to that observed when the crash was avoided (780 lbf) differing by only 04 percent This finding is in contrast to the trends previous shown in Figures 612 through 619 where FCW modality was shown to affect crash avoidance via reduced response times These data imply that while FCW modality significantly affected the participantsrsquo mean FCW to brake application response times it does not appear to affect the magnitude of the pedal force application as discussed later in this section
Figure 72 Peak brake pedal force presented as a function of FCW modality and crash outcome
712 Statistical Assessment of Peak Brake Pedal Force Table 71 provides a summary of the data used to statistically compare the mean peak brake pedal force magnitudes shown in Figure 71 The results show the means for the eight FCW configurations were not significantly different
73
Table 71 Peak Brake Pedal Force Comparison By Modality
Peak Brake Pedal Force (lbf)
Condition Modality Mean Std Dev Minimum Maximum Pr gt F
23 All 119888 91751 17700 271800
00686
3 Beep 71000 39278 33200 152100
12 BeepHUD 65150 16567 42300 92600
7 Belt 51429 48295 0500 153000
18 BeltBeep 71200 27804 32300 116000
13 BeltHUD 70800 34019 36600 114700
6 HUD 27475 30858 1700 72200
1 None 103271 49384 39500 175000
Pair‐wise comparisons were made between the four FCW configurations not inclusive of a HUD‐based alert with the corresponding configuration that was The results shown in Table 72 indicate the average peak brake pedal force was not significantly different between each comparable alert This is consistent with the previous analysis that showed no significant main effect
Table 72 Peak Brake Pedal Force Pair‐Wise Comparisons
Contrast DF Contrast SS Mean Square F Value Pr gt F
Compare Beep vs BeepHUD 1 11733429 11733429 005 08285
Compare BeltBeep vs All 1 948189062 948189062 383 00563
Compare Belt vs BeltHUD 1 121235341 121235341 049 04874
Compare None vs HUD 1 1462388731 1462388731 591 00190
Table 73 provides a summary of the paired data used to statistically compare the mean peak brake pedal forces associated with the four combined FCW configurations The results show the means for the combinations were not significantly different which is consistent with the previous analyses discussed in this section
Table 73 Peak Brake Pedal Force By Modality Collapsed
Peak Brake Pedal Force (lbf) ndash Alerts With and Without HUD Combined
Modality N Mean Std Dev Minimum Maximum Pr gt F
Auditory 14 68493 30746 33200 152100
03170 Auditory‐Haptic 16 95544 70153 17700 271800
Haptic 13 60369 41826 0500 153000
None 11 75709 56668 1700 175000
74
The analysis presented in Table 74 indicates that there was no significant difference between male and female participantsrsquo peak brake pedal force magnitude
Table 74 Peak Brake Pedal Force By Gender
Peak Brake Pedal Force (lbf) ndash by Gender
Gender N Mean Std Dev Minimum Maximum Pr gt F
F 29 73007 46805 15500 221800 06573
M 25 79520 60341 0500 271800
72 Peak Steering Wheel Angle 721 General Assessment of Peak Steering Wheel Angle As previously stated 42 of the 64 participants (656 percent) used steering wheel inputs in an attempt to avoid the SLV For this study peak steering angle was measured from the onset of the FCW alert through the time when the front of the SV crosses the vertical plane established by the rear of the SLV15 Figure 73 presents the distribution of peak steering wheel angles observed during this study Overall these values ranged from 94 to 2297 degrees The mean values for each FCW modality ranged from 426 to 860 degrees overall for configurations 7 and 23 respectively Although 905 percent of these magnitudes (38 of 42 trials) resided within the range of inputs established with FCW configuration 23 (from 177 to 2297 degrees) it should be noted that the descriptive statistics of the condition 23 steering inputs were strongly affected by the presence of a 2297 degree input whose magnitude was much larger than any other observed in this study (eg 926 degrees greater or 675 percent than the second largest peak steering angle) When the 2297 degree input is omitted the mean peak steering angle for condition 23 becomes 573 degrees The mean peak steering wheel angles associated with seat belt pretensioner‐based FCW modalities ranged from 426 to 860 degrees for conditions 7 and 23 respectively The range of these values entirely contained the comparable range of means recorded during tests performed without seat belt pretensioner‐based FCW modalities from 558 to 813 degrees for conditions 6 and 12 respectively as well as the mean value of the trials performed with no FCW alert (609 degrees) This finding is in contrast to the trends previously shown in Figures 612 through 617 where FCW modality appears to affect crash avoidance via reduced response times These data imply that while FCW modality significantly affected the participantsrsquo mean FCW to avoidance steer response times it does not appear to affect the magnitude of the avoidance steer angle as discussed later in this section
15 In three cases the SV came to a stop before the SV headway became zero For these trials the measured period was from the onset of the FCW alert to the time when the SV came to a stop
75
Figure 73 Peak steering angle presented as a function of FCW modality
Figure 74 presents the distribution of peak steering wheel angles presented as a function of FCW modality and crash outcome The overall mean peak input of the trials where the participants collided with the SLV (524 degrees) was less than that observed when the crash was avoided (790 degrees) differing by 508 percent Omitting the 2297 degree input observed during the ldquono‐crashrdquo configuration 23 test reduces the related group mean to 690 degrees and the ldquocrash vs avoidrdquo peak steering input disparity to 241 percent
Figure 74 Peak steering angle presented as a function of FCW modality and crash outcome
Note As part of an avoidance input that included a peak steering input of 835 degrees one participant braked to nearly a full stop (to 13 mph) 60 inches from a vertical plane defined by the rear of the SLV before releasing force from the brake pedal This participant who received FCW alert configuration 23 ultimately avoided the crash by steering to the right but braking was the dominate input
76
722 Statistical Assessment of Peak Steering Wheel Angle Table 75 provides a summary of the data used to statistically compare the mean peak steering wheel angles shown in Figure 73 The results show the means for the eight FCW configurations were not significantly different
Table 75 Peak Steering Wheel Angle Comparison By Modality
Peak Steering Wheel Angle (degrees)
Condition Modality Mean Std Dev Minimum Maximum Pr gt F
23 All 86033 85040 17700 229700
07541
3 Beep 55780 40237 10800 91100
12 BeepHUD 81300 38113 43300 137100
7 Belt 42580 31233 9400 76300
18 BeltBeep 57500 26825 18600 96700
13 BeltHUD 57100 21917 26100 83500
6 HUD 56280 24780 19200 81100
1 None 60925 31232 17500 88400
Pair‐wise comparisons were made between the four FCW configurations not inclusive of a HUD‐based alert with the corresponding configuration that was The results shown in Table 76 indicate the average peak steering wheel angle was not significantly different between each comparable alert This is consistent with the previous analysis that showed no significant main effect
Table 76 Peak Steering Wheel Angle Pair‐Wise Comparisons
Contrast DF Contrast SS Mean Square F Value Pr gt F
Compare Beep vs BeepHUD 1 1628176000 1628176000 087 03579
Compare BeltBeep vs All 1 2442453333 2442453333 130 02616
Compare Belt vs BeltHUD 1 574992000 574992000 031 05833
Compare None vs HUD 1 47946722 47946722 003 08739
Table 77 provides a summary of the paired data used to statistically compare the mean peak steering wheel angles associated with the four combined FCW configurations The results show the means for the combinations were not significantly different which is consistent with the previous analyses discussed in this section
77
Table 77 Peak Steering Wheel Angle By Modality Collapsed
Peak Steering Wheel Angle (degrees)ndash Alerts With and Without HUD Combined
Modality N Mean Std Dev Minimum Maximum Pr gt F
Auditory 10 68540 39320 10800 137100
06316 Auditory‐Haptic 12 71767 61938 17700 229700
Haptic 11 50500 26227 9400 83500
None 9 58344 26054 17500 88400
The analysis presented in Table 78 indicates that there was no significant difference between male and female participantsrsquo peak steering wheel angle
Table 78 Peak Steering Wheel Angle By Gender
FCW to Brake Application (sec) ndash by Gender
Gender N Mean Std Dev Minimum Maximum Pr gt F
F 21 57838 31021 9400 126300 04714
M 21 67267 50684 13300 229700
78
80 SUBJECT VEHICLE RESPONSES 81 Peak Longitudinal Deceleration The longitudinal acceleration (ie deceleration) results presented in this section were obtained by considering the same time interval used to assess peak steering angle and brake pedal force Figure 81 presents a distribution of the peak decelerations produced by the 56 participants who used braking as part of their crash avoidance maneuver Overall these values ranged from 002 (observed during a trial that included a brake pedal misapplication) to 113 g The mean values for each FCW modality ranged from 023 to 080 g overall for configurations 3 and 23 respectively
Figure 81 Peak deceleration magnitude presented as a function of FCW modality
The mean peak decelerations associated with the seat belt pretensioner‐based FCW modalities ranged from 057 g to 080 g for conditions 7 and 23 respectively The range of these values overlapped the comparable range of means recorded during tests performed without seat belt pretensioner‐based FCW modalities from 023 to 063 g for conditions 3 and 12 respectively and contains the mean value of the trials performed with no FCW alert (074 g) Figure 82 presents the distribution of peak decelerations presented as a function of FCW modality and crash outcome The overall peak means of the trials where the participants collided with the SLV (063 g) was less than that observed when the crash was avoided (070 g) differing by 99 percent 82 Peak Lateral Acceleration The lateral acceleration results presented in this section were obtained by considering the same time interval used to assess peak steering angle and brake pedal force and have been collapsed across direction of steer no distinction between steering to the left or right has been made
79
Figure 82 Peak deceleration magnitude presented as a function of FCW modality and crash outcome
Figure 83 presents a distribution of the peak lateral accelerations produced by the 42 participants who used steering as part of their crash avoidance maneuver Overall these values ranged from 003 to 077 g The mean values for each FCW modality ranged from 0259 to 044 g degrees overall for configurations 1 and 23 respectively
Figure 83 Peak lateral acceleration magnitude presented as a function of FCW modality
The mean peak lateral accelerations associated with the seat belt pretensioner‐based FCW modalities ranged from 0264 g to 044 g for conditions 7 and 23 respectively The range of these values almost entirely overlapped the comparable range of means recorded during tests performed without seat belt pretensioner‐based FCW modalities from 0261 to 041 g for conditions 3 and 12 respectively as well as the mean value of the trials performed with no FCW alert (0259 g) Figure 84 presents the distribution of peak lateral accelerations presented as a function of FCW modality and crash outcome The overall peak means of the trials where the participants
80
collided with the SLV (0267 g) was less than that observed when the crash was avoided (0473 g) differing by 435 percent
Figure 84 Peak lateral acceleration magnitude presented as a function of FCW modality and crash outcome
81
90 CRASH AVOIDANCE AND MITIGATION SUMMARY 91 Crash Avoidance Although it is not the intent of this study to identify the ldquobestrdquo FCW alert modality (ie the objective of the work was to develop a protocol suitable for evaluating FCW DVI effectiveness) the protocol indicates a potential for good discriminatory capability and its output can be used for high‐level crash avoidance comparisons Table 91 provides an overall summary of how many participants were able to avoid crashing into the SLV as a function of FCW modality
Table 91 Overall Crash Avoidance Summary
Condition FCW Alert Modality
of Participants
Belt No Belt
Crash Avoid Crash Avoid
1 No alert ‐‐ ‐‐ 8 0
3 Visual Only (Volvo HUD) ‐‐ ‐‐ 8 0
6 Auditory Only (Mercedes Beep) ‐‐ ‐‐ 7 1
7 Haptic Seat Belt Only (Acura Belt) 5 3 ‐‐ ‐‐
12 Auditory + Visual ‐‐ ‐‐ 7 1
13 Visual + Haptic Seat Belt 3 5 ‐‐ ‐‐
18 Auditory + Haptic Seat Belt 5 3 ‐‐ ‐‐
23 Visual + Auditory + Haptic Seat Belt 4 4 ‐‐ ‐‐
Total
(percent of 64 participants)
17
(266)
15
(234)
30
(469)
2
(31)
A total of 17 participants (266 percent) avoided a collision with the SLV Of these 17 instances the FCW modality present in 15 included seat belt pretensioning (882 percent) For the FCW modalities that supported successful crash avoidance the success rate is shown in Table 92 Table 93 presents the data shown in Table 92 but collapsed by FCW alert modality 92 Likelihood of an FCW Alert Response When considering the crashavoid data previously presented in this report the authors emphasize that being involved in a crash does not necessarily indicate the participant did not respond to the FCW modality used in their individual trial Although most participants crashed into the SLV because they failed to respond to the various FCW alerts used in this study (or were not presented with one) some crashed because their avoidance strategy was simply not effective
82
Table 92 Successful SLV Avoidance Summary
Condition FCW Alert Modality Avoidance Summary
Ratio Percentage
6 Auditory Only 1 of 8 125
12 Auditory + Visual 1 of 8 125
7 Haptic Seat Belt Only 3 of 8 375
18 Haptic Seat Belt + Auditory 3 of 8 375
13 Haptic Seat Belt + Visual 5 of 8 625
23 Haptic Seat Belt + Visual + Auditory 4 of 8 500
7 13 18 23 All Haptic Seat Belt‐Based 15 of 32 469
Table 93 Successful SLV Avoidance Summary Collapsed
Condition FCW Alert Modality Avoidance Summary
Ratio Percentage
6 12 Auditory 2 of 16 125
18 23 Auditory‐Haptic 7 of 16 438
7 13 Haptic 8 of 16 500
To quantify this phenomenon the authors reviewed video recorded during each trial Facial expressions the manner in which the participant re‐established their forward‐looking view throttle release brake application steering inputs etc were all considered in this assessment Ultimately each subject was categorized in one of three ways
1 FCW alert response likely crash avoided
2 FCW alert response likely crash not avoided
3 FCW alert response not likely crash not avoided Results of this categorization were used in conjunction with FCWVCend duration to further dissect response time As shown in Figure 91 the range of response times where FCW alert responses were likely and the crash avoided was 270 to 870 ms For the cases where FCW alert responses were likely but the crash still occurred response times were between 330 ms to 10 second Finally for the instances where FCW alert responses were not likely response times were between 870 ms to 174 seconds As previously stated if there was no FCW response a crash always occurred Note that Figure 91 presents data from 63 valid trials Although this study had 64 valid participants video data was not available for one
s46_c18_0270swmv
s1_c23_0740swmv
s56_c7_1740swmv