A Tax Revenue Dataset for - FERDI · This paper presents a unique tax revenue dataset for ... A Tax...
26
fondation pour les études et recherches sur le développement international LA FERDI EST UNE FONDATION RECONNUE D’UTILITÉ PUBLIQUE. ELLE MET EN ŒUVRE AVEC L’IDDRI L’INITIATIVE POUR LE DÉVELOPPEMENT ET LA GOUVERNANCE MONDIALE (IDGM). ELLE COORDONNE LE LABEX IDGM+ QUI L’ASSOCIE AU CERDI ET À L’IDDRI. CETTE PUBLICATION A BÉNÉFICIÉ D’UNE AIDE DE L’ÉTAT FRANCAIS GÉRÉE PAR L’ANR AU TITRE DU PROGRAMME «INVESTISSEMENTS D’AVENIR» PORTANT LA RÉFÉRENCE «ANR-10-LABX-14-01». Abstract This paper presents a unique tax revenue dataset for Sub-Saharan Africa, which main innovation is the level of detail it provides about tax revenue sources for a large number of countries (41) and over a long time period (1980-2010). The paper describes how the dataset was constructed, identifying along the way problem areas in tax revenue statistics in Sub-Saharan Africa and possible improvements. A graphical analysis highlights revenue performance over time and across three dimensions: income levels, the relative importance of tax revenue from extractive industries, and trading groups (free-trade areas and customs unions). The dataset, available at www.ferdi.fr, should be useful to a wide range of users and researchers, including academics, tax policy practitioners and advisers, and revenue and customs administrations. JEL : H20, O10 Keywords: trade taxes, direct taxes, indirect taxes, revenue mobilization * I would like to thank Anne-Marie Geourjon, Grégoire Rota-Graziosi, and Majdeline El Rayess for helpful comments. Views expressed in this paper are mine, and should not be attributed to the International Monetary Fund, its management or Executive Board. A Tax Revenue Dataset for Sub-Saharan Africa: 1980-2010 * Mario Mansour Mario Mansour, Fiscal Affairs Department, International Monetary Fund. Email : [email protected]. W o r k i n g P a p e r D e v e l o p m e n t I n d i c a t o r s July 2014 I19
Transcript of A Tax Revenue Dataset for - FERDI · This paper presents a unique tax revenue dataset for ... A Tax...
fondation pour les études et recherches sur le développement international
LA F
ERD
I EST
UN
E FO
ND
ATIO
N R
ECO
NN
UE
D’U
TILI
TÉ P
UBL
IQU
E.
ELLE
MET
EN
ŒU
VRE
AV
EC L
’IDD
RI L
’INIT
IATI
VE
POU
R LE
DÉV
ELO
PPEM
ENT
ET L
A G
OU
VER
NA
NC
E M
ON
DIA
LE (I
DG
M).
ELLE
CO
ORD
ON
NE
LE L
ABE
X ID
GM
+ Q
UI L
’ASS
OC
IE A
U C
ERD
I ET
À L
’IDD
RI.
CET
TE P
UBL
ICAT
ION
A B
ÉNÉF
ICIÉ
D’U
NE
AID
E D
E L’
ÉTAT
FRA
NC
AIS
GÉR
ÉE P
AR
L’AN
R A
U T
ITRE
DU
PRO
GRA
MM
E «I
NV
ESTI
SSEM
ENTS
D’A
VEN
IR»
PORT
AN
T LA
RÉF
ÉREN
CE
«AN
R-10
-LA
BX-1
4-01
».
AbstractThis paper presents a unique tax revenue dataset for Sub-Saharan Africa, which main innovation is the level of detail it provides about tax revenue sources for a large number of countries (41) and over a long time period (1980-2010). The paper describes how the dataset was constructed, identifying along the way problem areas in tax revenue statistics in Sub-Saharan Africa and possible improvements. A graphical analysis highlights revenue performance over time and across three dimensions: income levels, the relative importance of tax revenue from extractive industries, and trading groups (free-trade areas and customs unions). The dataset, available at www.ferdi.fr, should be useful to a wide range of users and researchers, including academics, tax policy practitioners and advisers, and revenue and customs administrations.
JEL : H20, O10
Keywords: trade taxes, direct taxes, indirect taxes, revenue mobilization
* I would like to thank Anne-Marie Geourjon, Grégoire Rota-Graziosi, and Majdeline El Rayess for helpful comments. Views expressed in this paper are mine, and should not be attributed to the International Monetary Fund, its management or Executive Board.
A Tax Revenue Dataset for Sub-Saharan Africa: 1980-2010*
Mario Mansour
Mario Mansour, Fiscal Affairs Department, International Monetary Fund.Email : [email protected].
Working Paper
Development Indicato
rs
July 2014I19

2
1. Introduction
The study of tax policy and administration in Sub-Saharan Africa (SSA), and more generally in
developing countries (DCs), has attracted a lot of attention in recent years from various sources,
including academia, think tanks, donor agencies of certain countries, and even advocacies such as
anti-smoking groups. It is fair to say that the subject is no longer studied primarily by international
institutions with a development or surveillance mandate in DCs—namely, the International
Monetary Fund (IMF) and the World Bank. Even the Organisation for Economic Co-operation and
Development, which has a much narrower membership than the IMF and the World Bank—
focused on high-income countries—started in recent years dedicating significant resources to the
study of tax issues in DCs.
Recent papers on tax policy in SSA have explored various issues; examples include the following:
Bhushan and Yiagadeesen (2012) explores the relationship between aid and government
incentives to mobilize domestic revenue; Brückner (2011) estimates the elasticity of tax revenue to
GDP; Ebeke and Ehrhart (2010) analyze the instability of tax revenues and its effect on certain
public spending items, such as investment; Di John (2009) studies taxation as an essential political
element of state building; Fjeldstad and Moore (2009) explore the impact of the spread of ARAs on
tax revenue collections and the incentives to undertake tax reform; Prichard and Leonard (2010),
and Baskaran and Bigsten (2011) study whether improvement in tax administration and tax
revenue collections is a sign of larger improvement across other areas of government, and
improved governance; Stürmer (2010) studies the tax potential from the resource sector in three
SSA countries (Zambia, Namibia, and Ghana).
Yet, little attention has been given to the need for quality and detailed revenue data that can be
used for analytical purposes, particularly to explore issues related to the microeconomics of
taxation and policy design. The IMF’s Government Finance Statistics (GFS) database is an exception;
it is the only publication that attempts to cover as many DCs as possible, in a consistent manner. Its
major drawbacks, however, is the low coverage across countries and over time—due primarily to
countries not reporting their data. Moreover, before the recent update to the 2001 GFS
methodology, revenues collected by customs were in many cases accounted as trade revenues,
including sales taxes and excise taxes—and even under the new standard, there is no systematic
way to check that domestic taxes collected on imported goods are classified correctly as domestic
tax revenue and not as tariff revenue. This blurs the study of important issues, such as the
coordination of tariff and domestic tax reforms, changes in the tax mix, whether certain tax
revenues bear disproportionally the pressures of globalization, whether value-added taxes perform
as well as they are thought to do, the role of revenues from natural resources (a growing fiscal issue
in DCs), and many other issues.

3
This paper fills a gap in this area, by providing a cross-section dataset on the composition of tax
revenues (7 series) for 41 SSA countries over the period 1980-2010.1 The series are: Total Taxes,
Trade Taxes, Indirect Taxes, Direct Taxes, Corporate Tax, Individual Tax, and Resource Taxes.2 The
dataset builds on that in Keen and Mansour (2010), which was for 40 SSA countries over 1980-2005.
This update was motivated by recent work on tax coordination in the West African Economic and
Monetary Union (WAEMU) (Mansour and Rota-Graziosi, 2013), and by the number of empirical
studies that showed interest in the dataset (including some referenced above).
The paper is organized as follows. Section II describes the sources and definitions of the data.
Attention is given to how revenue accounting and tax rules may create differences in the definition
of a particular series across countries, and attempt to provide the likely impact of such differences
on the quality and cross-country comparability of the data. Section III presents a graphical analysis
of the evolution of the level and composition of tax revenues. Section IV concludes.
2. The dataset: sources and definitions
2.1. Sources
Several sources were used to produce the dataset. The starting point was the IMF GFS for the main
aggregates: Total Taxes, Trade Taxes, Indirect Taxes, and Direct Taxes. This was then completed and
checked against IMF staff reports and statistical appendices produced by IMF surveillance and
program missions, particularly to ensure that tariff revenues do not include domestic consumption
taxes collected at the border (e.g. VAT and excises).3 Staff reports were also used to separate Direct
Taxes into Corporate Tax and Individual Tax, with the former further split into corporate taxes from
upstream resource activities in the mining and oil and gas sectors, and the rest. Where staff reports
did not contain the desired disaggregation—and this is frequent, especially since the late 1990s—,
data from IMF country desk economists were used instead.
The data source for the IMF staff reports is the Ministry of Finance of IMF member countries, usually
provided by treasury departments, which consolidate data from customs and tax administrations,
and other government agencies, according to a standard budget nomenclature.4 The IMF routinely
discusses the data with the authorities as part of surveillance and program activities, and although
1 Tax-to-GDP ratios for the seven series are reported for all countries in the appendix. Note that some countries have recently revised upward their GDP data, and more are likely to do so in coming years (see, for example, Jerven and Ebo Duncan (2012) on the Ghana case). The dataset precedes these revisions and is therefore not affected by them. However, these revisions do raise issues for cross-country comparative analysis of tax effort, which frequently relies on tax-to-GDP ratios (as is the case in this paper). 2 The categorization of taxes as direct or indirect is not typical of tax revenue classification in national accounts or other public finance databases, including the IMF GFS database. It is done here primarily due to data constraints, but can be useful for analyzing certain aspects of African tax systems—e.g., equity issues. 3 Staff reports were also used for total tax revenues where the GFS did not contain such data. 4 This nomenclature is not necessarily harmonized across countries, although efforts in this regard have been deployed in recent years, including from the IMF Statistics Department, and the Fiscal Affairs Department on budget nomenclature systems.

4
no systematic and complete quality check is done, this is by far the best available source of
government revenues in SSA. In cases where data provided by treasury departments did not
contain the desired disaggregation (particularly domestic taxes collected from extractive
industries), data provided directly by domestic tax administrations and collected by IMF country
desk economists was used; occasionally, the authorities were contacted directly to verify or obtain
missing data. Finally, in a few cases, data from IMF sources were checked against data available
publicly (e.g. South Africa Treasury website).
Despite this, the dataset is not complete and is not perfect for reasons that will become obvious in
the next sub-section. Table 1 shows the number of missing observations for each of the non-
resource series. Only four countries have missing observations for Total Taxes, and six have missing
observations for the split of Direct Taxes between Corporate Tax and Individual Tax. For a small
number of missing observations on this split (where the period is one to three years), the data were
constructed by assuming that each component is equal to the average of its share of Direct Taxes
for the previous and following observations—or the first or last observation in cases where the
missing observations were at the beginning or end of the dataset period.
Table 1. Missing Observations by Series and Country
For the series Resource Taxes, it was not possible to identify whether observations were missing or
whether the country simply did not have extractive industries. However, the data were checked
against the World Bank publication on subsoil wealth (World Bank, 2006); the resource countries in
the dataset account for over 95 percent of countries for which the World Bank publication reports
resource wealth, and include the large ones, such as Nigeria, and Central African countries.
Compared to the dataset in Keen and Mansour (2010), this update includes Angola, a resource rich
country, a revision of all series for the period 2000-2005, and a revision of the resource tax series for
Nigeria and Gabon in the 1980s. These revisions resulted in higher Resource Taxes, primarily due to
replacing estimates with actual data for 2003 to 2005, and making some corrections for Nigeria and
SeriesNumber of
missing observations
Countries and years
Total Taxes 23 Angola: 1980-1995; Chad: 1980-1981; Namibia: 1980-1981; Zimbabwe: 2005-2007
Trade Taxes 23 Angola: 1980-1995; Chad: 1980-1981; Namibia: 1980-1981; Zimbabwe: 2005-2007
Indirect Taxes 23 Angola: 1980-1995; Chad: 1980-1981; Namibia: 1980-1981; Zimbabwe: 2005-2007
Direct Taxes 23 Angola: 1980-1995; Chad: 1980-1981; Namibia: 1980-1981; Zimbabwe: 2005-2007
Corporate Tax 122 Angola: 1980-2010; Chad: 1980-1981; Equatorial Guinea: 1980-1988; Kenya: 1980-2010; Namibia: 1980-1988; Seychelles: 1987-2004; Uganda: 1990-1997; Zambia: 1980-1985; Zimbabwe: 2005-2007
Individual Tax 138 Angola: 1980-2010; Chad: 1980-1981; Kenya: 1980-2010; Namibia: 1980-1988; Nigeria: 1986-2010; Seychelles: 1987-2004; Uganda: 1990-1997; Zambia: 1980-1985; Zimbabwe: 2005-2007

5
Gabon in the 1980s (revenue from production sharing was missing for some years for Nigeria, and
the resource royalty was missing for Gabon).
2.2. Definition of Variables
Total Taxes
This is the total of all taxes reported as such, including two revenue sources that countries do not
systematically classify as tax revenue. The first source is stamp duties and fees. Where data were
available, only certain registration fees (mainly real property registration), which can be non-
negligible, were included in the total; otherwise, the total amount of registration fees was included.
The second source includes profits from upstream activities in the non-renewable resource sector
(oil and gas, and mining), royalties, and revenue from production sharing agreements when they
are paid into the consolidated fund.
Trade Taxes
These include the following: (1) revenues from a country’s external tariff on imports and exports, or
its share from such sources in the case of a customs union with revenue sharing (e.g. South African
Customs Union); (2) ad-valorem service fees or statistical fees as they are called in some countries,
and special levies on imports and exports that are earmarked for certain use (e.g. the 1 percent levy
in the West African Economic and Monetary Union (WAEMU) earmarked for financing the WAEMU
Commission). This was done in part because it is not always possible to distinguish the various fees
applicable—it can be argued that certain fees that do not finance the budget of the country that
levy them should not be accounted as own revenue.
Another category that may be included is withholding on imports for purposes of income taxes.
This is applied in many countries as a way to tax the informal sector; it is levied on imports, but can
be deducted against a taxpayers’ income tax liability (typically, tax on income from a business
activity). Typically, revenues from this withholding are accounted for as direct taxes (levied by
customs on behalf of the domestic tax administration). It was not possible, however, to confirm
that this was indeed the case in all countries that practice this type of withholding.
Indirect Taxes
Indirect taxes include all domestic consumption taxes, such as sales taxes of various sorts, including
value-added taxes (VATs), and excise taxes. In some countries, excise taxes may include ad-valorem
or specific taxes on certain agricultural products, such as coffee and cocoa.
VATs are included in indirect taxes on a net basis, where data on refunds are available. However, for
some countries, refunds are accounted for as an expense item in the central government budget,
and are not always reported separately. For these countries, VAT revenue may be overestimated.
Evidence from the IMF technical assistance suggests that refunds are on average about 20 percent
of VAT revenues in SSA (see Harrison and Krelove, 2005).

6
Direct Taxes
These include taxes on all income sources (i.e. business profits, wages, portfolio income, income
from real property, capital gains, etc). Payroll taxes, in particular social security contributions (SSCs),
are typically not paid into the consolidated fund, and therefore do not show in Direct Taxes—some
countries have minor general payroll taxes other than SSCs that are, however, included. This is a
significant weakness of the dataset since SSCs can be substantive both in terms of revenue and
their incentive effects on employment.5
Direct Taxes are not always the total of corporate and individual taxes. The difference is often due
to taxes that cannot be allocated to either of these two sub-categories; these include payroll taxes
(other than SSCs), recurrent taxes on real property, which are insignificant in SSAs, and taxes on
portfolio income that are not reported as part of individual or corporate income. This difference is
between 4 and 14 percent of Direct Taxes on average over the period.
Corporate Tax
This is the tax imposed on corporate income in countries that have a corporate tax. This can include
taxes on profits from individual enterprises or any other business entities liable to a schedular profit
tax in countries that have schedular tax systems (a number of Francophone countries). Data to split
the profit tax according to the legal status of the business entity are not usually available in IMF
staff reports.
A great deal of effort went into separating from the corporate tax, tax revenues from profits of
corporations and other business entities from extractive activities in the oil and gas and mining
sector. These were included in the series Resource Taxes.
In some cases, IMF staff reports and country files show resource income as a total of both the tax on
profit and other revenues from extractive industries—which may include dividends from a national
oil company or from government participation in private companies. For this reason, the Corporate
Tax is not split between the share of extractive industries and other sectors. This split is very useful
for the study of revenue mobilization as well as the incentive effects of various tax tools on
extractive industries—e.g. profit taxes are superior to gross revenue royalties from an efficiency
perspective, but many SSA countries find it more convenient to use royalties to extract more
revenues from the sector because their base is less exposed to tax avoidance.
Individual Tax
This is the tax imposed on income of individuals from all sources in countries that apply a
comprehensive income tax on individuals, including tax on business profits. In countries that apply
5 The IMF GFS classifies general payroll levies as taxes, but SSCs as non-tax revenues. IMF staff reports for Africa usually
follow the GFS.

7
a schedular income tax, the Individual Tax includes primarily taxes on wages (other than SSCs,
which as noted earlier, are not typically paid into the consolidated fund).
Resource Taxes
These include primarily revenues from the Corporate Tax that are collected from extractive
activities in the oil and gas, and mining sectors, and royalties.6 Revenues from production sharing
agreements (PSAs) were included in this series to the extent that they were paid into the
government general fund—which typically occurs in the case of oil and gas through a national oil
company. There is no separation of revenues from oil and gas, and revenues from mining activities,
since most countries do not report revenues at this level of details. However, as shown later, it is
relatively easy to analyze the aggregate relative importance of revenues from each of these two
sectors given that few countries are rich in both hydrocarbons and non-hydrocarbons minerals.
Other variables
The dataset contains a number of other variables that are used in the trend analysis in the next
section. These are the following: GDP at current prices; population; annual average inflation (as
measured by the consumer price index); income classification, and modified income classification
(as explained in footnote 8); and a trading groups variable (West African Economic and Monetary
Union (WAE), Southern African Customs Union (SACU), East African Community (EAC), (Central
African Economic and Monetary Union (CEMAC), and Economic Community of West African States
(ECOWAS)). The source of all these variables is the IMF World Economic Outlook database, except
income classification, which is taken from the World Bank.
3. Evolution of tax revenues: level and structure
This section describes the main features of the evolution of tax revenues in SSA over the period of
the dataset. The emphasis is on the relative role of each major source of revenue, and future
prospects for revenue mobilization.
3.1. General Observations
Table 2 shows a selection of tax revenue indicators. Overall, tax revenues grew from 17.5 percent of
GDP in 1980 to 22.3 percent in 2010, with most of the increase occurring since 1995. The shares of
non-resource and resource taxes (in total taxes) changed very little between in 2010 relative to
1980, but significant variations took place during the period.
6 The GFS classifies all revenue from the resource sector (other than the corporate income tax, excise taxes on energy products, and un-refunded general sales taxes such as VATs ) as non-tax revenues. Such revenue includes primarily royalties, profit sharing, dividends received from state enterprises, and dividends and other investment income received from government direct participation in extractive enterprises. This distinction in the classification of revenue is immaterial for revenue analysis purposes for a number of reasons, including the equivalencies that exist between what is typically classified as non-tax instruments and tax instruments. For example, a profit sharing scheme can be designed to be equivalent in economic terms to a rent tax, and an export tax can be designed to be equivalent to a royalty.

8
First, in the early 1980s, oil revenues in Nigeria dominated resource taxes, buoyed by the
petroleum shock at the end of the 1970s. It accounted for over three-quarters of revenues from
extractive industries in SSA. Mining revenues in South Africa accounted for much of the remaining
quarter. Only eight SSA countries reported resource revenues back then.
Second, in 2010, 18 countries reported resource revenues, but the country concentration of such
revenues was still very high, with oil revenue in Nigeria and Angola accounting for a over 75
percent, and Francophone Central Africa for over 15 percent (Cameroon, Congo, Equatorial Guinea,
and Gabon).
Table 2. Selected Tax Revenue Indicators
Third, resource revenues declined during the 1980s and much of the 1990s, despite an increase in
the number of countries reporting such source. Although much of this was due to unfavorable
international oil prices, SSA countries failed to tax properly the mining sector.7 This sector is
generally harder to tax relative to oil and gas, where production is concentrated and typically
offshore—i.e. impossible to undertake without significant capital outlays. But many countries
provided very generous tax regimes for mining in the 1980s and 1990s (a period with very low
commodity prices) with long stabilization, only to regret it when prices started to increase in the
early 2000s.
Fourth, almost all SSA countries have recently revised, or are in the process of revising their mining
tax regimes—and the IMF has provided significant technical assistance in this area since 2008. 7 See for example the case studies by Stürmer (2010) on Zambia, Namibia, and Ghana.
1980 1985 1990 1995 2000 2005 2010
Total Taxes (billions of USD) 46.4 28.5 52.7 56.1 72.9 150.6 230.9Percent of GDP 17.5 15.7 18.8 17.8 22.4 24.4 22.3
Non-resource Taxes (billions of USD) 27.0 22.7 40.4 49.8 49.9 93.8 157.6Percent of Total 58.1 79.8 76.7 88.8 68.5 62.3 68.3Percent of GDP 10.2 12.6 14.4 15.8 15.4 15.2 15.3
Resource Taxes (billions of USD) 19.4 5.8 12.3 6.3 23.0 56.7 73.3Percent of Total 41.9 20.2 23.3 11.2 31.5 37.7 31.7Percent of GDP 7.3 3.2 4.4 2.0 7.1 9.2 7.1Number of countries reporting resource taxes 8 9 9 12 14 18 18
Total Taxes per Capita (USD) 148.3 78.5 125.4 116.6 129.8 237.1 321.7In constant 2010 USD 884.7 389.9 519.1 393.7 259.1 356.0 345.0
Total Resource Taxes per Capita (USD) 62.1 15.9 29.2 13.1 40.9 89.3 102.1In constant 2010 USD 370.3 78.9 120.8 44.1 81.6 134.1 109.5
GDP (billions of USD) 265.2 180.8 280.3 315.6 324.9 618.1 1,033.1Population (millions) 313.0 362.7 420.2 481.2 561.8 634.9 717.7
9
Provided that the new regimes are more effective in taxing the mining rent, SSA can expect more
revenues from the mining sector in the future. But oil revenue will likely dominate the picture for
years to come.
Fifth, non-resource taxes improved a little in the 1980s, but have been stagnant since the early
1990s (slightly over 15 percent of GDP). Some of this may be due to development in resource
revenues—the correlation between the annual growth rates of resource and non-resource taxes is
-0.42 over the period—,but weak tax policy and administration remain important factors.
An interesting observation from Table 2 is the amount of tax revenue available per capita. Putting
aside the early 1980s, which as noted earlier is dominated by oil revenue in Nigeria, real taxes per
capita in SSA have declined. To the extent that part of such taxes serves as a social safety net in the
form of government employment, this would simply imply a decline in real public wages. But to
the extent that they finance infrastructure, health, education, and other pro-poor spending, SSA
had less budget resources per capita in 2010 than it did in the 1980s and much of the 1990s. From
this perspective, the effect of inflation caused by the resource sector (combined with population
growth), outweighed the impact of additional revenues from this sector. Moreover, resource taxes
as a share of GDP and as a share of total taxes have been highly volatile—the standard deviations
over the entire period are 7.3 and 22.6 respectively.
3.2. Developments by Income Group
The data in Table 2 hide significant variations across countries, and over time. In this subsection, we
look at the composition of taxes by income group since countries of similar income levels usually
face similar challenges in revenue policy. Four groups are selected: low-income (LIC), lower-middle-
income (LMIC), upper-middle-income (UMIC), and high-income (HIC).8 The groups are defined
contemporaneously, meaning that countries change groups as they move from one income level
to another. Given the small number of countries in the dataset (41), this classification may have the
bias of reducing the number of observations for some groups as countries move up the income
ladder over time. But this does not seem to be the case here. However, countries have moved out
of, and back into the same category for a short period. In order to minimize the impact on how the
series behave, moves for three years or less were ignored.9
Table 3 shows the main changes in GDP, population, and taxes between 1985 and 2010. The main
observation is that the shares of LMICs declined in population, GDP, and taxes. A significant factor
explaining this is South Africa moving to the UMIC group; also important is the number of
8 Income groups are defined according to the World Bank country classification, which is available for the period 1987-2010. For 1980-1986, it was assumed that the 1987 classification prevailed. The HIC group was ignored since only Equatorial Guinea qualifies, and only over 2007-2010. 9 This resulted in the following reclassifications: Côte d’Ivoire is LIC instead of LMIC in 2008-2010; Equatorial Guinea is LMIC instead of LIC in 2001-2003; Ghana is LIC instead of LMIC in 2010; Lesotho is LIC instead of LMIC in 1995; Mauritius is LIC instead of LMIC in 2010; Nigeria is LIC instead of LMIC in 2008-2010; Senegal is LIC instead of LMIC in 2009-2010; South Africa is UMIC instead of LMIC in 2001-2003.

10
countries moving back to the LIC group (Zimbabwe, Senegal and Côte d’Ivoire), with a more
significant impact on the group than countries moving from LIC to LMIC (Botswana and Equatorial
Guinea).
Table 3. GDP, Population, and Taxes by Income Group; 1985 and 2010
Figure 1 shows the evolution of total resource and non-resource taxes by income group. For SSA as
a whole, non-resource taxes have been relatively steady around 15 percent of GDP since 1990. This
steadiness is also apparent in LICs—10 to 12 percent of GDP. In LMICs the non-resource ratio
declined significantly in the past decade. Only UMICs have shown a steady improvement in the
non-resource tax ratio, principally due to South Africa and Botswana. The contribution of resource
revenues to the total revenue effort is persistent and significant in both LICs and LMICs. The
collapse of resource revenues in UMICs in 1984 is entirely due to Gabon, the only UMIC that shows
resource revenues prior to 1988.
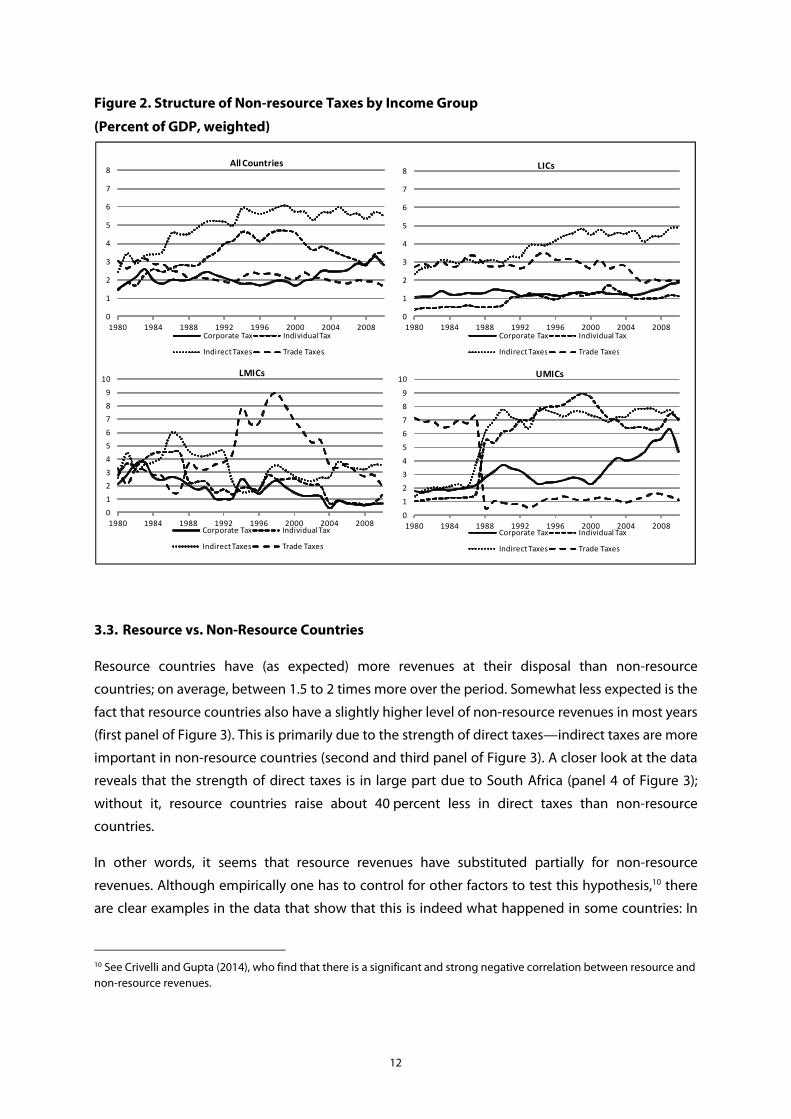
Moving to the composition of non-resource taxes by income group (Figure 2), the main trend in
LICs is the replacement of trade taxes by indirect taxes, namely VATs and excises. In LMICs, and
consistent with the previous observation on the decline in non-resource revenues, all revenue
categories have been trending down since the mid-1980s, with a slight exception for indirect taxes.
The increase in the tariff ratio in the first half of the 1990s is due to Swaziland and Botswana, which
had a high GDP weight in the LMIC group in those years and high tariff ratios—both countries have
had a relatively high ratio for the entire period. Also of interest in this group is the decline in the
contribution of income taxes (personal and corporate), which coincides with the increase in
resource revenues in the mid-1990s. This could be caused by a number of factors: low buoyancies
of such taxes in relation to resource GDP; deliberate policy decisions to substitute resource taxes
LICs LMICs UMICs Total LICs LMICs UMICs Total
Number of observations 29 9 2 40 28 8 5 41
GDP (billions of USD) 91.9 85.1 3.7 180.8 484.9 141.1 407.1 1,033.1Share (percent of all groups) 50.9 47.1 2.0 100.0 46.9 13.7 39.4 100.0
Population (millions) 289.3 72.5 0.9 362.7 602.0 61.0 54.7 717.7Share (percent of all groups) 79.8 20.0 0.2 100.0 83.9 8.5 7.6 100.0
Total Taxes (billions of USD) 10.7 16.3 1.4 28.5 89.6 47.4 93.9 230.9Non-resrource Taxes 8.0 14.1 0.5 22.7 57.7 15.3 84.4 157.4Resource Taxes 2.7 2.2 0.9 5.8 31.7 32.1 9.5 73.3
Total Taxes (percent of all groups) 37.7 57.4 4.9 100.0 38.8 20.5 40.7 100.0Non-resrource Taxes 35.5 62.3 2.3 100.0 36.6 9.7 53.6 100.0Resource Taxes 46.5 38.0 15.4 100.0 43.2 43.8 12.9 100.0
Note: Only Angola is missing in 1985, with a negligible impact on total figures.
1985 2010

11
for direct taxes; and relaxing audit rules on companies and individuals. In UMICs, the most
significant trend is the increase in corporate income tax revenue, largely a South Africa effect.
Figure 1. Non-resource and Resource Taxes by Income Group
(Percent of GDP, weighted)
0
5
10
15
20
25
30
1980 1984 1988 1992 1996 2000 2004 2008
All Countries
Resource Taxes Non-Resource Taxes Total Taxes
0
5
10
15
20
25
30
1980 1984 1988 1992 1996 2000 2004 2008
LICs
Resource Taxes Non-Resource Taxes Total Taxes
0
5
10
15
20
25
30
35
40
45
1980 1984 1988 1992 1996 2000 2004 2008
LMICs
Resource Taxes Non-Resource Taxes Total Taxes
0
5
10
15
20
25
30
35
40
45
1980 1984 1988 1992 1996 2000 2004 2008
UMICs
Resource Taxes Non-Resource Taxes Total Taxes
12
Figure 2. Structure of Non-resource Taxes by Income Group
(Percent of GDP, weighted)
3.3. Resource vs. Non-Resource Countries
Resource countries have (as expected) more revenues at their disposal than non-resource
countries; on average, between 1.5 to 2 times more over the period. Somewhat less expected is the
fact that resource countries also have a slightly higher level of non-resource revenues in most years
(first panel of Figure 3). This is primarily due to the strength of direct taxes—indirect taxes are more
important in non-resource countries (second and third panel of Figure 3). A closer look at the data
reveals that the strength of direct taxes is in large part due to South Africa (panel 4 of Figure 3);
without it, resource countries raise about 40 percent less in direct taxes than non-resource
countries.
In other words, it seems that resource revenues have substituted partially for non-resource
revenues. Although empirically one has to control for other factors to test this hypothesis,10 there
are clear examples in the data that show that this is indeed what happened in some countries: In
10 See Crivelli and Gupta (2014), who find that there is a significant and strong negative correlation between resource and
non-resource revenues.
0
1
2
3
4
5
6
7
8
1980 1984 1988 1992 1996 2000 2004 2008
All Countries
Corporate Tax Individual Tax
Indirect Taxes Trade Taxes
0
1
2
3
4
5
6
7
8
1980 1984 1988 1992 1996 2000 2004 2008
LICs
Corporate Tax Individual Tax
Indirect Taxes Trade Taxes
0
1
2
3
4
5
6
7
8
9
10
1980 1984 1988 1992 1996 2000 2004 2008
LMICs
Corporate Tax Individual Tax
Indirect Taxes Trade Taxes
0
1
2
3
4
5
6
7
8
9
10
1980 1984 1988 1992 1996 2000 2004 2008
UMICs
Corporate Tax Individual Tax
Indirect Taxes Trade Taxes

13
the Republic of Congo, the resource revenue-to-GDP ratio increased from an average of 17 percent
in the early 1980s to 32 percent in the late 2000s; during that period, the non-resource revenue
ratio dropped from 15 percent to 7 percent. In Equatorial Guinea, and over the same period, the
resource revenue-to-GDP ratio increased from zero to 35 percent while the non-resource revenue
ratio dropped from 20 to less than 2 percent. In almost all cases, the increase in resource revenues
outweighed the decline in non-resource revenues. These examples suggest that tax policy and
administration factors may have played a role in the decline of non-resource revenues.
Figure 3. Non-resource Taxes in Resource vs. Non-resource Countries
(Percent of GDP, weighted)
3.4. Development by Trading Group
The formation of trading groups in SSA has intensified over the past two decades. The main
objective of this has been to encourage intra-group trade in goods, by reducing or eliminating
tariffs, and reduce competition among the groups vis-à-vis other groups in SSA and non-SSA
countries, by forming customs unions. In certain groups, trade integration was followed by some
domestic tax harmonization, with the aim to reduce tax distortions to intra-group movement of
capital, so that investment decisions to locate within a given group would be unaffected by tax
0
1
2
3
4
5
6
7
8
1980 1985 1990 1995 2000 2005 2010
Non-resource countries
Corporate Tax Individual Tax
Indirect Taxes Trade Taxes
0
1
2
3
4
5
6
7
1980 1985 1990 1995 2000 2005 2010
Resource countries
Corporate Tax Individual Tax
Indirect Taxes Trade Taxes
0
1
2
3
4
5
6
7
1980 1985 1990 1995 2000 2005 2010
Resource countries excluding South Africa
Corporate Tax Individual Tax
Indirect Taxes Trade Taxes
0
2
4
6
8
10
12
14
16
18
20
1975 1980 1985 1990 1995 2000 2005 2010 2015
Total non-resource revenues
Resource Countries
Resource Countries excl. South Africa
Non-resource Countries

14
considerations.11 The graphic analysis in this sub-section attempts to identify developments in the
five main groups that may have consequences for the level and composition of tax revenues.12
Figure 4 shows the usual split of resource and non-resource revenues for the five groups.
Developments in total tax revenues differ markedly across groups. In the EAC and SACU, tax-
revenue to GDP increased steadily—at a much faster pace in the latter group, largely a South Africa
effect. The resource sector played a very minor role in this development, and none in EAC, which is
the only group among the five not to report resource revenues.
In ECOWAS and CEMAC, revenue development is marked by resource revenues; the two regions
accounted for about 83 percent of total resource revenue in SSA in the early 1980s, and roughly 72
percent in the late 2000s. In CEMAC, non-resource revenues have been stagnant since the early
1990s, and are lower by about 2 percentage points of GDP relative to the early 1980s. For these two
groups, trade integration does not seem to have contributed to revenue mobilization. WAEMU has
performed relatively well since the early 1990s, gaining on average 6 percentage points of GDP in
non-resource revenues, but only to recuperate the losses of the 1980s.
11 The most advanced group in this area is the WAEMU; see Mansour and Rota-Graziosi (2013) for an assessment. Cnossen (2011) discusses issues and challenges in domestic tax coordination in SACU. 12 As noted earlier in section 2, these are the East African Community (EAC), the Economic Community of West African States (ECOWAS), the Economic and Monetary Community of Central African States (CEMAC), the Southern African Customs Union (SACU), and the West African Economic and Monetary Union (WAEMU). Since trade integration in the ECOWAS is relatively recent, WAEMU members were included separately as a group, and excluded from ECOWAS.

15
Figure 4. Resource and Non-resource Revenues by Trading Group
(Percent of GDP, weighted)
Note:EAC: East African Community; ECOWAS: Economic Community of West African States (includes non-WAEMU members only); CEMAC: Economic and Monetary Community of Central African States; SACU: Southern Arican Customs Union; WAEMU: West African Economic and Monetary Union.
0
5
10
15
20
25
30
35
40
45
1980 1985 1990 1995 2000 2005 2010
EAC
Total Taxes
0
5
10
15
20
25
30
35
40
1980 1985 1990 1995 2000 2005 2010
ECOWAS
Total Taxes Non-Resource Taxes
0
5
10
15
20
25
30
35
1980 1985 1990 1995 2000 2005 2010
CEMAC
Total Taxes Non-Resource Taxes
0
5
10
15
20
25
30
35
1980 1985 1990 1995 2000 2005 2010
SACU
Total Taxes Non-Resource Taxes
0
5
10
15
20
1980 1985 1990 1995 2000 2005 2010
WAEMU
Total Taxes Non-Resource Taxes

16
Figure 5 shows the main components of the non-resource tax-to-GDP ratio in the five trading
groups. Trade taxes have declined significantly primarily in the Francophone groups (WAEMU and
CEMAC), but remained relatively constant in the other groups—there is a convergence in the share
of this source of revenue to a range of 1.5 to 3 percent of GDP. On average over the period, WAEMU
have replaced slightly over 50 percent of lost trade revenues with indirect taxes, while CEMAC did
less than 40 percent. The most remarkable non-resource revenue mobilization effort occurred in
the EAC, where the increase in indirect taxes was 2.5 times the loss in trade taxes. This suggests
that trade integration and domestic tax coordination are not necessary conditions for successful
revenue mobilization in SSA.
Finally, Figure 5 also shows that the future of the corporate tax in SSA is uncertain. Aside from
SACU, where the corporate tax yields significant revenue due mainly to South Africa, the yield has
been dismal in the other groups, with the exception of ECOWAS, which has seen a slight
improvement in the late 2000s. The reasons for this are not fully known, but extensive investment
incentives that frequently take the form of tax holidays, are one factor that should preoccupy
policy makers.
Figure 5. Main Tax Sources by Trading Group
(Percent of GDP, weighted)
Note: EAC: East African Community; ECOWAS: Economic Community of West African States (includes non-WAEMU members only); CEMAC: Economic and Monetary Community of Central African States; SACU: Southern African Customs Union; WAEMU: West African Economic and Monetary Union.
0
2
4
6
8
10
1980 1985 1990 1995 2000 2005 2010
Trade Taxes
EAC ECOWAS CEMAC
SACU WAEMU
0
2
4
6
8
10
1980 1985 1990 1995 2000 2005 2010
Indirect Taxes
EAC ECOWAS CEMAC
SACU WAEMU
0
2
4
6
8
1980 1985 1990 1995 2000 2005 2010
Corporate Taxes
EAC ECOWAS CEMAC
SACU WAEMU
0
4
8
12
16
1980 1985 1990 1995 2000 2005 2010
Direct Taxes
EAC ECOWAS CEMAC
SACU WAEMU
17
4. Conclusions
This paper has described a new tax revenue dataset for SSA that was constructed for a specific
research project in 2007, and later updated for further research at the IMF Fiscal Affairs
Department. The dataset is not perfect, but is the only available detailed dataset of its nature
covering most SSA countries over a long period. It is hoped that it will motivate additional
empirical research on taxation and wider macro-fiscal issues in SSA.
Several features of the dataset should be of interest: the disaggregation of the main revenue
components; the separation of resource and non-resource revenues, which is increasingly key to
the study of domestic revenue mobilization in SSA; the relative importance of the corporate tax
when the share from oil and gas and mining activities is excluded, and its future role in SSA tax
systems given the forces of corporate tax competition; the separation of tariff revenues from other
consumption taxes, which allows for the development of a more realistic view on how trade
liberalization has impacted revenues, how domestic tax policy has responded, and the growing
role that indirect taxation plays in the tax revenue mix.
The brief trend analysis has shown that for most countries in SSA, domestic revenue mobilization
remains a real challenge. Most additional revenues in the past 15 years came from oil and gas, and
to a lesser extent, mining. This is of course a welcome development that presents many
opportunities, but its significance is relevant only to a small number of countries. For most SSA
countries, the opportunities that additional resource revenue brings may be small compared to the
wider risks that it poses to non-resource revenues—in particular a disincentive to reform the tax
system.
The trend analysis has also shown that progress in revenue mobilization is possible. A number of
EAC countries improved their non-resource revenue-to-GDP ratios; some countries regained the
losses of the 1980s (e.g. Tanzania, Mali, Niger), and some improved their non-resource revenue in
the presence of high resource revenues (e.g. Botswana).

18
References
Baskaran, Thushyanthan, and Arne Bigsten, 2011, Fiscal Capacity and Government Accountability in
Sub-Saharan Africa, Working Paper No. 506, University of Gottenberg School of Business, Economics and Law
Bhushan, Aniket, and Samy Yiagadeesen, 2012, Aid and Taxation: Is Sub-Saharn Africa Different (Ottawa: The North South-Institute)
Brückner, Markus, 2011, An Instrumental Variables Approach to Estimating Tax Revenue Elasticities:
Evidence from Sub-Saharan Africa, Research Paper No. 2011-09, University of Adelaide School of Economics
Crivelli, Ernest, and Sanjeev Gupta, 2014, Resource Blessing, Revenue Curse? Domestic Revenue Effort
in Resource-Rich Countries, Working Paper 14/5 (Washington: International Monetary Fund)
Ebeke Christian, and Hélène Ehrhart, 2010, Tax revenue instability in Sub-Saharan Africa:
Consequences and Remedies, Études et Documents E2010.25 (Clermont-Ferrand: CERDI)
Di John, Jonathon, 2009, Taxation, Governance and Resource Mobilisation in Sub‐Saharan Africa: A
Survey of Key Issues, Working Paper 49/2009 (Madrid: Elcan Royal Institute)
Fjeldstad, Odd-Helge, and Mick Moore, 2009, “Revenue authorities and public authority in sub-Saharan Africa,” Journal of Modern African Studies, 47:I pp. 1-18
Harrison, Graham, and Russel Krelove, 2005, VAT Refunds: A Review of Country Experience, WP 05/218 (Washington: International Monetary Fund)
Jerven, Morten, and Magnus Ebo Duncan, 2012, “Revising GDP estimates in Sub-Saharan Africa: Lessons from Ghana,” African Statistical Journal, Vol. 15, pp. 13-24
Keen, Michael, and Mario Mansour, 2010, “Revenue Mobilization in Sub-Saharan Africa: Challenges from Globalization I – Trade Reform,” Development Policy Review, 28(5): 553–571
Mansour, Mario, and Grégoire Rota-Graziosi, 2013, Tax Coordination, Tax Competition, and Revenue
Mobilization in the West African Economic and Monetary Union, Working Paper 13/163 (Washington: International Monetary Fund)
Prichard, Wilson, and David K. Leonard, 2010, “Does reliance on tax revenue build state capacity in sub-Saharan Africa?” International Review of Administrative Sciences, 76(4), pp. 653-675
Stürmer, Martin, 2010, Let the Good Times Roll? Raising Tax Revenues from the Extractive Sector in Sub-
Saharan Africa during the Commodity Price Boom, Discussion Paper 7/2010 (Bonn: German Development Institute)
World Bank, 2006, Where is the Wealth of Nations? (Washington: World Bank)

Appendix. Tax-to-GDP Ratios: 1980-2010 (Percent)
Total Taxes
1980 1981 1982 1983 1984 1985 1986 1987 1988 1989 1990 1991 1992 1993 1994 1995 1996 1997 1998 1999 2000 2001 2002 2003 2004 2005 2006 2007 2008 2009 2010
Angola 48.6 43.7 33.9 50.3 54.5 48.6 41.2 39.8 39.2 45.3 49.2 45.3 50.1 33.5 41.8
Benin 8.2 14.8 15.5 12.3 9.2 9.7 11.0 9.6 9.2 6.8 7.4 8.4 9.6 10.2 11.0 11.4 11.8 12.6 12.6 13.1 14.1 13.7 14.4 15.1 14.8 14.7 15.5 17.0 17.3 16.7 16.3
Botswana 15.6 26.6 19.3 20.0 24.2 26.0 29.7 31.1 24.2 30.4 29.5 33.9 33.9 31.2 31.0 37.8 24.8 27.5 29.7 20.8 34.6 34.3 27.4 31.7 31.2 31.2 30.5 33.1 28.1 32.1 27.2
Burkina Faso 8.4 8.6 8.3 8.3 8.0 7.9 9.3 9.7 8.8 8.2 9.0 9.0 7.8 7.9 9.7 10.7 11.3 11.6 11.1 12.0 10.8 10.3 10.8 11.1 12.5 11.5 11.2 12.2 11.8 12.3 12.7
Burundi 12.6 11.2 13.4 11.5 13.3 12.9 15.1 13.6 13.6 14.4 13.1 15.0 14.5 15.2 16.6 16.6 13.5 12.8 15.6 15.4 18.3 18.8 17.9 18.7 18.3 18.5 17.3 17.2 16.9 16.4 18.0
Cameroon 13.3 13.7 14.2 19.8 18.2 20.2 14.7 11.7 12.1 11.3 12.0 11.6 10.6 8.9 12.7 12.7 11.4 12.3 13.2 12.8 15.7 16.5 16.6 15.2 14.2 16.2 18.2 18.1 19.2 16.8 16.0
Cape Verde 12.1 13.1 14.9 14.5 13.8 12.0 12.7 11.8 11.5 12.1 13.2 13.5 15.5 16.3 16.7 17.0 16.7 16.3 16.5 16.8 18.2 18.7 20.8 20.1 20.5 21.6 23.4 24.4 25.2 20.2 19.1
Central African Republic 12.4 10.6 12.0 11.5 11.9 9.4 9.6 9.2 9.4 8.5 10.4 8.2 8.0 7.2 6.8 8.8 6.4 7.5 8.3 8.4 8.2 7.6 8.9 6.8 7.2 7.1 7.8 7.6 7.1 7.8 8.4
Chad 2.4 2.0 3.4 4.1 3.7 3.8 4.5 5.4 5.7 4.9 5.0 4.5 3.9 5.5 6.4 6.8 6.8 7.2 6.9 6.2 7.3 7.1 8.5 9.8 16.6 22.3 28.1 16.4 25.7
Comoros 8.8 9.8 10.2 12.3 11.9 11.0 12.2 9.7 11.6 10.2 12.0 10.9 13.2 12.7 12.6 11.4 10.8 12.9 9.7 10.2 9.0 9.2 10.5 13.8 13.5 11.6 10.9 10.0 10.2 10.3 11.1
Congo, Rep. of 17.6 33.8 37.7 34.3 39.3 38.5 27.3 12.8 12.1 12.2 33.8 24.9 22.0 23.4 22.1 23.6 27.3 28.4 22.5 26.3 26.2 30.1 27.1 29.5 29.7 38.3 43.7 38.5 45.8 28.5 37.1
Côte d'Ivoire 21.7 22.4 21.5 20.0 17.8 21.2 20.8 22.1 20.5 18.1 17.6 16.9 16.9 13.9 14.7 16.4 17.2 16.7 15.4 15.0 14.7 15.3 15.7 15.0 15.4 16.4 17.5 17.5 17.0 17.9 18.4
Equatorial Guinea 16.7 20.9 25.3 15.3 24.5 17.0 17.9 15.3 15.1 14.5 14.1 13.4 15.9 16.2 14.7 12.7 17.0 15.6 29.6 19.6 19.6 28.3 28.9 28.6 31.0 31.5 40.7 36.1 35.8 39.8 28.7
Ethiopia 8.6 8.6 8.5 8.6 10.0 8.4 8.9 9.4 10.2 9.7 8.3 7.4 5.3 5.7 7.5 7.9 8.5 9.3 9.5 9.3 9.7 10.9 11.9 11.2 12.6 10.5 10.6 11.4 9.3 10.5 12.7
Gabon 33.4 38.0 39.1 35.8 38.6 38.4 30.6 23.1 20.8 18.4 13.3 18.4 22.0 22.1 23.0 30.2 29.4 30.5 34.7 27.9 33.4 33.6 30.8 29.5 29.6 30.7 31.2 28.8 31.4 31.3 27.6
Gambia 13.0 10.2 10.5 10.5 13.0 12.1 12.3 14.0 13.1 14.5 13.4 13.0 13.7 14.6 13.6 11.5 11.0 11.8 11.7 10.9 11.2 9.1 9.8 9.5 12.9 12.5 14.3 14.6 13.7 13.4 12.0
Ghana 4.2 7.4 4.4 7.8 6.2 7.4 10.3 9.2 8.8 8.7 7.6 7.8 6.1 8.8 11.2 11.3 11.4 9.5 9.9 9.0 11.0 12.3 11.4 13.7 13.2 14.0 14.0 13.6 13.2 12.5 13.8
Guinea 5.5 6.1 6.0 2.8 3.1 3.1 18.8 17.0 13.2 16.9 15.4 13.6 10.8 9.9 9.0 9.6 8.9 10.2 10.5 10.1 9.9 10.3 10.9 10.3 10.7 13.4 13.3 13.5 14.7 15.2 14.9
Guinea-Bissau 6.8 6.4 5.8 5.2 4.4 4.6 2.8 5.1 5.0 2.6 4.8 3.6 2.3 3.0 4.1 4.1 4.1 4.7 2.2 5.5 6.8 5.4 4.2 4.4 4.3 6.3 6.4 6.1 5.9 7.1 8.3
Kenya 13.9 14.4 13.7 12.6 12.8 12.3 12.6 13.2 15.3 13.3 12.9 13.2 13.0 12.6 17.3 17.7 17.9 16.8 17.5 17.1 16.2 16.4 16.2 16.2 16.6 17.2 16.1 17.0 17.9 17.6 18.3
Lesotho 27.2 25.4 24.1 25.2 32.6 32.8 31.0 30.1 25.3 25.7 29.6 31.2 32.5 35.7 39.2 40.2 38.6 37.6 38.0 33.1 34.1 30.9 33.9 34.4 35.5 46.5 59.4 54.6 57.8 54.5 36.8
Madagascar 16.1 12.8 12.0 11.2 11.8 10.0 9.3 11.0 10.5 8.8 9.4 6.8 8.7 8.2 7.7 8.3 8.5 9.4 9.8 11.0 11.3 9.7 7.7 10.0 10.9 10.1 10.7 11.4 13.0 10.6 10.7
Malawi 14.3 14.7 14.4 14.5 14.0 15.2 17.0 15.3 13.2 15.6 17.9 14.4 15.8 12.4 13.4 9.5 11.3 13.1 15.1 13.5 14.1 15.6 10.2 11.7 13.1 14.0 14.1 15.1 16.0 16.8 17.4
Mali 9.2 10.6 12.0 10.9 10.3 11.4 12.6 12.4 12.5 10.0 8.8 10.5 10.2 10.3 8.6 9.4 11.7 12.2 12.8 13.0 12.3 12.7 14.6 14.8 15.3 15.6 14.8 15.2 13.8 14.9 14.8
Mauritius 17.3 17.6 16.4 18.0 18.9 17.8 17.8 18.0 19.1 19.7 19.5 19.8 18.3 17.2 17.0 14.8 14.4 15.9 15.5 16.0 16.4 14.8 14.6 15.9 16.0 18.0 17.4 17.7 18.5 19.4 18.8
Mozambique 7.5 10.1 10.9 12.1 11.2 6.8 7.3 15.9 9.9 11.4 8.1 9.6 11.4 12.4 10.5 10.6 8.7 9.6 9.6 9.9 10.4 10.0 10.7 12.3 12.1 12.3 13.0 12.9 13.7 14.7 18.1
Namibia 18.5 19.2 19.9 19.0 23.4 26.0 22.7 22.1 27.5 22.6 25.5 26.6 25.1 25.4 24.6 25.0 29.6 27.1 28.7 28.5 26.9 31.2 24.1 24.3 22.9 23.5 26.8 28.0 26.5
Niger 12.3 10.9 9.9 9.1 9.6 9.2 9.4 8.6 7.8 8.2 7.9 7.1 6.8 6.6 5.4 7.1 7.1 7.7 8.4 8.5 8.7 9.4 10.0 9.9 11.0 9.8 11.8 12.4 16.4 13.2 12.8
Nigeria 30.9 25.0 21.6 17.5 18.0 14.5 22.2 22.0 19.9 23.9 32.6 30.1 32.2 32.1 21.7 14.1 14.0 14.8 11.4 26.6 36.7 39.7 26.4 29.8 33.6 37.6 32.9 26.5 31.6 16.7 21.4
Rwanda 9.6 9.4 9.1 8.6 8.8 10.0 11.7 10.8 10.3 10.0 9.1 9.5 9.3 8.8 3.6 6.7 8.8 10.0 10.3 10.0 9.7 10.7 11.9 11.6 11.2 11.3 11.2 11.6 12.8 11.7 12.0
Sâo Tomé and Principe 15.1 9.9 15.1 9.9 11.8 11.3 8.0 9.4 6.9 5.2 4.5 5.4 6.3 4.9 3.7 4.2 3.0 5.0 7.3 9.8 9.7 11.4 11.5 12.5 15.5 18.5 17.4 16.4 14.9 13.2 15.6
Senegal 17.4 13.1 13.7 15.6 15.0 14.3 12.8 12.9 13.8 12.5 14.1 15.2 15.5 13.7 12.4 13.6 14.3 14.7 14.8 15.5 16.1 16.1 16.9 17.0 17.4 18.3 18.6 19.3 18.2 17.7 18.1
Seychelles 30.7 34.3 35.6 33.7 33.8 33.7 35.5 40.0 36.5 38.0 38.3 34.3 34.6 42.9 41.7 38.7 34.3 34.6 33.5 34.3 33.5 31.6 32.8 39.8 33.6 30.8 30.0 27.8 28.2 30.9 31.2
Sierra Leone 12.9 13.8 10.0 6.2 5.4 4.2 2.6 5.2 4.4 5.1 7.9 7.5 10.1 12.0 12.2 9.0 9.9 5.5 7.2 7.0 10.8 12.7 11.9 12.2 11.5 10.4 10.3 9.6 12.2 12.5 12.1
South Africa 15.6 17.3 17.5 18.2 17.3 18.4 19.6 19.5 18.0 19.1 21.1 20.1 19.4 17.8 19.5 20.8 20.6 21.5 22.3 22.7 21.8 21.6 21.5 22.2 21.4 22.6 23.6 24.6 25.2 26.1 22.5
Swaziland 15.7 16.3 11.8 14.5 13.3 14.0 14.2 12.8 15.4 16.5 15.1 21.0 19.9 17.5 18.0 17.7 20.4 20.5 21.8 21.8 22.5 22.7 22.2 22.6 24.8 32.2 42.1 36.0 38.6 34.7 24.4
Tanzania 14.2 14.1 13.0 14.0 14.4 14.3 12.3 13.5 8.0 9.5 9.3 10.3 10.6 8.1 9.1 9.4 9.7 10.4 9.7 9.1 9.1 9.7 9.6 9.7 10.1 11.7 13.0 15.3 16.4 15.7 15.8
Togo 29.2 25.3 26.9 23.1 25.2 30.2 25.7 20.3 18.2 19.3 16.9 13.8 11.2 7.7 10.8 13.6 12.1 12.3 12.8 12.3 11.3 12.5 11.2 15.3 15.7 14.5 15.6 16.2 14.9 15.4 15.7
Uganda 2.7 1.2 6.5 9.4 8.3 7.5 6.1 3.6 4.8 4.2 6.3 7.6 6.5 7.0 8.0 9.3 9.9 10.6 10.0 10.9 9.9 10.0 10.6 10.8 10.1 11.4 11.8 11.9 12.3 11.8 11.8
Zambia 23.0 21.4 21.5 22.8 20.5 20.1 21.8 21.1 15.2 17.7 19.8 18.2 17.4 15.3 18.6 18.1 18.9 18.7 18.1 22.9 22.9 24.6 17.5 17.3 17.5 17.2 16.4 17.9 18.0 15.3 16.9
Zimbabwe 16.3 17.5 23.2 25.0 27.2 20.9 21.7 23.5 22.0 21.3 20.6 20.0 24.2 21.8 19.9 21.1 18.5 21.5 35.4 24.3 22.8 18.1 16.8 24.0 32.5 2.9 15.1 30.4

20
Direct Taxes
1980 1981 1982 1983 1984 1985 1986 1987 1988 1989 1990 1991 1992 1993 1994 1995 1996 1997 1998 1999 2000 2001 2002 2003 2004 2005 2006 2007 2008 2009 2010
Angola 0.9 1.5 2.2 1.7 1.6 2.9 2.7 2.9 2.8 5.2 4.4 3.7 3.9 3.6 4.2
Benin 1.1 3.4 3.5 3.4 2.4 2.4 3.3 3.2 2.8 2.4 2.3 2.3 2.8 3.0 3.9 3.9 3.8 3.2 3.4 3.2 3.3 3.2 3.5 3.4 3.8 3.6 3.7 3.9 3.9 3.6 3.6
Botswana 3.9 3.9 3.6 4.2 4.4 3.6 3.4 3.2 3.6 3.9 5.2 3.5 3.9 3.4 3.7 2.9 2.2 2.0 2.4 2.9 2.9 2.6 3.2 4.6 4.4 4.0 4.4 4.0 4.3 5.6 5.5
Burkina Faso 1.7 1.6 1.5 1.5 1.8 1.3 1.8 2.2 2.0 2.0 2.4 2.4 2.3 2.2 2.0 2.5 3.0 2.8 2.6 2.9 3.3 2.7 2.8 2.7 2.8 3.0 2.9 3.2 3.0 3.0 3.1
Burundi 2.6 3.0 3.5 3.1 2.9 2.6 2.9 2.5 3.3 2.8 3.5 4.0 4.0 4.7 3.6 3.7 4.0 3.5 4.6 4.1 3.9 5.2 5.0 5.0 4.9 4.9 4.9 5.0 5.0 4.6 5.5
Cameroon 3.1 4.3 6.2 6.4 2.8 1.8 2.1 2.0 2.6 2.2 1.8 1.5 1.4 1.3 1.1 1.2 1.3 1.8 2.2 2.8 2.8 3.1 3.4 2.9 2.7 3.0 2.8 3.1 3.1 3.2 3.0
Cape Verde 3.4 4.3 5.8 5.6 5.1 4.1 4.4 4.1 3.8 3.8 4.0 3.9 4.4 5.2 5.6 5.6 5.5 5.8 5.5 5.2 6.1 6.9 7.7 7.3 7.3 6.8 7.1 7.1 7.3 6.3 5.7
Central African Republic 2.8 2.4 2.8 3.0 2.7 2.4 2.6 2.6 2.4 2.1 2.6 2.2 2.0 1.8 1.8 1.9 1.6 2.1 2.3 2.3 1.9 2.2 2.5 2.1 2.3 2.0 2.2 1.8 1.7 2.0 2.1
Chad 0.0 0.0 0.3 0.2 0.4 0.9 1.0 1.1 1.1 1.6 1.6 1.8 1.9 1.5 1.3 2.3 2.6 2.4 2.2 2.5 2.3 2.3 3.1 3.3 2.3 1.9 2.0 2.8 2.6 3.4 3.6
Comoros 0.4 0.4 0.5 1.1 1.1 1.3 1.9 1.3 3.1 1.9 3.4 1.9 2.4 1.3 1.8 1.6 1.2 1.5 1.7 2.0 1.8 1.2 2.2 2.3 2.5 1.7 2.2 2.6 2.0 1.8 2.4
Congo, Rep. of 3.6 4.1 6.8 5.8 4.2 4.6 3.9 3.7 3.1 3.0 2.8 4.4 5.4 4.2 3.5 2.5 3.0 2.5 3.4 2.9 2.1 2.9 2.7 3.2 2.9 2.5 2.2 2.6 2.3 3.1 3.0
Côte d'Ivoire 4.8 5.1 4.7 5.1 4.4 3.8 5.1 5.3 5.2 4.5 4.8 4.1 4.1 3.2 2.7 3.7 4.1 4.4 4.3 4.2 4.5 4.2 4.2 3.6 3.5 5.2 5.4 5.1 5.2 5.4 5.2
Equatorial Guinea 2.0 2.6 1.7 3.0 0.8 0.6 0.7 0.9 1.3 1.0 0.6 0.8 0.4 0.4 0.6 0.4 0.6 0.6 0.9 0.7 0.4 0.7 1.0 0.7 0.7 0.6 0.7 0.5 0.4 0.9 0.8
Ethiopia 2.2 2.8 2.9 3.0 3.5 3.1 3.4 3.8 4.2 4.2 3.4 2.8 2.1 1.8 2.2 2.5 3.0 3.0 3.0 3.1 3.3 3.7 4.5 3.9 3.6 2.1 2.1 2.2 2.2 2.6 3.1
Gabon 3.2 2.6 3.0 3.0 3.1 3.4 3.6 4.7 4.0 4.1 3.2 3.5 3.1 2.9 2.5 3.1 2.8 3.2 4.1 3.2 2.3 2.8 3.9 3.5 3.9 3.0 3.2 3.5 3.4 4.5 3.6
Gambia 2.4 2.5 2.0 1.5 1.9 2.1 2.0 1.9 1.8 2.0 2.0 1.7 2.0 2.6 2.5 2.5 2.3 2.8 2.9 2.8 2.9 2.7 3.0 3.0 3.5 3.8 4.3 4.3 4.9 3.7 3.8
Ghana 1.2 2.2 1.5 1.6 1.4 1.7 2.3 2.3 2.8 2.3 1.9 1.5 1.3 1.9 2.3 2.7 2.9 2.8 2.8 2.7 3.5 4.0 3.7 4.2 4.0 4.1 3.8 4.1 4.2 4.7 5.3
Guinea 2.2 0.9 2.7 0.9 0.9 0.6 3.6 4.3 1.2 1.3 2.5 0.6 0.8 0.8 0.9 1.0 1.1 1.1 1.1 1.2 1.1 1.3 1.5 1.5 1.4 1.7 1.9 2.5 2.4 3.1 2.7
Guinea-Bissau 1.4 1.2 0.9 0.9 1.0 1.0 0.7 0.6 0.5 0.6 0.9 0.4 0.4 0.4 0.5 0.6 0.6 0.8 0.4 0.8 1.2 1.0 0.8 1.1 1.0 1.6 1.8 1.8 1.9 2.2 2.6
Kenya 4.5 4.5 4.0 4.1 4.0 4.2 4.2 4.1 4.4 4.3 4.3 4.5 4.7 4.4 6.9 7.0 7.0 6.4 6.6 6.1 5.6 5.5 5.7 6.1 6.3 7.0 7.0 7.2 8.0 7.8 8.2
Lesotho 3.2 4.4 4.2 4.2 3.7 3.5 3.9 4.5 3.7 3.4 3.7 3.8 6.3 6.7 5.9 7.2 7.5 7.2 7.2 7.6 7.6 7.5 8.2 8.9 10.5 11.0 10.4 10.4 11.9 12.4 12.2
Madagascar 2.8 3.2 2.4 2.2 2.7 1.7 1.8 1.6 1.5 1.1 1.5 1.3 1.3 1.6 1.7 1.2 1.6 1.8 1.8 1.7 1.8 2.0 1.8 1.7 2.0 2.2 2.7 2.6 3.3 2.8 2.7
Malawi 5.9 5.9 5.0 5.5 5.5 6.0 6.8 6.3 5.3 6.6 7.4 6.0 6.4 4.7 5.0 3.6 4.1 5.6 6.5 6.2 6.3 7.1 4.6 5.1 5.5 6.1 6.1 6.6 6.7 7.3 8.3
Mali 1.9 1.7 1.7 1.6 1.5 1.6 1.7 1.3 1.3 1.4 1.6 1.5 1.6 1.4 1.4 1.9 2.3 2.4 2.5 1.9 1.5 1.8 2.0 2.6 2.6 2.7 2.6 2.6 2.5 2.8 2.8
Mauritius 3.0 3.6 3.2 2.9 2.9 2.4 2.1 2.5 2.7 2.9 3.1 3.0 3.1 2.4 2.2 2.4 2.5 2.6 2.4 2.4 2.3 2.2 2.4 2.5 2.6 4.5 4.7 5.2 6.1 6.7 5.8
Mozambique 1.2 1.7 2.9 3.3 3.0 2.2 2.0 2.2 2.6 2.6 1.6 2.0 2.0 2.0 2.1 1.9 1.7 2.0 1.9 1.5 1.6 1.8 2.1 2.9 2.7 2.9 3.5 4.5 4.2 4.5 5.9
Namibia 3.5 2.6 4.6 5.6 8.6 10.3 8.8 6.6 10.6 8.3 6.5 8.3 8.1 8.1 7.3 8.1 10.5 9.8 9.8 9.5 10.0 13.1 10.0 8.7 8.1 7.5 7.7 8.8 8.8
Niger 3.5 2.6 2.1 2.1 2.1 2.4 2.4 2.2 2.3 2.5 2.0 2.1 2.4 2.1 1.5 2.1 1.7 1.5 1.6 1.6 1.5 1.7 1.6 1.8 2.0 1.8 2.0 2.2 2.4 3.4 3.2
Nigeria 1.3 1.1 1.3 2.0 1.3 1.5 2.5 1.1 1.1 0.9 1.2 1.2 1.0 1.3 1.5 1.2 0.8 1.0 1.3 1.4 1.3 1.7 1.4 1.4 1.3 1.2 1.6 2.0 2.2 3.1 2.7
Rwanda 2.1 2.7 2.1 1.7 1.9 1.9 2.0 2.5 2.7 2.5 2.4 2.1 2.2 2.2 0.9 0.9 2.4 2.6 2.9 2.5 2.6 3.2 3.7 3.5 3.2 3.5 3.7 4.2 4.8 4.5 5.0
Sâo Tomé and Principe 2.7 1.1 4.2 3.6 3.4 3.5 2.2 2.5 1.2 1.0 0.9 0.9 0.6 0.6 0.5 1.0 0.9 2.2 2.4 3.1 3.3 3.5 4.1 3.6 4.2 4.5 4.7 4.5 4.0 4.1 3.9
Senegal 4.1 3.7 3.3 3.5 3.8 3.6 3.4 3.3 3.8 3.6 3.9 4.2 4.0 3.7 2.9 3.3 3.3 3.5 3.6 3.4 3.9 3.7 3.9 4.0 4.2 4.7 4.5 4.3 4.6 4.8 4.9
Seychelles 9.3 11.0 10.8 9.6 9.1 9.6 8.8 9.8 6.6 8.4 7.8 6.5 5.8 5.6 5.5 5.9 4.6 4.6 5.2 6.7 7.0 6.3 6.6 7.3 6.3 10.6 11.0 9.7 9.4 11.1 10.7
Sierra Leone 3.1 3.7 2.4 1.9 1.6 1.2 0.7 1.0 1.7 1.4 1.9 1.9 2.3 2.9 2.6 1.4 1.6 1.5 1.2 1.8 2.9 3.4 3.1 3.1 3.4 3.3 3.3 2.9 3.4 3.3 4.0
South Africa 5.4 7.1 7.6 8.4 8.1 8.7 9.1 8.5 8.4 8.8 10.2 10.2 10.8 10.1 10.2 10.6 10.8 11.3 12.0 12.3 11.7 11.4 11.5 11.8 11.2 11.6 12.1 12.9 13.7 15.0 12.7
Swaziland 4.4 4.2 4.0 3.6 3.4 3.8 4.0 3.8 6.2 6.1 5.5 7.0 7.1 6.8 6.3 5.9 5.7 6.1 6.1 6.2 6.6 6.0 5.8 6.0 7.5 8.0 8.5 8.0 8.3 9.3 9.6
Tanzania 5.0 4.7 4.4 4.6 4.3 4.0 3.9 3.3 2.0 2.5 2.3 2.8 2.8 2.5 2.4 2.7 2.8 3.2 2.6 2.4 2.7 2.3 2.3 2.4 2.8 3.4 3.9 4.7 5.2 4.9 5.1
Togo 11.5 8.7 10.7 10.1 12.5 11.7 10.1 7.9 6.9 7.8 6.5 4.8 4.5 2.9 4.4 5.6 4.2 3.7 3.3 3.4 2.9 3.9 2.8 4.8 4.9 3.9 4.1 3.8 3.3 3.8 3.9
Uganda 0.3 0.2 0.6 0.5 0.6 0.5 0.3 0.4 0.4 0.5 0.6 0.8 0.9 1.1 1.3 1.5 1.4 1.6 1.7 2.1 1.9 2.2 2.6 2.8 2.8 3.5 3.6 3.7 3.5 3.6 3.9
Zambia 9.5 8.1 7.6 8.4 6.5 6.2 6.1 6.9 6.3 7.4 7.8 6.5 6.5 5.5 5.7 5.7 5.6 5.7 6.3 9.4 9.0 10.0 7.6 7.8 7.8 7.7 7.1 7.0 7.6 7.2 7.3
Zimbabwe 9.2 9.9 12.3 12.6 12.5 9.9 10.3 12.1 11.8 10.7 10.8 10.6 11.1 11.6 11.0 11.2 9.4 10.9 18.7 13.0 14.4 10.4 9.3 13.3 17.1 1.0 3.8 11.4

21
Corporate Tax
1980 1981 1982 1983 1984 1985 1986 1987 1988 1989 1990 1991 1992 1993 1994 1995 1996 1997 1998 1999 2000 2001 2002 2003 2004 2005 2006 2007 2008 2009 2010
Angola
Benin 0.3 0.8 1.0 0.9 0.6 0.5 0.7 1.2 0.8 0.4 0.6 0.8 1.3 1.3 2.3 2.4 2.2 1.8 1.8 1.7 1.5 1.8 1.9 1.8 1.6 1.7 2.1 2.0 1.8 1.5 1.5
Botswana 2.2 1.9 1.7 2.1 2.4 2.0 1.8 1.7 2.6 2.8 4.2 2.2 2.5 2.1 1.9 1.2 0.9 0.9 1.0 1.2 1.2 1.1 1.4 1.9 1.9 1.2 1.3 0.9 1.8 1.5 1.5
Burkina Faso 0.4 0.4 0.4 0.4 0.5 0.2 0.6 0.8 0.5 0.6 0.5 0.9 0.9 0.6 0.6 1.3 1.5 1.4 1.1 1.4 1.7 1.3 1.3 1.5 1.5 1.5 1.4 1.5 1.5 1.2 1.3
Burundi 1.3 1.2 1.5 1.4 1.3 1.1 1.2 1.2 1.5 1.0 1.4 1.1 2.1 2.0 1.7 2.0 2.1 1.5 2.2 1.8 2.3 3.5 3.2 3.2 2.8 2.9 2.6 2.7 2.7 2.6 2.7
Cameroon 1.4 2.2 4.1 4.5 1.0 0.4 1.0 0.7 1.3 0.8 0.9 0.7 0.4 0.4 0.4 0.5 0.6 0.6 0.8 1.0 1.1 1.3 1.3 1.1 1.2 1.7 1.5 1.6 1.6 1.6 1.5
Cape Verde 0.8 1.4 1.3 1.2 1.2 1.2 1.5 1.4 1.6 1.5 1.7 1.8 1.8 2.4 3.0 2.9 1.9 0.2 2.4 1.8 1.5 2.5 2.9 2.6 2.4 2.7 2.8 2.9 3.1 2.8 2.3
Central African Republic 1.0 0.9 1.2 0.9 0.8 0.5 0.7 0.6 0.9 0.7 0.7 0.6 0.5 0.5 0.3 0.8 0.4 0.3 0.4 0.5 0.4 0.4 0.5 0.4 0.4 0.4 0.4 0.5 0.3 0.5 0.6
Chad 0.0 0.0 0.0 0.2 0.3 0.4 0.5 0.4 0.4 0.6 0.4 0.4 0.5 1.2 1.4 1.1 1.0 1.3 1.1 1.0 1.4 1.3 1.0 0.8 0.9 1.4 1.4 1.6 1.8
Comoros 0.3 0.2 0.3 0.5 0.6 0.9 1.4 1.0 2.8 1.7 3.1 1.6 1.3 0.8 1.3 1.0 0.5 1.0 1.1 1.5 1.2 0.8 1.8 1.8 2.0 1.4 1.7 2.0 1.6 1.1 1.6
Congo, Rep. of 1.9 3.0 5.0 4.0 2.6 2.4 1.8 1.5 1.2 1.2 0.9 1.9 2.1 2.1 1.5 1.3 1.6 1.3 1.8 1.5 1.1 1.5 1.4 1.7 1.6 1.3 1.2 1.4 1.2 1.6 1.6
Côte d'Ivoire 1.4 1.6 1.6 1.4 1.2 1.1 1.5 1.6 1.5 1.1 1.1 0.9 1.0 0.6 0.7 1.7 2.0 2.2 2.2 1.9 1.9 1.5 1.4 1.1 1.1 1.1 0.9 1.7 1.8 1.9 1.7
Equatorial Guinea 0.5 0.2 0.1 0.0 0.0 0.2 0.1 0.3 0.3 0.7 0.2 0.1 0.3 0.4 0.4 0.5 0.4 0.5 0.3 0.3 0.6 0.5
Ethiopia 1.1 1.7 1.8 1.9 2.2 2.1 2.2 2.6 2.9 2.8 2.1 1.7 1.3 0.9 1.4 1.7 2.2 2.2 2.0 1.9 2.0 2.1 2.5 2.2 1.5 1.2 1.3 1.5 1.5 1.9 2.2
Gabon 1.7 1.6 1.7 1.8 1.8 1.8 2.0 2.4 1.9 1.9 1.5 1.4 1.4 1.2 1.1 1.7 1.5 2.0 2.6 1.9 1.5 1.8 2.1 1.8 2.3 1.7 1.9 2.1 2.1 2.5 2.1
Gambia 1.1 1.3 1.1 0.6 0.7 1.1 1.0 1.0 1.1 0.9 0.9 0.9 1.2 1.6 1.6 1.3 1.2 1.4 1.4 1.4 1.5 1.4 1.7 1.8 2.1 2.2 2.7 2.3 2.3 1.7 1.5
Ghana 0.6 1.1 0.7 0.8 0.8 1.0 1.4 1.4 1.9 1.6 1.2 1.0 0.7 0.9 1.2 1.6 1.6 1.3 1.2 1.3 1.7 1.8 1.5 1.7 1.8 2.0 1.6 1.7 1.8 1.8 2.1
Guinea 1.6 0.6 1.6 0.6 0.7 0.1 0.0 0.0 0.1 0.2 0.1 0.1 0.1 0.1 0.3 0.3 0.2 0.2 0.2 0.3 0.2 0.4 0.5 0.5 0.5 0.4 0.5 0.6 0.6 0.8 0.7
Guinea-Bissau 0.2 0.3 0.2 0.2 0.3 0.3 0.3 0.3 0.3 0.5 0.6 0.2 0.2 0.2 0.2 0.4 0.4 0.5 0.2 0.3 0.7 0.5 0.4 0.8 0.6 0.7 0.8 0.7 0.9 1.1 1.5
Kenya
Lesotho 0.8 1.2 1.3 1.3 1.2 1.0 1.1 1.6 0.8 1.2 1.3 1.6 2.5 2.1 1.7 2.1 1.5 1.3 1.5 1.3 1.1 2.0 2.3 1.9 2.9 2.2 2.0 2.5 2.8 4.6 2.8
Madagascar 1.2 1.4 1.1 1.0 1.3 0.8 0.8 0.7 0.7 0.6 0.8 0.7 0.5 1.0 0.8 0.6 1.0 1.1 1.1 0.9 0.9 1.0 0.7 0.8 0.9 1.2 1.3 1.3 1.6 1.5 1.3
Malawi 3.6 3.6 2.7 3.1 3.1 3.7 4.7 4.0 2.8 4.0 4.4 3.6 3.7 2.3 2.4 1.6 2.0 3.1 2.7 2.6 2.5 2.5 1.4 1.6 1.6 1.7 1.8 1.8 1.9 2.3 2.9
Mali 1.1 0.9 1.2 1.1 1.0 1.1 1.1 0.5 0.6 0.7 0.8 0.7 0.7 0.6 0.5 0.8 1.3 1.3 1.5 1.0 0.6 0.9 0.6 1.3 1.2 1.0 1.2 1.1 1.2 1.1 1.2
Mauritius 1.3 1.8 1.4 1.1 1.0 0.8 0.9 1.1 1.4 1.6 1.7 1.8 2.0 1.3 1.2 1.3 1.2 1.2 1.2 1.2 1.1 1.1 1.3 1.3 1.3 2.1 2.3 2.4 3.0 3.7 2.8
Mozambique 0.5 0.7 1.7 1.9 1.8 1.4 1.2 1.7 2.1 2.1 1.2 1.4 1.1 1.0 1.0 0.9 0.8 0.9 0.9 0.7 0.6 0.6 0.8 1.2 0.9 1.0 1.4 1.8 1.9 2.2 3.1
Namibia 5.7 5.9 3.5 1.5 2.7 3.2 3.3 2.6 2.5 5.0 3.5 3.0 3.3 4.1 6.2 3.3 2.7 2.5 2.0 2.5 2.6 2.7
Niger 1.9 1.4 1.1 1.0 1.2 1.2 0.9 1.2 1.0 1.0 0.8 0.8 0.8 0.7 0.7 1.0 0.6 0.6 0.6 0.8 0.6 0.8 0.8 1.1 1.2 0.9 1.1 1.3 1.4 2.0 2.1
Nigeria 1.2 1.1 1.2 1.9 1.2 1.4 1.3 1.0 1.0 0.9 1.2 1.2 1.0 1.3 1.3 1.1 0.8 0.9 1.2 1.4 1.1 1.4 1.3 1.3 1.1 1.1 1.3 1.6 1.7 2.3 2.2
Rwanda 1.1 0.9 0.9 0.8 0.7 0.7 0.7 1.2 1.0 0.9 0.9 0.7 0.9 0.9 0.0 0.0 0.0 0.0 2.1 1.2 1.5 2.0 2.2 1.8 1.6 1.7 1.5 1.7 2.0 1.9 2.1
Sâo Tomé and Principe 1.4 0.2 1.3 0.4 0.6 0.4 0.6 0.8 0.1 0.6 0.5 0.4 0.2 0.2 0.2 0.6 0.4 1.1 1.2 1.3 1.1 1.5 2.2 1.6 1.9 2.0 1.8 1.8 1.5 1.6 1.3
Senegal 1.1 1.0 0.9 0.9 0.9 1.0 0.8 0.8 0.9 0.9 1.0 1.0 1.1 0.7 0.8 1.0 1.0 1.1 1.3 1.2 1.5 1.4 1.5 1.4 1.6 1.8 1.6 1.5 1.5 1.3 1.4
Seychelles 3.6 4.6 4.2 3.3 3.2 4.1 3.3 5.4 5.3 5.3 6.0 7.5 7.0
Sierra Leone 2.1 2.5 1.4 0.9 0.9 0.8 0.4 0.5 1.3 0.9 1.3 1.3 1.5 1.9 1.7 0.7 0.8 0.8 0.6 0.7 1.2 1.2 1.5 1.7 1.6 1.8 1.5 1.0 1.1 1.0 1.2
South Africa 2.3 3.0 3.8 3.9 2.9 3.0 3.2 2.9 2.8 3.3 3.8 3.6 3.4 2.8 2.3 2.4 2.5 2.7 2.8 2.7 2.4 3.0 3.8 4.4 4.3 4.5 5.0 5.9 6.3 6.9 5.0
Swaziland 2.3 1.8 1.8 1.6 1.4 1.5 1.8 1.4 3.6 3.6 3.5 4.5 4.9 4.7 4.0 3.4 2.9 3.1 2.9 2.8 2.6 2.1 2.0 1.9 2.2 2.9 3.1 2.0 2.6 2.7 2.8
Tanzania 3.1 2.9 2.8 2.9 2.7 2.3 2.4 2.0 1.4 1.8 1.8 0.9 0.7 0.8 1.6 1.4 1.3 1.1 1.1 0.7 0.6 0.5 0.6 0.7 0.8 1.2 1.2 1.5 1.7 1.5 1.5
Togo 9.1 6.7 8.0 7.7 7.1 8.8 7.8 5.4 4.8 5.7 4.2 2.7 2.3 1.0 2.6 3.2 2.2 2.1 1.6 1.7 1.3 1.1 1.1 1.6 1.9 1.6 1.8 1.7 1.5 1.5 1.5
Uganda 0.3 0.2 0.6 0.4 0.6 0.4 0.3 0.4 0.4 0.4 0.0 0.0 0.0 0.0 0.0 0.0 0.0 0.0 0.4 0.5 0.4 0.5 0.6 0.7 0.8 1.0 1.0 0.9 0.9 0.8 0.9
Zambia 0.0 0.0 0.0 0.0 0.0 0.0 2.8 5.5 4.6 5.5 6.3 4.3 2.7 2.7 1.9 1.3 1.2 1.2 1.5 6.4 6.3 7.2 1.7 1.2 1.3 1.3 1.4 1.4 1.5 1.4 1.4
Zimbabwe 3.7 4.1 5.4 5.8 5.0 3.5 3.5 4.4 4.8 3.9 3.9 3.7 3.8 4.1 4.1 3.8 3.3 3.0 4.0 3.0 2.7 2.1 1.8 1.5 2.5 0.0 0.0 0.0 0.4 0.8 3.4

22
Individual Tax
1980 1981 1982 1983 1984 1985 1986 1987 1988 1989 1990 1991 1992 1993 1994 1995 1996 1997 1998 1999 2000 2001 2002 2003 2004 2005 2006 2007 2008 2009 2010
Angola 0.0 0.0 0.0 0.0 0.0 0.0 0.0 0.0 0.0 0.0 0.0 0.0 0.0 0.0 0.0
Benin 0.4 0.4 0.5 0.5 1.1 0.7 0.9 0.9 1.0 0.9 0.9 0.9 0.9 1.0 1.1 0.8 0.9 1.0 1.1 1.1 1.3 1.3 1.4 1.5 1.8 1.7 1.4 1.6 1.9 1.8 1.7
Botswana 1.7 2.0 1.8 2.0 1.9 1.6 1.6 1.5 1.0 1.1 1.0 1.3 1.4 1.2 1.7 1.7 1.3 1.2 1.4 1.7 1.7 1.5 1.9 2.7 2.5 1.6 1.8 1.6 2.0 3.9 3.8
Burkina Faso 1.0 0.9 1.0 1.0 1.1 0.9 0.9 1.1 1.2 1.2 1.5 1.2 1.2 0.9 1.0 1.0 1.2 1.2 1.2 1.2 1.3 1.1 1.2 0.9 1.1 1.2 1.3 1.5 1.3 1.5 1.6
Burundi 1.1 1.6 1.7 1.5 1.4 1.3 1.5 1.0 1.6 1.6 1.8 1.8 1.5 1.5 1.8 1.6 1.9 1.8 2.3 2.3 1.6 1.5 1.7 1.8 2.0 1.9 2.0 2.2 2.2 1.9 2.6
Cameroon 1.6 2.1 2.0 1.9 1.9 1.5 0.9 1.0 1.0 0.8 0.9 0.8 1.0 0.9 0.7 0.8 0.7 0.6 0.7 0.9 0.9 0.9 1.1 1.1 0.7 1.1 1.1 1.3 1.3 1.4 1.4
Cape Verde 0.2 0.3 0.5 0.5 0.7 0.7 0.7 0.7 0.6 0.7 2.3 2.2 2.6 2.8 2.6 2.7 3.7 5.6 3.1 3.4 4.6 4.4 4.7 4.7 4.9 4.1 4.3 4.2 4.1 3.5 3.4
Central African Republic 1.5 1.1 1.2 1.5 1.5 1.2 1.3 1.7 1.1 1.1 1.0 1.2 1.0 0.8 1.1 0.9 0.9 0.9 0.6 1.0 0.9 1.0 1.1 1.0 1.1 0.8 0.9 1.0 0.9 1.0 0.8
Chad 0.2 0.2 0.3 0.5 0.6 0.5 0.6 1.0 1.1 1.2 1.3 1.0 0.7 1.0 1.0 1.2 1.0 1.1 1.0 1.0 1.6 1.9 1.2 1.0 1.0 1.3 1.0 1.6 1.5
Comoros 0.2 0.2 0.2 0.5 0.5 0.4 0.5 0.2 0.3 0.2 0.2 0.3 0.5 0.5 0.5 0.5 0.5 0.5 0.5 0.5 0.5 0.4 0.4 0.4 0.4 0.3 0.4 0.5 0.4 0.7 0.8
Congo, Rep. of 1.7 1.2 1.8 1.8 1.7 2.3 2.1 2.2 2.0 1.8 1.9 2.5 3.2 2.0 1.9 1.2 1.4 1.2 1.6 1.4 1.0 1.4 1.3 1.5 1.4 1.2 1.0 1.2 1.1 1.5 1.4
Côte d'Ivoire 1.5 1.7 0.9 1.0 1.0 0.9 1.8 1.9 1.9 1.8 2.1 1.8 1.9 1.6 1.3 1.2 1.2 1.4 1.4 1.5 1.7 1.7 1.8 1.7 1.7 1.9 2.2 2.0 2.1 2.1 2.1
Equatorial Guinea 0.3 1.2 1.1 2.3 0.7 0.6 0.5 0.6 0.7 0.5 0.3 0.6 0.3 0.3 0.3 0.3 0.3 0.3 0.2 0.4 0.3 0.4 0.6 0.3 0.2 0.2 0.2 0.1 0.1 0.3 0.2
Ethiopia 0.7 0.8 0.8 0.8 1.0 0.8 0.9 1.0 1.1 1.1 1.1 0.9 0.8 0.7 0.7 0.6 0.6 0.6 0.8 0.9 0.9 1.0 1.1 1.1 1.1 0.5 0.4 0.5 0.4 0.4 0.4
Gabon 0.9 0.9 1.0 1.0 1.1 1.1 1.2 1.8 1.6 1.8 1.4 1.7 1.7 1.7 1.4 1.4 1.2 1.3 1.5 1.3 0.7 1.0 1.8 1.7 1.6 1.3 1.3 1.4 1.3 2.0 1.5
Gambia 1.2 1.2 0.8 0.9 1.2 1.0 0.7 0.7 0.5 0.8 0.7 0.7 0.7 0.8 0.7 1.1 1.1 1.2 1.2 1.1 1.2 1.1 1.2 1.1 1.2 1.3 1.3 1.7 1.9 1.7 1.9
Ghana 0.6 1.1 0.8 0.8 0.6 0.7 0.9 0.8 0.8 0.6 0.6 0.5 0.4 0.8 0.8 0.8 0.9 1.0 1.1 1.1 1.4 1.5 1.5 1.8 1.7 1.5 1.7 1.7 1.7 2.1 2.2
Guinea 0.2 0.2 0.2 0.1 0.1 0.1 0.1 0.1 0.2 0.1 0.2 0.4 0.4 0.5 0.5 0.6 0.7 0.6 0.6 0.6 0.6 0.4 0.5 0.5 0.5 0.4 0.5 0.6 0.6 0.8 0.7
Guinea-Bissau 0.3 0.2 0.2 0.2 0.6 0.6 0.4 0.3 0.1 0.1 0.2 0.1 0.1 0.1 0.2 0.2 0.2 0.2 0.2 0.5 0.5 0.3 0.2 0.2 0.2 0.4 0.5 0.5 0.5 0.6 0.6
Kenya
Lesotho 2.2 3.0 2.7 2.7 2.2 2.2 2.6 2.5 2.7 2.0 2.1 1.8 3.4 4.2 3.9 4.4 5.3 5.0 4.7 5.4 5.5 5.0 5.3 5.4 6.1 6.9 6.3 6.7 6.3 5.8 6.9
Madagascar 1.3 1.5 1.1 1.0 1.2 0.8 0.8 0.8 0.6 0.4 0.5 0.4 0.5 0.4 0.4 0.4 0.4 0.5 0.5 0.6 0.6 0.7 0.7 0.7 0.8 0.7 0.8 0.9 1.1 1.0 1.1
Malawi 2.3 2.3 2.2 2.4 2.4 2.3 2.1 2.3 2.4 2.6 3.0 2.4 2.6 2.4 2.6 2.0 2.1 1.9 2.9 2.7 3.0 3.1 2.0 2.4 2.8 3.2 3.5 3.4 3.8 3.9 4.4
Mali 0.8 0.7 0.5 0.5 0.5 0.6 0.6 0.7 0.6 0.7 0.6 0.7 0.7 0.7 0.7 1.0 0.9 0.9 1.0 0.9 0.8 0.9 1.3 1.2 1.3 1.4 1.4 1.3 1.4 1.5 1.5
Mauritius 1.7 1.8 1.8 1.8 1.8 1.1 1.2 1.3 1.4 1.3 1.4 1.2 1.1 1.2 1.0 1.2 1.2 1.4 1.2 1.2 1.2 1.1 1.1 1.1 1.2 1.5 1.3 1.3 1.6 1.9 1.8
Mozambique 0.7 0.9 1.2 1.3 1.2 0.9 0.9 0.4 0.5 0.5 0.4 0.6 0.9 0.9 1.0 1.0 1.0 1.1 1.0 0.8 1.0 1.2 1.3 1.8 1.9 1.9 2.1 2.6 2.2 2.3 2.8
Namibia 0.3 3.8 4.4 4.8 5.4 4.7 4.5 4.4 5.1 5.1 6.0 6.4 5.4 5.6 6.4 6.5 5.8 5.4 5.3 5.0 5.9 5.9
Niger 0.6 0.5 0.5 0.8 1.0 1.1 1.1 1.2 1.1 1.0 0.9 0.9 0.5 0.9 0.6 0.8 0.8 0.6 0.6 0.6 0.8 0.6 0.6 0.7 0.8 0.6 0.7 0.7 0.7 0.9 0.9
Nigeria 0.0 0.0 0.0 0.0 0.0 0.0
Rwanda 0.8 1.7 1.0 0.9 0.9 0.9 1.0 1.0 1.1 1.0 0.9 0.9 0.8 0.8 0.2 0.5 0.7 0.8 0.7 1.0 1.1 1.2 1.4 1.7 1.5 1.8 2.1 2.4 2.6 2.4 2.6
Sâo Tomé and Principe 1.2 0.6 0.0 0.5 0.5 0.4 0.4 0.3 0.3 0.2 0.2 0.3 0.3 0.2 0.3 0.4 0.5 1.0 1.1 0.9 1.6 1.9 1.8 1.8 2.3 2.6 2.9 2.7 2.5 2.5 2.5
Senegal 1.5 1.4 1.2 1.1 1.0 1.0 1.0 1.0 1.2 1.2 0.8 2.2 2.2 2.0 1.6 1.8 1.8 2.0 1.9 1.7 1.9 1.6 2.0 2.0 2.0 2.2 2.2 2.2 2.5 2.9 2.9
Seychelles 5.7 6.5 6.6 6.3 5.8 5.5 5.5 5.2 5.7 4.4 3.4 3.6 3.7
Sierra Leone 1.0 1.2 1.1 0.9 0.7 0.5 0.3 0.4 0.4 0.4 0.6 0.6 0.8 0.9 0.9 0.7 0.8 0.8 0.6 1.1 1.8 2.1 1.7 1.5 1.6 1.4 1.4 1.5 1.9 1.9 2.7
South Africa 3.1 4.1 3.8 4.5 5.1 5.7 5.8 5.6 5.6 5.5 6.4 6.7 7.4 7.2 7.8 8.2 8.3 8.7 9.2 9.6 9.3 8.5 7.7 7.4 7.0 7.1 7.1 7.0 7.4 8.1 7.7
Swaziland 1.6 2.0 2.0 1.8 1.8 2.0 1.9 2.1 2.2 2.2 1.6 2.1 1.9 1.8 2.0 2.1 2.4 2.8 3.0 3.2 3.8 3.8 3.4 3.6 4.7 4.7 4.9 5.9 5.6 6.5 6.7
Tanzania 1.6 1.8 1.3 1.7 1.6 1.6 1.4 1.1 0.5 0.5 0.5 0.4 0.5 0.6 0.5 0.9 0.8 0.8 0.8 0.8 1.0 1.1 1.2 1.2 1.4 1.9 2.1 2.4 2.8 2.7 2.8
Togo 1.9 1.6 2.0 2.0 1.7 2.2 1.9 2.1 1.8 1.7 1.9 1.8 1.9 0.8 1.4 1.3 1.1 1.2 1.1 1.1 1.2 1.2 1.2 1.5 1.8 2.2 2.2 1.9 1.6 2.2 2.2
Uganda 0.0 0.0 0.0 0.0 0.0 0.0 0.0 0.0 0.0 0.1 0.6 0.8 0.9 1.0 1.3 1.4 1.3 1.5 1.7 1.7 1.8 1.8 1.9
Zambia 2.2 1.4 1.2 1.2 1.5 2.2 3.8 2.8 3.8 4.4 4.4 4.6 4.8 3.0 2.7 2.8 5.9 6.6 6.5 6.4 5.7 5.7 6.1 5.8 5.9
Zimbabwe 5.0 5.4 6.3 6.3 7.2 6.0 6.4 7.3 6.8 6.8 6.5 6.6 6.9 6.9 6.1 6.3 5.2 7.0 13.1 8.6 9.9 7.5 6.9 10.7 13.3 0.5 2.7 5.7

23
Indirect Taxes
1980 1981 1982 1983 1984 1985 1986 1987 1988 1989 1990 1991 1992 1993 1994 1995 1996 1997 1998 1999 2000 2001 2002 2003 2004 2005 2006 2007 2008 2009 2010
Angola 0.9 1.7 2.6 2.1 1.9 3.2 3.2 3.1 2.4 2.2 2.0 2.0 2.1 2.5 2.1
Benin 0.7 1.2 1.2 1.3 1.0 1.0 1.0 0.7 0.8 0.5 0.8 1.0 1.6 1.7 4.6 4.8 5.3 6.0 5.7 6.3 7.7 7.3 7.9 7.8 8.3 7.0 7.2 8.0 8.0 8.1 7.8
Botswana 0.2 0.2 0.2 0.4 0.6 0.3 0.3 0.4 0.4 0.3 0.5 0.8 0.9 1.2 1.3 1.3 1.3 1.3 1.4 1.5 1.7 1.5 1.3 3.1 3.3 4.3 3.0 2.9 3.2 4.3 4.6
Burkina Faso 1.2 1.2 1.4 1.6 1.3 1.2 1.2 2.6 2.8 2.6 1.5 1.3 1.2 1.4 3.2 3.2 4.0 4.6 4.4 5.8 5.2 5.4 5.8 6.0 6.9 6.4 6.1 6.7 6.6 7.2 7.1
Burundi 3.2 3.6 5.3 5.1 4.9 4.8 5.1 5.2 5.5 5.9 6.2 6.7 6.6 6.7 7.3 7.6 6.1 6.0 6.2 7.4 9.1 8.9 8.9 9.1 9.2 9.1 8.9 8.7 8.7 9.0 10.6
Cameroon 2.3 2.2 2.0 1.8 2.4 2.0 2.5 2.1 3.0 2.9 2.7 2.4 2.1 2.3 4.6 4.7 5.0 4.6 5.1 5.5 5.8 5.8 5.7 5.1 5.4 6.1 6.3 6.4 6.4 6.5 6.2
Cape Verde 0.1 0.1 0.0 0.0 0.0 0.0 0.0 0.0 0.0 0.0 0.0 0.0 0.0 0.2 0.5 0.5 0.6 3.2 3.2 2.9 2.9 3.0 3.4 3.2 3.3 8.6 10.1 10.8 11.5 8.9 8.9
Central African Republic 2.2 2.8 3.0 3.1 3.0 2.3 1.8 1.8 2.2 2.6 3.6 2.5 2.8 2.2 2.5 3.0 2.3 3.8 4.5 4.5 4.7 3.6 4.8 3.1 3.3 2.8 3.0 3.5 3.2 3.4 3.9
Chad 0.6 0.5 0.5 0.7 0.6 0.9 1.1 1.6 1.8 1.7 1.6 1.5 1.2 0.8 1.2 1.6 1.2 1.7 1.9 1.6 1.4 1.3 1.1 0.7 0.7 1.0 0.9 1.2 1.4
Comoros 0.1 0.2 0.4 0.9 0.5 0.8 1.1 1.0 1.1 1.0 1.2 2.4 5.7 5.5 5.0 4.9 4.9 4.8 3.7 3.8 3.7 3.5 4.0 4.6 5.3 3.6 3.2 3.8 3.1 2.6 2.5
Congo, Rep. of 2.4 3.0 4.1 3.7 4.4 3.9 3.8 2.8 2.8 2.6 2.5 2.8 0.5 2.0 1.3 4.0 3.4 1.4 4.1 2.9 2.4 4.1 3.7 3.4 3.2 2.7 2.4 2.8 2.5 3.3 3.2
Côte d'Ivoire 6.1 6.3 6.9 5.8 4.9 3.3 8.0 8.8 8.3 7.8 7.8 8.3 9.4 7.4 6.0 6.1 6.2 6.0 5.6 6.1 6.1 6.5 6.0 5.5 5.7 4.4 4.6 5.0 5.0 6.2 6.2
Equatorial Guinea 1.5 1.7 1.3 1.7 3.1 2.2 5.2 5.9 6.5 7.0 6.2 5.7 5.4 5.4 4.0 3.8 2.1 1.8 2.5 1.6 0.9 1.0 0.9 1.1 0.8 0.5 0.6 0.5 0.4 0.8 0.6
Ethiopia 3.1 3.2 3.1 3.1 3.5 3.1 3.0 3.5 3.6 3.1 2.9 3.2 2.3 2.7 3.3 3.1 3.3 3.7 3.8 3.7 3.7 4.0 4.8 4.8 5.8 5.7 5.7 5.4 4.6 5.1 6.3
Gabon 1.3 1.7 2.0 1.9 1.9 2.1 2.2 4.1 3.6 3.2 2.6 3.0 3.6 3.6 2.5 2.5 1.5 2.3 2.8 2.0 2.2 2.0 2.4 3.1 3.0 2.5 2.3 2.3 2.0 2.7 2.5
Gambia 0.5 0.5 0.5 0.5 0.7 1.3 0.8 0.9 1.0 4.4 5.1 5.4 5.4 5.2 4.7 3.5 3.7 4.0 3.8 3.4 3.3 3.0 2.6 2.4 3.0 5.3 6.0 6.4 5.7 5.3 5.1
Ghana 2.1 3.5 2.1 1.5 1.9 1.9 3.7 3.0 3.3 3.5 3.5 4.2 3.3 4.8 5.3 5.0 4.9 3.8 4.0 4.0 5.0 5.4 5.0 6.3 5.9 6.7 6.4 6.4 6.0 5.3 5.3
Guinea 0.1 0.1 0.4 0.1 0.1 0.1 0.6 1.2 2.0 2.6 2.3 3.0 3.0 3.1 3.4 3.8 3.5 4.4 3.9 3.8 3.1 4.1 4.3 4.6 4.6 5.2 4.1 5.0 6.0 5.9 5.7
Guinea-Bissau 1.9 1.9 1.7 0.7 0.5 1.1 0.6 0.5 0.7 0.4 0.7 0.8 0.5 0.6 0.5 1.3 0.8 0.9 0.6 1.6 2.1 2.1 1.8 1.9 1.7 2.4 2.2 2.0 2.1 2.6 3.2
Kenya 5.7 5.6 5.2 4.8 5.3 4.9 4.7 5.4 6.1 6.0 5.7 6.0 6.9 6.6 7.6 7.1 7.4 7.0 7.5 7.5 7.2 7.7 8.0 8.4 8.4 8.5 7.8 8.3 8.4 8.3 8.5
Lesotho 0.0 0.1 0.3 1.6 3.9 3.2 3.9 7.1 6.1 6.7 7.7 6.7 6.0 6.3 6.2 6.0 6.0 5.8 5.7 5.3 5.1 5.4 5.0 5.7 7.4 8.5 7.9 8.4 8.1 8.6 8.3
Madagascar 5.4 3.6 4.1 4.2 4.3 3.6 3.4 3.3 3.6 3.5 3.7 2.3 3.4 3.0 3.6 3.9 3.3 3.5 4.5 6.5 6.8 5.7 4.4 5.8 6.7 6.5 6.6 7.1 8.0 6.8 7.1
Malawi 4.9 5.1 5.1 4.9 4.7 5.4 5.3 5.2 5.0 5.8 6.8 5.4 5.8 4.5 5.8 3.8 4.1 4.4 5.4 5.1 5.6 6.6 4.4 5.2 5.8 6.1 6.1 6.7 7.4 7.6 7.2
Mali 3.7 4.4 4.8 4.0 4.2 4.4 3.4 3.1 5.1 2.9 2.9 4.1 4.3 4.3 3.7 4.0 5.0 5.4 5.4 6.8 6.1 6.3 7.1 7.1 7.9 7.4 7.0 6.7 6.0 6.4 6.2
Mauritius 2.8 3.0 3.0 3.4 3.2 3.0 2.8 2.8 3.0 3.5 3.5 3.6 3.5 3.5 3.5 3.9 4.2 5.4 5.5 6.7 6.4 6.0 6.4 7.5 7.6 8.8 9.7 10.7 10.5 10.6 10.9
Mozambique 4.1 5.4 5.4 5.8 4.6 2.9 3.8 3.9 5.1 5.9 4.2 4.7 5.3 6.7 5.5 5.6 4.7 5.4 5.6 6.3 6.6 6.1 6.4 7.0 7.3 7.3 7.3 6.6 8.0 8.7 10.3
Namibia 2.5 3.6 3.6 4.1 4.8 5.3 5.6 5.0 6.2 6.1 6.7 8.5 7.9 8.9 8.6 8.0 7.9 7.6 7.9 6.9 6.3 6.1 5.3 4.7 6.1 5.1 5.5 5.6 6.1
Niger 3.1 2.9 2.7 2.9 3.1 2.8 4.6 3.9 3.4 3.2 2.9 2.4 2.2 2.1 2.0 2.4 2.2 3.0 3.2 3.5 3.7 4.4 4.5 4.2 4.6 5.2 5.2 5.5 5.0 5.7 5.4
Nigeria 0.8 1.1 1.3 1.5 1.1 1.5 1.3 0.7 0.6 0.8 1.0 1.1 1.2 1.1 0.8 2.0 2.6 2.5 2.6 2.2 1.8 2.5 1.5 1.6 1.3 2.4 1.2 1.4 1.6 1.9 1.8
Rwanda 2.3 2.3 2.4 2.6 2.5 2.8 2.9 3.4 3.4 3.6 3.3 3.5 3.0 3.2 1.2 2.7 3.1 3.6 4.3 5.1 4.8 5.5 5.9 4.3 5.8 5.8 5.6 5.9 6.3 5.9 5.9
Sâo Tomé and Principe 4.7 3.1 2.9 1.5 2.9 2.2 1.6 1.1 1.4 0.8 1.3 2.0 2.7 1.9 1.3 1.2 0.7 1.0 1.9 2.6 3.3 4.5 3.7 4.3 5.1 5.8 4.0 3.5 2.9 3.1 3.8
Senegal 5.5 4.0 3.9 3.9 4.4 4.1 3.8 3.8 3.8 3.5 3.7 3.8 3.5 3.3 3.1 3.3 5.6 6.2 6.8 8.1 9.4 9.1 9.5 9.6 8.2 10.2 10.4 10.8 9.6 9.5 9.7
Seychelles 4.1 5.4 4.6 5.3 6.5 6.9 0.0 0.0 0.0 0.0 0.0 0.0 0.0 6.9 7.1 7.6 7.7 7.2 7.1 7.8 7.5 7.8 7.3 9.8 9.2 12.1 11.6 11.7 10.9 12.6 14.4
Sierra Leone 2.4 3.1 2.6 1.7 1.4 1.0 0.5 0.8 0.9 1.0 1.8 2.1 3.2 3.8 4.0 3.3 2.9 1.8 1.6 1.3 1.8 2.5 2.4 2.5 1.9 1.8 1.9 1.1 3.6 3.9 5.1
South Africa 2.0 4.6 2.6 3.4 3.5 4.6 6.6 6.2 6.2 7.1 8.0 7.6 7.3 6.5 7.9 7.9 7.7 7.6 8.0 8.1 7.8 7.7 7.3 7.5 7.7 8.3 8.5 8.6 8.5 8.3 7.4
Swaziland 0.4 0.3 0.3 0.3 0.2 0.5 1.1 2.3 2.5 3.4 3.2 3.4 2.9 2.5 2.6 2.6 3.2 3.4 3.9 4.0 4.2 4.2 4.3 4.7 4.5 4.8 3.9 4.0 4.7 4.6 5.1
Tanzania 6.2 7.6 7.3 7.8 6.4 6.5 6.7 7.5 4.3 4.9 4.9 5.2 5.2 3.4 3.8 2.3 4.2 4.3 4.1 4.3 4.1 5.4 5.4 5.4 5.4 6.6 6.7 7.7 7.9 7.7 7.7
Togo 2.5 1.7 4.1 3.4 3.2 2.9 1.9 1.9 2.2 1.9 1.7 1.8 1.1 0.7 0.8 1.4 1.9 2.1 2.3 2.2 2.0 2.8 2.5 3.6 3.9 6.7 7.5 8.0 7.2 6.9 7.1
Uganda 0.8 0.5 2.6 2.5 2.0 1.8 1.1 1.2 1.9 2.3 2.4 2.8 1.9 2.2 2.7 3.4 6.4 7.9 7.3 7.6 6.9 3.3 3.6 3.7 6.4 6.9 6.9 7.0 7.6 7.0 6.8
Zambia 10.6 10.7 11.0 11.4 9.9 8.6 7.6 7.7 6.1 4.4 4.8 5.7 4.9 4.5 6.5 6.4 6.6 6.8 6.8 9.0 8.0 8.3 4.7 4.3 4.1 7.5 6.8 7.4 6.6 5.4 5.8
Zimbabwe 5.7 5.1 6.5 7.4 9.2 7.1 6.2 6.5 5.6 5.0 5.0 3.9 4.4 4.8 3.4 3.9 3.9 5.7 4.1 6.7 5.5 4.9 5.6 8.6 11.1 0.9 7.7 13.7

24
Trade Taxes
1980 1981 1982 1983 1984 1985 1986 1987 1988 1989 1990 1991 1992 1993 1994 1995 1996 1997 1998 1999 2000 2001 2002 2003 2004 2005 2006 2007 2008 2009 2010
Angola 2.1 2.1 2.4 1.4 1.5 2.4 2.3 2.4 2.2 1.9 1.7 1.7 1.7 1.8 1.3
Benin 6.3 9.5 10.3 7.0 5.4 6.1 6.2 5.7 5.1 3.4 4.0 4.6 4.8 4.7 1.2 1.5 1.6 2.0 1.5 1.7 3.0 2.9 3.0 3.6 2.7 4.0 4.6 5.1 5.4 4.9 4.9
Botswana 9.2 11.2 8.9 8.2 8.6 6.5 5.3 5.1 4.0 4.5 4.7 5.7 8.4 9.0 7.2 5.4 5.1 4.8 5.2 4.6 6.7 6.2 4.5 3.9 4.8 6.2 6.0 8.7 8.5 9.4 7.9
Burkina Faso 3.9 3.8 3.8 3.2 2.8 3.2 4.5 3.3 3.3 2.7 3.1 3.3 2.6 2.7 2.9 3.1 3.0 3.0 2.7 3.0 2.0 1.9 1.9 1.8 2.2 1.9 2.1 2.2 2.0 2.0 2.2
Burundi 5.4 3.2 4.3 2.8 5.0 5.1 6.7 5.9 4.7 5.5 3.0 4.3 3.6 3.4 4.9 5.1 3.0 2.1 3.8 2.4 3.4 3.9 4.0 4.6 4.1 4.5 3.1 3.2 2.9 2.7 1.9
Cameroon 5.5 5.3 4.1 3.9 3.9 3.0 1.9 2.0 1.4 1.2 1.0 1.3 2.0 1.7 2.7 2.5 2.4 2.3 2.4 2.2 2.1 2.1 2.2 2.2 2.1 2.2 2.2 2.1 2.1 2.3 2.3
Cape Verde 7.5 7.4 6.9 6.8 7.1 7.0 7.4 6.8 6.8 7.3 8.0 8.5 10.0 9.7 9.5 10.0 9.4 6.3 6.7 6.8 7.5 7.7 8.4 8.5 8.6 4.9 5.0 5.0 5.0 4.1 3.9
Central African Republic 6.2 4.9 5.5 4.5 5.0 4.7 3.3 3.8 3.3 3.2 4.2 3.5 3.1 2.6 2.4 3.9 2.5 1.6 1.5 1.6 1.6 1.7 1.6 1.6 1.6 1.5 2.0 1.8 1.7 1.9 1.6
Chad 1.4 1.1 2.0 2.3 1.6 1.4 1.6 1.5 1.6 1.1 1.1 0.9 0.9 1.5 2.2 2.2 2.7 2.4 2.2 2.2 2.2 2.0 1.4 1.3 1.1 1.4 3.2 2.3 2.1
Comoros 7.7 8.8 8.9 9.9 10.2 8.3 8.8 6.9 7.0 6.8 7.1 5.4 5.1 5.3 5.2 4.3 4.3 5.9 3.8 3.7 3.0 3.9 3.5 4.4 5.5 6.2 5.2 3.6 5.1 5.1 5.4
Congo, Rep. of 3.5 4.7 6.5 5.5 6.8 5.8 5.1 4.4 4.0 3.7 3.3 4.4 4.8 4.8 3.1 4.5 4.5 2.6 3.0 1.5 1.4 2.1 1.7 2.1 2.0 1.3 1.3 1.3 1.1 1.5 1.3
Côte d'Ivoire 10.2 10.9 9.8 9.0 8.4 9.4 6.7 6.9 6.0 4.8 3.5 4.1 3.1 2.5 5.3 5.8 5.7 5.1 4.4 4.6 3.9 4.4 5.3 5.6 6.0 4.6 4.7 4.7 4.1 3.6 4.0
Equatorial Guinea 12.5 16.3 22.2 9.1 20.5 14.0 11.6 8.3 7.2 6.4 6.7 6.0 5.7 5.8 4.9 4.7 3.1 3.1 1.9 1.8 1.0 0.7 0.6 0.7 0.3 0.2 0.2 0.2 0.1 0.2 0.2
Ethiopia 2.9 2.1 2.1 2.3 2.1 2.1 2.2 1.7 1.7 1.5 1.2 1.1 0.8 1.0 1.6 2.0 1.9 2.1 2.2 2.1 1.9 2.0 2.4 2.3 2.8 2.8 2.9 3.8 2.5 2.8 3.2
Gabon 7.0 6.6 6.6 6.2 6.2 6.7 6.1 6.2 5.6 5.1 3.5 5.1 4.4 4.8 3.7 5.2 5.1 6.1 8.1 5.7 6.0 6.3 6.1 5.7 5.3 4.7 4.8 5.1 4.2 5.4 5.6
Gambia 10.0 7.0 7.9 8.4 10.2 8.6 9.4 11.2 10.3 8.2 6.4 5.9 6.3 6.9 6.5 5.5 5.0 4.9 5.0 4.4 4.6 3.5 3.5 2.9 4.4 3.4 4.0 3.9 3.1 4.4 3.0
Ghana 0.7 1.3 0.7 4.5 2.8 3.6 4.3 3.9 2.8 2.9 2.3 2.1 1.5 2.1 3.7 3.6 3.6 2.9 3.2 2.3 2.5 2.9 2.7 3.3 2.9 2.6 2.9 2.5 2.4 2.1 2.5
Guinea 0.8 1.3 0.6 0.4 0.7 0.6 0.8 0.8 0.8 0.9 1.4 1.7 1.6 1.6 1.6 1.6 1.4 1.8 1.6 1.7 2.2 1.9 2.2 2.2 2.2 3.0 2.9 2.7 2.7 2.8 2.6
Guinea-Bissau 2.5 2.3 2.5 2.9 2.4 2.1 1.1 3.5 3.5 1.3 2.9 2.1 1.2 1.8 2.6 2.1 2.4 2.8 1.1 3.0 3.5 2.3 1.3 1.4 1.5 2.1 2.3 1.8 1.5 1.8 1.9
Kenya 3.1 3.7 4.1 3.2 3.0 2.7 3.0 3.0 2.8 2.5 2.2 2.0 1.4 1.6 2.8 3.0 3.1 3.0 2.9 3.1 3.0 2.8 2.1 1.6 1.8 1.7 1.3 1.5 1.6 1.5 1.6
Lesotho 23.4 20.4 19.4 18.9 24.5 25.9 23.0 18.3 15.3 15.4 17.7 20.1 19.6 22.2 26.6 26.6 24.8 24.4 24.8 20.2 21.4 17.9 20.5 19.6 17.5 26.3 40.3 35.8 37.2 32.8 15.6
Madagascar 4.6 4.1 4.1 3.5 3.5 3.9 3.2 4.4 4.2 3.6 3.6 2.5 3.1 2.9 2.1 2.6 2.8 3.1 2.8 2.2 1.8 1.4 1.0 1.7 1.5 1.2 1.2 1.4 1.4 1.0 0.9
Malawi 3.3 3.8 4.0 3.7 3.4 3.4 4.2 3.1 2.5 2.7 3.2 2.6 3.2 2.8 2.6 2.1 3.2 3.1 3.2 2.2 2.1 1.9 1.2 1.3 1.8 1.8 1.8 1.8 2.0 1.9 1.8
Mali 1.8 2.4 2.4 2.5 2.3 3.1 4.5 4.1 2.3 2.1 1.8 2.4 2.3 2.4 1.7 2.0 2.7 2.7 3.0 1.9 1.8 1.6 2.0 2.3 2.4 2.6 2.6 1.8 1.6 2.1 2.0
Mauritius 10.1 9.7 9.1 10.4 10.9 10.4 11.2 11.0 11.3 11.0 10.4 10.4 9.0 8.6 8.6 7.7 6.1 6.3 6.1 5.3 5.6 4.7 4.0 4.0 4.1 3.9 2.2 1.0 0.8 0.6 0.5
Mozambique 1.8 2.0 1.5 1.9 1.2 0.8 0.7 1.4 1.7 2.5 1.2 1.6 2.3 3.5 2.6 2.8 1.9 1.8 1.8 1.8 2.0 1.8 1.9 2.0 1.8 1.9 1.8 1.8 1.3 1.3 1.7
Namibia 12.4 13.0 11.7 9.2 10.0 10.4 8.3 6.7 7.1 6.4 12.1 8.8 7.8 7.1 7.7 8.1 8.3 8.7 9.5 10.4 8.0 7.7 8.4 9.1 7.2 9.9 10.9 10.9 10.0
Niger 5.2 4.9 4.8 3.9 4.0 3.7 2.2 2.0 1.8 2.2 2.6 2.2 1.9 2.0 1.7 2.3 2.8 2.8 3.1 2.9 3.0 2.8 3.4 3.2 3.5 2.0 2.0 2.1 2.0 2.0 2.7
Nigeria 2.9 3.4 3.1 1.9 1.4 1.5 2.7 2.5 2.3 1.8 2.1 2.4 1.7 1.1 1.9 2.0 2.1 2.3 2.3 2.8 2.5 4.0 2.8 2.7 2.2 1.6 1.0 1.2 1.1 1.2 1.0
Rwanda 5.0 3.7 3.7 3.4 3.8 4.7 6.1 4.1 3.5 3.2 2.8 3.3 3.2 2.6 1.1 2.7 2.7 3.3 2.5 1.4 1.4 1.9 2.1 1.6 2.2 2.0 2.0 1.5 1.7 1.2 1.2
Sâo Tomé and Principe 8.2 5.4 6.6 4.2 4.8 4.7 3.4 1.8 4.1 3.1 2.1 2.3 2.8 1.9 1.5 1.8 1.1 1.6 2.6 3.6 3.0 2.9 2.9 3.4 3.4 3.3 3.8 3.5 3.1 2.8 2.9
Senegal 7.1 4.8 5.6 5.7 6.3 5.9 5.1 5.3 5.6 4.7 5.9 6.6 7.0 5.9 5.8 6.4 5.1 4.9 4.4 3.7 2.5 3.0 3.1 2.9 2.8 2.7 2.9 3.5 3.2 2.7 2.8
Seychelles 11.8 11.9 13.3 13.0 12.5 11.7 21.3 21.6 26.8 25.4 24.6 22.4 24.1 19.4 16.2 12.5 10.8 11.4 10.9 9.6 9.0 8.5 9.4 10.3 10.0 5.5 4.0 3.9 4.7 4.1 3.1
Sierra Leone 7.1 6.8 4.8 2.5 2.3 1.8 1.3 3.1 1.6 2.3 3.4 2.9 3.6 4.3 5.0 3.9 4.7 2.1 3.9 3.4 5.7 6.5 6.1 6.2 5.7 4.9 4.7 5.1 4.9 4.7 2.5
South Africa 2.1 0.6 2.4 2.4 1.7 1.5 0.2 0.3 0.3 0.8 0.7 0.4 0.3 0.3 0.7 1.0 1.0 1.1 0.8 0.7 0.7 0.8 0.7 0.8 0.6 0.8 1.0 1.2 1.2 0.9 0.7
Swaziland 10.8 11.7 7.4 10.6 9.6 9.6 9.1 6.7 6.7 6.9 6.5 10.6 9.7 8.1 9.0 9.2 10.8 10.8 11.6 11.5 11.6 12.4 12.0 11.8 12.7 19.5 29.6 24.0 25.6 20.8 9.7
Tanzania 2.6 1.5 1.0 0.9 0.8 0.8 0.9 1.9 1.0 1.3 1.4 1.5 1.5 0.9 1.2 2.9 1.5 1.6 1.4 1.3 1.1 1.1 0.9 0.9 1.0 0.9 1.4 1.4 1.4 1.4 1.3
Togo 12.2 11.6 9.0 7.1 6.6 8.6 7.8 7.0 5.9 5.4 6.2 5.2 4.0 2.6 3.5 4.1 4.6 5.1 5.5 4.8 4.7 5.6 5.8 6.6 6.7 3.3 3.3 3.6 3.8 3.9 4.0
Uganda 1.2 0.3 3.3 4.2 4.8 5.2 4.6 2.0 2.3 1.4 2.7 3.5 3.0 3.3 3.6 3.9 1.7 1.2 1.0 1.2 1.1 1.4 1.1 1.1 0.9 1.0 1.2 1.2 1.3 1.2 1.0
Zambia 2.1 1.8 2.0 2.4 3.6 4.7 7.0 6.5 2.6 6.0 7.3 6.0 6.0 5.3 6.2 5.4 6.1 5.6 4.7 2.4 3.4 4.1 5.1 5.1 5.6 2.0 1.9 2.0 2.5 1.7 1.6
Zimbabwe 0.6 0.8 2.0 2.7 4.4 3.3 3.1 3.6 3.1 2.9 3.3 3.0 3.3 5.3 3.3 3.9 2.8 4.0 6.0 3.9 2.4 2.5 1.6 1.7 3.9 1.0 3.6 4.5

25
Resource Taxes
1980 1981 1982 1983 1984 1985 1986 1987 1988 1989 1990 1991 1992 1993 1994 1995 1996 1997 1998 1999 2000 2001 2002 2003 2004 2005 2006 2007 2008 2009 2010
Angola 43.6 37.1 25.1 44.2 48.7 39.0 31.9 30.3 30.8 35.0 40.2 37.1 41.2 24.2 33.0
Benin
Botswana 2.3 11.3 6.6 7.1 10.6 15.6 20.7 22.3 16.2 21.6 19.1 23.9 20.7 17.5 18.7 17.9 16.0 19.3 20.5 11.7 23.3 23.7 18.1 18.7 17.3 16.6 16.8 17.3 12.0 12.4 9.0
Burkina Faso
Burundi
Cameroon 2.4 1.8 1.9 7.7 7.3 8.0 8.2 5.7 5.0 4.7 3.5 3.2 3.1 2.1 2.8 3.0 2.8 3.6 3.4 2.2 4.9 4.6 4.9 4.1 3.9 5.0 6.8 6.4 7.6 4.8 4.5
Cape Verde 1.0 1.3 2.1 2.0 1.7 0.8 0.6 0.6 0.3 0.2
Central African Republic 0.4 0.5 0.4 0.4 0.3 0.3
Chad 2.5 4.6 12.2 16.8 20.8 8.5 16.0
Comoros
Congo, Rep. of 8.0 17.8 19.1 18.2 22.3 22.4 11.0 1.6 15.7 13.2 11.4 12.4 14.1 12.4 16.4 21.9 12.0 19.0 20.3 21.0 18.9 20.8 21.6 31.8 37.9 31.9 39.9 20.6 29.6
Côte d'Ivoire 0.1 0.4 0.4 0.2 0.2 0.2 0.1 0.2 0.2 0.2 0.9 1.5 1.4 1.3 1.0 1.1
Equatorial Guinea 1.9 2.7 3.0 2.7 10.6 9.6 24.0 15.3 15.1 23.9 24.2 23.9 27.7 29.4 39.1 34.5 34.6 37.8 26.9
Ethiopia
Gabon 20.7 25.9 26.1 23.6 26.4 25.4 17.9 6.2 6.5 5.8 3.5 6.2 10.6 10.3 14.0 19.0 19.3 18.1 18.8 16.3 22.6 21.8 17.7 16.6 16.6 19.8 20.3 17.3 21.1 17.6 15.2
Gambia
Ghana
Guinea 1.0 7.6 8.7 6.4 7.5 8.5 8.4 5.5 4.4 3.0 3.0 2.7 3.0 2.8 2.4 2.7 2.8 2.3 1.5 2.1 3.6 4.5 3.3 3.6 3.3 3.9
Guinea-Bissau
Kenya
Lesotho
Madagascar
Malawi
Mali 0.8 0.9 0.9 0.8 0.7 1.3 1.1 2.6 2.3 2.3 2.5
Mauritius
Mozambique 0.0 0.0 0.1 0.0 0.0
Namibia 3.8 3.6 1.8 0.2 1.0 1.4 1.3 1.0 0.8 2.8 0.9 1.5 1.7 2.6 4.3 0.5 1.5 1.2 0.8 2.4 2.5 1.3
Niger 0.3 1.9 1.9 6.2 1.4 0.5
Nigeria 25.9 19.3 16.0 12.1 14.2 10.1 15.8 17.7 16.0 20.5 28.4 25.5 28.3 28.6 17.5 8.8 8.4 9.0 5.2 20.2 31.2 31.5 20.7 24.1 28.7 32.3 29.1 21.9 26.6 9.8 14.5
Rwanda
Sâo Tomé and Principe 2.8 3.2 3.2 3.0 3.5 1.2 2.4
Senegal
Seychelles
Sierra Leone
South Africa 3.0 3.9 2.7 2.0 2.1 1.7 2.4 2.5 1.4 1.2 1.0 0.9 0.4 0.2 0.2 0.3 0.3 0.3 0.2 0.3 0.3 0.3 0.4 0.5 0.5 0.5 0.6 0.7 0.8 0.8 0.6
Swaziland
Tanzania
Togo 2.4 3.3 2.9 1.9 2.4 7.0 6.0 3.4 3.2 4.2 2.5 1.6 1.5 0.6 2.1 2.5 1.4 1.2 0.7 0.5 0.2
Uganda
Zambia 0.2 0.6 0.6 0.6 0.3 2.1 2.5 2.2 0.0 0.0 0.0 0.1 0.6 1.4 1.4 1.1 2.1
Zimbabwe

“Sur quoi la fondera-t-il l’économie du monde qu’il veut gouverner? Sera-ce sur le caprice de chaque particulier? Quelle confusion! Sera-ce sur la justice? Il l’ignore.”
Pascal
Créée en 2003, la Fondation pour les études et recherches sur le développement international vise à favoriser la compréhension du développement économique international et des politiques qui l’influencent.
[email protected]+33 (0)4 73 17 75 30