
A Talent Acquisition Execs Guide to EMEA 2015 Final
39
A Talent Acquisition Execs Guide to EMEA April 2015
-
Upload
mark-walton -
Category
Documents
-
view
320 -
download
1
Transcript of A Talent Acquisition Execs Guide to EMEA 2015 Final

A Talent Acquisition Execs
Guide to EMEAApril 2015
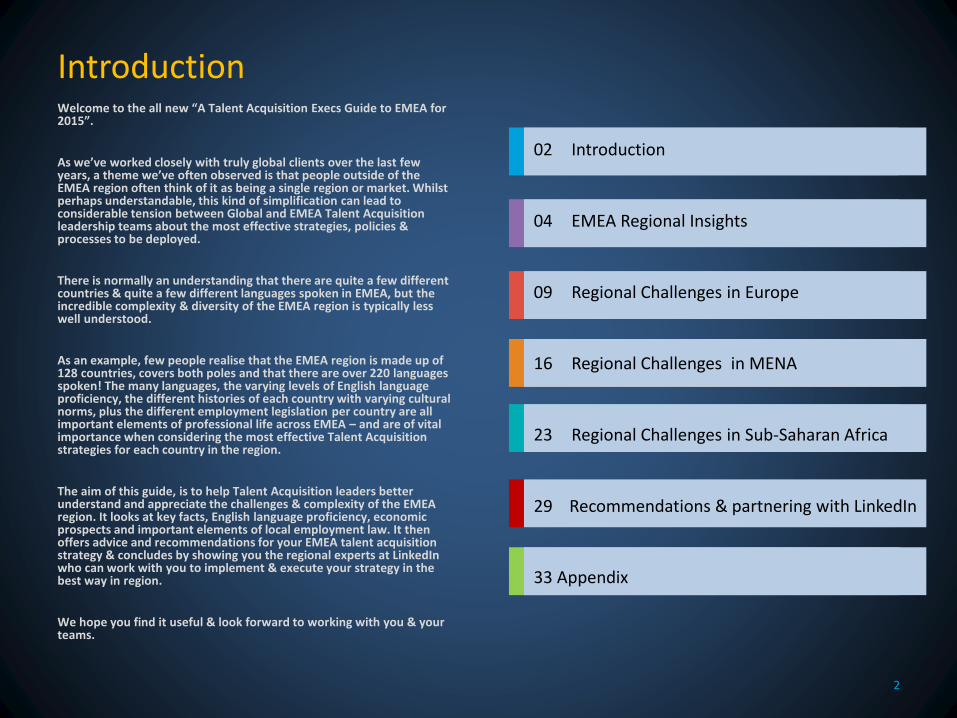
IntroductionWelcome to the all new “A Talent Acquisition Execs Guide to EMEA for 2015”.
As we’ve worked closely with truly global clients over the last few years, a theme we’ve often observed is that people outside of the EMEA region often think of it as being a single region or market. Whilst perhaps understandable, this kind of simplification can lead to considerable tension between Global and EMEA Talent Acquisition leadership teams about the most effective strategies, policies & processes to be deployed.
There is normally an understanding that there are quite a few different countries & quite a few different languages spoken in EMEA, but the incredible complexity & diversity of the EMEA region is typically less well understood.
As an example, few people realise that the EMEA region is made up of 128 countries, covers both poles and that there are over 220 languages spoken! The many languages, the varying levels of English language proficiency, the different histories of each country with varying cultural norms, plus the different employment legislation per country are all important elements of professional life across EMEA – and are of vital importance when considering the most effective Talent Acquisition strategies for each country in the region.
The aim of this guide, is to help Talent Acquisition leaders better understand and appreciate the challenges & complexity of the EMEA region. It looks at key facts, English language proficiency, economic prospects and important elements of local employment law. It then offers advice and recommendations for your EMEA talent acquisition strategy & concludes by showing you the regional experts at LinkedIn who can work with you to implement & execute your strategy in the best way in region.
We hope you find it useful & look forward to working with you & your teams.
2
02 Introduction
04 EMEA Regional Insights
09 Regional Challenges in Europe
16 Regional Challenges in MENA
23 Regional Challenges in Sub-Saharan Africa
29 Recommendations & partnering with LinkedIn
33 Appendix
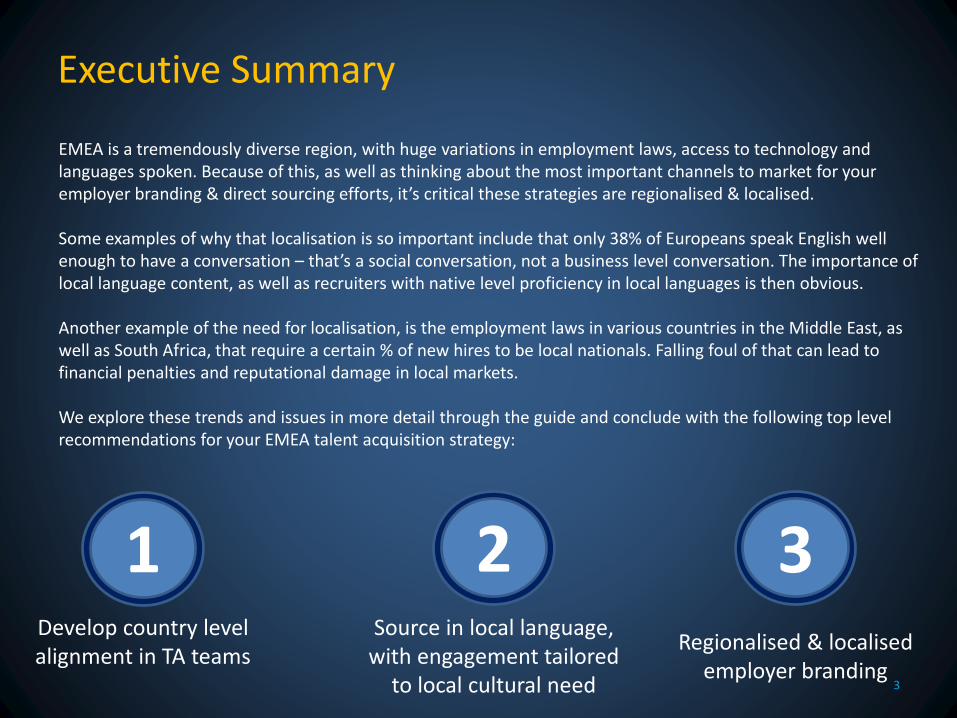
Executive Summary
3
EMEA is a tremendously diverse region, with huge variations in employment laws, access to technology and languages spoken. Because of this, as well as thinking about the most important channels to market for your employer branding & direct sourcing efforts, it’s critical these strategies are regionalised & localised.
Some examples of why that localisation is so important include that only 38% of Europeans speak English well enough to have a conversation – that’s a social conversation, not a business level conversation. The importance of local language content, as well as recruiters with native level proficiency in local languages is then obvious.
Another example of the need for localisation, is the employment laws in various countries in the Middle East, as well as South Africa, that require a certain % of new hires to be local nationals. Falling foul of that can lead to financial penalties and reputational damage in local markets.
We explore these trends and issues in more detail through the guide and conclude with the following top level recommendations for your EMEA talent acquisition strategy:
1Develop country level alignment in TA teams
Source in local language, with engagement tailored
to local cultural need
2 3Regionalised & localised
employer branding
EMEA regional insights
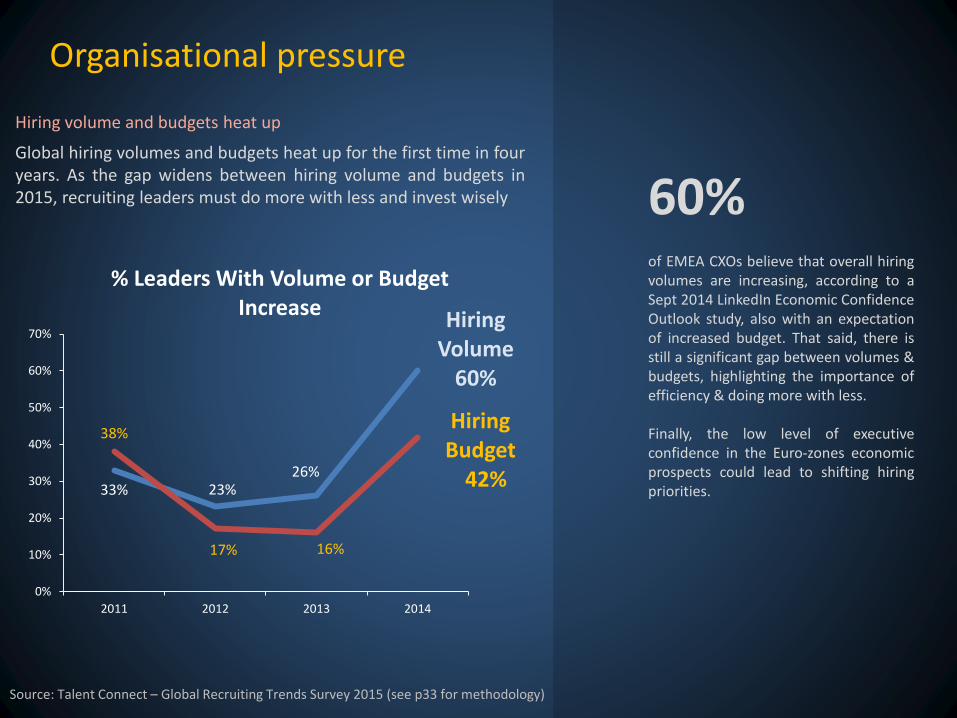
Organisational pressure
60% of EMEA CXOs believe that overall hiringvolumes are increasing, according to aSept 2014 LinkedIn Economic ConfidenceOutlook study, also with an expectationof increased budget. That said, there isstill a significant gap between volumes &budgets, highlighting the importance ofefficiency & doing more with less.
Finally, the low level of executiveconfidence in the Euro-zones economicprospects could lead to shifting hiringpriorities.
Hiring volume and budgets heat up
Global hiring volumes and budgets heat up for the first time in fouryears. As the gap widens between hiring volume and budgets in2015, recruiting leaders must do more with less and invest wisely.
Source: Talent Connect – Global Recruiting Trends Survey 2015 (see p33 for methodology)
33% 23%26%
Hiring Volume
60%
38%
17% 16%
Hiring Budget
42%
0%
10%
20%
30%
40%
50%
60%
70%
2011 2012 2013 2014
% Leaders With Volume or Budget Increase

16.1%
10.0%8.7%
8.0%7.1% 7.0%
0
2
4
6
8
10
12
14
16
18
Recruiting/sourcinghighly-skilled talent for
the company
Improving quality of hire Improving sourcingtechniques
Pipelining talent Workforce planning Investing in andmeasuring employer
brand
Companies Top Priorities in EMEA
2015 Priorities: recruiting highly skilled talent is on top of the list
Top Talent
Priorities are fairly spread among top firms, but recruiting highly skilled talent stands out
Quality of hire
Improving the quality of hire and sourcing techniques are vital to
EMEA companies
Source: Talent Connect – Global Recruiting Trends Survey 2015 (see p33 for methodology)
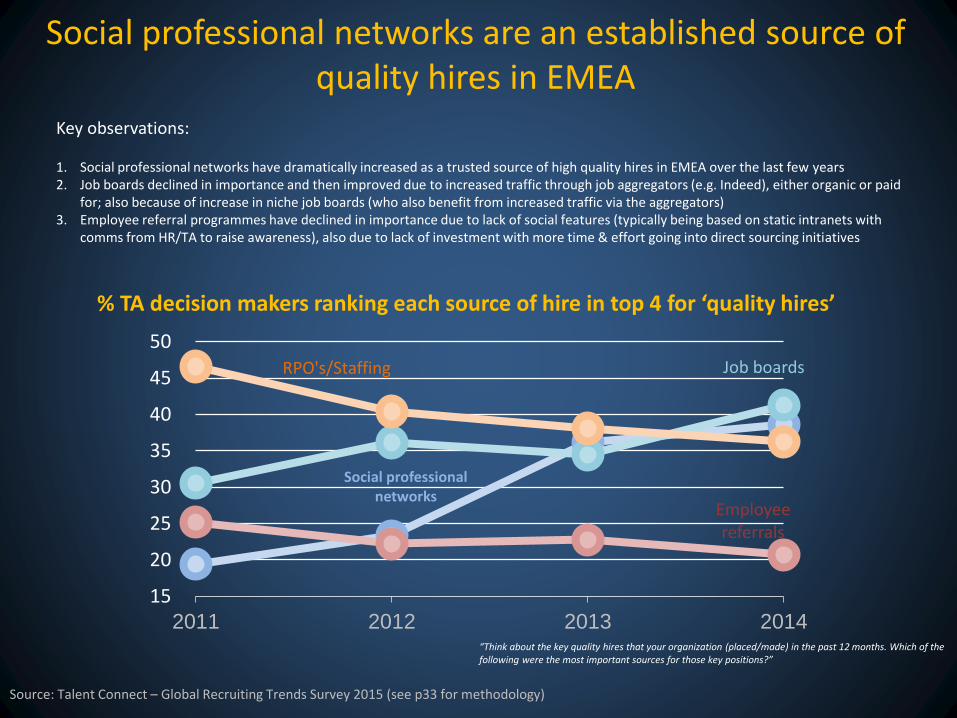
% TA decision makers ranking each source of hire in top 4 for ‘quality hires’
Social professional networks are an established source of quality hires in EMEA
Source: Talent Connect – Global Recruiting Trends Survey 2015 (see p33 for methodology)
Social professional networks
Job boards
Employee referrals
RPO's/Staffing
15
20
25
30
35
40
45
50
2011 2012 2013 2014
Key observations:
1. Social professional networks have dramatically increased as a trusted source of high quality hires in EMEA over the last few years2. Job boards declined in importance and then improved due to increased traffic through job aggregators (e.g. Indeed), either organic or paid
for; also because of increase in niche job boards (who also benefit from increased traffic via the aggregators)3. Employee referral programmes have declined in importance due to lack of social features (typically being based on static intranets with
comms from HR/TA to raise awareness), also due to lack of investment with more time & effort going into direct sourcing initiatives
“Think about the key quality hires that your organization (placed/made) in the past 12 months. Which of the following were the most important sources for those key positions?”

UpcomingTrend 1
UpcomingTrend 2
UpcomingTrend 3
EMEA Avg
Improved candidate
and job matching
Recruiting becoming more like marketing
Defining and
measuring the quality
of our hires
MENA
Improved candidate
and job matching
Recruiting becoming more like marketing
Defining and
measuring the quality
of our hires
Sub-Saharan Africa
Defining and
measuring the quality
of our hires
Proving ROI for our recruiting
tools
Improved candidate
and job matching
Recruiting becoming more like marketing
Improved candidate
and job matching
Europe
Proving ROI for our recruiting
tools
EMEA market trends
1EMEA firms are seeking to improve candidate and job matching
2In line with global trends, recruiting is becoming more like marketing
3Final key point is to define and measure the quality of hires
Source: Talent Connect – Global Recruiting Trends Survey 2015 (see p33 for methodology)

Regional challenges in Europe
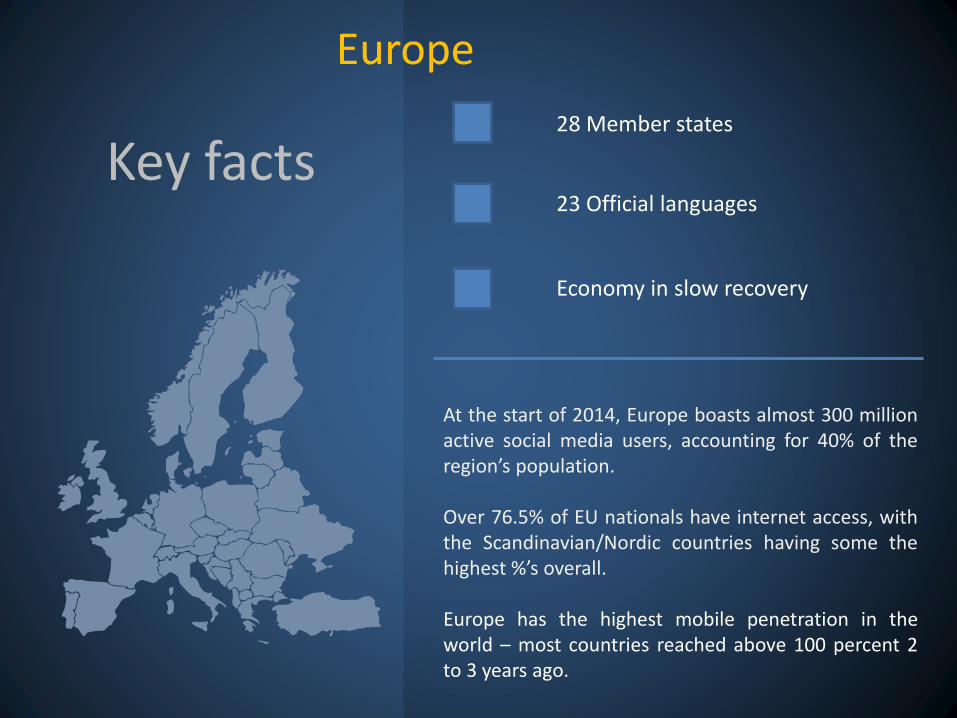
Key facts23 Official languages
28 Member states
Economy in slow recovery
Europe
At the start of 2014, Europe boasts almost 300 millionactive social media users, accounting for 40% of theregion’s population.
Over 76.5% of EU nationals have internet access, withthe Scandinavian/Nordic countries having some thehighest %’s overall.
Europe has the highest mobile penetration in theworld – most countries reached above 100 percent 2to 3 years ago.

English language proficiency is unevenly spread across Europe
TOP 3 (Excluding IRE and UK)
Denmark is the country with the highest English language competency in Europe. On the lower end, Russia, Ukraine and Turkey have a lack of fluent English speakers
Bottom 3
69.3
68.98
67.8
67
67.5
68
68.5
69
69.5
Denmark Netherlands Sweden
Proficiency Index
50.43
48.5
47.8
46
46.5
47
47.5
48
48.5
49
49.5
50
50.5
51
Russia Ukraine Turkey
Proficiency IndexSweden
59.2AVG.
Source: EF EPI – English Proficiency Index
67.8

47.8
48.5
50.43
52.68
52.8
55.95
56.83
57.18
57.42
58.29
58.54
58.63
59.43
60.59
60.88
61.2
61.39
63.21
64.26
64.32
64.39
67.8
68.98
69.3
0 10 20 30 40 50 60 70 80
Turkey
Ukraine
Russia
France
Italy
Slovakia
Portugal
Spain
Czech Republic
Switzerland
Hungary
Romania
Latvia
Slovenia
Germany
Belgium
Estonia
Austria
Poland
Norway
Finland
Sweden
Netherlands
Denmark
38% Of Europeans speak English well enough in order to be able to have a conversation (not business fluency).
23 official languages are spokenwith most business deals andcontracts often completed inthe native local language.
English language proficiency in Europe
Source: EF EPI – English Proficiency Index
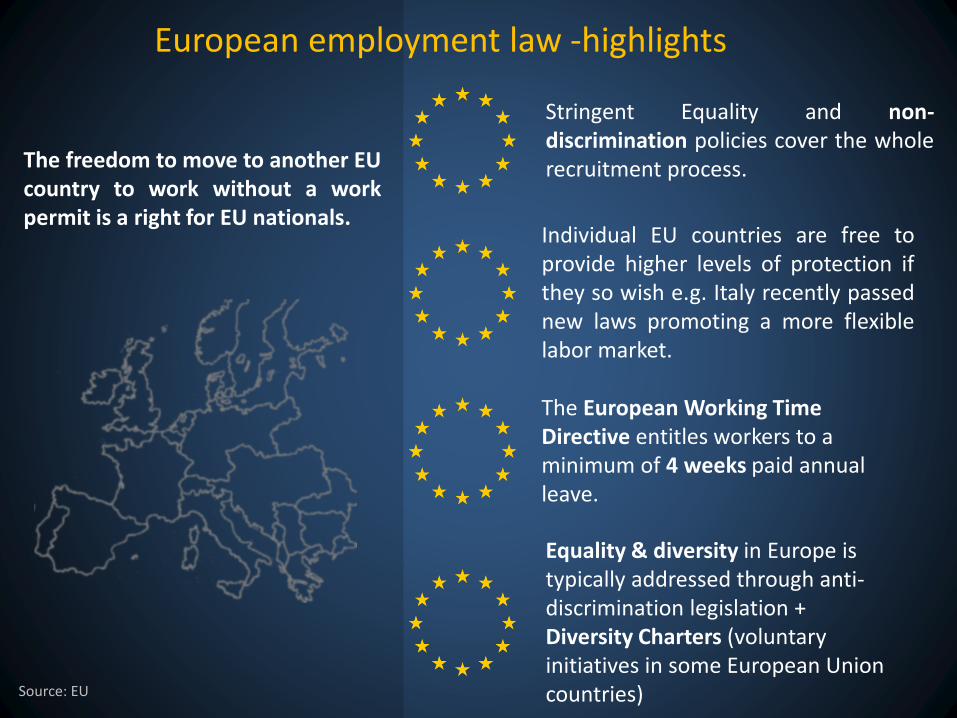
European employment law -highlights
The freedom to move to another EUcountry to work without a workpermit is a right for EU nationals.
Individual EU countries are free toprovide higher levels of protection ifthey so wish e.g. Italy recently passednew laws promoting a more flexiblelabor market.
Source: EU
Stringent Equality and non-discrimination policies cover the wholerecruitment process.
The European Working Time Directive entitles workers to a minimum of 4 weeks paid annual leave.
Equality & diversity in Europe is typically addressed through anti-discrimination legislation + Diversity Charters (voluntary initiatives in some European Union countries)
UK PolandGermany
Austria
Romania
Czech R.Slovakia
Bulgaria
Russia
Lithuania
Latvia
Estonia
Slovenia
Croatia
Belgium
Netherlands
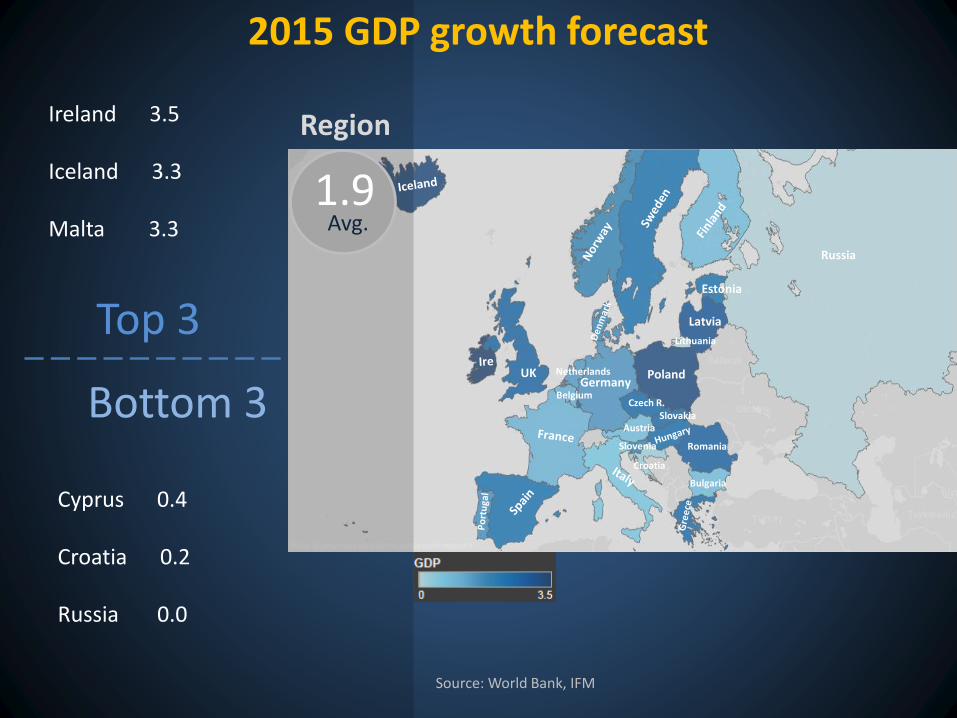
2015 GDP growth forecast
Top 3
Bottom 3
1.9
Region
Cyprus 0.4
Croatia 0.2
Russia 0.0
Ireland 3.5
Iceland 3.3
Malta 3.3 Avg.
Source: World Bank, IFM

14.4%
27.9%
29.6%
32.1%
32.5%
33.5%
34.4%
35%
36.2%
39.8%
41.3%
41.6%
42.3%
45.5%
45.9%
48%
52%
54%
55.4%
57%
59%
62.2%
63%
67.5%
0% 10% 20% 30% 40% 50% 60% 70% 80%
Ukraine
Romania
Turkey
Portugal
Greece
Belgium
Hungary
Poland
Russia
Germany
Italy
Czech Republic
France
Finland
Slovakia
Austria
Netherlands
Switzerland
Spain
Ireland
Denmark
UK
Sweden
Norway
Sources: Google http://think.withgoogle.com/mobileplanet ITU (International Telecommunication Union)
63.8
36.2
Active mobile-broadband subscriptionsPer 100 inhabitants (translates to % of
people with a smartphone)
63.8
Mobile penetration**(# active sim cards/countries population)
** See notes on p35
Regional challenges in MENA
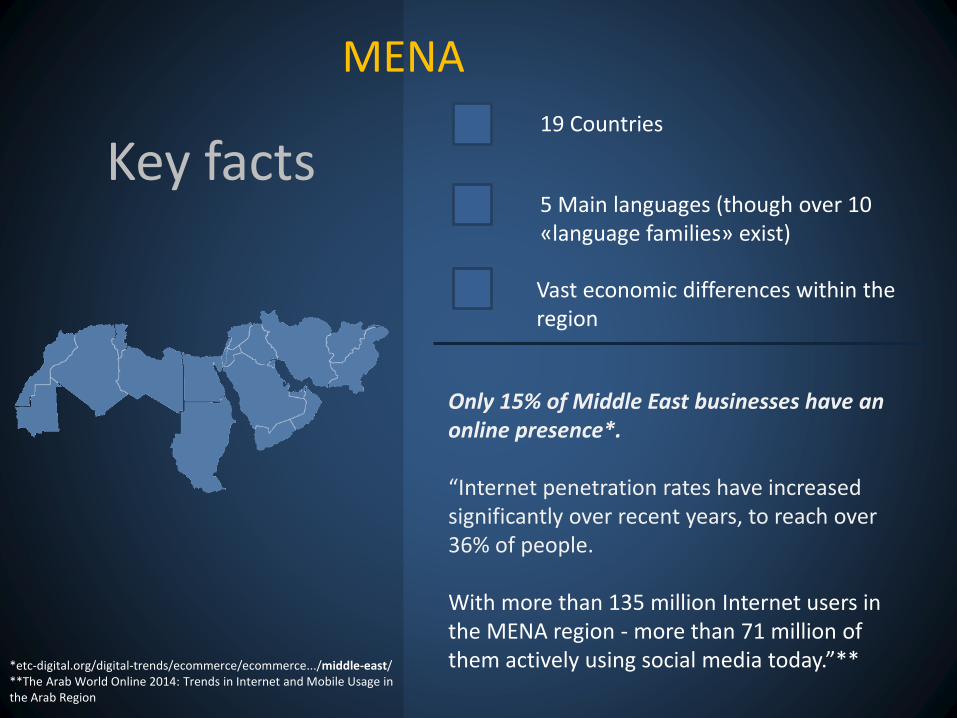
Key facts19 Countries
5 Main languages (though over 10 «language families» exist)
Vast economic differences within the region
MENA
Only 15% of Middle East businesses have an online presence*.
“Internet penetration rates have increased significantly over recent years, to reach over 36% of people.
With more than 135 million Internet users in the MENA region - more than 71 million of them actively using social media today.”***etc-digital.org/digital-trends/ecommerce/ecommerce.../middle-east/
**The Arab World Online 2014: Trends in Internet and Mobile Usage in the Arab Region

90%
10%
90%
Low
Very Low
English language proficiency – Mena
Of Middle East countriesscored an overall «Verylow» mark of Englishproficiency
Source: EF EPI – English Proficiency Index (Israel and Cyprus, with high English proficiency, are not included in this report)
38.02
38.19
38.5
39.48
41.8
41.83
42.12
42.42
47.81
47.82
51.8
0 10 20 30 40 50 60
Iraq
Libya
Algeria
Saudi Arabia
Kuwait
Iran
Egypt
Morocco
Qatar
Jordan
U.A.E. Low
Very Low

Two of the 3 top performing countries are still within the «very low» Proficiency Index
51.8
47.82 47.81
45
46
47
48
49
50
51
52
53
U.A.E. Jordan Qatar
Proficiency Index
U.A.E.
Jordan
Qatar
Top 3
Low
Very Low
Bottom 3
38.51
38.19
38.02
37.7
37.8
37.9
38
38.1
38.2
38.3
38.4
38.5
38.6
Algeria Libya Iraq
Proficiency Index
Algeria
Libya
Iraq
Only U.A.E. Within the top 3 countries is not in the «very low» proficiency tier
Iraq is the lowest performing country within the Middle East
Source: EF EPI – English Proficiency Index
Low50.0
Very Low

Employment regulations – Middle East*
Data from enterprise surveys indicate that in someMiddle East countries employment regulations areperceived as a significant constraint to doingbusiness.
Are the top three countries whereFirms Identify Labor Regulations as aMajor Constraint do Doing Business
Lebanon, Oman and Syria
Percentage of firms constrained by labor laws
Source: World Bank
38
35 34
27
1412
0
5
10
15
20
25
30
35
40
Lebanon Oman Syria Egypt Jordan WBG
%
Source: World Bank
An important issue across all Gulf Corporation Council countries, is nationalisation – particularly in the U.A.E, Saudi Arabia, Kuwait & Oman. Whilst different approaches are taken in each country, the overall aim is to reduce reliance on ex-pats by recruiting more local nationals, especially to help reduce youth unemployment.
* North Africa covered in Sub-Saharan Africa section
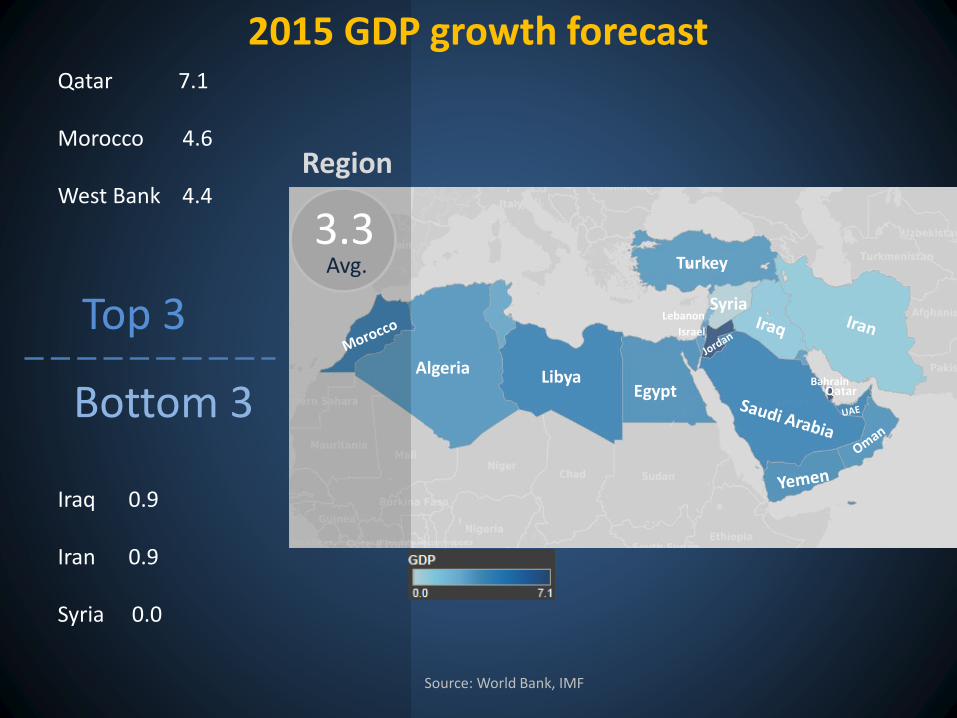
3.3
Region
LibyaEgypt
Algeria
2015 GDP growth forecast
Turkey
Syria
QatarBahrain
Lebanon
IsraelTop 3
Bottom 3
Iraq 0.9
Iran 0.9
Syria 0.0
Qatar 7.1
Morocco 4.6
West Bank 4.4
Avg.
Source: World Bank, IMF
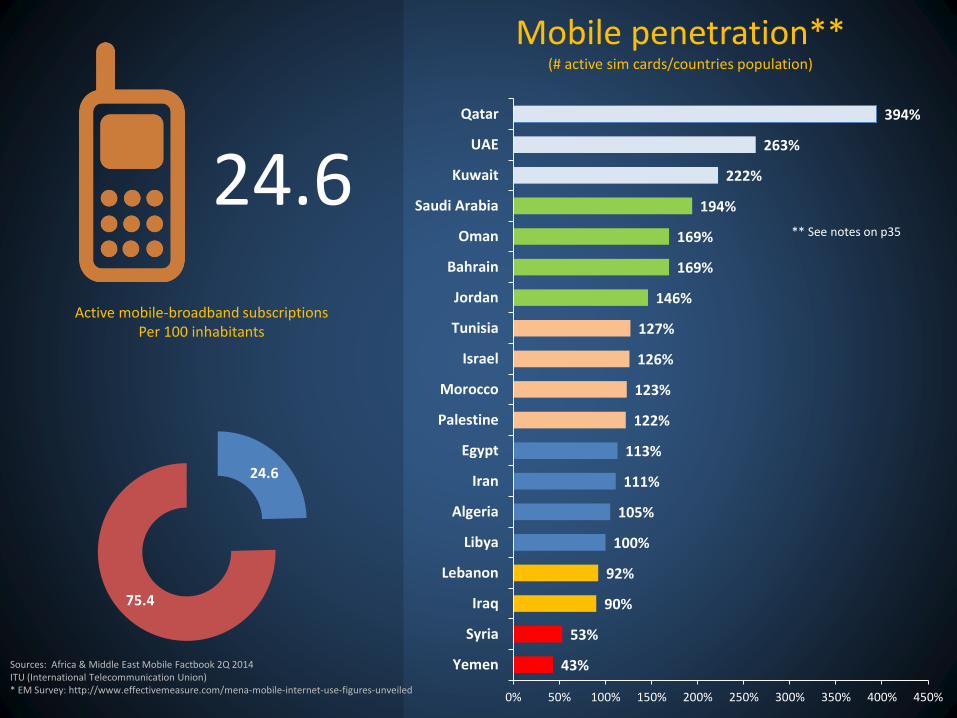
Mobile penetration**(# active sim cards/countries population)
43%
53%
90%
92%
100%
105%
111%
113%
122%
123%
126%
127%
146%
169%
169%
194%
222%
263%
394%
0% 50% 100% 150% 200% 250% 300% 350% 400% 450%
Yemen
Syria
Iraq
Lebanon
Libya
Algeria
Iran
Egypt
Palestine
Morocco
Israel
Tunisia
Jordan
Bahrain
Oman
Saudi Arabia
Kuwait
UAE
Qatar
Sources: Africa & Middle East Mobile Factbook 2Q 2014 ITU (International Telecommunication Union) * EM Survey: http://www.effectivemeasure.com/mena-mobile-internet-use-figures-unveiled
24.6
75.4
24.6
Active mobile-broadband subscriptionsPer 100 inhabitants
** See notes on p35
Regional challenges in Sub-Saharan Africa

Key facts47 Countries
More than 1000 local languages –around 16% of all languages in the world
English, French, and Portuguese are important languages in Africa: 130, 115 & 30 million Africans speak them as either native or secondary languages
Sub-Saharan Africa
By the end of 2014 it is forecast that there will be over 635million mobile phone subscriptions in Sub-Saharan Africa.This is predicted to rise to around 930 million by the end of2019.
Internet access is broadly low, with less than 5% of theworlds internet users in region. Nigeria has the largestpopulation of internet users at over 11 million people.

2015 GDP growth forecast
4.5
Region
Top 3
Bottom 3
South AfricaLesotho
Mozambique
BotswanaNamibia
Zimbabwe
Guinea - 2.0
Somalia - 1.5
Sierra Leone - 0.2
Cote D’Ivoire 8.5
Mozambique 8.0
Liberia 7.8
Avg.
Source: World Bank, IMF

African employment law
North AfricaIn Egypt, Morocco and Algeriaemployment regulations regularlycited as a major constraint to doingbusiness.
South AfricaEmployers often cite strict labor legislationand an inflexible labor market as a businessconstraint.There is also strict legislation regarding theemployment of local nationals instead of ex-pats, to develop local skills and reduceunemployment.
Sources: World Bank, University of Cape Town
Difficulty of Hiring indexShare of firms identifying labor constraints
37.334.4
32.8 31.9
27.826.5
19.2
0
5
10
15
20
25
30
35
40
Sub-SaharanAfrica
LatinAmerica
Middle East& North
Africa
East. Europe& Central
Asia
South Asia OECD East Asia &Pacific
27%
16%
14%
Egypt
Morocco
Algeria

Languages - South Africa
76%
Source: The Economist – Southafrica.info
English is the most commonlyspoken language in official,public and commercial life.
Are fluent in local languages.
0.5
1.6
2.1
2.4
2.5
4.5
7.6
8
9.1
9.6
13.5
16
22.7
0 5 10 15 20 25
Sign Language
Other
isiNdebele
Tshivenda
SiSwati
Xitsonga
Sesotho
Setswana
Sepedi
English
Afrikaans
isiXhosa
isiZulu
% of total speakers
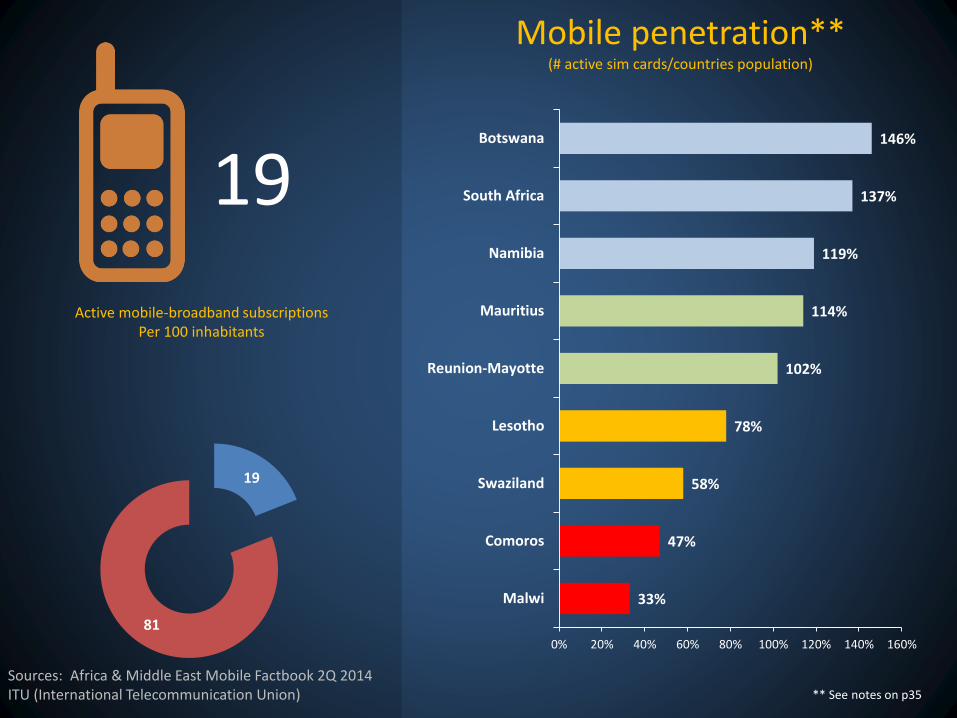
33%
47%
58%
78%
102%
114%
119%
137%
146%
0% 20% 40% 60% 80% 100% 120% 140% 160%
Malwi
Comoros
Swaziland
Lesotho
Reunion-Mayotte
Mauritius
Namibia
South Africa
Botswana
Sources: Africa & Middle East Mobile Factbook 2Q 2014 ITU (International Telecommunication Union)
19
81
Active mobile-broadband subscriptionsPer 100 inhabitants
19
Mobile penetration**(# active sim cards/countries population)
** See notes on p35

Recommendations & partnering with LinkedIn

EMEA market recommendationsAs we’ve seen, there is a tremendous amount of complexity & diversity within the EMEA region – from languages spoken, English language proficiency, economic prospects or local employment law. So what does this all mean for TA Execs?
The first key point, is that there is not one single, global TA strategy that is going to work equally effectively in all regions of the world. Whilst it is essential that strategies are globally aligned, it’s critical that they are regionalised & localised for the various markets your business operates in.
The basics for EMEA, as anywhere else, start with understanding the business strategy, then prioritisation of your hiring goals & countries for the business. With that, building out a supporting TA strategy for each market bearing in mind he following factors:
• Think about developing country level alignment of TA teams – if you have a big enough team, then line of business, functional and seniority alignment can also be built in.
• Identify the most important channels to market for each individual country (including professional networks, social networks, job boards, recruitment agencies, etc) – some channels are strong across all major markets in EMEA, others are only strong in individual countries.
• Have local nationals (or at least people with native local language proficiency) lead the direct sourcing efforts in each country to avoid risk of selection weighted more on fluency in English.
• Employer branding or recruitment marketing content needs to be developed in local language for each country – ideally by local nationals for each market so the content resonates in the deepest way for the local culture.
• Mobile recruitment is a key trend, so your mobile recruitment strategy needs to be strong. This is especially true if you’re focused on Sub-Saharan Africa or MENA countries due to the extremely high percentage of people accessing the internet via mobile in those regions.
1
2
3
Develop country level alignment in TA teams
Source in local language, with engagement tailored to local cultural need
Regionalised & localised employer branding
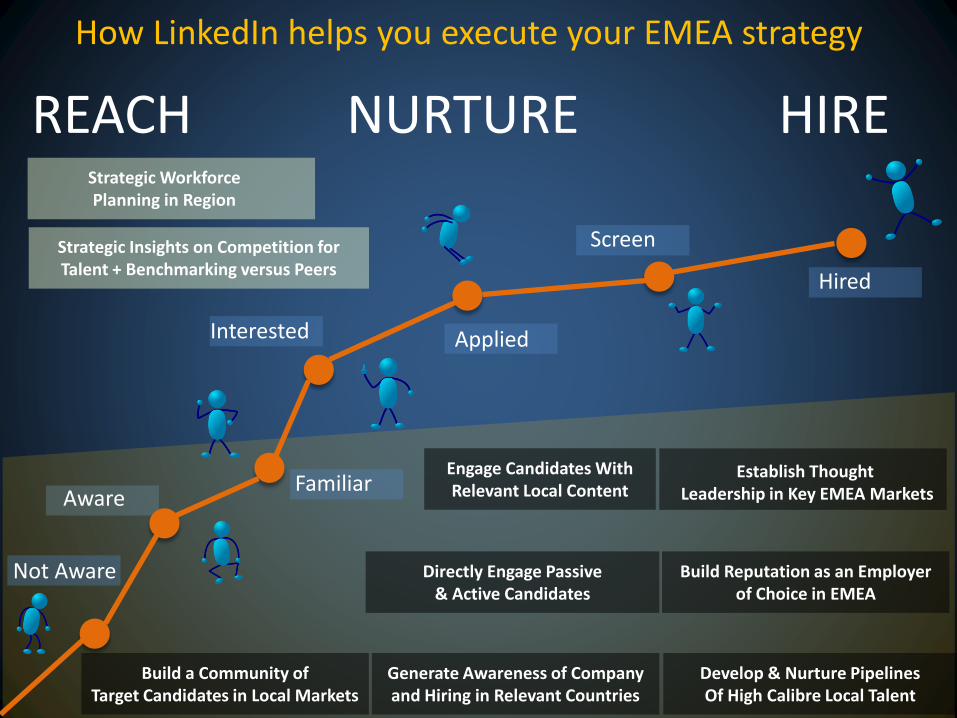
Not Aware
How LinkedIn helps you execute your EMEA strategy
AwareFamiliar
Interested Applied
Screen
Hired
REACH NURTURE HIRE
Build Reputation as an Employer of Choice in EMEA
Establish ThoughtLeadership in Key EMEA Markets
Generate Awareness of Company and Hiring in Relevant Countries
Directly Engage Passive& Active Candidates
Build a Community ofTarget Candidates in Local Markets
Engage Candidates WithRelevant Local Content
Strategic WorkforcePlanning in Region
Strategic Insights on Competition forTalent + Benchmarking versus Peers
Develop & Nurture PipelinesOf High Calibre Local Talent

LinkedIn EMEA Member Insights
110M+Membersin EMEA
+2 49%
New members per second
Visitors from mobile
75% of new members come from outside of the US
1M+SAUDI ARABIA
3M+SOUTH AFRICA
1M+UNITED ARAB EMIRATES
17M+UNITED KINGDOM
8.6M+FRANCE
7.4M+ITALY
2.2M+BELGIUM
1.6M+DENMARK
3.4M+TURKEY
5M+NETHERLANDS
2M+SWEDEN
6.6M+SPAIN
4.3M+RUSSIA
1M+NORWAY
1M+IRELAND
https://press.linkedin.com/about-linkedin

Appendix

Survey Sample• Survey respondents are talent acquisition professionals who:- Work in a corporate HR department- Have at least some authority in determining their company’s recruitment
solutions budget- Focus exclusively on recruiting ,manage a recruiting team or are HR
generalists who spend more than 25% of their time recruiting• Survey respondents are members of LinkedIn who have opted to
participate in research studies. They were selected based on informationin their LinkedIn profile and contacted via email.
Data Comparison• Global Comparisons are reported as un-weighted averages from the
noted countries• Historical data comparisons are taken from 2011, 2012 and 2013
Global Recruiting Trends research, which had similar samplingcriteria and methodology to 2014
o 2014 survey fielded Aug – Sept 2014: 4, 125 global respondentso 2013 survey fielded Apr-May 2013: 3,379 global respondentso 2012 survey fielded May-Jul 2012: 3,028 global respondentso 2011 survey fielded Apr- June 2011: 3,263 global respondents
Canada: 300
USA: 406
Mexico: 151
Brazil: 198
Netherlands: 182
Nordics: 71
Germany: 203
France: 200
Italy: 205
India: 304
China: 201
Spain: 203
UK: 400
Mena: 184
South Africa: 130
Australia: 274
Hong Kong: 51
South East Asia: 385
Belgium: 77
Recruiting Trends Survey Methodology
The EF English Proficiency Index calculatesa country’s average adult English skill levelusing data from two different EF Englishtests completed by hundreds of thousandsof adults every year. One test is open to any Internet user for free. The second is anonline placement test used by EF during the enrollment process for English courses. Both include grammar, vocabulary, reading, and listening sections.
The EF EPI fourth edition was calculatedusing 2013 test data from about 750,000test takers. Only countries with a minimumof 400 test takers were included in theindex.Countries with fewer than 100 test takerson either of the two tests were alsoexcluded, regardless of the total number oftest takers. A total of 63 countries andterritories were included.
Proficiency Index Methodology

Notes on mobile penetration rates
1
2
3
Penetration is traditionally referred to as mobile connections (active sim cards). Data for the mobile penetration charts has been collected by Ipsos for Google using “industry standard” terminology when it comes to measuring mobile penetration. You can see it here see: https://gsmaintelligence.com/research/2014/05/measuring-mobile-penetration/430/
“There is an important difference between the number of mobile connections –the metric traditionally used by the industry to measure market size and penetration – and what we term unique mobile subscribers. The latter refers to a single individual that has subscribed to a mobile service and that person can hold multiple mobile connections (i.e. SIM cards).If one individual actively uses two SIM connections, that person will be counted by the industry as two mobile connections although he or she is only one mobile subscriber.
It is important to note that the definition of a unique mobile subscriber is not restricted to the number of people that own a mobile phone, but rather the number of people that are subscribed to a mobile tariff or service – i.e. via a SIM card.This is due to the ‘device sharing’ phenomenon whereby individuals do not necessarily need to own a mobile phone to become a mobile subscriber. In addition, total mobile connections do not relate solely to mobile phones but instead take into account all device types (e.g., phones, connected tablets, dongles, routers

Many people in Sub-Saharan Africa usemobiles for online activities that othersnormally perform on laptops or desktopcomputers.
45% of Middle East and North Africainternet users access the web via theirmobile phones. This figures rises to 50 percent of users in the UAE.*
33.3%
19.5%
17.2%
0
5
10
15
20
25
30
35
Europe Middle East Africa
Qatar and UAE enjoy the highestlevels of smartphone adoption in theworld at over 80% of the population.
Active Mobile Broadband Subscriptions (per 100 Inhabitants) growth since 2010
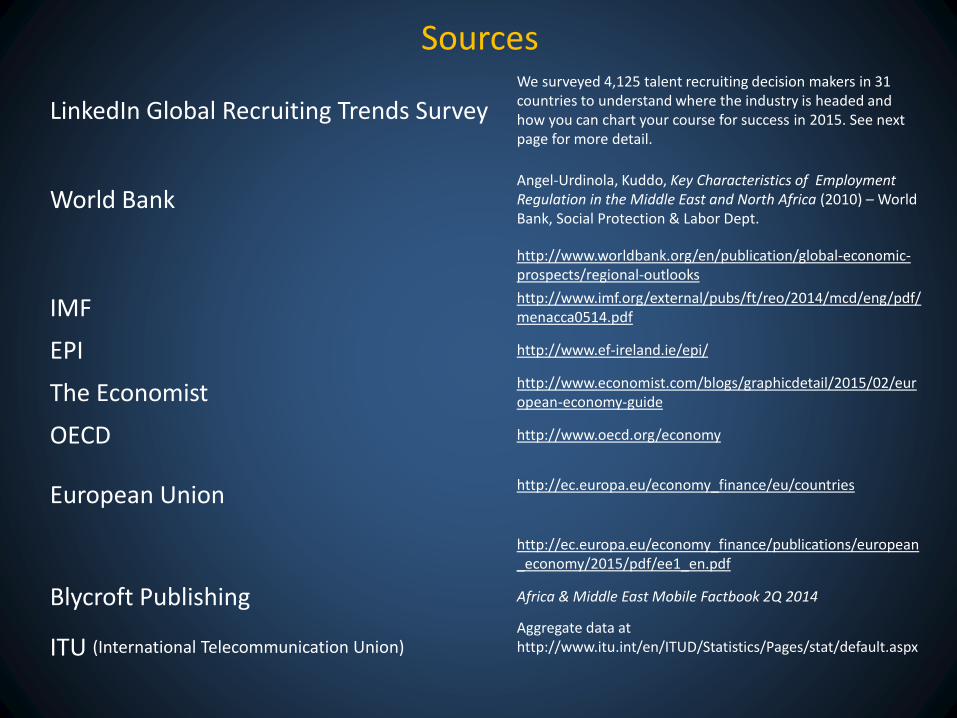
Sources
LinkedIn Global Recruiting Trends SurveyWe surveyed 4,125 talent recruiting decision makers in 31 countries to understand where the industry is headed and how you can chart your course for success in 2015. See next page for more detail.
World BankAngel-Urdinola, Kuddo, Key Characteristics of Employment Regulation in the Middle East and North Africa (2010) – World Bank, Social Protection & Labor Dept.
http://www.worldbank.org/en/publication/global-economic-prospects/regional-outlooks
IMF http://www.imf.org/external/pubs/ft/reo/2014/mcd/eng/pdf/menacca0514.pdf
EPI http://www.ef-ireland.ie/epi/
The Economist http://www.economist.com/blogs/graphicdetail/2015/02/european-economy-guide
OECD http://www.oecd.org/economy
European Union http://ec.europa.eu/economy_finance/eu/countries
http://ec.europa.eu/economy_finance/publications/european_economy/2015/pdf/ee1_en.pdf
Blycroft Publishing Africa & Middle East Mobile Factbook 2Q 2014
ITU (International Telecommunication Union)Aggregate data athttp://www.itu.int/en/ITUD/Statistics/Pages/stat/default.aspx

About the authors
Diego AlbanoGlobal Accounts Analyst
Diego joined LinkedIn in March
2013, helping the Customer
Advocacy department for the
English and Italian markets. He
was then promoted Product
specialist for University pages.
In 2015 he finally moved to the
Global Accounts Programme to
work as an analyst.
Prior to LinkedIn, Diego worked
in Google Maps as policy
analyst.
An historian by training, he
completed his Ph.D. In social
history at Trinity College Dublin,
where he taught seminars and
enjoyed the up and downs of
academic life.
Mark WaltonRegional Account Manager
EMEA
Mark joined LinkedIn in April 2011, to
further develop their business in the UK
Financial Services sector. He then
moved to work in the Global Accounts
Programme in March 2013, where he
looks after the EMEA operations of many
of LinkedIn’s largest global clients.
He is very passionate about LinkedIn’s
mission and is a frequent public speaker
to audiences within the student &
financial services market, helping them
better understand how to gain further
economic opportunity through
maximising their time on LinkedIn.
Prior to joining LinkedIn, he had over 13
years of commercial experience working
across the EMEA market. That
experience was gained in 3 main
sectors: technology, recruitment & media
– all of which comes together nicely at
LinkedIn!