A survey of Bonamia exitiosa infection, in Foveaux Strait ...
32
New Zealand Fisheries Assessment Report 2006/40 November 2006 ISSN 1175-1584 A survey of Bonamia exitiosa infection, and oyster density and recruitment in Foveaux Strait dredge oysters (Ostrea chilensis), January 2005 K. P. Michael A. Dunn J. Forman
Transcript of A survey of Bonamia exitiosa infection, in Foveaux Strait ...

New Zealand Fisheries Assessment Report
2006/40 November 2006
ISSN 1175-1584 A survey of Bonamia exitiosa infection, and oyster density and recruitment in Foveaux Strait dredge oysters (Ostrea chilensis), January 2005 K. P. Michael A. Dunn J. Forman
A survey of Bonamia exitiosa infection, and oyster density and recruitment in Foveaux Strait dredge oysters
(Ostrea chilensis), January 2005
K. P. Michael A. Dunn
J. Forman
NIWA Private Bag 14901
Wellington
New Zealand Fisheries Assessment Report 2006/40 November 2006

Published by Ministry of Fisheries Wellington
2006
ISSN 1175-1584
© Ministry of Fisheries
2006
Citation: Michael, K.P.; Dunn, A.; Forman, 1. (2006).
A survey of Bonamia exitiosa infection, and oyster density and recruitment in Foveaux Strait dredge oysters (Ostrea chilensis), January 2005.
New Zealand Fisheries Assessment Report 2006140.31 p.
This series continues the informal New Zealand Fisheries Assessment Research Document series
which ceased at the end of 1999.
EXECUTIVE SUMMARY
Michael, K.P.; Dunn, A.; Forman J. (2006). A survey of Bonamia exitiosa infection, and oyster density and recruitment in Foveaux Strait dredge oysters (Ostrea chilensis), January 2005.
New Zealand Fisheries Assessment Report 2006140.31 p.
The January 2005 Foveaux Strait oyster survey was a joint programme between the Bluff Oyster Management Company and NIW A. Sea conditions were good for dredge sampling and all operational procedures were comparable to those of previous surveys. A single-phase stratified random survey design retained the October 2002 survey strata. Some strata were partitioned, to better define commercial fishery areas designated by oyster skippers. Eighty sample stations were allocated, 50 to commercial strata, and the remainder to exploratory and background strata. All stations were sampled for oyster density and infection by bonamia.
The January 2005 survey found both prevalence and intensity of infection in oysters from B. exitiosa was lower than in January 2004. Sixteen of the 40 stations examined had no detectable bonamia infection. Prevalence ranged from 4% to 32%, and more than half of the stations with infected oysters had a prevalence of 4% (one infected oyster), well down from previous years. Although infection was widespread, it was patchy, probably reflecting low densities of oysters and their distribution. Intensity of infection was also lower; 1.4% of all oysters examined had category 3+ infections, indicating mortality over the summer of 2005 was likely to be low. The low numbers of new clocks and gapers (dying oysters) observed in January 2005 suggested . low recent mortality compared to previous surveys.
Estimates of population size for recruit, pre-recruit, and small oysters in January 2005 were similar to those from the October 2002 survey. The recruited oyster population in 2005, 408 million oysters (253-628 million oysters, c.v. 0.13), is similar to 502 million (310-785) in 2002; pre-recruits 414 (247-652, c.v. 0.15) and 520 million (333-795); and small oysters 1344 (845-2056, c.v. 0.12) and 1243 million (806-1884) respectively. The January 2005 estimates may be biased upward, as they include recruitment to the fishery over part of the growing period between October and January. Since 1999, pre-recruits have declined in similar proportions to recruited oysters suggesting pre-recruit oysters may be as vulnerable to bonamia mortality as recruit-size oysters. The high mortality from widespread and high infection by bonamia in the summer of 2003--04 (January 2004) may have been offset by recruitment.
Commercial fishery areas, particularly north and west of Ruapuke Island, had the highest densities of recruit, pre-recruit, and small oysters (strata CE6, C3, C6, and C4). Estimates for the population size of recruited oysters in designated commercial areas in October 2002 and in January 2005 were similar: 164 million oysters (103-252 million oysters, c.v. 0.12) in 2005 and 144 million (93-216 million oysters, c.v. 0.09) in 2002. Mean density of recruit-size oysters in designated commercial areas in 2005 was about half that in 2002,0.4 oysters/m2 (the same as non commercial areas) from 0.83 oysters/m2 in 2002. The commercial fishery area was twice the size in 2005, 366 km2 than in 2002, 173 km2. Oyster density has been reduced to low background levels.
Recruitment does not appear to be affected (at this stage) by the high recruit and pre-recruit oyster mortalities, and decreasing oyster densities. The population size of small oysters has not changed since 1999. Although there is no evidence of a stock recruit relationship, low oyster densities may affect recruitment processes, both in tenns of larval production and limiting surfaces for larval settlement and survival.
3

1. INTRODUCTION
As well as regular oyster population and bonamia infection surveys, recent research has concentrated on both understanding bonamiosis in oysters (Diggles & Hine 2002, Diggles et al. 2003, Diggles 2004)) and developing length-based models as a means of improving the scientific advice available for the management of the fishery (Dunn 2005). A draft strategic research plan developed to underpin management goals in the Bluff Oyster Management Company Limited Fisheries Plan (Michael & Dunn 2005.), and linked to a wider case study of an ecosystem approach to fisheries management in Foveaux Strait, has provided a focus for future research. However, few fishery data are available to determine the status of commercial fishery areas devastated by mortality from Bonamia exitiosa (bonamia) infection, whether infection continued to cause mortality over the summer of 2004-05, and whether commercial fishery areas where mortality from bonamia had heavily reduced oyster density early in the epizootic are rebuilding.
Since 2000, widespread mortality from the haplosporidian parasite Bonamia exitiosa has reduced oyster density to the historically low levels of the early 1990s. Seven surveys of bonamia and the oyster population found mortality had significantly reduced both the size and number of commercial fishery areas, reduced oyster density within them, and changed the distribution of oysters (Dunn et al. 2000, Dunn et al. 2002, Dunn et al. 2003, Michael et al. 2004a, Michael et al. 2004b). A survey of 40 selected stations in January 2004 for the prevalence and intensity of bonamia infection in oysters (Michael et al. 2005) found widespread and high prevalence and intensity of infection. Continuing mortality by B. exitiosa was expected to affect the population size of recruited oysters available to fishers in 2005. An 80 station survey was therefore proposed for January 2005 to determine the prevalence and intensity of infection of oysters, and status of the epizootic in the fishery. This survey was scheduled at a time of year when the prevalence and intensity of infection is thought to be near its peak, and the mortality of oysters highest (Hine, P.M. 1991, Hine, P. M. 1991).
Since October 1995, two-yearly October surveys of Foveaux Strait oysters have estimated population size and yields. From 1999, yields were estimated from the population size of recruit-sized oysters in fishery areas designated as commercial by oyster skippers (Michael et al. 200 I). In 2004, the Shellfish Working Group agreed to change from historical methods of estimating yield (Current Annual Yield (CAY) using Method 1 of (Annal a et al. 2002)) to projections of recruit-sized stock abundance from a length-based stock assessment model developed by Dunn (2005).
The January 2004 survey also sampled recruit-size oyster density at 40 stations. This limited survey was not able to detect changes in oyster density or population size since those estimated from the October 2002 survey (Michael et al. 2004a). Another two-yearly survey of the oyster population was scheduled for October 2004. Given the current low oyster population levels in the fishery, and the continuing need to monitor the prevalence and intensity of bonamia infection, the Shellfish Working Group recommended the October 2004 survey be deferred and combined with bonamia sampling in January 2005. The size of the survey was reduced from that of previous years, with sampling split between commercial fishery areas (to estimate commercial population size) and the remaining areas, to estimate population size, to determine the status of bonamia infection, and to investigate recruitment. Survey estimates of recruit, pre-recruit, and small oyster population size, and of infection levels are required to update the OYU 5 stock assessment model projections for the period 2005-08.
The commercial population size declined from 275 million in October 1999 to 144 million in October 2002. Fishers' logbook data were not available for the 2004 oyster season to define commercial fishery areas for 2005. However, both the number and extent of commercial fishery areas are not likely to have increased from 2004. The lack of oyster density data from logbooks and recent survey data do not provide sufficient information to assess the status of commercial oyster populations.
4
Recent surveys to estimate the size of the commercial oyster population (Michael et al. 2001, Michael et al. 2004a, Michael et al. 2004b, Michael et al. 2005) focused sampling effort in designated commercial fishery areas that had shifted east between 1999 and 2002. These surveys did not provide sufficient information on the densities of small oysters (less than 50 mm in length) to assess the rebuilding of fishery areas where mortality from bonamia infection had significantly reduced recruit-sized oyster density. Likewise, fishers' logbooks do not provide sufficient information to assess the extent of any rebuilding of these fishery areas. The January 2004 survey estimated numbers of small oysters in the 1999-2003 commercial fishery areas to investigate recruitment. This survey found densities of small oysters were similar or had increased slightly in all areas between October 2002 and January 2004. The January 2005 survey proposed to sample these areas again to determine the status of rebuilding.
This report in part fulfils Milestone 4, Reporting Requirement 2 of the MFish project OYS20040 1, Objective 1. It presents the results of a collaborative survey undertaken by NIW A and the Bluff Oyster Management Company. A single-phase random stratified survey comprising 80 stations was completed in January 2005. This report includes survey estimates of population size and commercial population size for stock assessment. Estimates of prevalence of infection among oysters and the intensity of bonamia infection within individual oysters are presented along with data on the density and distribution of live recruit, pre-recruit, and small oysters. We discuss how these estimates have changed between October 2002 and January 2004.
2. OBJECTIVE
The survey had one objective.
To survey the prevalence and intensity of infection by Bonamia exitiosa; and the distribution and population size of recruit, pre-recruit and small oysters in designated commercial fishery areas for 2005, and areas fished between 2000 and 2004.
3. METHODS
3.1 Sampling design
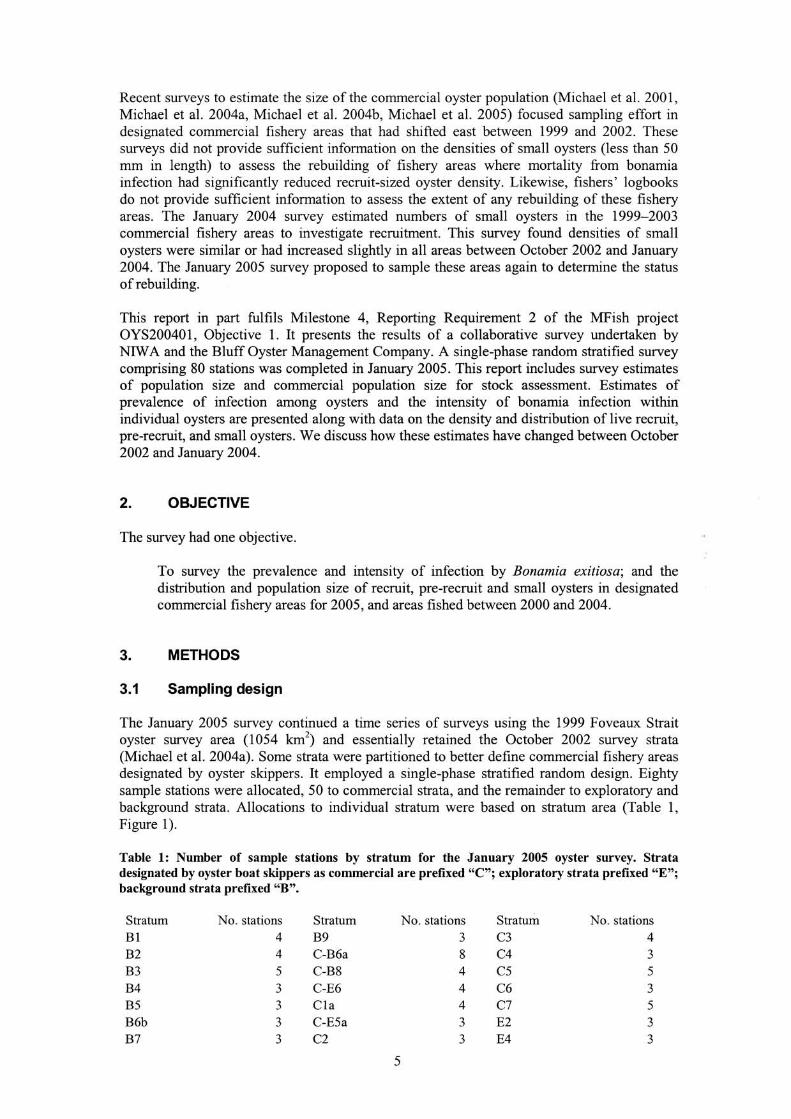
The January 2005 survey continued a time series of surveys using the 1999 Foveaux Strait oyster survey area (1054 km2) and essentially retained the October 2002 survey strata (Michael et al. 2004a). Some strata were partitioned to better define commercial fishery areas designated by oyster skippers. It employed a single-phase stratified random design. Eighty sample stations were allocated, 50 to commercial strata, and the remainder to exploratory and background strata. Allocations to individual stratum were based on stratum area (Table 1, Figure 1).
Table 1: Number of sample stations by stratum for the January 2005 oyster survey. Strata designated by oyster boat skippers as commercial are prefixed "C"; exploratory strata prefixed "E"; background strata prefixed "B".
Stratum No. stations Stratum No. stations Stratum No. stations BI 4 B9 3 C3 4 B2 4 C-B6a 8 C4 3 B3 5 C-B8 4 CS S B4 3 C-E6 4 C6 3 BS 3 Cia 4 C7 S B6b 3 C-ESa 3 E2 3 B7 3 C2 3 E4 3
5
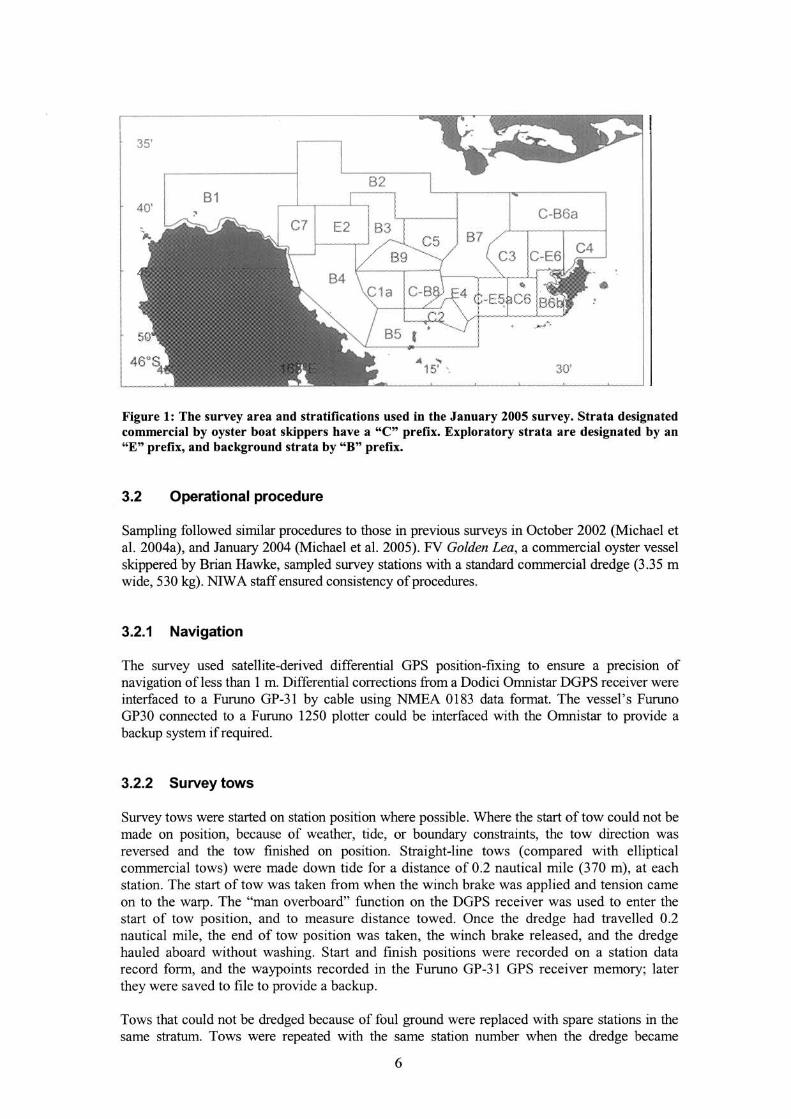
Figure 1: The survey area and stratifications used in the January 2005 survey. Strata designated commercial by oyster boat skippers have a "C" prefix. Exploratory strata are designated by an "E" prefix, and background strata by "B" prefix.
3.2 Operational procedure
Sampling followed similar procedures to those in previous surveys in October 2002 (Michael et al. 2004a), and January 2004 (Michael et al. 2005). FV Golden Lea, a commercial oyster vessel skippered by Brian Hawke, sampled survey stations with a standard commercial dredge (3.35 m wide, 530 kg). NIW A staff ensured consistency of procedures.
3.2.1 Navigation
The survey used satellite-derived differential GPS position-fixing to ensure a precIsIon of navigation ofless than 1 m. Differential corrections from a Dodici Omnistar DGPS receiver were interfaced to a Furuno GP-31 by cable using NMEA 0183 data format. The vessel's Furuno GP30 connected to a Furuno 1250 plotter could be interfaced with the Omnistar to provide a backup system if required.
3.2.2 Survey tows
Survey tows were started on station position where possible. Where the start of tow could not be made on position, because of weather, tide, or boundary constraints, the tow direction was reversed and the tow finished on position. Straight-line tows (compared with elliptical commercial tows) were made down tide for a distance of 0.2 nautical mile (370 m), at each station. The start of tow was taken from when the winch brake was applied and tension came on to the warp. The "man overboard" function on the DGPS receiver was used to enter the start of tow position, and to measure distance towed. Once the dredge had travelled 0.2 nautical mile, the end of tow position was taken, the winch brake released, and the dredge hauled aboard without washing. Start and finish positions were recorded on a station data record form, and the waypoints recorded in the Furuno GP-31 GPS receiver memory; later they were saved to file to provide a backup.
Tows that could not be dredged because of foul ground were replaced with spare stations in the same stratum. Tows were repeated with the same station number when the dredge became
6
tangled or the dredge did not fish properly. Tows were not repeated when the dredge was landed less than 75% full, but mainly filled with kaeos (Pyura pachydermatina) or weed, or when the dredge came fast after 0.1 nautical mile.
3.2.3 Sorting the catch
Only the aft dredge of the two commercial dredges was used for sampling during the survey. Dredge samples were landed onto the aft culching (sorting) bench without washing (i.e., without dipping the dredge) to avoid the loss of small oysters and benthic fauna. The fullness of the dredge was estimated visually while the dredge was suspended above the bench during landing.
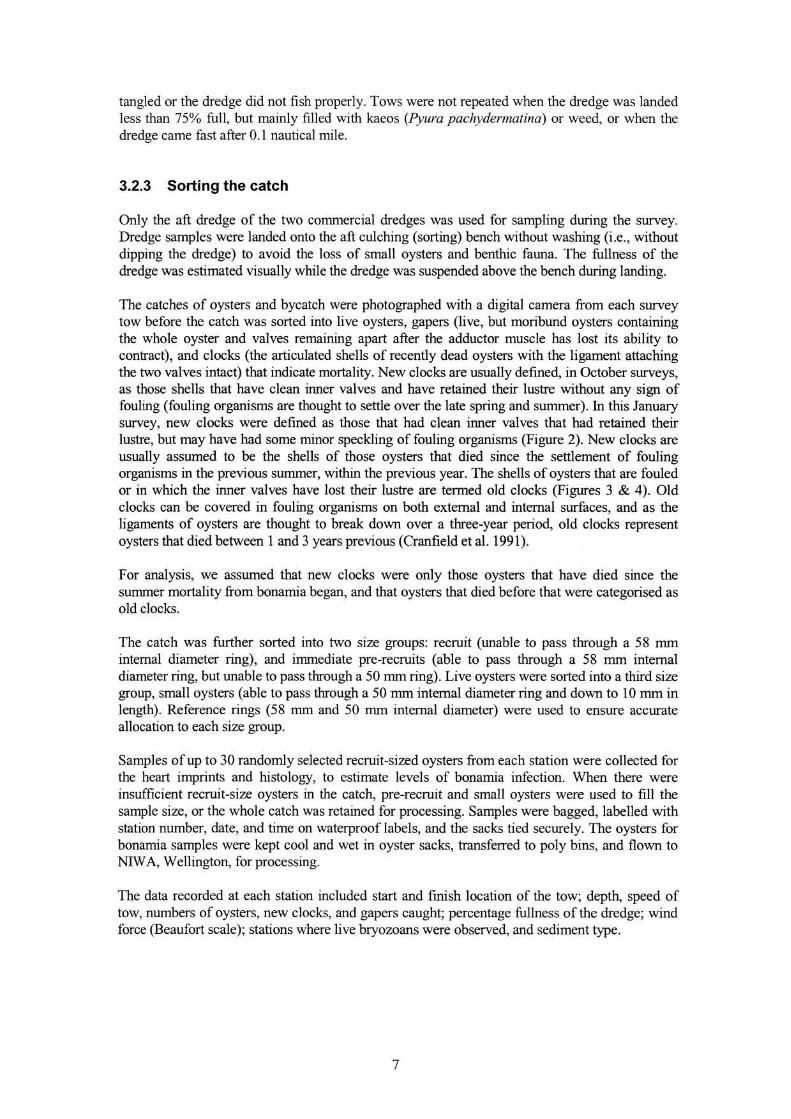
The catches of oysters and bycatch were photographed with a digital camera from each survey tow before the catch was sorted into live oysters, gapers (live, but moribund oysters containing the whole oyster and valves remaining apart after the adductor muscle has lost its ability to contract), and clocks (the articulated shells of recently dead oysters with the ligament attaching the two valves intact) that indicate mortality. New clocks are usually defined, in October surveys, as those shells that have clean inner valves and have retained their lustre without any sign of fouling (fouling organisms are thought to settle over the late spring and summer). In this January survey, new clocks were defined as those that had clean inner valves that had retained their lustre, but may have had some minor speckling of fouling organisms (Figure 2). New clocks are usually assumed to be the shells of those oysters that died since the settlement of fouling organisms in the previous summer, within the previous year. The shells of oysters that are fouled or in which the inner valves have lost their lustre are termed old clocks (Figures 3 & 4). Old clocks can be covered in fouling organisms on both external and internal surfaces, and as the ligaments of oysters are thought to break down over a three-year period, old clocks represent oysters that died between 1 and 3 years previous (Cranfield et al. 1991).
For analysis, we assumed that new clocks were only those oysters that have died since the summer mortality from bonamia began, and that oysters that died before that were categorised as old clocks.
The catch was further sorted into two size groups: recruit (unable to pass through a 58 mm internal diameter ring), and immediate pre-recruits (able to pass through a 58 mm internal diameter ring, but unable to pass through a 50 mm ring). Live oysters were sorted into a third size group, small oysters (able to pass through a 50 mm internal diameter ring and down to 10 mm in length). Reference rings (58 mm and 50 mm internal diameter) were used to ensure accurate allocation to each size group.
Samples of up to 30 randomly selected recruit-sized oysters from each station were collected for the heart imprints and histology, to estimate levels of bonamia infection. When there were insufficient recruit-size oysters in the catch, pre-recruit and small oysters were used to fill the sample size, or the whole catch was retained for processing. Samples were bagged, labelled with station number, date, and time on waterproof labels, and the sacks tied securely. The oysters for bonamia samples were kept cool and wet in oyster sacks, transferred to poly bins, and flown to NIW A, Wellington, for processing.
The data recorded at each station included start and finish location of the tow; depth, speed of tow, numbers of oysters, new clocks, and gapers caught; percentage fullness of the dredge; wind force (Beaufort scale); stations where live bryozoans were observed, and sediment type.
7
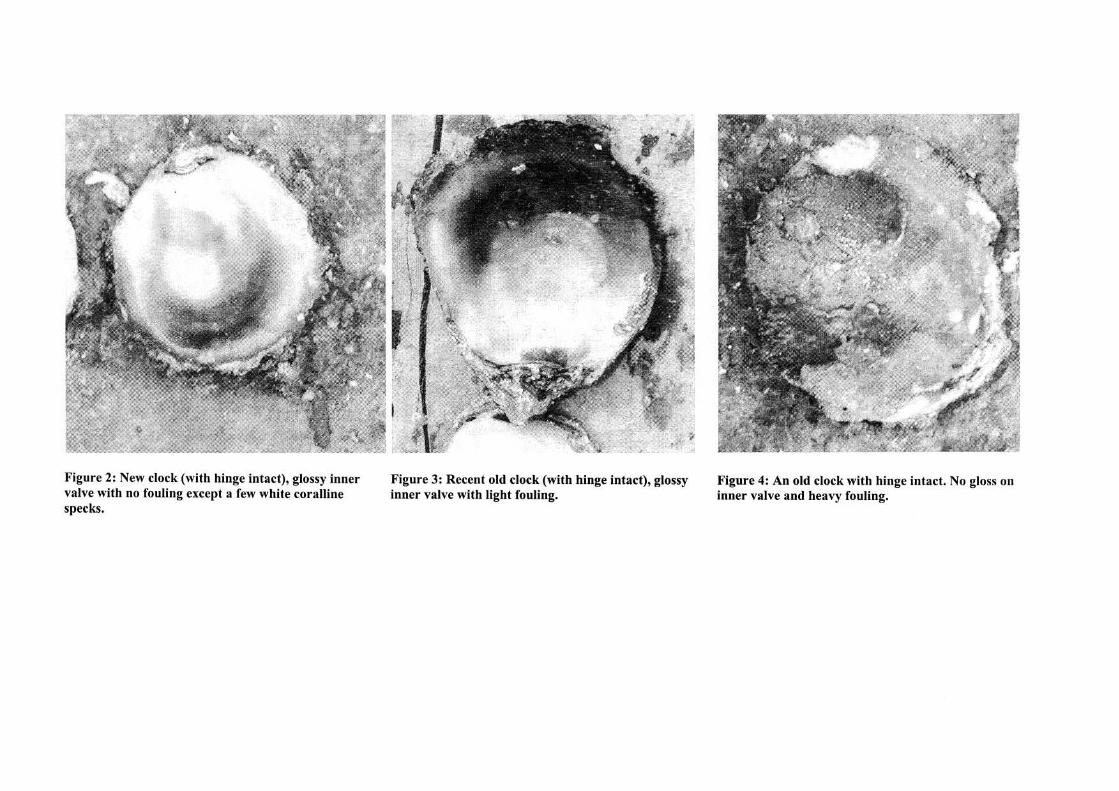
Figure 2: New clock (with hinge intact), glossy inner valve with no fouling except a few white coralline specks.
Figure 3: Recent old clock (with hinge intact), glossy inner valve with light fouling.
Figure 4: An old clock with hinge intact. No gloss on inner valve and heavy fouling.
3.2.4 Processing of bonamia samples, and heart imprints and histology protocols
Oyster samples generally arrived in Wellington within 36 hours of capture, and were processed that day. The samples were held in poly bins under cool conditions (about 12 DC) in the aquarium. If they could not be processed the day they arrived, they were held in tanks of flowing seawater and processed at the first opportunity.
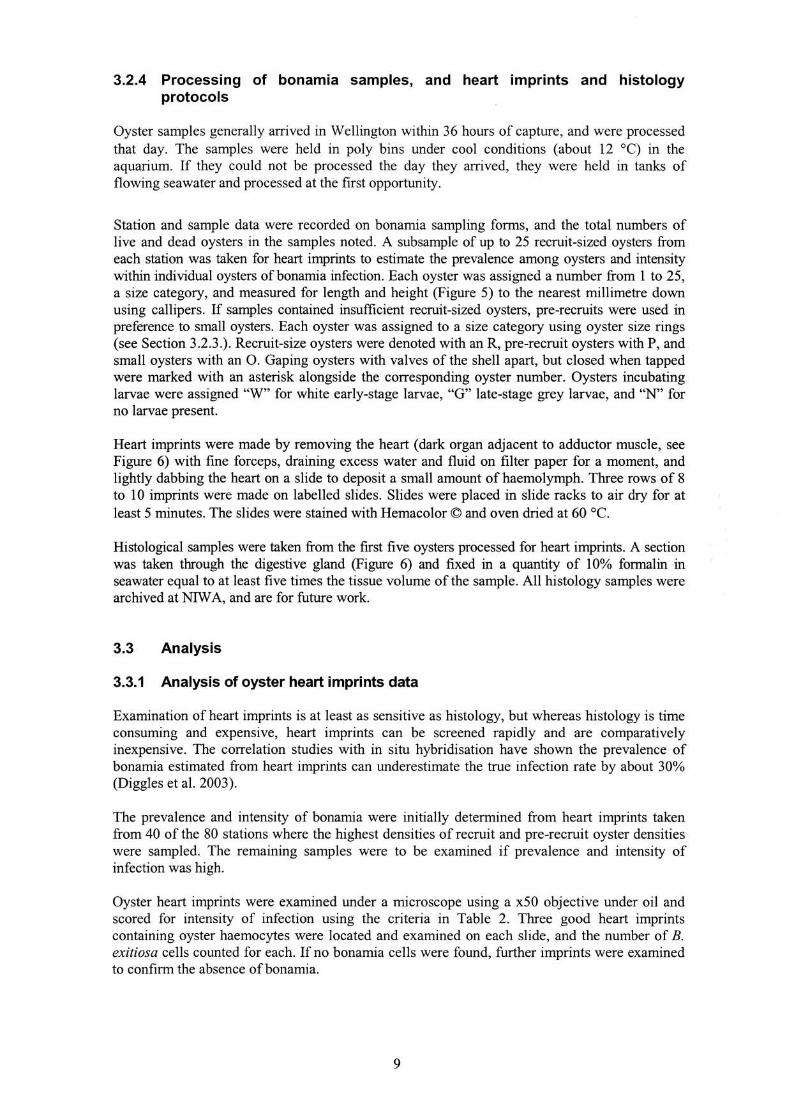
Station and sample data were recorded on bonamia sampling forms, and the total numbers of live and dead oysters in the samples noted. A subsample of up to 25 recruit-sized oysters from each station was taken for heart imprints to estimate the prevalence among oysters and intensity within individual oysters of bon ami a infection. Each oyster was assigned a number from 1 to 25, a size category, and measured for length and height (Figure 5) to the nearest millimetre down using callipers. If samples contained insufficient recruit-sized oysters, pre-recruits were used in preference to small oysters. Each oyster was assigned to a size category using oyster size rings (see Section 3.2.3.). Recruit-size oysters were denoted with an R, pre-recruit oysters with P, and small oysters with an O. Gaping oysters with valves of the shell apart, but closed when tapped were marked with an asterisk alongside the corresponding oyster number. Oysters incubating larvae were assigned "W" for white early-stage larvae, "G" late-stage grey larvae, and "N" for no larvae present.
Heart imprints were made by removing the heart (dark organ adjacent to adductor muscle, see Figure 6) with fine forceps, draining excess water and fluid on filter paper for a moment, and lightly dabbing the heart on a slide to deposit a small amount of haemolymph. Three rows of 8 to 10 imprints were made on labelled slides. Slides were placed in slide racks to air dry for at least 5 minutes. The slides were stained with Hemacolor © and oven dried at 60 DC.
Histological samples were taken from the first five oysters processed for heart imprints. A section was taken through the digestive gland (Figure 6) and fixed in a quantity of 10% formalin in seawater equal to at least five times the tissue volume of the sample. All histology samples were archived at NIW A, and are for future work.
3.3 Analysis
3.3.1 Analysis of oyster heart imprints data
Examination of heart imprints is at least as sensitive as histology, but whereas histology is time consuming and expensive, heart imprints can be screened rapidly and are comparatively inexpensive. The correlation studies with in situ hybridisation have shown the prevalence of bonamia estimated from heart imprints can underestimate the true infection rate by about 30% (Diggles et al. 2003).
The prevalence and intensity of bonamia were initially determined from heart imprints taken from 40 of the 80 stations where the highest densities of recruit and pre-recruit oyster densities were sampled. The remaining samples were to be examined if prevalence and intensity of infection was high.
Oyster heart imprints were examined under a microscope using a x50 objective under oil and scored for intensity of infection using the criteria in Table 2. Three good heart imprints containing oyster haemocytes were located and examined on each slide, and the number of B. exitiosa cells counted for each. If no bonamia cells were found, further imprints were examined to confirm the absence ofbonamia.
9
Height
Length
Figure 5: An oyster showing length (anteriorposterior axis) and height (dorsal-ventral axis) dimensions.
Figure 6: Lines on left oyster show location of 5 mm thick standard section taken for histology. The arrow on the oyster on the right shows the heart, a black organ adjacent to the adductor muscle.
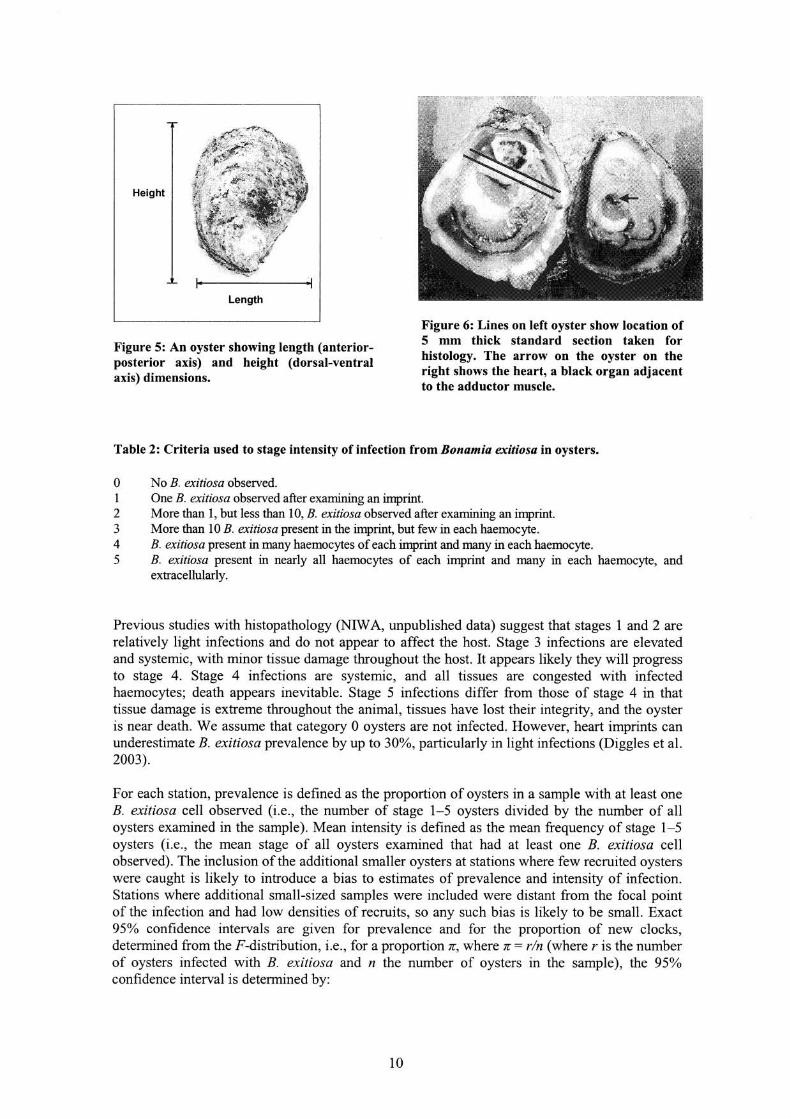
Table 2: Criteria used to stage intensity of infection from BOhamia exitiosa in oysters.
o No B. exitiosa observed. 1 One B. exitiosa observed after examining an imprint. 2 More than 1, but less than 10, B. exitiosa observed after examining an imprint. 3 More than 10 B. exitiosa present in the imprint, but few in each haemocyte. 4 B. exitiosa present in many haemocytes of each imprint and many in each haemocyte. 5 B. exitiosa present in nearly all haemocytes of each imprint and many in each haemocyte, and
extracellularly.
Previous studies with histopathology (NIW A, unpublished data) suggest that stages 1 and 2 are relatively light infections and do not appear to affect the host. Stage 3 infections are elevated and systemic, with minor tissue damage throughout the host. It appears likely they will progress to stage 4. Stage 4 infections are systemic, and all tissues are congested with infected haemocytes; death appears inevitable. Stage 5 infections differ from those of stage 4 in that tissue damage is extreme throughout the animal, tissues have lost their integrity, and the oyster is near death. We assume that category 0 oysters are not infected. However, heart imprints can underestimate B. exitiosa prevalence by up to 30%, particularly in light infections (Diggles et al. 2003).
For each station, prevalence is defined as the proportion of oysters in a sample with at least one B. exitiosa cell observed (i.e., the number of stage 1-5 oysters divided by the number of all oysters examined in the sample). Mean intensity is defined as the mean frequency of stage 1-5 oysters (i.e., the mean stage of all oysters examined that had at least one B. exitiosa cell observed). The inclusion of the additional smaller oysters at stations where few recruited oysters were caught is likely to introduce a bias to estimates of prevalence and intensity of infection. Stations where additional small-sized samples were included were distant from the focal point of the infection and had low densities of recruits, so any such bias is likely to be small. Exact 95% confidence intervals are given for prevalence and for the proportion of new clocks, determined from the F-distribution, i.e., for a proportion 7[, where 7[ = rln (where r is the number of oysters infected with B. exitiosa and n the number of oysters in the sample), the 95% confidence interval is determined by:
10
r Jr0025 =-----------
. r + (n - r + 1) F0025 ,211-2r+2,2r
r + 1 Jr - ------------
0.975 - 1 ( ) F.-I r + + n - r 1- 0.975,2r+2,211-2r
3.3.2 Estimates of oyster density and population size
The January 2005 survey of Foveaux Strait provided estimates of the total oyster population (recruit, pre-recruit, and small oysters), and the commercial population (recruit-sized oysters in designated commercial areas). Estimates of the commercial population were made to provide comparative estimates. Estimates of absolute abundance and variance from stratified random sampling theory (Jolly & Hampton 1990) assumed a mean dredge efficiency, re-estimated from the 1990 data, of 0.17 (95% confidence intervals 0.13-0.22). The original estimate of (Doonan et al. 1994) was 0.16. We assume that areas of commercial densities are !mown without error, and we present estimates of population size for the designated commercial and non-commercial areas separately (see Figure 1).
Survey estimates of the numbers of recruits, pre-recruits, and small oysters are presented separately. The variance of the population size was estimated by bootstrapped error of the estimated dredge efficiency (Cranfield et al. 1998) and the estimated relative population size, both assumed to be normally distributed. Only the error in the relative population size is required when we compare population estimates between dredge surveys as the error in dredge efficiency cancels out.
3.3.3 Patterns of recruitment
Recruitment to the fishery is investigated from changes in the estimated numbers of small oysters and from changes in patterns of distribution of small oyster densities between the October 2002 and January 2005 surveys.
4. RESULTS
4.1 Survey operational detail
The oyster vessel Golden Lea successfully sampled all 80 stations. Sampling began on 21 January 2005 and was completed on 28 January, sampling on 7 days over the period. One day was completely lost due to rough weather and sea conditions. Oyster samples were collected from all stations for bonamia investigations. Survey strata are shown in Figure 1 and dredge tow start positions in Figure 7. The number of stations sampled in each stratum is the same as that shown in Table 1. The survey data are held on the Foveaux Strait dredge oyster database at NIW A, Greta Point, Wellington.
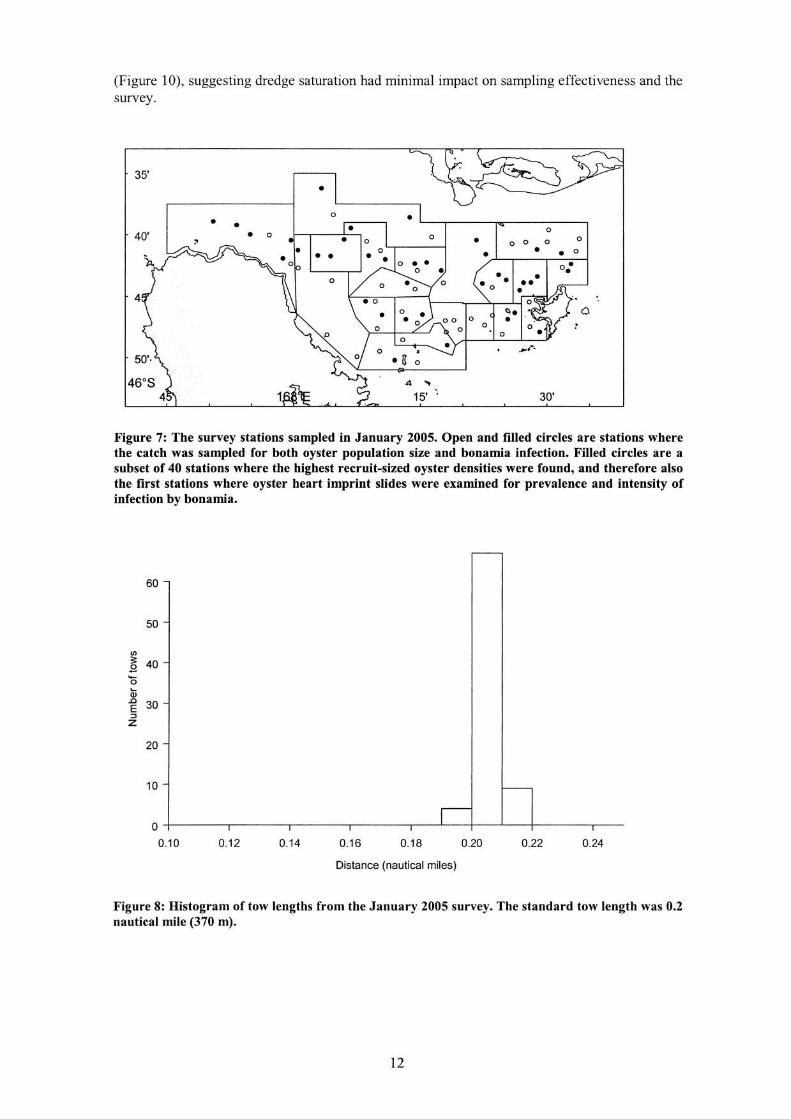
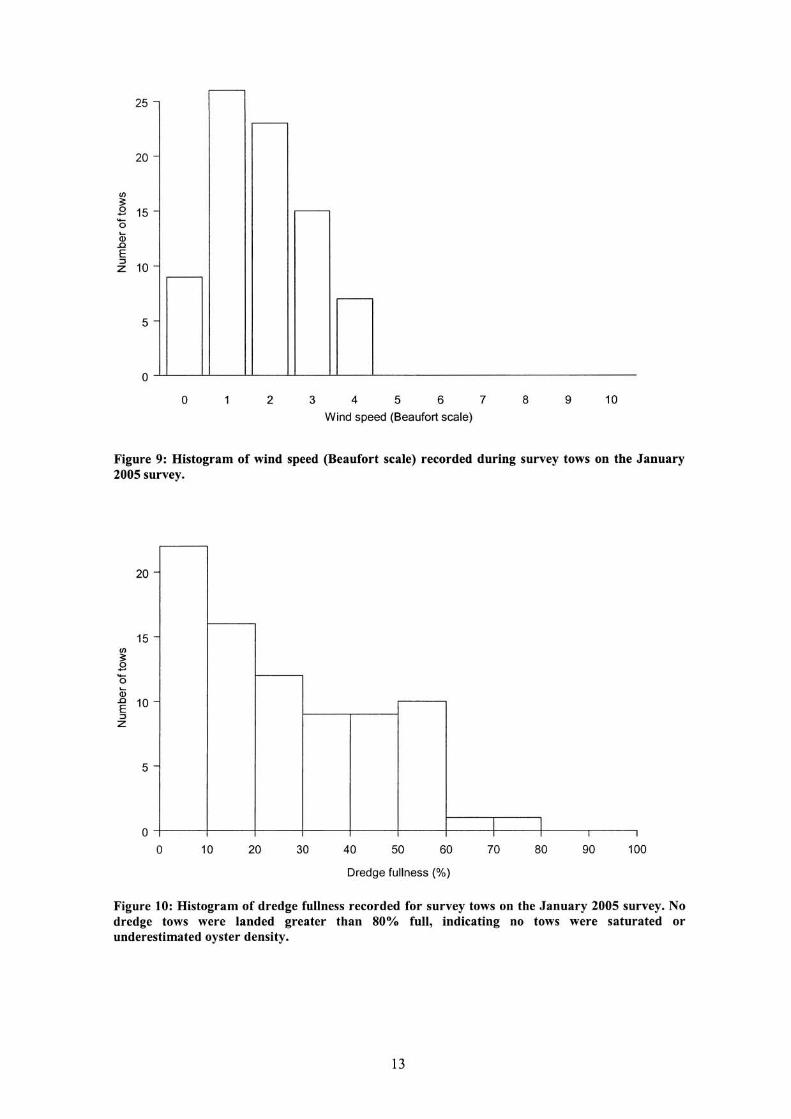
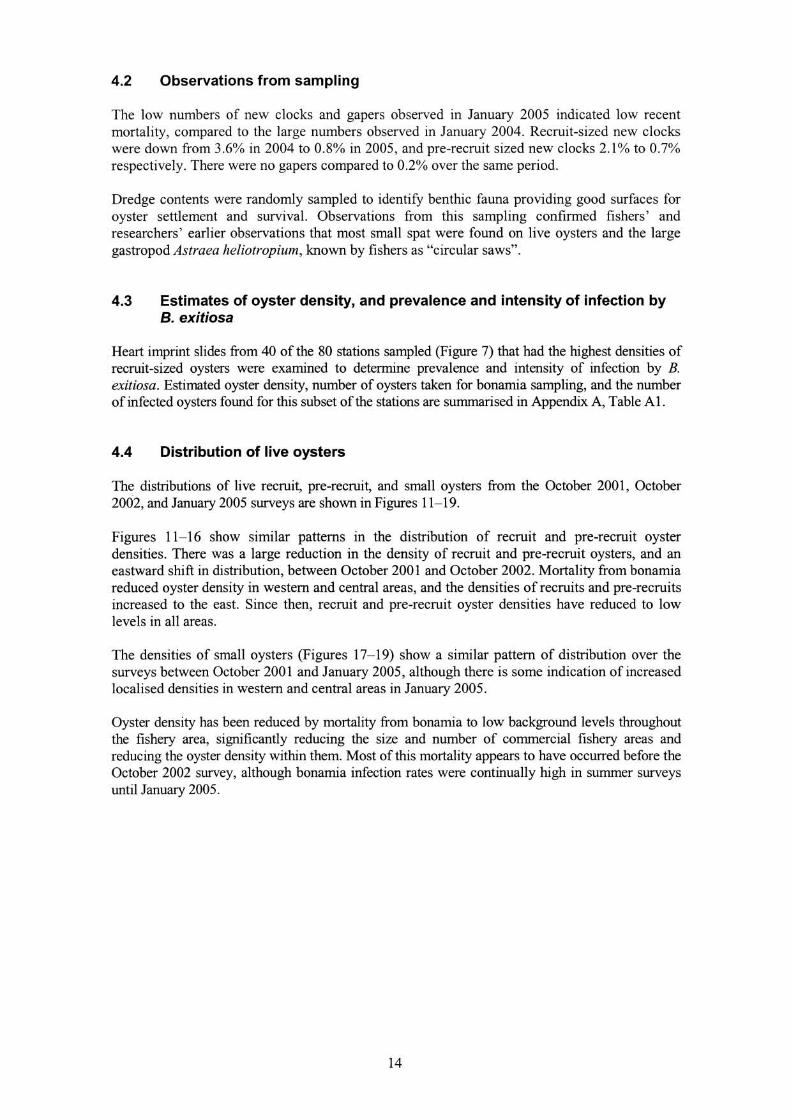
The satellite differential GPS system provided navigation accuracy to less than 1 m most of the time. Dredge tow lengths were closely clustered around the 0.2 nautical mile (370 m) standard tow length (Figure 8). Most of the survey stations were sampled in light wind conditions; the median wind force was 1 on the Beaufort scale (1-3 !mots), with 5 and 95 percentiles of Beaufort scale 0 (calm) and 4 (11-16 !mots) respectively (Figure 9). These wind and resulting sea conditions were similar to sampling conditions on previous surveys, and mostly below the level likely to affect dredge efficiency. Oyster dredges are considered saturated and cease fishing before the end of tow when they are more than 80% full on landing. Dredge saturation may lead to an underestimate of oyster density. All dredge tows were landed less than 80% full
11
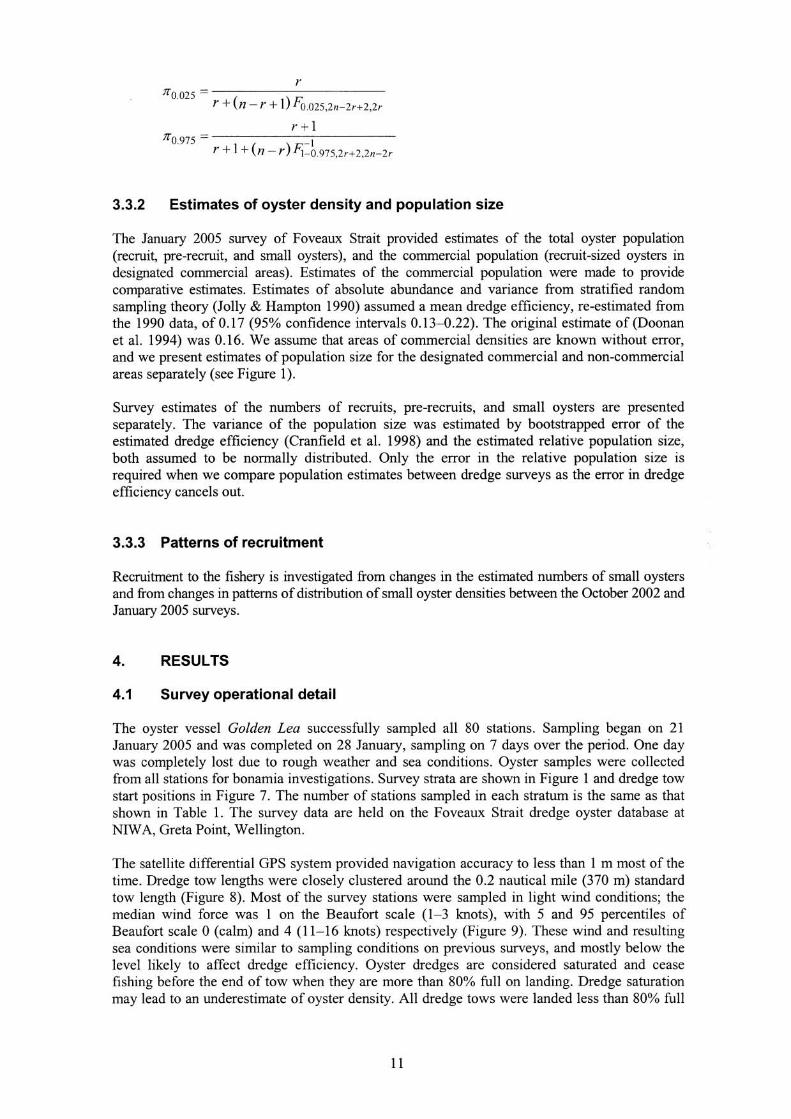
(Figure 10), suggesting dredge saturation had minimal impact on sampling effectiveness and the survey.
35'
•
4
Figure 7: The survey stations sampled in January 2005. Open and filled circles are stations where the catch was sampled for both oyster population size and bonamia infection. Filled circles are a subset of 40 stations where the highest recruit-sized oyster densities were found, and therefore also the first stations where oyster heart imprint slides were examined for prevalence and intensity of infection by bonamia.
60
50
<f)
~ 40 .9 '0 Q; ..c 30 E :::l
Z
20 -
10
0
0.10 0.12 0.14 0.16 0.18 0.20 0.22 0.24
Distance (nautical miles)
Figure 8: Histogram of tow lengths from the January 2005 survey. The standard tow length was 0.2 nautical mile (370 m).
12
25
20
rJl ~ B 15 '0 (jj .0 E ~ 10
5
-
-
-
o ~----~--~~--~----~--~---------------------------------
o 2 3 4 5 6 7 8 9 10
Wind speed (Beaufort scale)
Figure 9: Histogram of wind speed (Beaufort scale) recorded during survey tows on the January 2005 survey.
rJl
~ '0 (jj
20
15
~ 10 ~ z
5
o
-
-
-
o 10 20 30
I I I I I I
40 50 60 70 80 90 100
Dredge fullness (%)
Figure 10: Histogram of dredge fullness recorded for survey tows on the January 2005 survey. No dredge tows were landed greater than 80% full, indicating no tows were saturated or underestimated oyster density.
13
4.2 Observations from sampling
The low numbers of new clocks and gapers observed in January 2005 indicated low recent mortality, compared to the large numbers observed in January 2004. Recruit-sized new clocks were down from 3.6% in 2004 to 0.8% in 2005, and pre-recruit sized new clocks 2.1% to 0.7% respectively. There were no gapers compared to 0.2% over the same period.
Dredge contents were randomly sampled to identifY benthic fauna providing good surfaces for oyster settlement and survival. Observations from this sampling confirmed fishers' and researchers' earlier observations that most small spat were found on live oysters and the large gastropod Astraea heliotropium, known by fishers as "circular saws".
4.3 Estimates of oyster denSity, and prevalence and intensity of infection by B. exitiosa
Heart imprint slides from 40 of the 80 stations sampled (Figure 7) that had the highest densities of recruit-sized oysters were examined to determine prevalence and intensity of infection by B. exitiosa. Estimated oyster density, number of oysters taken for bonamia sampling, and the number of infected oysters found for this subset of the stations are summarised in Appendix A, Table AI.
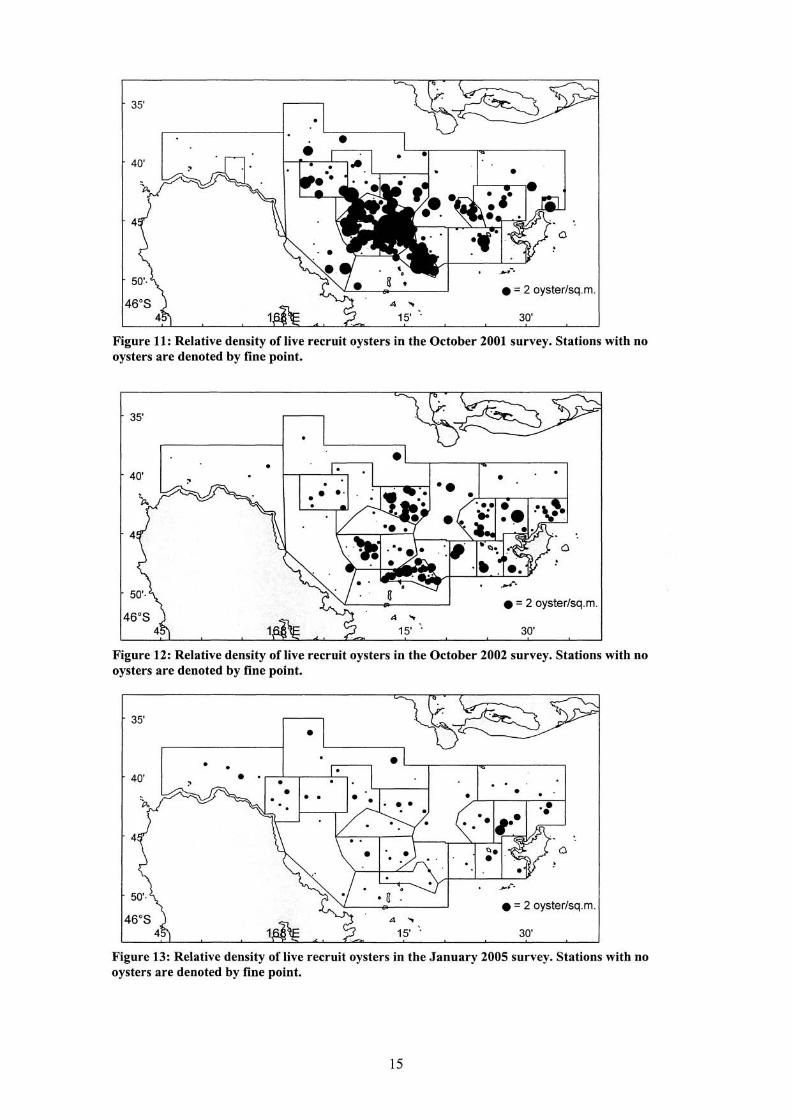
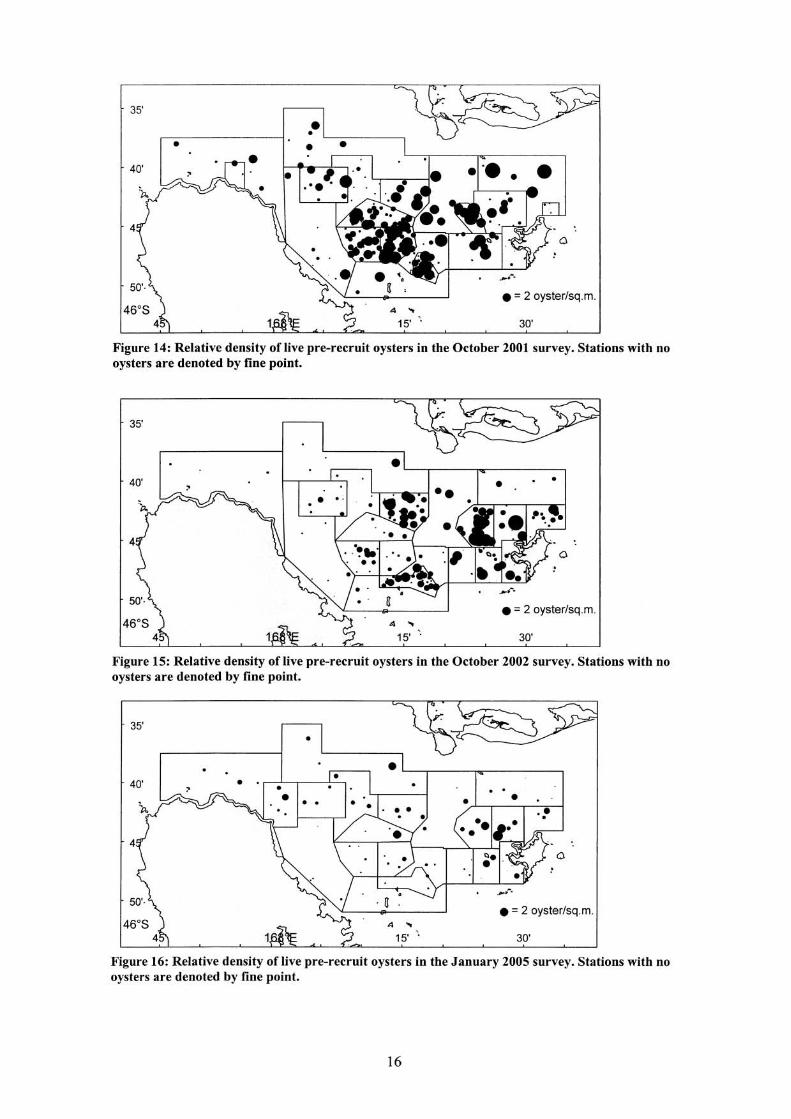
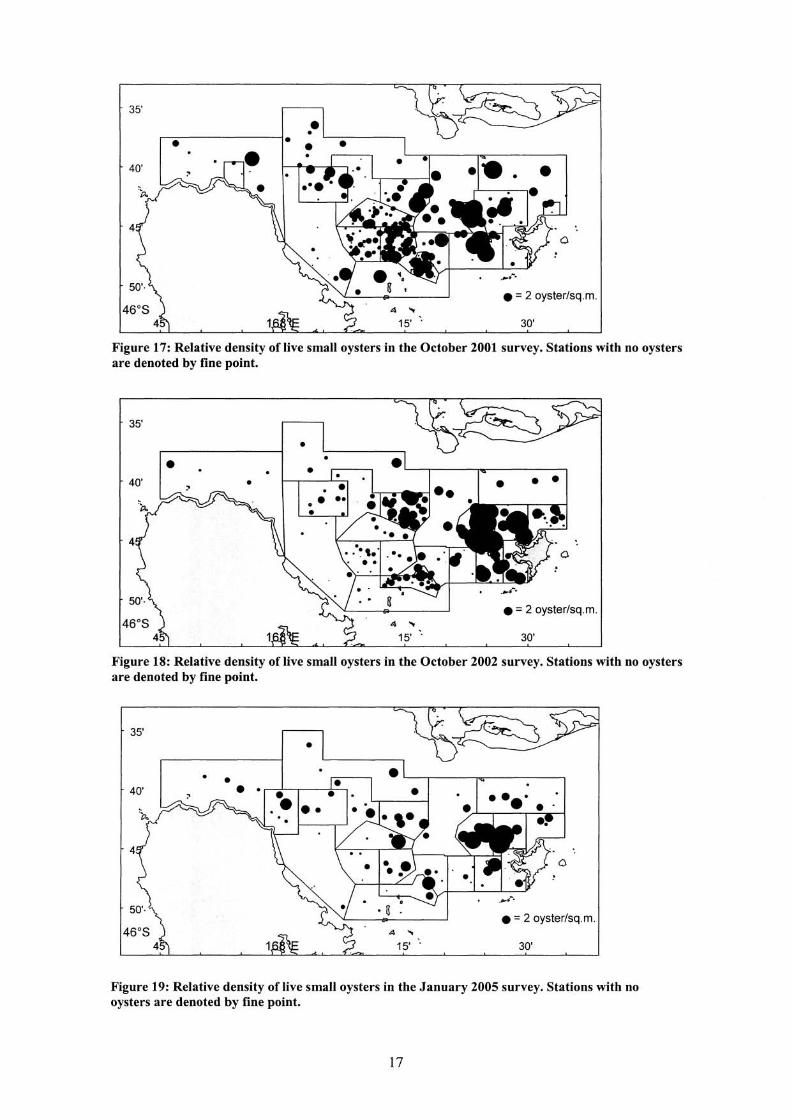
4.4 Distribution of live oysters
The distributions of live recruit, pre-recruit, and small oysters from the October 2001, October 2002, and January 2005 surveys are shown in Figures 11-19.
Figures 11-16 show similar patterns in the distribution of recruit and pre-recruit oyster densities. There was a large reduction in the density of recruit and pre-recruit oysters, and an eastward shift in distribution, between October 2001 and October 2002. Mortality from bonamia reduced oyster density in western and central areas, and the densities of recruits and pre-recruits increased to the east. Since then, recruit and pre-recruit oyster densities have reduced to low levels in all areas.
The densities of small oysters (Figures 17-19) show a similar pattern of distribution over the surveys between October 2001 and January 2005, although there is some indication of increased localised densities in western and central areas in January 2005.
Oyster density has been reduced by mortality from bonamia to low background levels throughout the fishery area, significantly reducing the size and number of commercial fishery areas and reducing the oyster density within them. Most of this mortality appears to have occurred before the October 2002 survey, although bonamia infection rates were continually high in summer surveys until January 2005.
14
35'
40'
A ...
15' "
• = 2 oysterlsq.m.
30'
Figure 11: Relative density of live recruit oysters in the October 2001 survey. Stations with no oysters are denoted by fine point.
35'
• 40'
.L...----r---,...-----------,
A ... 15' ':
•
• = 2 oysterlsq.m.
30'
Figure 12: Relative density of live recruit oysters in the October 2002 survey. Stations with no oysters are denoted by fine point.
35'
• •
40' • • •
4
•
a ... 15' "
. •
. •
• = 2 oysterlsq.m.
30'
Figure 13: Relative density of live recruit oysters in the January 2005 survey. Stations with no oysters are denoted by fine point.
15
35'
• 40'
4 ...
15' "
• = 2 oysterlsq.m.
30'
Figure 14: Relative density of live pre-recruit oysters in the October 2001 survey. Stations with no oysters are denoted by fine point.
35'
40'
4
4 ...
15' '.
•
• = 2 oysterlsq.m.
30'
Figure 15: Relative density of live pre-recruit oysters in the October 2002 survey. Stations with no oysters are denoted by fine point.
35'
•
• 40' •
4
4
.L--r----~r_--------,
4 ... 15' "
. . • • r'--.-..... - ___ -t
.~
• = 2 oysterlsq.m.
30'
Figure 16: Relative density of live pre-recruit oysters in the January 2005 survey. Stations with no oysters are denoted by fine point.
16
35'
• 40' •
• = 2 oysterlsq.m. <$ ...
15' . 30'
Figure 17: Relative density of live small oysters in the October 2001 survey. Stations with no oysters are denoted by fine point.
35'
• •
40' • •
• = 2 oysterlsq.m. <$ ...
15' . 30'
Figure 18: Relative density of live small oysters in the October 2002 survey. Stations with no oysters are denoted by fine point.
35'
•
• • eL----.--__ ,.,.----___ ---, 40'
• = 2 oysterlsq.m. <$ ...
15' . 30'
Figure 19: Relative density of live small oysters in the January 2005 survey. Stations with no oysters are denoted by fine point.
17
4.5 Estimated prevalence and intensity of bonamia infection
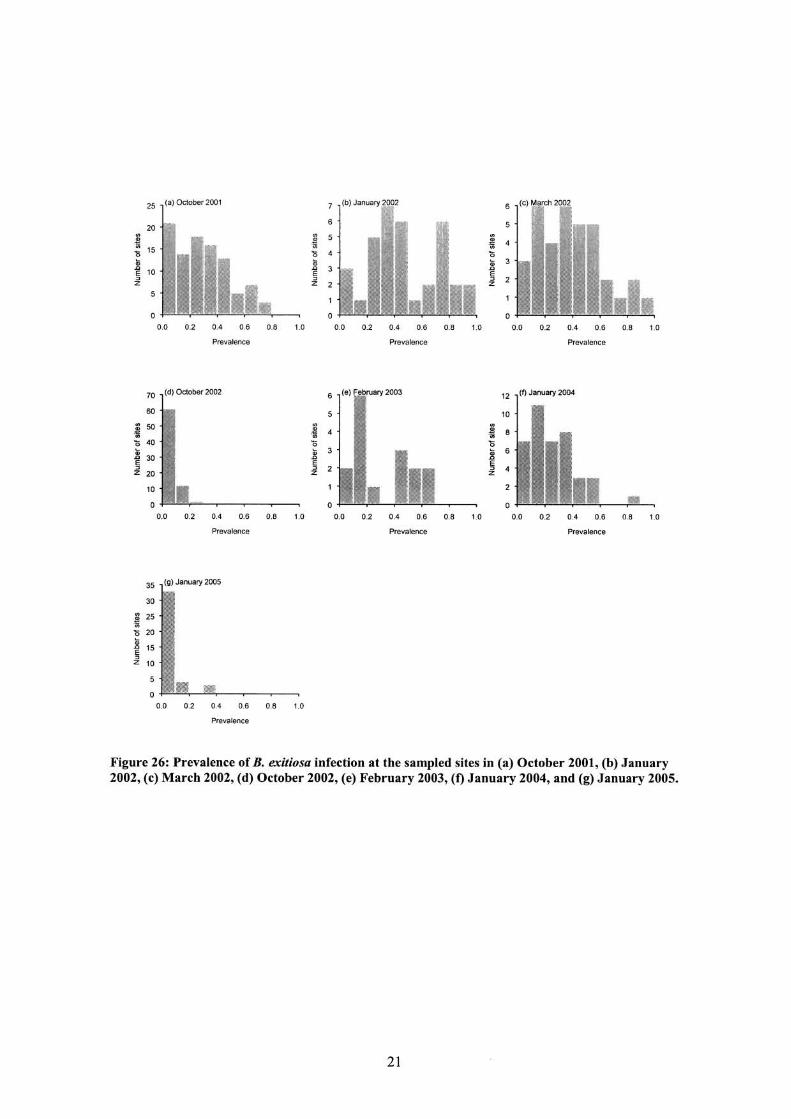
Heart imprints taken in January 2005 could not detect bonamia at 16 of the 40 stations examined (see Figure 22, Table AI). Bonamia infection had a prevalence ranging from 4% to 32%, with more than half of these stations with prevalence of 4% (one infected oyster). This contrasts with 10% of stations in January 2004 and 24% in February 2003 with a prevalence of at least 50%.
In general, the prevalence and intensity of infection by bonamia is highest in summer to early autumn (January to March). Data from three surveys, in October 2001, January 2004, and January 2005, are compared to describe changes in the distribution of prevalence and intensity of infection.
Prevalence of infection by station for the October 2001, January 2004, and January 2005 surveys are shown in Figures 20-22. Prevalence of infection was widespread over the survey area in October 2001 and 2002 (not shown). Although infection was still widespread in January 2005, it was patchy, and probably reflects the distribution of recruit and pre-recruit oyster density. There was a significant decrease in prevalence of infection in January 2005 compared with previous years (Figures 20-22, also see Figure 26).
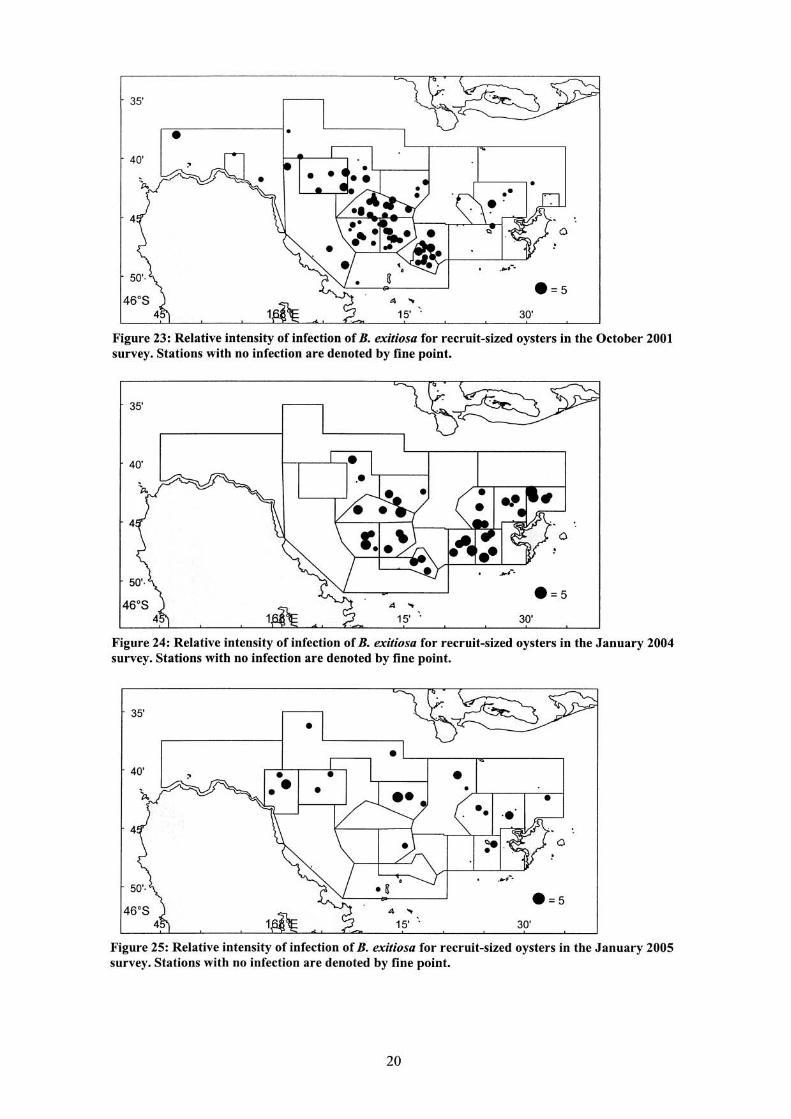
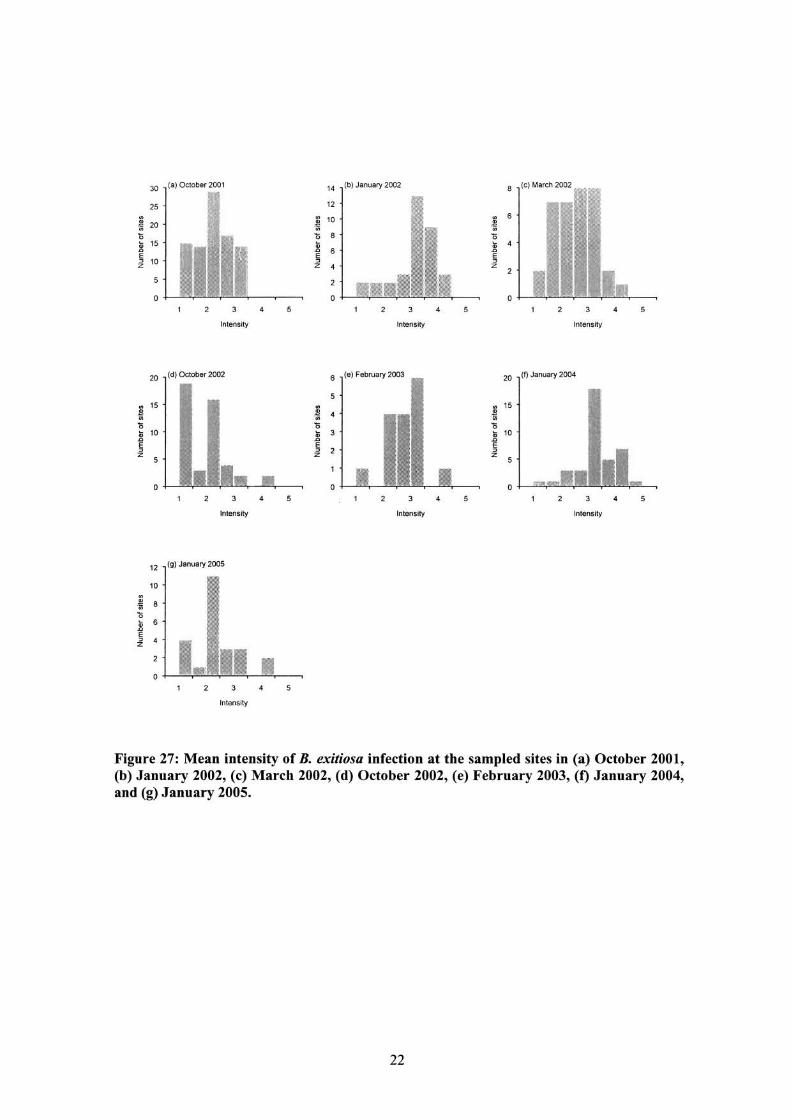
Intensity of infection by station for the October 2001, January 2004, and January 2005 surveys is shown in Figures 23-25. The moderate to high intensity of infection was widespread over all areas sampled October 2001 to January 2004; the highest intensity was present in fishery areas where bonamia originally caused mortality in 2000. In January 2005, intensity of infection was generally lower and more patchily distributed. Intensity of infection from sevsn surveys is shown in Figure 27. The percentage of oysters sampled with category 3+ infections was 1.4% over all oysters examined.
18
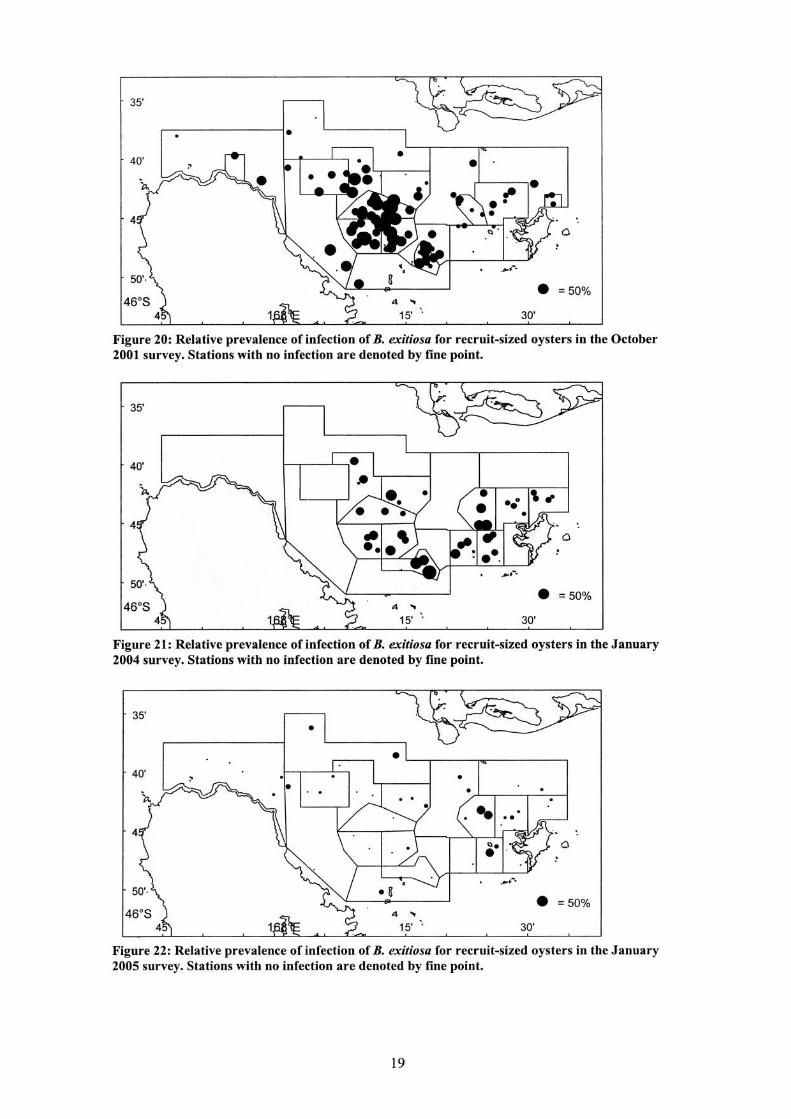
Figure 20: Relative prevalence of infection of B. exitiosa for recruit-sized oysters in the October 2001 survey. Stations with no infection are denoted by fine point.
35'
Figure 21: Relative prevalence of infection of B. exitiosa for recruit-sized oysters in the January 2004 survey. Stations with no infection are denoted by fine point.
Figure 22: Relative prevalence of infection of B. exitiosa for recruit-sized oysters in the January 2005 survey. Stations with no infection are denoted by fine point.
19
4
Figure 23: Relative intensity of infection of B. exitiosa for recruit-sized oysters in the October 2001 survey. Stations with no infection are denoted by fine point.
35'
Figure 24: Relative intensity of infection of B. exitiosa for recruit-sized oysters in the January 2004 survey. Stations with no infection are denoted by fine point.
Figure 25: Relative intensity of infection of B. exitiosa for recruit-sized oysters in the January 2005 survey. Stations with no infection are denoted by fine point.
20
25 (a) October 2001
20 '" 2 ~ 15
" .c E 10 ::J Z
'" ~ '5 :;; .c E ::J z
'" ~ '5 :;; .c § z
5
o
70
60
50
40
30
20
10
0
35
30
25
20
15
10
5
0.0 0.2 0.4 0.6
Prevalence
(d) October 2002
0.0 0.2 0.4 0.6
Prevalence
(g) January 2005
0.0 0.2 0.4 0.6
Prevalence
0.8 1.0
0.8 1.0
0.8 1.0
6
6 5
'" 5 2 ·in
'" ~ 4 '5 4 :;; .Q 3 § z 2
:;; 3 .0
~ 2
o 0.0 0.2 0.4 0.6 0.8 1.0 0.0 0.2 0.4 0.6 0.8 1.0
Prevalence Prevalence
6 2003 12 (I) January 2004
5 10
'" '" 2 4 ·in ~ B '5 :;; 3 :;; 6 .c .c E ::J 2 z ~ 4
2
0 o 0.0 0.2 0.4 0.6 0.8 1.0 0.0 0.2 0.4 0.6 0.8 1.0
Prevalence Prevalence
Figure 26: Prevalence of B. exitiosa infection at the sampled sites in (a) October 2001, (b) January 2002, (c) March 2002, (d) October 2002, (e) February 2003, (1) January 2004, and (g) January 2005.
21
30
25
20
15
10
5
0
3 4
Intensity
20 October 2002
00 15 2 °00
'0 i; 10 .0
§ z
0
3 4
Intensity
12 (9) January 2005
10 00
i 8
~ 6 E ~ 4
o 3 4
Intensity
5
5
14 (b) January 2002 8 (c) March 2002
12
10
8
0
2 4 3 4 5
Intensity Intensity
6 (e) February 2003 20 January 2004
15 4
10
2
0
2 3 4 3 4 5
Intensity Intensity
Figure 27: Mean intensity of B. exitiosa infection at the sampled sites in (a) October 2001, (b) January 2002, (c) March 2002, (d) October 2002, (e) February 2003, (f) January 2004, and (g) January 2005.
22
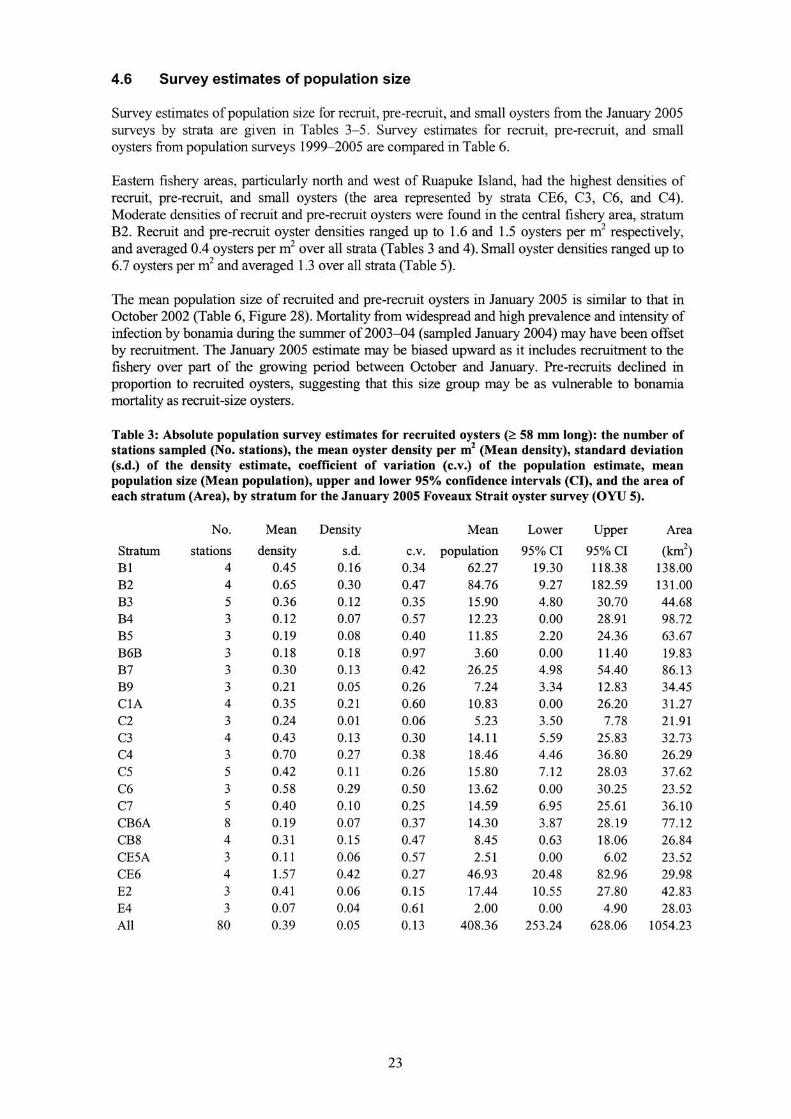
4.6 Survey estimates of population size
Survey estimates of population size for recruit, pre-recruit, and small oysters from the January 2005 surveys by strata are given in Tables 3-5 . Survey estimates for recruit, pre-recruit, and small oysters from population surveys 1999-2005 are compared in Table 6.
Eastern fishery areas, particularly north and west of Ruapuke Island, had the highest densities of recruit, pre-recruit, and small oysters (the area represented by strata CE6, C3, C6, and C4). Moderate densities of recruit and pre-recruit oysters were found in the central fishery area, stratum B2. Recruit and pre-recruit oyster densities ranged up to 1.6 and 1.5 oysters per m2 respectively, and averaged 0.4 oysters per m2 over all strata (Tables 3 and 4). Small oyster densities ranged up to 6.7 oysters per m2 and averaged 1.3 over all strata (Table 5).
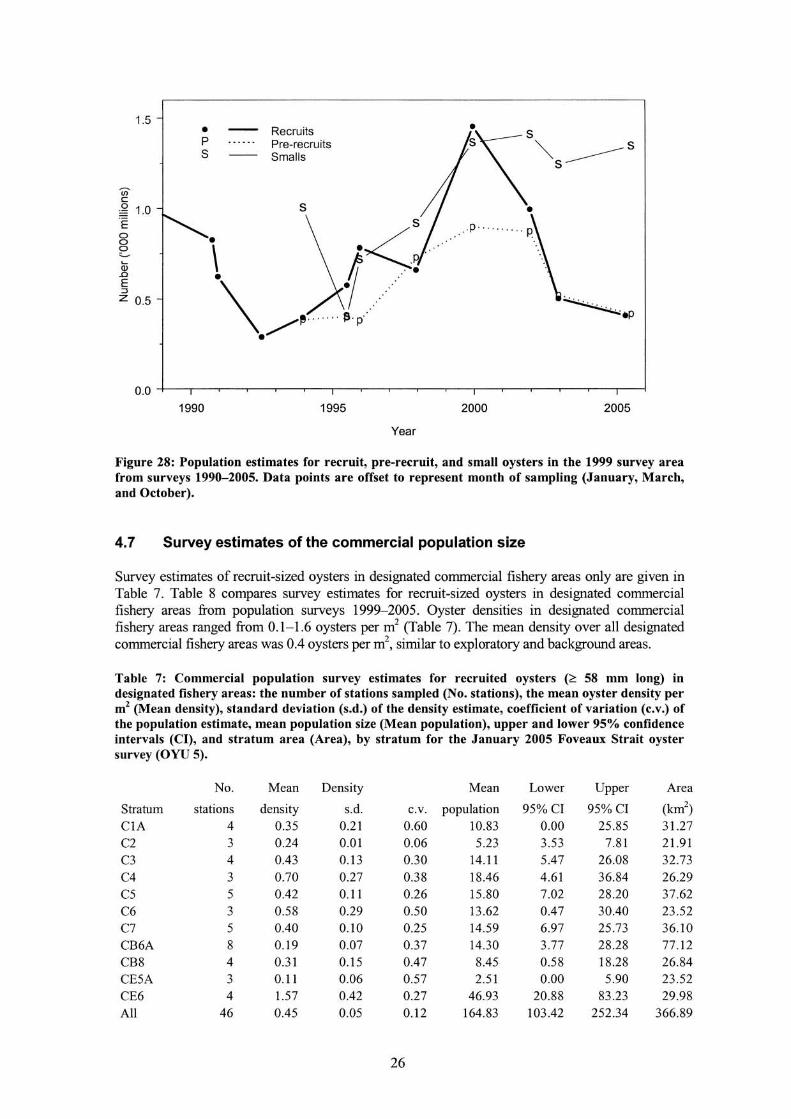
The mean population size of recruited and pre-recruit oysters in January 2005 is similar to that in October 2002 (Table 6, Figure 28). Mortality from widespread and high prevalence and intensity of infection by bonamia during the summer of 2003-04 (sampled January 2004) may have been offset by recruitment. The January 2005 estimate may be biased upward as it includes recruitment to the fishery over part of the growing period between October and January. Pre-recruits declined in proportion to recruited oysters, suggesting that this size group may be as vulnerable to bonamia mortality as recruit-size oysters.
Table 3: Absolute population survey estimates for recruited oysters (~ 58 mm long): the number of stations sampled (No. stations), the mean oyster density per m2 (Mean density), standard deviation (s.d.) of the density estimate, coefficient of variation (c.v.) of the population estimate, mean population size (Mean population), upper and lower 95% confidence intervals (el), and the area of each stratum (Area), by stratum for the January 2005 Foveaux Strait oyster survey (OYU 5).
No. Mean Density Mean Lower Upper Area
Stratum stations density s.d. c.v. population 95%CI 95%CI (1an2)
BI 4 0.45 0.16 0.34 62.27 19.30 118.38 138.00 B2 4 0.65 0.30 0.47 84.76 9.27 182.59 131.00 B3 5 0.36 0.12 0.35 15.90 4.80 30.70 44.68 B4 3 0.12 0.07 0.57 12.23 0.00 28.91 98.72 B5 3 0.19 0.08 0.40 11.85 2.20 24.36 63.67 B6B 3 0.18 0.18 0.97 3.60 0.00 11.40 19.83 B7 3 0.30 0.13 0.42 26.25 4.98 54.40 86.13 B9 3 0.21 0.05 0.26 7.24 3.34 12.83 34.45 CIA 4 0.35 0.21 0.60 10.83 0.00 26.20 31.27 C2 3 0.24 0.01 0.06 5.23 3.50 7.78 21.91 C3 4 0.43 0.13 0.30 14.11 5.59 25 .83 32.73 C4 3 0.70 0.27 0.38 18.46 4.46 36.80 26.29 C5 5 0.42 0.11 0.26 15.80 7.12 28.03 37.62 C6 3 0.58 0.29 0.50 13.62 0.00 30.25 23 .52 C7 5 0.40 0.10 0.25 14.59 6.95 25.61 36.10 CB6A 8 0.19 0.07 0.37 14.30 3.87 28.19 77.12 CB8 4 0.31 0.15 0.47 8.45 0.63 18.06 26.84 CE5A 3 0.11 0.06 0.57 2.51 0.00 6.02 23.52 CE6 4 1.57 0.42 0.27 46.93 20.48 82.96 29.98 E2 3 0.41 0.06 0.15 17.44 10.55 27.80 42 .83 E4 3 0.07 0.04 0.61 2.00 0.00 4.90 28.03 All 80 0.39 0.05 0.13 408.36 253.24 628.06 1054.23
23
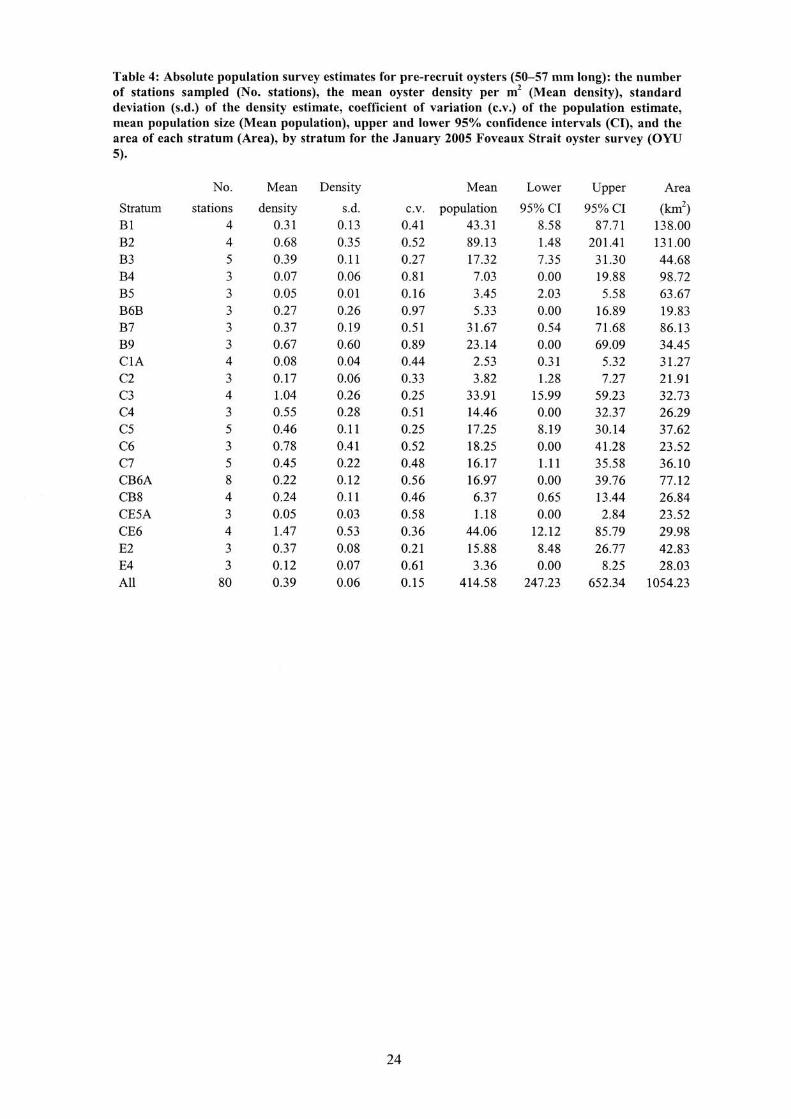
Table 4: Absolute population survey estimates for pre-recruit oysters (50-57 mm long): the number of stations sampled (No. stations), the mean oyster density per m2 (Mean density), standard deviation (s.d.) of the density estimate, coefficient of variation (c.v.) of the population estimate, mean population size (Mean population), upper and lower 95% confidence intervals (CI), and the area of each stratum (Area), by stratum for the January 2005 Foveaux Strait oyster survey (OYU 5).
No. Mean Density Mean Lower Upper Area
Stratum stations density s.d. c.v. population 95% CI 95%CI (lan2)
Bl 4 0.31 0.13 0.41 43.31 8.58 87.71 138.00 B2 4 0.68 0.35 0.52 89.13 1.48 201.41 131.00 B3 5 0.39 0.11 0.27 17.32 7.35 31.30 44.68 B4 3 0.07 0.06 0.81 7.03 0.00 19.88 98.72 B5 3 0.05 0.01 0.16 3.45 2.03 5.58 63 .67 B6B 3 0.27 0.26 0.97 5.33 0.00 16.89 19.83 B7 3 0.37 0.19 0.51 31.67 0.54 71.68 86.13 B9 3 0.67 0.60 0.89 23.14 0.00 69.09 34.45 CIA 4 0.08 0.04 0.44 2.53 0.31 5.32 31.27 C2 3 0.17 0.06 0.33 3.82 1.28 7.27 21.91 C3 4 1.04 0.26 0.25 33.91 15.99 59.23 32.73 C4 3 0.55 0.28 0.51 14.46 0.00 32.37 26.29 C5 5 0.46 0.11 0.25 17.25 8.19 30.14 37.62 C6 3 0.78 0.41 0.52 18.25 0.00 41.28 23.52 C7 5 0.45 0.22 0.48 16.17 1.11 35.58 36.10 CB6A 8 0.22 0.12 0.56 16.97 0.00 39.76 77.12 CB8 4 0.24 0.11 0.46 6.37 0.65 13.44 26.84 CE5A 3 0.05 0.03 0.58 l.l8 0.00 2.84 23.52 CE6 4 1.47 0.53 0.36 44.06 12.12 85 .79 29.98 E2 3 0.37 0.08 0.21 15.88 8.48 26.77 42.83 E4 3 0.12 0.07 0.61 3.36 0.00 8.25 28.03 All 80 0.39 0.06 0.15 414.58 247.23 652.34 1054.23
24
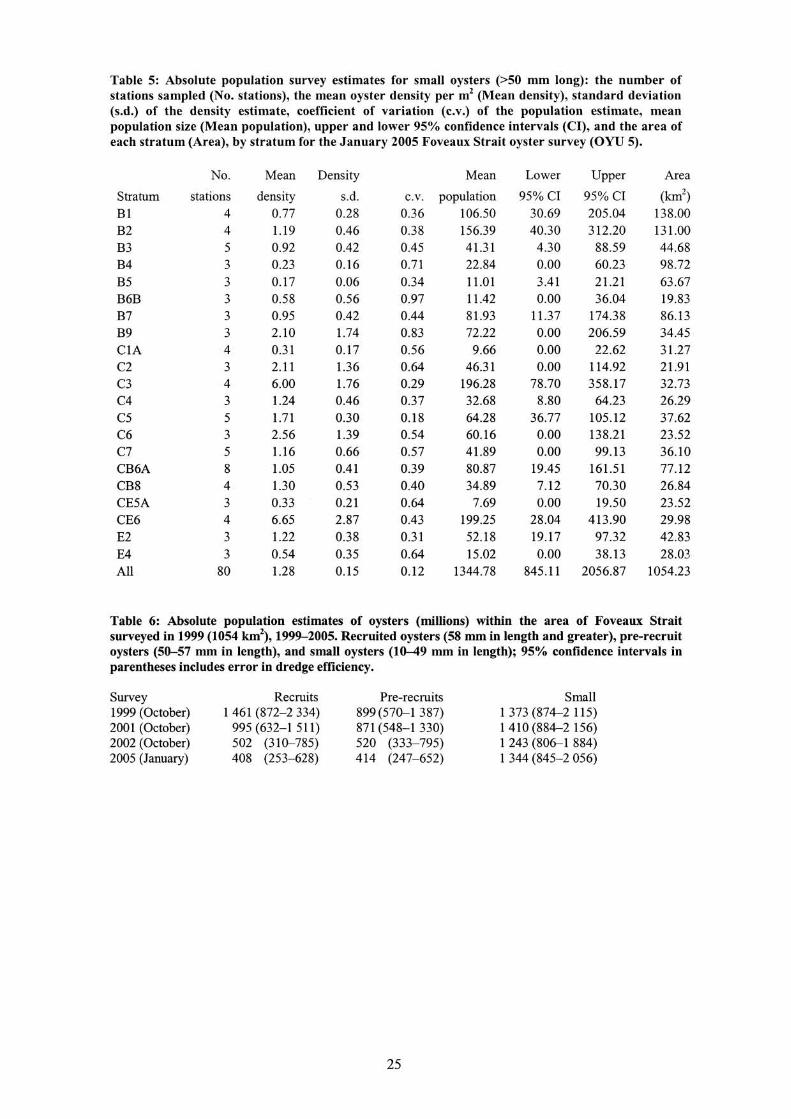
Table 5: Absolute population survey estimates for small oysters (>50 mm long): the number of stations sampled (No. stations), the mean oyster density per m2 (Mean density), standard deviation (s.d.) of the density estimate, coefficient of variation (c.v.) of the population estimate, mean population size (Mean population), upper and lower 95% confidence intervals (CI), and the area of each stratum (Area), by stratum for the January 2005 Foveaux Strait oyster survey (OYU 5).
No. Mean Density Mean Lower Upper Area
Stratum stations density s.d. c.v. population 95%CI 95% CI (km2)
B1 4 0.77 0.28 0.36 106.50 30.69 205.04 138.00 B2 4 1.19 0.46 0.38 156.39 40.30 312.20 131.00 B3 5 0.92 0.42 0.45 41.31 4.30 88.59 44.68 B4 3 0.23 0.16 0.71 22.84 0.00 60.23 98.72 B5 3 0.17 0.06 0.34 11.01 3.41 21.21 63.67 B6B 3 0.58 0.56 0.97 11.42 0.00 36.04 19.83 B7 3 0.95 0.42 0.44 81.93 11.37 174.38 86.13 B9 3 2.10 1.74 0.83 72.22 0.00 206.59 34.45 CIA 4 0.31 0.17 0.56 9.66 0.00 22.62 31.27 C2 3 2.11 1.36 0.64 46.31 0.00 114.92 21.91 C3 4 6.00 1.76 0.29 196.28 78.70 358.17 32.73 C4 3 1.24 0.46 0.37 32.68 8.80 64.23 26.29 C5 5 1.71 0.30 0.18 64.28 36.77 105.12 37.62 C6 3 2.56 1.39 0.54 60.16 0.00 138.21 23.52 C7 5 1.16 0.66 0.57 41.89 0.00 99.13 36.10 CB6A 8 1.05 0.41 0.39 80.87 19.45 161.51 77.12 CB8 4 1.30 0.53 0.40 34.89 7.12 70.30 26.84 CE5A 3 0.33 0.21 0.64 7.69 0.00 19.50 23.52 CE6 4 6.65 2.87 0.43 199.25 28.04 413.90 29.98 E2 3 1.22 0.38 0.31 52.18 19.17 97.32 42.83 E4 3 0.54 0.35 0.64 15.02 0.00 38.13 28.03 All 80 1.28 0.15 0.12 1344.78 845.11 2056.87 1054.23
Table 6: Absolute population estimates of oysters (millions) within the area of Foveaux Strait surveyed in 1999 (1054 km2), 1999-2005. Recruited oysters (58 mm in length and greater), pre-recruit oysters (50-57 mm in length), and small oysters (1~9 mm in length); 95% confidence intervals in parentheses includes error in dredge efficiency.
Survey Recruits Pre-recruits Small 1999 (October) 1 461 (872-2334) 899(570-1387) 1 373 (874-2 115) 2001 (October) 995 (632-1511) 871 (548-1330) 1410 (884-2 156) 2002 (October) 502 (310-785) 520 (333-795) 1 243 (806-1 884) 2005 (January) 408 (253-628) 414 (247-652) 1 344 (845-2 056)
25
1.5 • P S
en c .Q 1.0 .-E 0 0
2-m .0 E :::l z 0.5
1990
Recruits Pre-recruits Smalls
S
1995 2000 2005
Year
Figure 28: Population estimates for recruit, pre-recruit, and small oysters in the 1999 survey area from surveys 1990-2005. Data points are offset to represent month of sampling (January, March, and October).
4.7 Survey estimates of the commercial population size
Survey estimates of recruit-sized oysters in designated commercial fishery areas only are given in Table 7. Table 8 compares survey estimates for recruit-sized oysters in designated commercial fishery areas from population surveys 1999-2005. Oyster densities in designated commercial fishery areas ranged from 0.1-1.6 oysters per m2 (Table 7). The mean density over all designated commercial fishery areas was 0.4 oysters per m2, similar to exploratory and background areas.
Table 7: Commercial population survey estimates for recruited oysters (~ 58 mm long) in designated fishery areas: the number of stations sampled (No. stations), the mean oyster density per m2 (Mean density), standard deviation (s.d.) of the density estimate, coefficient of variation (c.v.) of the population estimate, mean population size (Mean population), upper and lower 95% confidence intervals (CI), and stratum area (Area), by stratum for the January 2005 Foveaux Strait oyster survey (OYU 5).
No. Mean Density Mean Lower Upper Area
Stratum stations density s.d. c.v. population 95% CI 95%CI (km2)
CIA 4 0.35 0.21 0.60 10.83 0.00 25.85 31.27
C2 3 0.24 0.01 0.06 5.23 3.53 7.81 21.91
C3 4 0.43 0.13 0.30 14.11 5.47 26.08 32 .73
C4 3 0.70 0.27 0.38 18.46 4.61 36.84 26.29
C5 5 0.42 0.11 0.26 15.80 7.02 28 .20 37.62
C6 3 0.58 0.29 0.50 13.62 0.47 30.40 23.52 C7 5 0.40 0.10 0.25 14.59 6.97 25 .73 36.10
CB6A 8 0.l9 0.07 0 .37 14.30 3 .77 28.28 77.12
CB8 4 0.31 0.l5 0.47 8.45 0.58 18.28 26.84
CE5A 3 0.11 0.06 0.57 2.51 0.00 5.90 23.52
CE6 4 1.57 0.42 0.27 46.93 20.88 83.23 29.98
All 46 0.45 0.05 0.12 164.83 103.42 252.34 366.89
26
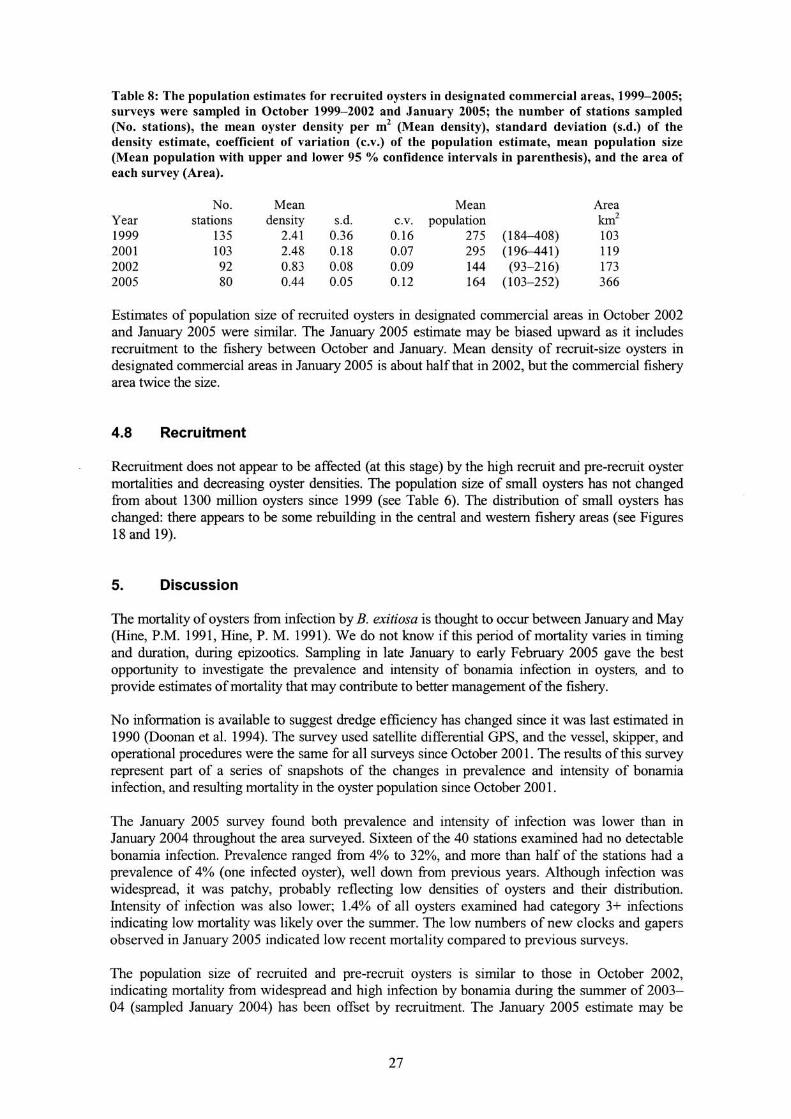
Table 8: The population estimates for recruited oysters in designated commercial areas, 1999-2005; surveys were sampled in October 1999-2002 and January 2005; the number of stations sampled (No. stations), the mean oyster density per m2 (Mean density), standard deviation (s.d.) of the density estimate, coefficient of variation (c.v.) of the population estimate, mean population size (Mean population with upper and lower 95 % confidence intervals in parenthesis), and the area of each survey (Area).
No. Mean Mean Area Year stations density s.d. c.v. population km2
1999 l35 2.41 0.36 0.16 275 (184--408) 103 2001 103 2.48 0.18 0.07 295 (196-441) 119 2002 92 0.83 0.08 0.09 144 (93-216) 173 2005 80 0.44 0.05 0.12 164 (103-252) 366
Estimates of population size of recruited oysters in designated commercial areas in October 2002 and January 2005 were similar. The January 2005 estimate may be biased upward as it includes recruitment to the fishery between October and January. Mean density of recruit-size oysters in designated commercial areas in January 2005 is about half that in 2002, but the commercial fishery area twice the size.
4.8 Recruitment
Recruitment does not appear to be affected (at this stage) by the high recruit and pre-recruit oyster mortalities and decreasing oyster densities. The population size of small oysters has not changed from about 1300 million oysters since 1999 (see Table 6). The distribution of small oysters has changed: there appears to be some rebuilding in the central and western fishery areas (see Figures 18 and 19).
5. Discussion
The mortality of oysters from infection by B. exitiosa is thought to occur between January and May (Hine, P.M. 1991, Hine, P. M. 1991). We do not mow if this period ofrnortality varies in timing and duration, during epizootics. Sampling in late January to early February 2005 gave the best opportunity to investigate the prevalence and intensity of bonamia infection in oysters, and to provide estimates of mortality that may contribute to better management of the fishery.
No information is available to suggest dredge efficiency has changed since it was last estimated in 1990 (Doonan et al. 1994). The survey used satellite differential GPS, and the vessel, skipper, and operational procedures were the same for all surveys since October 2001. The results of this survey represent part of a series of snapshots of the changes in prevalence and intensity of bonamia infection, and resulting mortality in the oyster population since October 2001.
The January 2005 survey found both prevalence and intensity of infection was lower than in January 2004 throughout the area surveyed. Sixteen of the 40 stations examined had no detectable bonamia infection. Prevalence ranged from 4% to 32%, and more than half of the stations had a prevalence of 4% (one infected oyster), well down from previous years. Although infection was widespread, it was patchy, probably reflecting low densities of oysters and their distribution. Intensity of infection was also lower; 1.4% of all oysters examined had category 3+ infections indicating low mortality was likely over the summer. The low numbers of new clocks and gapers observed in January 2005 indicated low recent mortality compared to previous surveys.
The population size of recruited and pre-recruit oysters is similar to those in October 2002, indicating mortality from widespread and high infection by bonamia during the summer of 2003-04 (sampled January 2004) has been offset by recruitment. The January 2005 estimate may be
27
biased upward as it includes recruitment to the fishery over part of the growing period between October and January. Since 1999, pre-recruits have declined in similar proportions to recruited oysters, suggesting that this size group may be as vulnerable to bonamia mortality as recruit-size oysters.
Commercial fishery areas, particularly north and west ofRuapuke Island, had the highest densities of recruit, pre-recruit, and small oysters (represented by strata CE6, C3, C6, and C4). There was no change in the population size of recruited oysters in designated commercial areas between October 2002 and January 2005. Mean density of recruit-size oysters in designated commercial areas is about halfthat in 2002, but the commercial fishery area twice the size. Mean density over all strata was 0.4 oysters per m2, similar to the mean in all commercial strata, indicating oyster density had been reduced to a low background level.
Recruitment does not appear to be affected (at this stage) by the high recruit and pre-recruit oyster mortalities and decreasing oyster densities. The population size of small oysters has not changed since 1999. Although there is no evidence of a stock recruit relationship, low oyster densities may have an impact on recruitment processes, both in terms of larval production and limiting surfaces for larval settlement and survival.
6. ACKNOWLEDGMENTS
We thank Brian Hawke and his crew, Jim Foggo, Steve Hawke, and Alex Mullinder, for the long days at sea. Also Mike Tait, John Illingworth, and Dean Stotter, who processed oyster samples at Greta Point, and John Booth for his helpful comments on this report. This
-investigation was funded by the Ministry of Fisheries under Project OYS2004/01, objective 1.
7. REFERENCES
Annala, J.H.; Sullivan, K.J.; O'Brien, c.J.; Smith, N.W.M.; Varian, S.J.A. (comps.) (2002). Report from the Fishery Assessment Plenary, May 2002: stock assessments and yield estimates. 639 p. Ministry of Fisheries. (Unpublished report held in NIW A library, Wellington. )
Cranfield, H.J.; Doonan, I.J.; Michael, K.P. (1991). Assessment of the effects of mortality due to Bonamia sp. on the oyster population of Foveaux Strait in 1990 and the outlook for management in 1991. New Zealand Fisheries Assessment Research Document 91118. 24 p. (Unpublished report held in the NIW A library, Wellington.)
Cranfield, H.J.; Michael, K.P.; Doonan, I.J. (1998). Dredge survey of Foveaux Strait oysters, 1997. NIWA Technical Report 45. 18 p.
Diggles, B.K.; Hine, P.M. (2002). Bonamia exitiosus epidemiology in Foveaux Strait oysters. NIW A Final Research Report to the Ministry of Fisheries Project No. OYS1999/01A1other services. 52 p. (Unpublished report held by the Ministry of Fisheries, Wellington.)
Diggles, B.K.; Cochennec-Laureau, N.; Hine, P.M. (2003). Comparison of diagnostic techniques for Bonamia exitiosus from flat oysters Ostrea chilensis in New Zealand. Aquaculture 220: 145-156.
Diggles, B.K. (2004). Survey of dredge oysters (Ostrea chilensis) from Foveaux Strait from Bonamiosis, oyster condition, and other concurrent infections. DigsFish Pathology Services Report: DF04-11. 15 p.
28
Doonan, 1.J.; Cranfield, H.J.; Michael, K.P. (1994). Catastrophic reduction of the oyster, Tiostrea chilensis (Bivalvia: Ostreidae), in Foveaux Strait, New Zealand, due to infestation by the protistan Bonamia sp. New Zealand Journal of Marine and Freshwater Research 28: 335-344.
Dunn, A.; Michael, K.P.; Hine, P.M.; Andrew, N.L.; Diggles, B.K.; Cranfield, H.J. (2000). Analysis of a survey of the prevalence and intensity of Bonamia sp. in Foveaux Strait oysters. New Zealand Fisheries Assessment Report 2000132. 28p.
Dunn, A.; Michael, K.P.; Diggles, B.K. (2002). Updated estimates ofthe commercial population size, yields, and estimates of intensity and prevalence of infection by Bonamia exitiosus in Foveaux Strait oysters for selected sites in Foveaux Strait in March 2002. Final Research Report for Ministry of Fisheries, Research Project MOF2001l03L. 20 p. (Unpublished report held by MFish, Wellington.)
Dunn, A. (2005). Stock assessment of Foveaux Strait dredge oysters (Ostrea chilensis) for the 2003-04 fishing year. New Zealand Fisheries Assessment Report 2005125. 63 p.
Hine, P.M. (1991). The annual pattern of infection by Bonamia sp. in the New Zealand flat oyster Tiostrea chilensis. Diseases of Aquatic Organisms 93. 241-251.
Hine, P.M. (1991). Ultrastructural observations on the annual infection pattern of Bonamia sp. in flat oysters Tiostrea chilensis. Diseases of Aquatic Organisims 11. 163-171.
Jolly, G .M.; Hampton, 1. (1990). A stratified random transect design for acoustic surveys of fish stocks. Canadian Journal of Fisheries and Aquatic Sciences 47. 1282-1291.
Michael, K.P.; Dunn, A.; Andrew. N. L.; Breen, P.A. (2001). Foveaux Strait dredge oyster (Tiostrea chilensis) stock assessment, 1999. New Zealand Fisheries Assessment Report 2001138.42 p.
Michael, K.P.; Dunn, A.; Diggles, B.K.; Forman, J. (2004a). Foveaux Strait dredge oyster (Ostrea chilensis) population and bonamia surveys, October 2002. New Zealand Fisheries Assessment Report 2004114. 22 p.
Michael, K.P.; Dunn, A.; Diggles, B.K.; Parsons, M. (2004b). Foveaux Strait dredge oyster (Ostrea chilensis) stock assessment: population and bonamia surveys October 2001, January and March 2002, and yields for the 2002 oyster season. New Zealand Fisheries Assessment Report 2004113. 18 p.
Michael, K.P.; Dunn, A. (2005). Foveaux Strait dredge oyster (Ostrea chilensis) OYU 5 Strategic Research Plan. 41 p. (Unpublished report held by NIW A, Wellington.)
Michael, K.P.; Dunn, A.; Forman, J. (2005). A survey of Bonamia exitiosa infection in Foveaux Strait dredge oysters (Ostrea chilensis), oyster density and recruitment, January 2004. 31 p. (Unpublished report held by the Ministry of Fisheries, Wellington.)
29
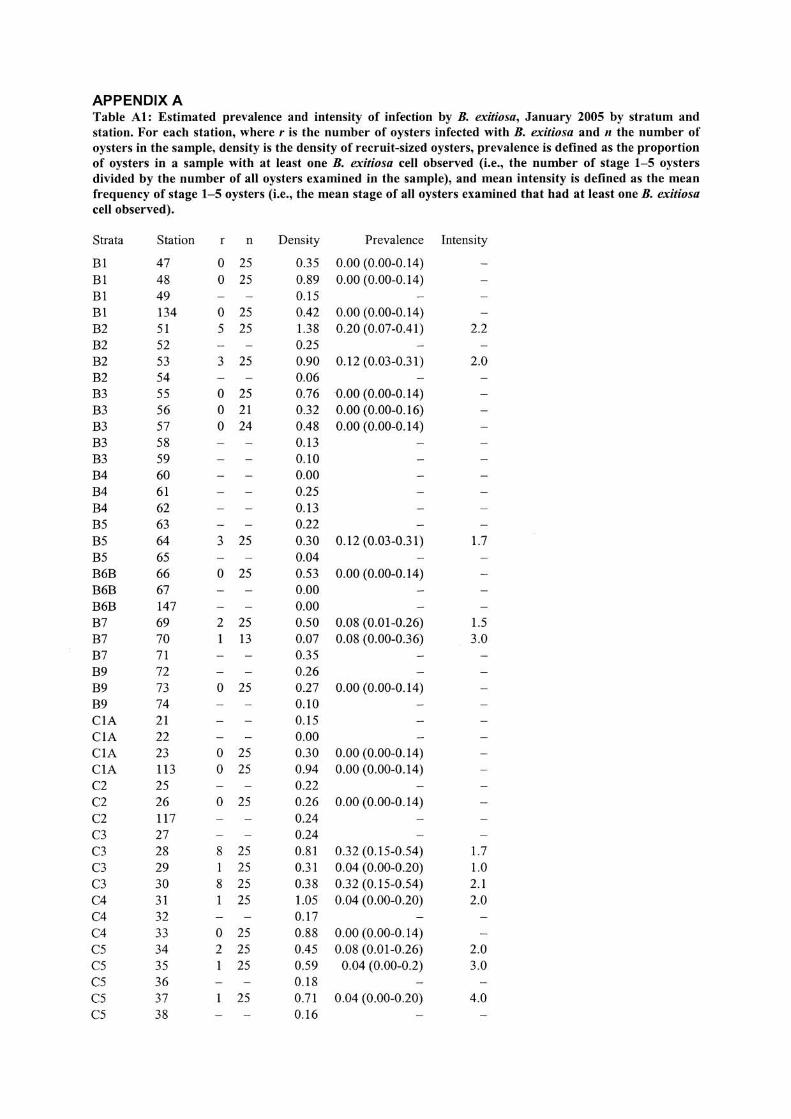
APPENDIX A Table A1: Estimated prevalence and intensity of infection by B. exitiosa, January 2005 by stratum and station. For each station, where r is the number of oysters infected with B. exitiosa and /l the number of oysters in the sample, density is the density of recruit-sized oysters, prevalence is defined as the proportion of oysters in a sample with at least one B. exitiosa cell observed (i.e., the number of stage 1-5 oysters divided by the number of all oysters examined in the sample), and mean intensity is defined as the mean frequency of stage 1-5 oysters (i.e., the mean stage of all oysters examined that had at least one B. exitiosa cell observed).
Strata Station r n Density Prevalence Intensity
Bl 47 0 25 0.35 0.00 (0.00-0.14) Bl 48 0 25 0.89 0.00 (0.00-0.14) B1 49 0.15 B1 134 0 25 0.42 0.00 (0.00-0.14) B2 51 5 25 1.38 0.20 (0.07-0.41) 2.2 B2 52 0.25 B2 53 3 25 0.90 0.12 (0.03-0.31) 2.0 B2 54 0.06 B3 55 0 25 0.76 0.00 (0.00-0.14) B3 56 0 21 0.32 0.00 (0.00-0.16) B3 57 0 24 0.48 0.00 (0.00-0.14) B3 58 0.13 B3 59 0.10 B4 60 0.00 B4 61 0.25 B4 62 0.13 B5 63 0.22 B5 64 3 25 0.30 0.12 (0.03-0.31) 1.7 B5 65 0.04 B6B 66 0 25 0.53 0.00 (0.00-0.14) B6B 67 0.00 B6B 147 0.00 B7 69 2 25 0.50 0.08 (0.01-0.26) 1.5 B7 70 13 0.07 0.08 (0.00-0.36) 3.0 B7 71 0.35 B9 72 0.26 B9 73 0 25 0.27 0.00 (0.00-0.14) B9 74 0.10 CIA 21 0.15 CIA 22 0.00 CIA 23 0 25 0.30 0.00 (0.00-0.14) CIA 113 0 25 0.94 0.00 (0.00-0.14) C2 25 0.22 C2 26 0 25 0.26 0.00 (0.00-0.14) C2 117 0.24 C3 27 0.24 C3 28 8 25 0.81 0.32 (0.15-0.54) 1.7 C3 29 1 25 0.31 0.04 (0.00-0.20) 1.0 C3 30 8 25 0.38 0.32 (0.15-0.54) 2.1 C4 31 25 1.05 0.04 (0.00-0.20) 2.0 C4 32 0.17 C4 33 0 25 0.88 0.00 (0.00-0.14) C5 34 2 25 0.45 0.08 (0.01-0.26) 2.0 C5 35 25 0.59 0.04 (0.00-0.2) 3.0 C5 36 0.18 C5 37 25 0.71 0.04 (0.00-0.20) 4.0 C5 38 0.16
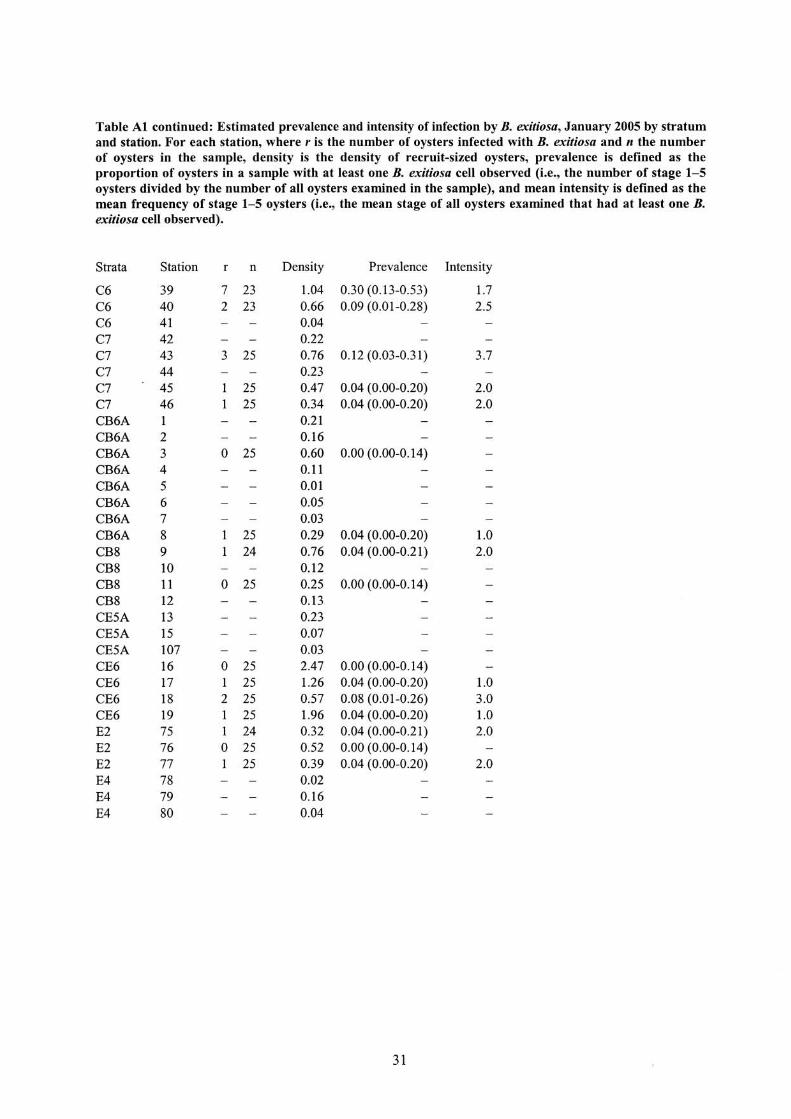
Table Al continued: Estimated prevalence and intensity of infection by B. exitiosa, January 2005 by stratum and station. For each station, where r is the number of oysters infected with B. exitiosa and n the number of oysters in the sample, density is the density of recruit-sized oysters, prevalence is defined as the proportion of oysters in a sample with at least one B. exitiosa cell observed (i.e., the number of stage 1-5 oysters divided by the number of all oysters examined in the sample), and mean intensity is defined as the mean frequency of stage 1-5 oysters (i.e., the mean stage of all oysters examined that had at least one B. exitiosa cell observed).
Strata Station r n Density Prevalence Intensity
C6 39 7 23 1.04 0.30 (0.13-0.53) 1.7 C6 40 2 23 0.66 0.09 (0.01-0.28) 2.5 C6 41 0.04 C7 42 0.22 C7 43 3 25 0.76 0.12 (0.03-0.31) 3.7 C7 44 0.23 C7 45 25 0.47 0.04 (0.00-0.20) 2.0 C7 46 25 0.34 0.04 (0.00-0.20) 2.0 CB6A 1 0.21 CB6A 2 0.16 CB6A 3 0 25 0.60 0.00 (0.00-0.14) CB6A 4 0.11 CB6A 5 0.01 CB6A 6 0.05 CB6A 7 0.03 CB6A 8 25 0.29 0.04 (0.00-0.20) 1.0 CB8 9 1 24 0.76 0.04 (0.00-0.21) 2.0 CB8 10 0.12 CB8 11 0 25 0.25 0.00 (0.00-0.14) CB8 12 0.13 CE5A 13 0.23 CE5A 15 0.07 CE5A 107 0.03 CE6 16 0 25 2.47 0.00 (0.00-0.14) CE6 17 1 25 1.26 0.04 (0.00-0.20) 1.0 CE6 18 2 25 0.57 0.08 (0.01-0.26) 3.0 CE6 19 25 1.96 0.04 (0.00-0.20) 1.0 E2 75 1 24 0.32 0.04 (0.00-0.21) 2.0 E2 76 0 25 0.52 0.00 (0.00-0.14) E2 77 25 0.39 0.04 (0.00-0.20) 2.0 E4 78 0.02 E4 79 0.16 E4 80 0.04
31