A Study of U P - EPW
11
Changes in Cropping Pattern A Study of U P Shyam S Bhatia Between 1950 and 1961 there have been considerable changes in the cropping pattern in Uttar Pradesh. These changes, however, arc. not manifest when data at the State level are considered. Obviously, changes in the cropping pattern have to be studied at least at the district level in order to understand their nature and to bring out the regional distribution of such changes within the State. In UP the cropping patterns in different parts of the State have undergone change in varying degrees. Generally speaking, western UP is more dynamic than the eastern part where some districts, like Azamgarh and Basil, seem almost to resist change. There also appears to have been some regional redistribution of crops. There are indications that the density of some crops is increasing in areas where it was already high, hi other words, there appears to be a tendency towards geographical concentration of crops. This process of concentration has been slow during the period under study, but it is definitely discernible. Further studies are needed to understand the implications of the process. IN the First and Second Finns considerable emphasis was laid on agricultural development in Uttar Pradesh. It is the purpose of this paper to make a preliminary re purl on changes in cropping pattern during the decade between 1950-51 and 1960-61. Here cropping patterns at district level have been compared at two points of time, namely, 1950.51 and 1960-61. The cropping pattern in 1950-51 is taken to represent condi- tions prevailing in the area prior to the introduction of the development plans and the cropping pattern" in 1960-61 presents conditions approxima- tely at the end of the Second Plan. As data are not available for .he northern districts of Garhwal, Tehri Garhwal, Almora and Nainital, this study is confined to the remaining 47 districts of the State. References to the State as a whole in the context of this paper imply these 47 districts taken together. Further, the study is based on a consideration of the pro. portion of cropland under seven cereals (rice, wheat, barley, jowar, bajra, ragi and maize), other small mil- lets, gram, other pulses (excluding gram), sugar-cane, total oilseeds, cotton, and fodder crops. These crops accounted for 97.2 per cent of the total cropped area in 1950-51 and 96.8 per cent of the total cropped area in 1960-61, Changes in the cropping pattern refered to in this paper mean changes in the proportion of cropland devoted to various crops. Change is measured here by taking percentage point differ- ence between the 1950-51 and 1960-61 proportions of cropland under each crop. For example, if in any district, wheat occupied 22 per cent of cropland in 1950-51 and 24 per cent of crop- land in 1960-61, change is taken to be an increase of 2 per cent as the crop has improved its relative strength in the cropping pattern by 2 per cent. Change in State as a Whole A comparison of the proportion of cropland devoted to different crops : n 1950-51 and 1960.61 showed that in Uttar Pradesh as a whole, the changes in cropping pattern were small (Tabic 1). In 1950-51, foodgrains occupied 86.1 per cent of the total cropped area while in 1960-61 they occupied 84.8 per cent. Cereals and millets occupied 63.1 per cent of cropland in 1950-51 and 0.2 per cent less in 1960-61. Total pulses declined by 1.1 per cent during the decade. Further, the proportion of wheal in- creased by 1.6 per cent while that of barley decreased by 1.5 per cent. Maize gained by 0.6 per cent and jowar declined by the same amount while gram decreased by 0.7 per cent. Among the non-foodgrains, sugar-cane increased by one per cent while oil- seeds gained by 0.3 per cent. Cotton which has been progressively declining since 1930-11, showed an improvement by one tenth of a per cent during the decade under consideration. Taking the increase and decrease in the pro- portion of cropland devoted to the above noted crops, it appears that only about 4.0 per cent of the total cropped area was involved in crop pattern changes during the decade. Foodgrains Though the proportion of foodgrains has declined by 1.3 per cent in the State, interesting regional and inter- district variations can be observed. Whereas in 1950-51, only 8 districts (mostly western) had less than 80 per cent of cropped area under foodgrains, the number of such districts increased to 12 a decade later. In two districts, Muzaffarnagar and Meerut, foodgrains declined to 54.4 and 57.5 per cent of cropland respectively in 1960.61, On the contrary, there were 12 districts in 1950-51 with more than 90 per cent of total cropped area under foodgrains, and the number of such districts in- creased to 15 in 1960-61. Further, it appears that the districts that already had a comparatively low proportion of cropland under foodgrains in 1950-51 declined still more as in the case of Meerut and Muzaffarnagar. On the other hand, some districts Table I: Change in Cropping Pattern in Uttar Pradesh (Area under different crops as per cent of total cropped area) I
Transcript of A Study of U P - EPW
Changes in Cropping Pattern A Study of U P
Shyam S Bhatia
Between 1950 and 1961 there have been considerable changes in the cropping pattern in Uttar Pradesh. These changes, however, arc. not manifest when data at the State level are considered. Obviously, changes in the cropping pattern have to be studied at least at the district level in order to understand their nature and to bring out the regional distribution of such changes within the State.
In UP the cropping patterns in different parts of the State have undergone change in varying degrees. Generally speaking, western UP is more dynamic than the eastern part where some districts, like Azamgarh and Basil, seem almost to resist change.
There also appears to have been some regional redistribution of crops. There are indications that the density of some crops is increasing in areas where it was already high, hi other words, there appears to be a tendency towards geographical concentration of crops. This process of concentration has been slow during the period under study, but it is definitely discernible. Further studies are needed to understand the implications of the process.
IN the First and Second Finns considerable emphasis was laid
on agricultural development in Uttar Pradesh. It is the purpose of this paper to make a preliminary re purl on changes in cropping pattern during the decade between 1950-51 and 1960-61. Here cropping patterns at district level have been compared at two points of time, namely, 1950.51 and 1960-61. The cropping pattern in 1950-51 is taken to represent conditions prevailing in the area prior to the introduction of the development plans and the cropping pattern" in 1960-61 presents conditions approximately at the end of the Second Plan.
As data are not available for .he northern districts of Garhwal, Tehri Garhwal, Almora and Nainital, this study is confined to the remaining 47 districts of the State. References to the State as a whole in the context of this paper imply these 47 districts taken together. Further, the study is based on a consideration of the pro. portion of cropland under seven cereals (rice, wheat, barley, jowar, bajra, ragi and maize), other small millets, gram, other pulses (excluding gram), sugar-cane, total oilseeds, cotton, and fodder crops. These crops accounted for 97.2 per cent of the total cropped area in 1950-51 and 96.8 per cent of the total cropped area in 1960-61,
Changes in the cropping pattern refered to in this paper mean changes in the proportion of cropland devoted to various crops. Change is measured here by taking percentage point difference between the 1950-51 and 1960-61 proportions of cropland under each crop. For example, if in any district, wheat occupied 22 per cent of cropland in 1950-51 and 24 per cent of cropland in 1960-61, change is taken to be an increase of 2 per cent as the crop
has improved its relative strength in the cropping pattern by 2 per cent.
Change in State as a Whole
A comparison of the proportion of cropland devoted to different crops :n 1950-51 and 1960.61 showed that in Uttar Pradesh as a whole, the changes in cropping pattern were small (Tabic 1). In 1950-51, foodgrains occupied 86.1 per cent of the total cropped area while in 1960-61 they occupied 84.8 per cent. Cereals and millets occupied 63.1 per cent of cropland in 1950-51 and 0.2 per cent less in 1960-61. Total pulses declined by 1.1 per cent during the decade.
Further, the proportion of wheal increased by 1.6 per cent while that of barley decreased by 1.5 per cent. Maize gained by 0.6 per cent and jowar declined by the same amount while gram decreased by 0.7 per cent. Among the non-foodgrains, sugar-cane increased by one per cent while oilseeds gained by 0.3 per cent. Cotton which has been progressively declining since 1930-11, showed an improvement by one tenth of a per cent during the decade under consideration. Taking the increase and decrease in the proportion of cropland devoted to the above noted crops, it appears that only about 4.0 per cent of the total cropped area was involved in crop pattern changes during the decade.
Foodgrains
Though the proportion of foodgrains has declined by 1.3 per cent in the State, interesting regional and inter-district variations can be observed. Whereas in 1950-51, only 8 districts (mostly western) had less than 80 per cent of cropped area under foodgrains, the number of such districts increased to 12 a decade later. In two districts, Muzaffarnagar and Meerut, foodgrains declined to 54.4 and 57.5 per cent of
cropland respectively in 1960.61, On the contrary, there were 12 districts in 1950-51 with more than 90 per cent of total cropped area under foodgrains, and the number of such districts increased to 15 in 1960-61.
Further, it appears that the districts that already had a comparatively low proportion of cropland under foodgrains in 1950-51 declined still more as in the case of Meerut and Muzaffarnagar. On the other hand, some districts
Table I : Change in Cropping Pattern in Uttar Pradesh
(Area under different crops as per cent of total cropped area)
I
August 21, 1965 T H E E C O N O M I C W E E K L Y
which had a rather high proportion of foodgrains in 1950-51, have gained further as in the case of Jalaun, Jhansi, Hamirpur and Mirzapur where the acreage under foodgrains increased under the impact of increased irrigation.
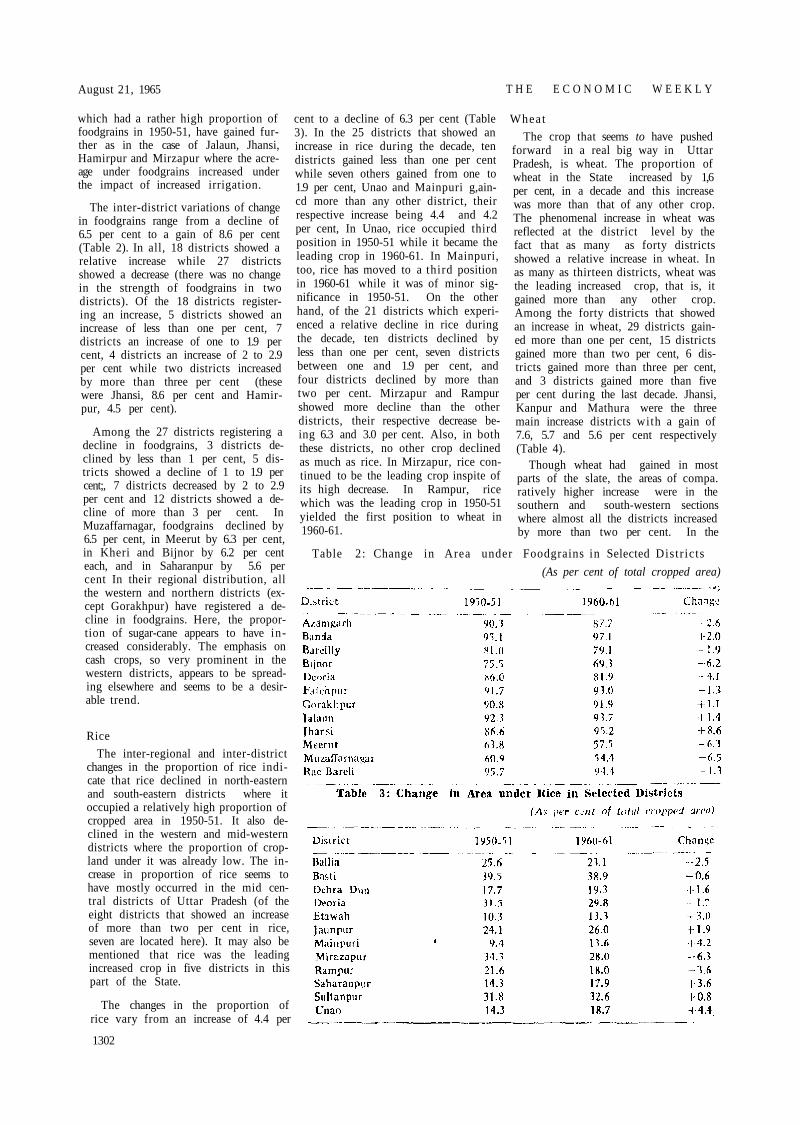
The inter-district variations of change in foodgrains range from a decline of 6.5 per cent to a gain of 8.6 per cent (Table 2). In all, 18 districts showed a relative increase while 27 districts showed a decrease (there was no change in the strength of foodgrains in two districts). Of the 18 districts registering an increase, 5 districts showed an increase of less than one per cent, 7 districts an increase of one to 1.9 per cent, 4 districts an increase of 2 to 2.9 per cent while two districts increased by more than three per cent (these were Jhansi, 8.6 per cent and Hamirpur, 4.5 per cent).
Among the 27 districts registering a decline in foodgrains, 3 districts declined by less than 1 per cent, 5 districts showed a decline of 1 to 1.9 per cent;, 7 districts decreased by 2 to 2.9 per cent and 12 districts showed a decline of more than 3 per cent. In Muzaffarnagar, foodgrains declined by 6.5 per cent, in Meerut by 6.3 per cent, in Kheri and Bijnor by 6.2 per cent each, and in Saharanpur by 5.6 per cent In their regional distribution, all the western and northern districts (except Gorakhpur) have registered a decline in foodgrains. Here, the proportion of sugar-cane appears to have increased considerably. The emphasis on cash crops, so very prominent in the western districts, appears to be spreading elsewhere and seems to be a desirable trend.
Rice
The inter-regional and inter-district changes in the proportion of rice indicate that rice declined in north-eastern and south-eastern districts where it occupied a relatively high proportion of cropped area in 1950-51. It also declined in the western and mid-western districts where the proportion of cropland under it was already low. The increase in proportion of rice seems to have mostly occurred in the mid central districts of Uttar Pradesh (of the eight districts that showed an increase of more than two per cent in rice, seven are located here). It may also be mentioned that rice was the leading increased crop in five districts in this part of the State.
The changes in the proportion of rice vary from an increase of 4.4 per
cent to a decline of 6.3 per cent (Table 3). In the 25 districts that showed an increase in rice during the decade, ten districts gained less than one per cent while seven others gained from one to 1.9 per cent, Unao and Mainpuri g,ain-cd more than any other district, their respective increase being 4.4 and 4.2 per cent, In Unao, rice occupied third position in 1950-51 while it became the leading crop in 1960-61. In Mainpuri, too, rice has moved to a third position in 1960-61 while it was of minor significance in 1950-51. On the other hand, of the 21 districts which experienced a relative decline in rice during the decade, ten districts declined by less than one per cent, seven districts between one and 1.9 per cent, and four districts declined by more than two per cent. Mirzapur and Rampur showed more decline than the other districts, their respective decrease being 6.3 and 3.0 per cent. Also, in both these districts, no other crop declined as much as rice. In Mirzapur, rice continued to be the leading crop inspite of its high decrease. In Rampur, rice which was the leading crop in 1950-51 yielded the first position to wheat in 1960-61.
Wheat
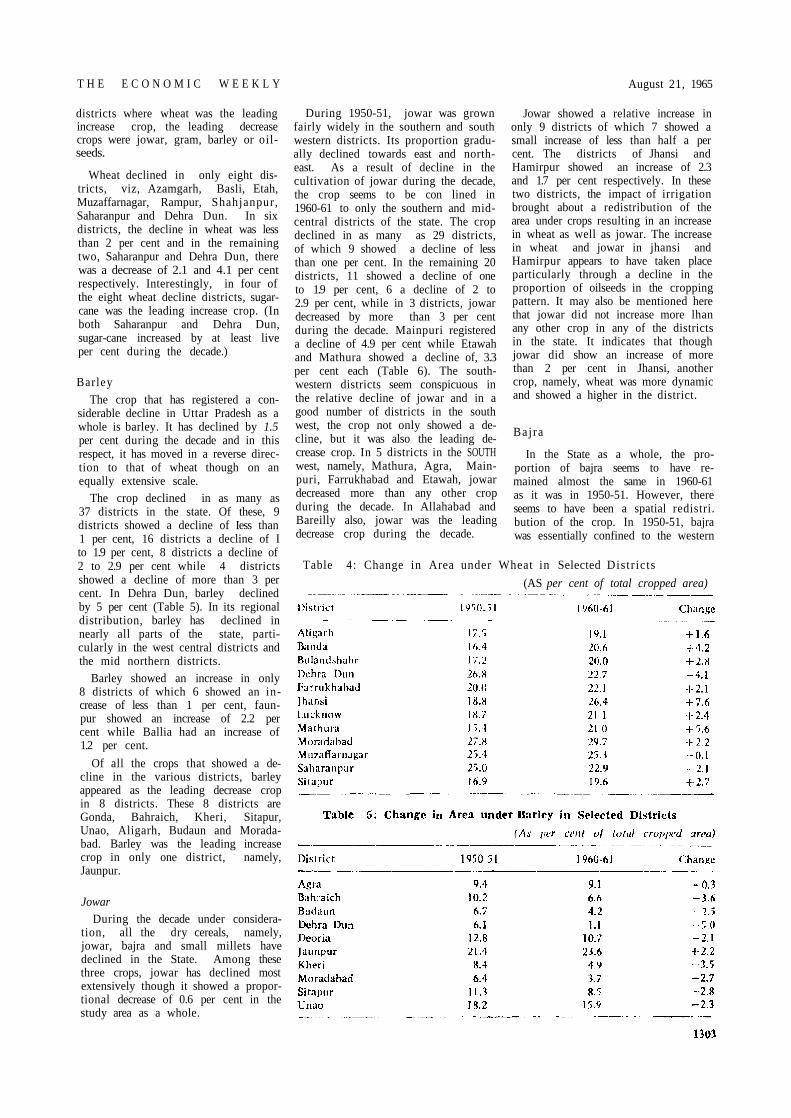
The crop that seems to have pushed forward in a real big way in Uttar Pradesh, is wheat. The proportion of wheat in the State increased by 1,6 per cent, in a decade and this increase was more than that of any other crop. The phenomenal increase in wheat was reflected at the district level by the fact that as many as forty districts showed a relative increase in wheat. In as many as thirteen districts, wheat was the leading increased crop, that is, it gained more than any other crop. Among the forty districts that showed an increase in wheat, 29 districts gained more than one per cent, 15 districts gained more than two per cent, 6 districts gained more than three per cent, and 3 districts gained more than five per cent during the last decade. Jhansi, Kanpur and Mathura were the three main increase districts with a gain of 7.6, 5.7 and 5.6 per cent respectively (Table 4).
Though wheat had gained in most parts of the slate, the areas of compa. ratively higher increase were in the southern and south-western sections where almost all the districts increased by more than two per cent. In the
Table 2: Change in Area under Foodgrains in Selected Distr icts
(As per cent of total cropped area)
1302
T H E E C O N O M I C W E E K L Y August 21, 1965
districts where wheat was the leading increase crop, the leading decrease crops were jowar, gram, barley or oilseeds.
Wheat declined in only eight districts, viz, Azamgarh, Basli, Etah, Muzaffarnagar, Rampur, Shahjanpur, Saharanpur and Dehra Dun. In six districts, the decline in wheat was less than 2 per cent and in the remaining two, Saharanpur and Dehra Dun, there was a decrease of 2.1 and 4.1 per cent respectively. Interestingly, in four of the eight wheat decline districts, sugarcane was the leading increase crop. (In both Saharanpur and Dehra Dun, sugar-cane increased by at least live per cent during the decade.)
Barley
The crop that has registered a considerable decline in Uttar Pradesh as a whole is barley. It has declined by 1.5 per cent during the decade and in this respect, it has moved in a reverse direction to that of wheat though on an equally extensive scale.
The crop declined in as many as 37 districts in the state. Of these, 9 districts showed a decline of Iess than 1 per cent, 16 districts a decline of I to 1.9 per cent, 8 districts a decline of 2 to 2.9 per cent while 4 districts showed a decline of more than 3 per cent. In Dehra Dun, barley declined by 5 per cent (Table 5). In its regional distribution, barley has declined in nearly all parts of the state, particularly in the west central districts and the mid northern districts.
Barley showed an increase in only 8 districts of which 6 showed an increase of less than 1 per cent, faun-pur showed an increase of 2.2 per cent while Ballia had an increase of 1.2 per cent.
Of all the crops that showed a decline in the various districts, barley appeared as the leading decrease crop in 8 districts. These 8 districts are Gonda, Bahraich, Kheri, Sitapur, Unao, Aligarh, Budaun and Morada-bad. Barley was the leading increase crop in only one district, namely, Jaunpur.
Jowar
During the decade under consideration, all the dry cereals, namely, jowar, bajra and small millets have declined in the State. Among these three crops, jowar has declined most extensively though it showed a proportional decrease of 0.6 per cent in the study area as a whole.
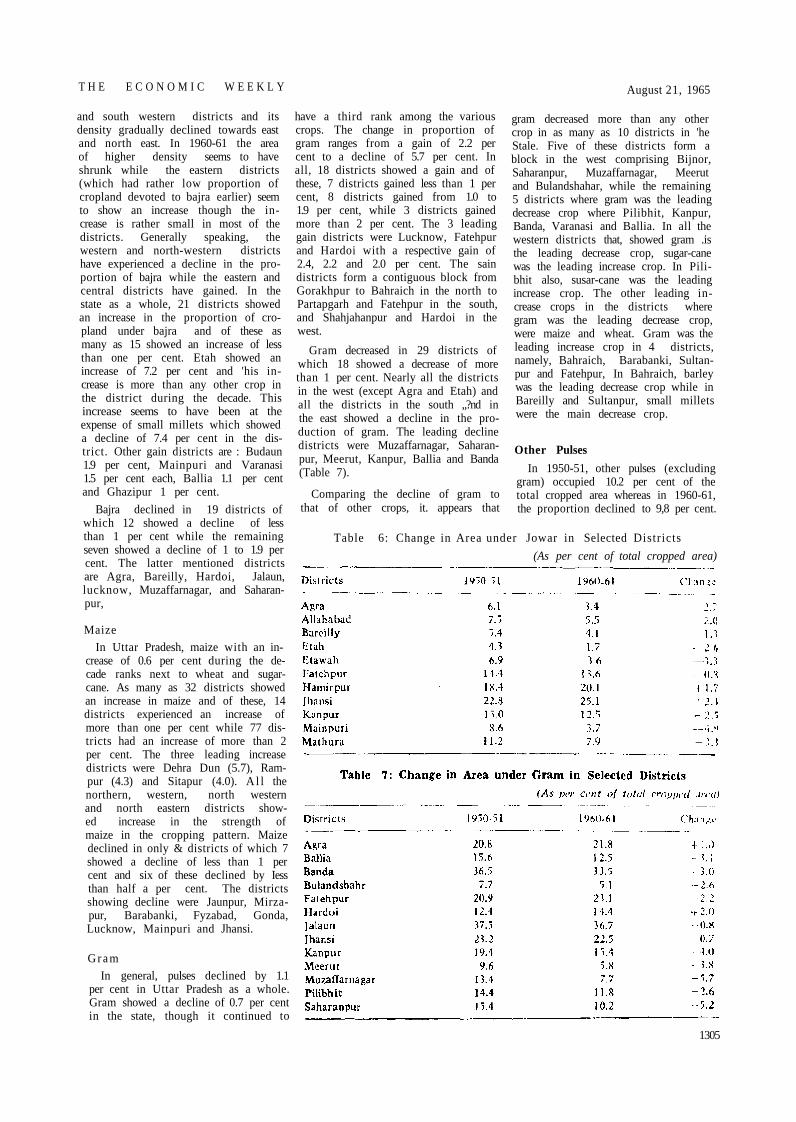
During 1950-51, jowar was grown fairly widely in the southern and south western districts. Its proportion gradually declined towards east and northeast. As a result of decline in the cultivation of jowar during the decade, the crop seems to be con lined in 1960-61 to only the southern and mid-central districts of the state. The crop declined in as many as 29 districts, of which 9 showed a decline of less than one per cent. In the remaining 20 districts, 11 showed a decline of one to 1.9 per cent, 6 a decline of 2 to 2.9 per cent, while in 3 districts, jowar decreased by more than 3 per cent during the decade. Mainpuri registered a decline of 4.9 per cent while Etawah and Mathura showed a decline of, 3.3 per cent each (Table 6). The southwestern districts seem conspicuous in the relative decline of jowar and in a good number of districts in the south west, the crop not only showed a decline, but it was also the leading decrease crop. In 5 districts in the SOUTH west, namely, Mathura, Agra, Mainpuri, Farrukhabad and Etawah, jowar decreased more than any other crop during the decade. In Allahabad and Bareilly also, jowar was the leading decrease crop during the decade.
Jowar showed a relative increase in only 9 districts of which 7 showed a small increase of less than half a per cent. The districts of Jhansi and Hamirpur showed an increase of 2.3 and 1.7 per cent respectively. In these two districts, the impact of irrigation brought about a redistribution of the area under crops resulting in an increase in wheat as well as jowar. The increase in wheat and jowar in jhansi and Hamirpur appears to have taken place particularly through a decline in the proportion of oilseeds in the cropping pattern. It may also be mentioned here that jowar did not increase more lhan any other crop in any of the districts in the state. It indicates that though jowar did show an increase of more than 2 per cent in Jhansi, another crop, namely, wheat was more dynamic and showed a higher in the district.
Bajra
In the State as a whole, the proportion of bajra seems to have remained almost the same in 1960-61 as it was in 1950-51. However, there seems to have been a spatial redistri. bution of the crop. In 1950-51, bajra was essentially confined to the western
Table 4: Change in Area under Wheat in Selected Distr icts
(AS per cent of total cropped area)
T H E E C O N O M I C W E E K L Y August 21, 1965
and south western districts and its density gradually declined towards east and north east. In 1960-61 the area of higher density seems to have shrunk while the eastern districts (which had rather low proportion of cropland devoted to bajra earlier) seem to show an increase though the increase is rather small in most of the districts. Generally speaking, the western and north-western districts have experienced a decline in the proportion of bajra while the eastern and central districts have gained. In the state as a whole, 21 districts showed an increase in the proportion of cropland under bajra and of these as many as 15 showed an increase of less than one per cent. Etah showed an increase of 7.2 per cent and 'his increase is more than any other crop in the district during the decade. This increase seems to have been at the expense of small millets which showed a decline of 7.4 per cent in the district. Other gain districts are : Budaun 1.9 per cent, Mainpuri and Varanasi 1.5 per cent each, Ballia 1.1 per cent and Ghazipur 1 per cent.
Bajra declined in 19 districts of which 12 showed a decline of less than 1 per cent while the remaining seven showed a decline of 1 to 1.9 per cent. The latter mentioned districts are Agra, Bareilly, Hardoi, Jalaun, lucknow, Muzaffarnagar, and Saharan-pur,
Maize
In Uttar Pradesh, maize with an increase of 0.6 per cent during the decade ranks next to wheat and sugarcane. As many as 32 districts showed an increase in maize and of these, 14 districts experienced an increase of more than one per cent while 77 districts had an increase of more than 2 per cent. The three leading increase districts were Dehra Dun (5.7), Ram-pur (4.3) and Sitapur (4.0). A l l the northern, western, north western and north eastern districts showed increase in the strength of maize in the cropping pattern. Maize declined in only & districts of which 7 showed a decline of less than 1 per cent and six of these declined by Iess than half a per cent. The districts showing decline were Jaunpur, Mirza-pur, Barabanki, Fyzabad, Gonda, Lucknow, Mainpuri and Jhansi.
G r a m
In general, pulses declined by 1.1 per cent in Uttar Pradesh as a whole. Gram showed a decline of 0.7 per cent in the state, though it continued to
have a third rank among the various crops. The change in proportion of gram ranges from a gain of 2.2 per cent to a decline of 5.7 per cent. In all, 18 districts showed a gain and of these, 7 districts gained less than 1 per cent, 8 districts gained from 1.0 to 1.9 per cent, while 3 districts gained more than 2 per cent. The 3 leading gain districts were Lucknow, Fatehpur and Hardoi with a respective gain of 2.4, 2.2 and 2.0 per cent. The sain districts form a contiguous block from Gorakhpur to Bahraich in the north to Partapgarh and Fatehpur in the south, and Shahjahanpur and Hardoi in the west.
Gram decreased in 29 districts of which 18 showed a decrease of more than 1 per cent. Nearly all the districts in the west (except Agra and Etah) and all the districts in the south „?nd in the east showed a decline in the production of gram. The leading decline districts were Muzaffarnagar, Saharan-pur, Meerut, Kanpur, Ballia and Banda (Table 7).
Comparing the decline of gram to that of other crops, it. appears that
gram decreased more than any other crop in as many as 10 districts in 'he Stale. Five of these districts form a block in the west comprising Bijnor, Saharanpur, Muzaffarnagar, Meerut and Bulandshahar, while the remaining 5 districts where gram was the leading decrease crop where Pilibhit, Kanpur, Banda, Varanasi and Ballia. In all the western districts that, showed gram .is the leading decrease crop, sugar-cane was the leading increase crop. In Pilibhit also, susar-cane was the leading increase crop. The other leading increase crops in the districts where gram was the leading decrease crop, were maize and wheat. Gram was the leading increase crop in 4 districts, namely, Bahraich, Barabanki, Sultan-pur and Fatehpur, In Bahraich, barley was the leading decrease crop while in Bareilly and Sultanpur, small millets were the main decrease crop.
Other Pulses
In 1950-51, other pulses (excluding gram) occupied 10.2 per cent of the total cropped area whereas in 1960-61, the proportion declined to 9,8 per cent.
Table 6: Change in Area under Jowar in Selected Districts
(As per cent of total cropped area)
1305

T H E E C O N O M I C W E E K L Y August 21, 1965
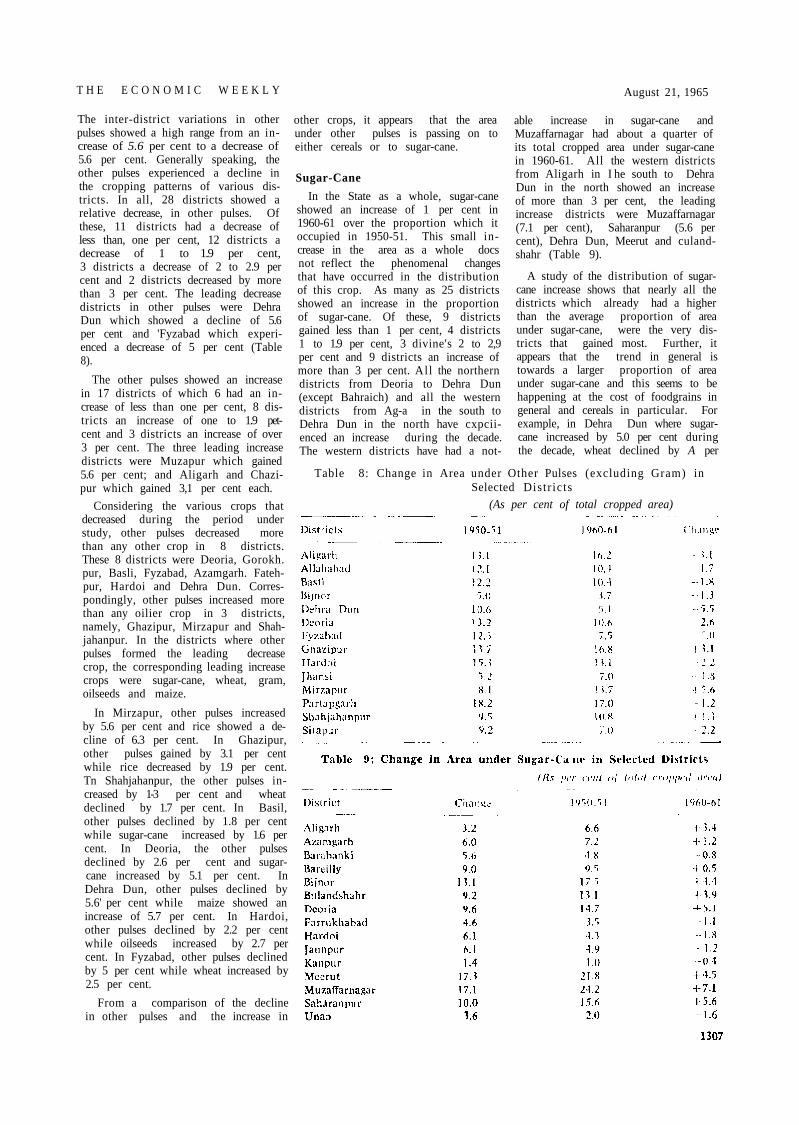
The inter-district variations in other pulses showed a high range from an increase of 5.6 per cent to a decrease of 5.6 per cent. Generally speaking, the other pulses experienced a decline in the cropping patterns of various districts. In all, 28 districts showed a relative decrease, in other pulses. Of these, 11 districts had a decrease of less than, one per cent, 12 districts a decrease of 1 to 1.9 per cent, 3 districts a decrease of 2 to 2.9 per cent and 2 districts decreased by more than 3 per cent. The leading decrease districts in other pulses were Dehra Dun which showed a decline of 5.6 per cent and 'Fyzabad which experienced a decrease of 5 per cent (Table 8).
The other pulses showed an increase in 17 districts of which 6 had an increase of less than one per cent, 8 districts an increase of one to 1.9 pet-cent and 3 districts an increase of over 3 per cent. The three leading increase districts were Muzapur which gained 5.6 per cent; and Aligarh and Chazi-pur which gained 3,1 per cent each.
Considering the various crops that decreased during the period under study, other pulses decreased more than any other crop in 8 districts. These 8 districts were Deoria, Gorokh. pur, Basli, Fyzabad, Azamgarh. Fateh-pur, Hardoi and Dehra Dun. Correspondingly, other pulses increased more than any oilier crop in 3 districts, namely, Ghazipur, Mirzapur and Shah-jahanpur. In the districts where other pulses formed the leading decrease crop, the corresponding leading increase crops were sugar-cane, wheat, gram, oilseeds and maize.
In Mirzapur, other pulses increased by 5.6 per cent and rice showed a decline of 6.3 per cent. In Ghazipur, other pulses gained by 3.1 per cent while rice decreased by 1.9 per cent. Tn Shahjahanpur, the other pulses increased by 1-3 per cent and wheat declined by 1.7 per cent. In Basil, other pulses declined by 1.8 per cent while sugar-cane increased by 1.6 per cent. In Deoria, the other pulses declined by 2.6 per cent and sugarcane increased by 5.1 per cent. In Dehra Dun, other pulses declined by 5.6' per cent while maize showed an increase of 5.7 per cent. In Hardoi, other pulses declined by 2.2 per cent while oilseeds increased by 2.7 per cent. In Fyzabad, other pulses declined by 5 per cent while wheat increased by 2.5 per cent.
From a comparison of the decline in other pulses and the increase in
other crops, it appears that the area under other pulses is passing on to either cereals or to sugar-cane.
Sugar-Cane
In the State as a whole, sugar-cane showed an increase of 1 per cent in 1960-61 over the proportion which it occupied in 1950-51. This small increase in the area as a whole docs not reflect the phenomenal changes that have occurred in the distribution of this crop. As many as 25 districts showed an increase in the proportion of sugar-cane. Of these, 9 districts gained less than 1 per cent, 4 districts 1 to 1.9 per cent, 3 divine's 2 to 2,9 per cent and 9 districts an increase of more than 3 per cent. Al l the northern districts from Deoria to Dehra Dun (except Bahraich) and all the western districts from Ag-a in the south to Dehra Dun in the north have cxpcii-enced an increase during the decade. The western districts have had a not
able increase in sugar-cane and Muzaffarnagar had about a quarter of its total cropped area under sugar-cane in 1960-61. All the western districts from Aligarh in I he south to Dehra Dun in the north showed an increase of more than 3 per cent, the leading increase districts were Muzaffarnagar (7.1 per cent), Saharanpur (5.6 per cent), Dehra Dun, Meerut and culand-shahr (Table 9).
A study of the distribution of sugarcane increase shows that nearly all the districts which already had a higher than the average proportion of area under sugar-cane, were the very districts that gained most. Further, it appears that the trend in general is towards a larger proportion of area under sugar-cane and this seems to be happening at the cost of foodgrains in general and cereals in particular. For example, in Dehra Dun where sugarcane increased by 5.0 per cent during the decade, wheat declined by A per
Table 8: Change in Area under Other Pulses (excluding Gram) in Selected Distr ic ts
(As per cent of total cropped area)
August 21, 1965 T H E E C O N O M I C W E E K L Y
THE ECONOMIC WEEKLY August 21, 1965
cent and barley by 5 per cent. In Saharanpur, wheat declined by 2.1 per cent; bajra by 1.4 per cent and gram by 5,2 per cent, but sugar-cane gained by 5.6 per cent In Muzaffarnagar, which had the highest relative increase in sugar-cane in the state, barley de. creased by 1 per cent, bajra by 1.1 per cent and gram by 5.7 per cent.
Among the northern districts, in Deoria rice decreased by 1.7 per cent and barley by 2,1 per cent while sugarcane increased by more than 5 per cent. In Kheri, barley decreased by 3.5 per cent and rice decreased by 1,4 per cent whereas sugar-cane increased by 4.6 per cent, Generally, it is the small grains and dry crops which vem to be yielding place to sugar-cane but in a large number of districts, sugarcane to be displacing the major cereals as welt.
As many as 18 districts showed a relative decline in sugar-cane and of these, 12 showed a decrease of less than 1 per cent and the remaining showed a decrease of one to 1.9 per cent. The regional distribution of the districts registering a relative decrease showed that these districts mostly he in the eastern and south eastern Darts of the state and these are the districts where the proportion of sugar-cane is generally low. These facts suggest that areal shifts are under way in the distribution of sugar-cane and the crop is moving towards northern and western districts of the state while its proportion in the south eastern, southern and mid-central districts is declining.
It may also be mentioned here that in 1950-51, only 5 districts had more than 10 per cent of area under sugarcane while in 1960-61, the number of such districts had risen to ten. And two districts, viz., Muzaffarnagar and Mjecrut, devoted more than 20 per cent of the total cropped area to sugar-cane.
Oilseeds
In 1950-51, oilseeds occupied only 1.8 per cent of the total cropped area in the state and a decade later they showed an increase of 0.3 per cent. But, there seem to be some interesting shifts in the areal distribution of oilseeds that have taken place during the decade. Oilseeds increased in 24 districts, of which 12 showed an increase of less than one per cent, 7 an increase of one to 1.9 per cent, 4 an increase of two to 2.9 per cent, while one district showed an increase of more than 3 per cent. Oilseeds decreased in 17 districts, of which 11 showed a decline
of less than one per cent, 3 districts a decline of one to 1.9 per cent and another 3 districts a decline of more than 2 per cent.
The interesting feature of the distributional change appears to be that oilseeds seem to have declined in southern and south western districts. The decline in Jhansi has been 6.2 per cent, in Hamirpur 4.6 per cent and the other south western districts of Jataun and Eta wan also showed a decline in oilseeds. Here, in three districts, namely, lalaun, Jhansi and Hamirpur, oilseeds declined more than any other crop in the district. In contrast to this the major grain in oilseeds seems to have occurred in several districts from Hardoi in the east to Moradabad in the west. In this area, in at least three districts namely, Moroda-bad, Bareilly, and Hardoi, oilseeds increased more than any other crop in the district.
Major Increases and Decreases Considering all the crops that show
ed relative increase during the decade 1950-51 to 1960-61 in the various districts, two crops appear to stand out. These are wheat and sugar-cane. While wheat was the leading increase crop in the southern and south western districts, sugar-cane was the main increase crop in all the western and northern districts of the state. Wheat formed the leading increase crop in 13 districts while sugar-cane increased more than any other crop in 11 districts. Oilseeds were the leading increase crop in 3 districts. Maize increased more than any other crop in rive widely scattered districts from Ballia in the east to Dehra Dun in the north west.
Among the leading decrease crops, jowar, barley, gram, small millets, and other pulses were quite conspicuous. They were the leading decrease crop in as many as 40 districts. Barley, small millets and other pulses (excluding gram) declined more than any other crop in 23 districts. These include the terai districts from Deoria to Kheri and east central districts as far south as Rae-Bareli, Partapgarh and Jaunpur.
Gram was the leading decrease croo in 10 districts, barley in 8 districts, jowar in 7 districts, small millets in another seven and other pulses In eight, districts. In a block of 3 districts comprising Jalaun, Jhansi and Hamirpur, oilseeds decreased more than any other crop.
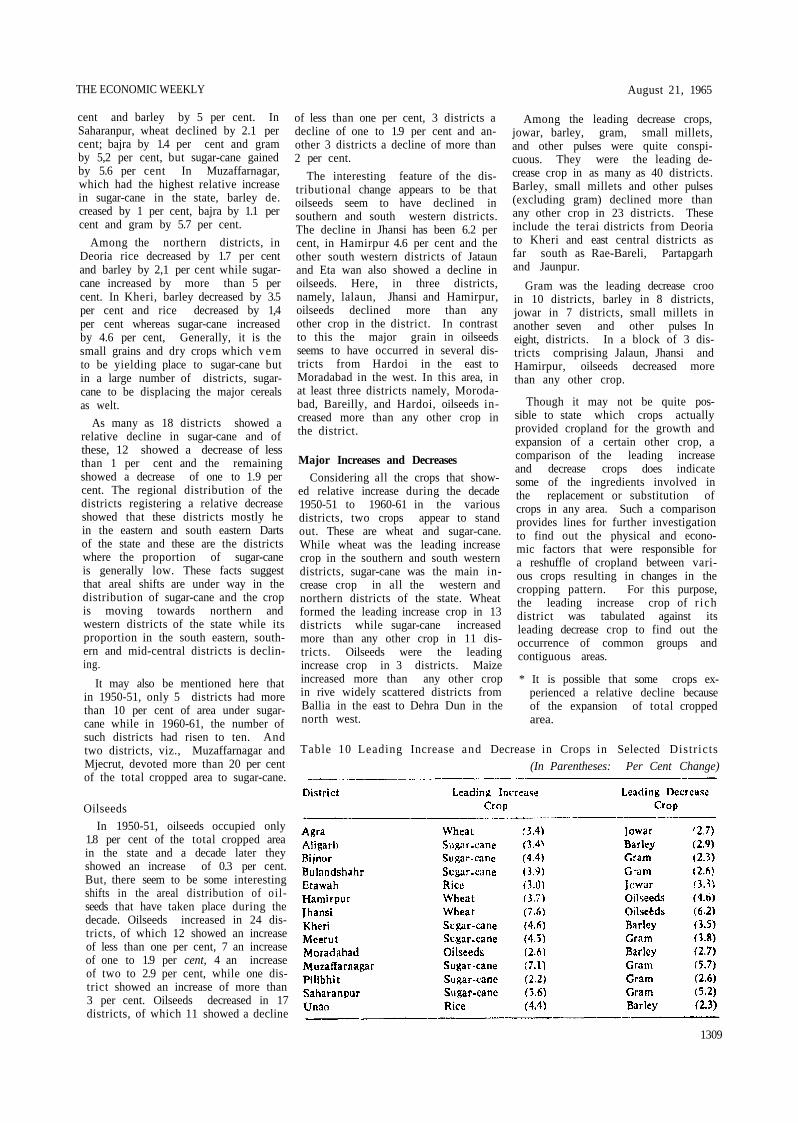
Though it may not be quite possible to state which crops actually provided cropland for the growth and expansion of a certain other crop, a comparison of the leading increase and decrease crops does indicate some of the ingredients involved in the replacement or substitution of crops in any area. Such a comparison provides lines for further investigation to find out the physical and economic factors that were responsible for a reshuffle of cropland between various crops resulting in changes in the cropping pattern. For this purpose, the leading increase crop of r ich district was tabulated against its leading decrease crop to find out the occurrence of common groups and contiguous areas.
* It is possible that some crops experienced a relative decline because of the expansion of total cropped area.
Table 10 Leading Increase and Decrease in Crops in Selected Distr icts (In Parentheses: Per Cent Change)
1309
August 21, 1965 T H E E C O N O M I C W E E K L Y
The comparison of leading increase ami decrease crops showed some interesting features that seem to offer a partial explanation of the nature of shifts in the cropping pattern. The leading increase crop of wheat corresponded to the leading decrease crop of jowar in three districts 'Agra, Mat burn and Allahabad), of oilseeds in three other contiguous disiricis (Jalaun, Jhansi and Hamirpur), and of gram in another three distrids Banda, Kan pur and Varanasi). A fair portion of the relative increase in wheat in these districts seems to have occurred at the expense of the lead-ing decrease crops though it can not categorically be staled that wheal was actually substituted for jowar or oilseeds or gram. Likewise, the leading increase crop of sugar cane corresponded to the leading decrease crop of gram in six districts (Pilibhil and a contiguous area consisting of Bijnor, Saharanpur, Muzaffarnagar, Meerut and Bulandshahr), of barley in two districts (Aligarh and Kheri). and of other pulses and small millets in a horse-shoe shaped area comprising Basti, Azamgarh and Deona (Table 10).
That the leading increase and decrease crops do constitute major components of crop substitution is borne out by a study of the changes in the cropping pattern of various districts. For example, in Jhansi the main increase crops were : wheat (7.6 per cent), jowar (2.3 per cent) and other pulses (1.8 per cent) while the nnin decrease crops were ; oilseeds (6.2 per cent), small millets (1/1 per com) and barley (1.0 per cent). Again, in Sanaranpur. the main increase crops were : Sugar-cane ("5.6 per cent) and rice (3.6 per cent) while the. main decrease crops were : gram (5.2 per cent), wheat (2.1 per cent) and lajra (1.4 per cent). It must be emphasized here that a comparison of the leading increase and decrease (Tops only points to the possible crop substitutions and detailed studies ilone can provide more satisfactory answers to the problem.
Total Volume of Change: Measure of Agricultural Dynamism
Changes in the relative strength of some individual crops have been discussed above. We may now make an assessment of the total volume of change that has occurred in the cropping pattern. Obviously the disiricis in which a large percentage of total
1310
cropland is involved in change, would be relatively more dynamic than those in which only a small percentage of the cropland is involved. The districts which show little change can be identified with a view to find out the inhibiting factors responsible for their stagnation.
For the purpose of assessing the total volume of change, positive changes and negative changes were separately added for each district. Normally, for any given district, the sum of positive changes should equal the sum of negative changes. Where the two values vary, the difference would be due to changes in crops not included in the study. However, the larger of the two values (from amongst the sum of positive and negative changes) may be taken to represent the total volume of change that the cropland has undergone.
In Uttar Pradesh as a whole, the crops showing positive change were: wheat (1.6 per cent), sugar-cane (1.0 per cent), maize (0.6 per cent), oilseeds (03 per cent) and cotton (0.1 per cent), all adding upto 3.6 per cent. The crops showing negative change were: barley (1.5 per cent), gram '0.7 per cent), jowar (0.6 per cent), fodder (0.5 per cent), other pulses (0.4 per cent), bajra (0.1 per cent), rice (0,l per cent) and small millets (0.1 per cent), all adding upto 4.0 per cent. The sum of increase crops differs from the sum of decrease crops by 0.4 per cent. This difference is explained by the fact that some crops not considered here have gained by 0.4 per ent. A look at Table 1 confirms this view as the crops consideded in this study occupied 97.2 per cent of cropland in 1^50-51 and 96.8 per cent of cropland in I960 61. Obviously, this decline of 0.4 per cent has meant ar increase in the proportion of cop-land under crops not considered here, The total volume of change in Uttar Pradesh has, as such, involved only 4.0 per cent of the cropland. This statement is applicable only for the state as a whole and the component districts would certainly present a different picture.
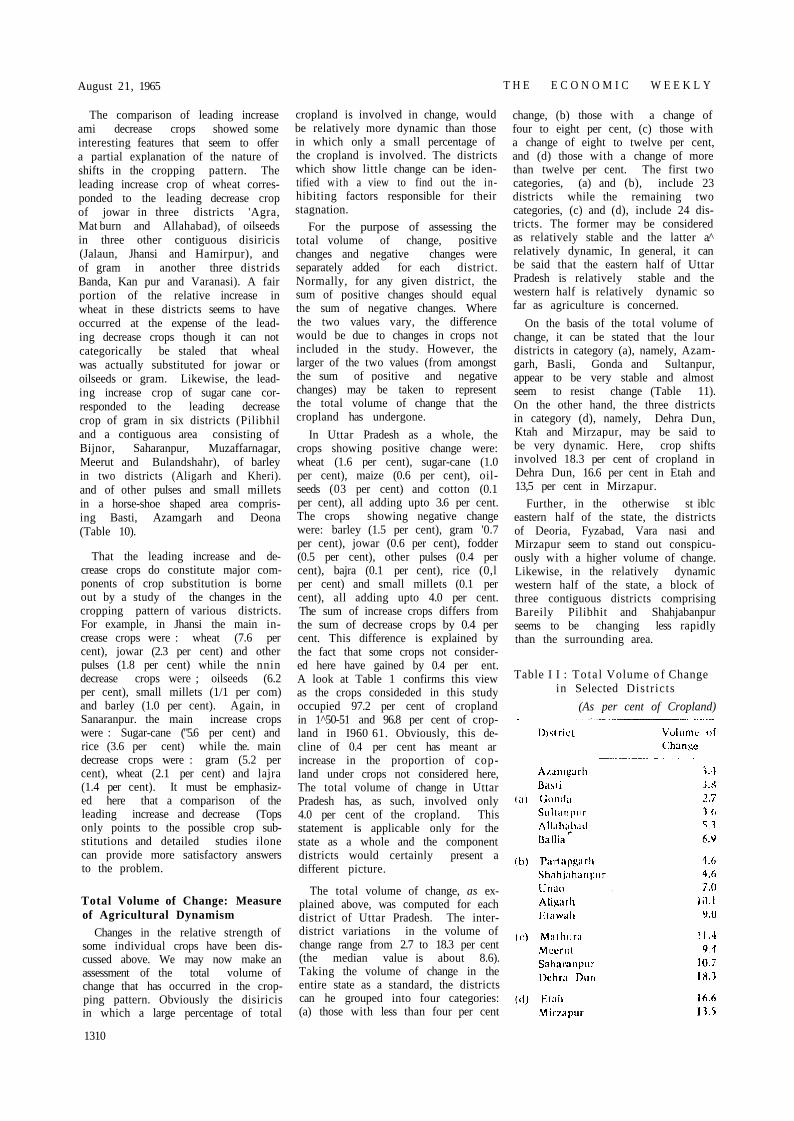
The total volume of change, as explained above, was computed for each district of Uttar Pradesh. The inter-district variations in the volume of change range from 2.7 to 18.3 per cent (the median value is about 8.6). Taking the volume of change in the entire state as a standard, the districts can he grouped into four categories: (a) those with less than four per cent
change, (b) those with a change of four to eight per cent, (c) those with a change of eight to twelve per cent, and (d) those with a change of more than twelve per cent. The first two categories, (a) and (b), include 23 districts while the remaining two categories, (c) and (d), include 24 districts. The former may be considered as relatively stable and the latter a.̂ relatively dynamic, In general, it can be said that the eastern half of Uttar Pradesh is relatively stable and the western half is relatively dynamic so far as agriculture is concerned.
On the basis of the total volume of change, it can be stated that the lour districts in category (a), namely, Azamgarh, Basli, Gonda and Sultanpur, appear to be very stable and almost seem to resist change (Table 11). On the other hand, the three districts in category (d), namely, Dehra Dun, Ktah and Mirzapur, may be said to be very dynamic. Here, crop shifts involved 18.3 per cent of cropland in Dehra Dun, 16.6 per cent in Etah and 13,5 per cent in Mirzapur.
Further, in the otherwise st iblc eastern half of the state, the districts of Deoria, Fyzabad, Vara nasi and Mirzapur seem to stand out conspicuously with a higher volume of change. Likewise, in the relatively dynamic western half of the state, a block of three contiguous districts comprising Bareily Pilibhit and Shahjabanpur seems to be changing less rapidly than the surrounding area.
Table I I : Tota l Volume o f Change in Selected Distr icts
(As per cent of Cropland)
T H E E C O N O M I C W E E K L Y August 21, 1965
Conclusion
On the basis of the above, it n ay be said that, during 1950-61, there have been considerable changes in 1 he cropping pattern of Uttar Pradesh. However, these changes are not manifest when data are considered at the State level alone. Changes in the cropping pattern obviously need to be studied at least at the district level in order to comprehend their nature
and to bring out the ical character of such changes within the Slate.
Further, the cropping patterns in different parts of the stale have undergone change in varying degrees. Generally speaking, western Uttar Pradesh is relatively more dynamic than the eastern part where some districts, like Azamgarh and Basli, almost seem to be resisting change.
There also appears to have b-jen
some regional redistribution of crops. There are indications that the density of some crops is increasing in areas where it was already high, ie, there is a tendency towards a real concenta-tion. The process of concentration seems to have been rather slow .luring the period under study but it is Jis-cernable. Further studies are needed to understand the implications of this process in the context of changes in the cropping pattern of Uttar Pradesh.
Labour Party's Surrender to Racialism
ORN out of Leyton and Smeth wick, the Government's White
Paper on Commonwealth Immigration is a tragic surrender to racialism and colour prejudice in Britain. As David Pitt, the West Indian G P and Greater London County Counsellor and Chairman of the Campaign Against Racial Discrimination (CARD), said, the White Paper proves that the Labour Party has decided to base its immigration policy on colour prejudice. As a protest he has resigned the Executive of the London Labour Party. Lord Brockway, the Chairman of the British Overseas Socialist Federation, an official Labour Party organisation, also pointed out that the White Paper was "weighted against Commonwealth immigrants who are coloured". Even the Observer, commenting on the White Paper, says that it is a concession to colour prejudice, and blames the paper for not acknowledging this.
There is little in the White Paper to give cause for satisfaction. The positive measures that it recommends are so slight as to have very little effect on the problems, while the ne-gative features give cause for considerable disquiet. Perhaps the most disquieting feature is the 60 per cent cut that has now been made in the number of Ministry of Labour vouchers issued to intending immigrants. The total number of entry permits that will be issued to professional and skilled workers from the Commonwealth will now amount each year to 7,500. At the same time, 1,000 immigrants from Malta will be allowed to come in each year, for after all, the Maltese are white! Such figures as are available seem to prove that it is not coloured immigrants from the Commonwealth who provide the largest number of entries into the coun
From Our London Correspondent
try. For example, in 1964, 14,000 Commonwealth citizens entered Britain, with labour permits, compared with 42,000 aliens, most of whom, with few exceptions, were white Europeans. It is interesting to note that the number of permits issued for Commonwealth citizens in that year amounted to 28,824. Therefore, it is quite obvious that the dangers of coloured immigration have been greatly exaggerated. The White Paper gives no reasons at all to justify the very drastic cm that has now been propos ed.
Another dangerous section in the White Paper is the one which gives the Home Secretary arbitrary powers of deportation, It has even been suggested that immigration officers should be empowered to require students to register with the police. What a change from the altitude the Labour Party took when, during the Enahoro affair, they were castigating Henry Brooke for his action in deporting the Chief!
Shortage of Labour
This pandering to the colour prejudice of the electorate will do no good, and, indeed, might even harm the British economy. In the recent censure debate, the Chancellor of the Exchequer pointed out the gravity of the continuing labour shortage. In these circumstances, the Minister for Economic Affairs can hardly be happy about the new restrictions that have been placed on immigrant labour. The estimates made by the Government show that by 1970 there will be labour shortage of 300,000; the Fede ration of British Industries anticipates that this shortage will be nearer 500,000. Against this background, an annual quota of 8,500 immigrants is hardly enough, and the Government
is deliberately allowing colour prejudice to override economic considerations.
Immigrant labour is a convenient method of easing the shortage of labour in certain bottleneck areas and industries at particular periods when trie economy has run into a high boom. The main attraction of immigrant labour is the fact that it is prepared to he mobile and move r.to areas and jobs where UK citizens are unwilling to go; immigrants move automatically to areas of most acute labour shortage because that is where it is easiest to get jobs. In this way they do a very useful service to the economy. Indeed, it is on the basis of immigrant labour that many of the countries in Western Europe, particularly Western Germany, have been able to achieve a faster rate of growth and a lower level of unemployment. Since 1961 when unemployment in West Germany dropped below I per cent (at around which figure it has since remained!, the net influx of foreign workers has been about 150,000 a year. The L) K Government seems to believe that foreign workers are difficult, and coloured people are an electoral nuisance and, therefore, they are not prepared to underline the lesson that Britain, like Germany, could have Lister rate of growth and a lower level of unemployment if it followed Germany's example in ac eepling immigrant workers.
Brainin Drain Another disquieting feature of the
Bill is that it could lead to a serious "brain drain" front Commonweal ih countries, just at a time when they have the greatest need for their own trained personnel. Out of the total number of permits to be issued each year for Commonwealth immigrants, 6,000 of the permits are for doctors,
1311
B


![< X i v } v U , X , o P U > X , À ] v P U X < v µ v U , X ... · P u u ] l l P o v X ^ P i v u ( µ P i À o v X s ] v ( o µ } P o P P À l](https://static.fdocuments.us/doc/165x107/5f4d95b868593756d475ddbe/-x-i-v-v-u-x-o-p-u-x-v-p-u-x-v-v-u-x-p-u-u-.jpg)


![Epw Standards Specification Manual[1]](https://static.fdocuments.us/doc/165x107/5571fa764979599169924569/epw-standards-specification-manual1.jpg)