A Study of the Factors Influencing Cultural Tourists’ Perception and Its Measurement with...
24
A Study of the Factors Influencing Cultural Tourists’ Perception and Its Measurement with Reference to Agra © 2013 IUP. All Rights Reserved. * Assistant Professor, Accurate Institute of Management and Technology, Gr. Noida, Uttar Pradesh, India. E-mail: [email protected] The major growth of the Indian tourism sector is contributed by domestic tourism which tends to be more focused on cultural destinations. Travel and tourism for fun, pleasure and recreation is still considered an elite ‘five star’ activity by a majority of the Indians. At the same time, travel and tourism for cultural purposes forms an integral part of the Indian population, where people from all ages, religions and income groups often manage time and resources for cultural tourism. Tourism has a huge potential for poverty alleviation by increasing job opportunities and spending by tourists. Most important from India's point of view is the fact that these employment opportunities are created in the small and medium segments of the economy and disperse throughout the country. When people of a country visit such sites and experience their culture, they understand ‘who they are and where they have come from’ (Palmer, 1999). Since viewing of such sites by domestic tourists offers glimpses of a nation's past, their promotion becomes vital in the construction of national identity (Johnson, 1995). The measurement of perception of tourists and thereby identifying gaps in the current service-good composition and customizing pro-tourist product mix, becomes crucially important for all the stakeholders of the tourism industry. This paper primarily studies those crucial factors which have a direct impact on the perception of tourists in the heritage city of Agra. Amitabh Mishra* Introduction Tourism is a complex phenomenon which encapsulates a varying number of services and processes. It is not an industry or a sector in the traditional sense, rather it is an economic activity that runs through all of the society involving very different and varied sectors pushed forward by market forces, controlled by regulatory framework and governed by general economic conditions. In many countries and regions, tourism is significantly important to the economy because it attracts tourists who bring spending power. For many regional economies, tourism can bring about an encouraging response to the regional development considering its positive influence on regional employment and income. According to World Travel and Tourism Council (WTTC), travel and tourism is an important economic activity in most countries around the world. It has a direct as well as a significant indirect and induced economic impact. The UN Statistics Division’s approved Tourism Satellite Accounting methodology quantifies only the direct
Transcript of A Study of the Factors Influencing Cultural Tourists’ Perception and Its Measurement with...

The IUP Journal of Marketing Management, Vol. XII, No. 4, 201342
A Study of the Factors InfluencingCultural Tourists’ Perception and ItsMeasurement with Reference to Agra
© 2013 IUP. All Rights Reserved.
* Assistant Professor, Accurate Institute of Management and Technology, Gr. Noida, Uttar Pradesh,India. E-mail: [email protected]
The major growth of the Indian tourism sector is contributed by domestic tourismwhich tends to be more focused on cultural destinations. Travel and tourism for fun,pleasure and recreation is still considered an elite ‘five star’ activity by a majority ofthe Indians. At the same time, travel and tourism for cultural purposes forms an integralpart of the Indian population, where people from all ages, religions and income groupsoften manage time and resources for cultural tourism. Tourism has a huge potential forpoverty alleviation by increasing job opportunities and spending by tourists. Mostimportant from India's point of view is the fact that these employment opportunitiesare created in the small and medium segments of the economy and disperse throughoutthe country. When people of a country visit such sites and experience their culture, theyunderstand ‘who they are and where they have come from’ (Palmer, 1999). Since viewingof such sites by domestic tourists offers glimpses of a nation's past, their promotionbecomes vital in the construction of national identity (Johnson, 1995). Themeasurement of perception of tourists and thereby identifying gaps in the currentservice-good composition and customizing pro-tourist product mix, becomes cruciallyimportant for all the stakeholders of the tourism industry. This paper primarily studiesthose crucial factors which have a direct impact on the perception of tourists in theheritage city of Agra.
Amitabh Mishra*
IntroductionTourism is a complex phenomenon which encapsulates a varying number of services andprocesses. It is not an industry or a sector in the traditional sense, rather it is an economicactivity that runs through all of the society involving very different and varied sectorspushed forward by market forces, controlled by regulatory framework and governed bygeneral economic conditions. In many countries and regions, tourism is significantlyimportant to the economy because it attracts tourists who bring spending power.For many regional economies, tourism can bring about an encouraging response to theregional development considering its positive influence on regional employment andincome. According to World Travel and Tourism Council (WTTC), travel and tourismis an important economic activity in most countries around the world. It has a direct aswell as a significant indirect and induced economic impact. The UN Statistics Division’sapproved Tourism Satellite Accounting methodology quantifies only the direct
43A Study of the Factors Influencing Cultural Tourists’ Perceptionand Its Measurement with Reference to Agra
contribution of travel and tourism. But WTTC recognizes that the total contribution(considering direct, indirect and induced impacts) of travel and tourism to GDP isthree times greater than its direct contribution. According to WTTC’s annual report onEconomic impact of tourism in India in 2006, the direct contribution of travel andtourism to India’s GDP was 1,236.7 bn. It reached 1,919.7 bn (2% of GDP) in2012, and it is expected to grow by 7.8% pa to 4,360.6 bn (2.1% of GDP) in 2023.In 2006, the total contribution of travel and tourism to GDP was 4,280.5 bn.It reached 6,385.1 bn in 2012 (6.6% of GDP) and is forecasted to rise by 7.9% pa to
14,722.3 bn in 2023 (7% of GDP).
Tourism directly generates employment in its own sector as well as via indirect andinduced effects in the connected sectors of the economy. According to WTTC, traveland tourism generated 24,477,4000 direct jobs in India in 2006, and 25,041,000direct jobs in 2012 (4.9% of total employment in the country). It is forecasted to accountfor 30,631,000 direct jobs by 2023, an increase of 2.1% pa over the next 10 years. Thetotal contribution of travel and tourism to employment is much more than the directcontribution. It generates huge employment opportunities in various other sectors andhence provides a source of income to millions of countrymen every year. The totalcontribution of travel and tourism to employment was 43,210,300 jobs in 2006 and39,512,000 jobs in 2012 (7.7% of total employment in the country), and is expectedto generate 48,592,000 jobs (8% of total employment in the country), an increase of2.1% per annum over the period in 2023.
Tourism as a post-Second World-War phenomenon has revolutionized the economiesof many countries of the world and India with its large variety of tourist attractions isyet to make its presence felt on the world tourism map. According to “India TourismStatistics at a Glance 2011” (Published by Ministry of Tourism, Government of India),India has earned foreign exchange of US$2,889 mn ( 10,511 cr) in 1997. ForeignExchange Earnings (FEE) reached $16,564 mn ( 77,591 cr) in 2011. Foreign TouristsArrival (FTA) in India was 2.37 million in 1997. It rose from 3.46 million in 2004 to6.29 million in 2011. In the world tourism industry, India’s percentage share and rankin 2000 were 0.73% and 36th respectively, whereas in Asia and Pacific its percentageshare and rank were 4.06% and 10th. In 2011, it rose to 1.61% and 17th in worldtourism and 5.72% and 8th rank in Asia and Pacific. Domestic tourism was also rising inthe country. The number of domestic tourists in India had risen from 159.88 million in1997 to 366.27 million in 2004 and 850.86 million in 2011. Among tourism nichemarkets, cultural tourism ranks first. More and more travelers rank arts, heritage andother cultural activities as one of the main reasons for traveling.
Tourism in AgraAgra is the city of the inimitable Taj Mahal. According to the reports of ArcheologicalSurvey of India (ASI), Agra’s Taj Mahal is the most popular destination in the country
The IUP Journal of Marketing Management, Vol. XII, No. 4, 201344
and Taj Mahal along with Agra Fort are among the top 10 most visited monuments bydomestic as well as foreign tourists in the country. On November 17, 2011, CNBCAwaj Travel Awards 2011 for Most Famous Weekend Destination in the north wasgiven to Agra and Best Managed Historical Monument to Taj Mahal.
Literature ReviewTourism has traditionally been defined either in demand side terms or supply side terms,i.e., either in terms of the activities of tourists/visitors or the activities of businesses supplyingtourists/visitors. The demand side concept was accepted as an appropriate approach atthe World Tourism Organization’s (WTO), “International conference on travel and tourismstatistics” Ottawa (Canada) in 1991 and tourism was defined as: “The activities of aperson travelling to and staying in places outside their usual environment for not morethan one consecutive year for leisure, business and other purposes”.
According to Medlik and Middleton (1973), tourism product is a bundle ofactivities, services, and benefits that constitute the entire tourism experience. In their'component model of tourism product', they discussed five components of tourismproduct namely: (1) Destination attractions; (2) Destination facilities; (3) Destinationaccessibility; (4) Destination images; and (5) Destination price. Later, Jefferson andLickorish (1988) stated that tourism product is a collection of physical and servicefeatures together with symbolic associations which are expected to fulfill the wantsand needs to the tourists.
Culture is one of the two or three most complicated words in the English language(Williams, 1976). Culture is not genetically inherited (Hall, 1976), but is always sharedby members of a society (Hall, 1976; Hofstede, 1980; and Mulholland, 1991). Itdistinguishes the members of one group from another and is passed from one generationto the other. It is dynamic because each generation adds something of its own beforepassing it on (Hofstede, 1980). There are hundreds of definitions of 'culture' (Tomlinson,1991; and Lonner, 1994) but no single definition has achieved a consensus in literature.According to Mulholland (1991), culture is a set of shared and enduring meaning,values, and beliefs that characterize national, ethnic, or other groups and orient theirbehavior. In the tourism literature, the term ‘culture’ can be identified in two ways-culture as process; and culture as a product. ‘Culture as the process’ is an approachthrough which people make sense of themselves and their lives (Clarke, 1990). It assumesthat boundaries of culture, are variable, and can cover a nation, tribe, corporation, etc.,pursuing any specific activities. ‘Culture as product’ is an approach where culture isregarded as the product of individual or group activities to which certain meanings areattached. Culture as process is the goal of tourists seeking authenticity and meaningthrough their touring experiences (MacCannell, 1976; and Cohen, 1979). Culture asthe process is transformed into culture as a product through tourism (Cohen, 1988).
According to WTO (2000), culture and tourism have a symbiotic connection. Arts,crafts, dances, rituals and legends that are at risk of being forgotten by the younger
45A Study of the Factors Influencing Cultural Tourists’ Perceptionand Its Measurement with Reference to Agra
generation may be revitalized when tourists show a keen interest in them. Culturaltourism is the sub-set of tourism (MacCannell, 1976; and Singh, 2008). The range ofpossible uses of the term is so vast, that no single widely accepted definition of culturaltourism emerged (Richards, 1993; Dolnicar, 2002; and Hughes, 2002). It means differentthings to different people (MacCannell, 1976; McIntosh and Goeldner, 1990; Zeppel,1992; Hughes, 1996; Stebbins, 1996; and McKercher and Du Cros, 2003). Boninkand Richards (1992) reviewed the existing definitions of cultural tourism and identifiedtwo basic approaches: (1) Sites and monuments approach which is clearly related to aproduct-based definition of culture and concentrates on describing the type ofattractions visited by cultural tourists ECTARC (1989); and (2) Conceptual approachwhich is clearly related to process-based definitions of culture and attempt to describethe motive and the meanings attached to cultural tourism activity. For example, culturaltourism comprises all aspects of travel (McIntosh and Goeldner, 1986 and 1990).The role of culture as contextual, where it shapes the tourist's experience of a situationin general, without a particular focus on the uniqueness of a specific cultural identity(Wood, 1984).
Cultural tourists are not recognized as a homogenous mass but a heterogeneousmarket with different characteristics and needs (Hughes, 2002; and McKercher, 2002)and different types of cultural tourists may seek qualitatively different experiences(McKercher, 2002; and Dolnicar, 2002). On the basis of degree of motivation for visitingcultural sites/destinations, Silberberg (1995) identified four different types of culturaltourists-greatly motivated, in part motivated, adjunct and accidental cultural tourists.Cultural tourists can also be either specific or general (Foo and Rossetto, 1998).McKercher (2002) introduced a two-dimensional model on cultural tourism and classifiedcultural tourist in five categories-the purposeful, the sightseeing, the casual, the incidentaland the serendipitous cultural tourists.
Perception is a complex process (Kesic, 1999) by which an individual selects, organizes,and interprets stimuli into a meaningful and coherent picture of the world (Schiffmanand Kanuk, 2004). There are a number of tangible and intangible aspects of tourismproducts which influence the perception of tourists. According to Beerli and Martýn(2003) there are nine dimensions/aspects which determine the perception of tourist-tourist leisure and recreation, culture, history and art, general infrastructure, touristinfrastructure, political and economic factors, natural resources, natural environment,social environment and the atmosphere of the place/destination.
Objectives of the StudyThe primary aim of this research is:
• To measure the perception of cultural tourists regarding various factors whichaffect the perception of tourists and to know whether the difference betweenperception of male and female tourists is significant.

The IUP Journal of Marketing Management, Vol. XII, No. 4, 201346
• To find out the demographic profile of cultural tourists and the influence ofdemography of cultural tourists on their duration of stay and sources ofknowledge about Agra.
Formulation of HypothesesBased on the objectives of the study the following hypotheses were formulated:
Ho: Personal factors of the respondents have no significant influence on (are not associatedwith) the sources of knowledge about Agra.
Ho: Personal factors of the respondents have no significant influence on (are not associatedwith) the duration of stay at Agra.
Ho: There is no significant difference between the mean perceptions of male and femaletourists regarding various tourism-related variables.
Research MethodologyData was collected at a few of the most visited tourist attractions in Agra—Taj Mahal,Red Fort and Sikendra. Agra is on the banks of the river Yamuna in the northern stateof Uttar Pradesh, India. It is 363 km west of the state capital, Lucknow, and 203 kmsouth from national capital New Delhi. It is well connected with major cities of thecountry by road, rail (Agra Cantt., Agra Fort, Raja-ki-Mandi and Tundla railway stations)and air routes. Kheria airport is 13 km from the city center.
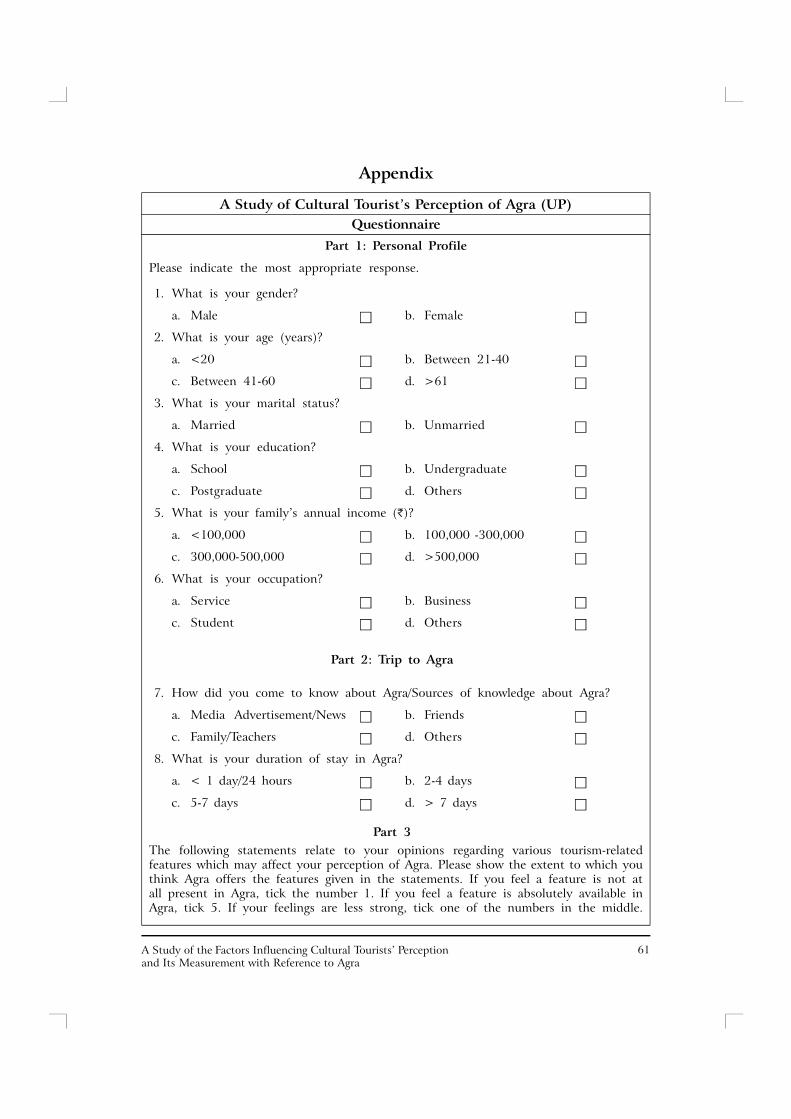
The primary data pertaining to the perception of tourists was collected through astructured and non-disguised questionnaire (refer Appendix) from April to May, 2013.Before executing the questionnaire in full swing, a pilot study was conducted on a smallgroup of respondents. The questionnaire was divided into three parts. Part one (containing6 questions), Part two (containing 2 questions) with nominal/ordinal scales mainlyrelated to the demographic profile of the respondents, and Part 3 contained 28 statements(5-point Likert scale ranging fromm 1 – strongly disagree to 5 – strongly agree) related tothe perception of the tourists regarding a variety of tourism related variables. Most ofperception measurement statements were adopted from previous studies. The studyalso gathered secondary data from extensive literature survey available on the Internetand libraries. Convenience sampling technique was used to achieve the earlier statedobjectives of research.
Statistical Tools UsedFor the purpose of a detailed analysis of the raw data obtained from the questionnaire,the following statistical techniques were used:
1. Cronbach’s Alfa test of internal consistency was used to check the reliabilityof scale used in the survey.
2. Descriptive statistics: Arithmetic mean and standard deviation were used touncover the characteristics of the data obtained through survey.

47A Study of the Factors Influencing Cultural Tourists’ Perceptionand Its Measurement with Reference to Agra
3. To measure the influence of the personal factors (like age, gender, maritalstatus etc.) on the sources of knowledge about Agra and duration of stay atAgra, a Chi square (2) test of independence was used.
4. A two-tailed test was used to know the difference between the mean values oftwo large samples, and a Z-test was used to find the significant differencebetween the mean perceptions of male and female tourists.
Test of Reliability: The reliability analysis allows us to study the properties ofmeasurement scale and the items that make them up. It also provides information aboutthe relationship between individual items in the scale. Cronbach’s Alfa () is a measureof internal consistency. The overall value of reliability coefficient for all the fourdimensions of tourism, = 0.8602. It indicates the high internal reliability of the data(Table 1).
Table 1: Reliability Statistics
S. No. Dimension Cronbach Alfa
1. Monuments and Places of Tourists’ Attraction 0.7763
2. Accommodation and Food 0.7583
3. Hygiene and Sanitation 0.7575
4. Attitude of Local People Towards Visitors 0.5576
Overall Reliability Coefficient, 0.8602
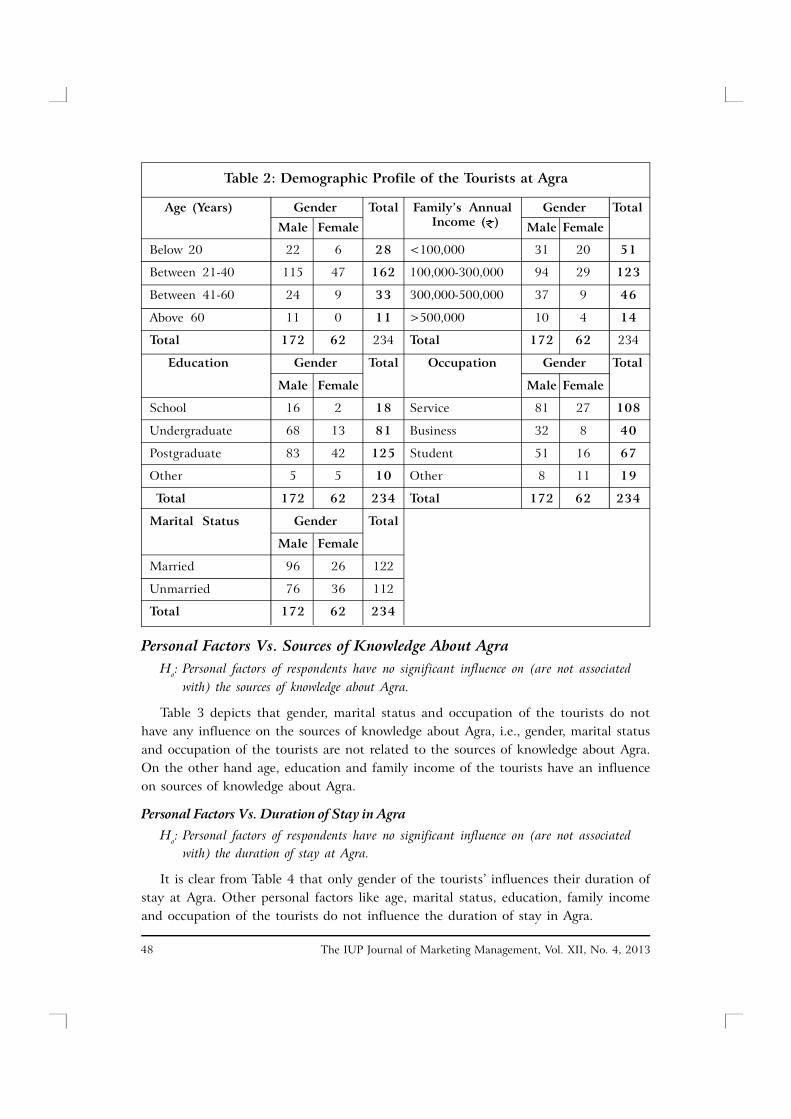
Results and DiscussionTo study the demographic profile of the tourists at Agra, the data obtained from questionnumbers 1-6 are cross-tabulated. The data corresponding to Age, family’s annualincome, education, occupation and marital status are cross-tabulated with the gender(Table 2).
Influence of Personal Factors of RespondentsThe influence of personal factors like gender, age, marital status, income, education andoccupation on: (1) Sources of knowledge about Agra; and (2) Duration of stay at Agra.
For this purpose, a 2 test of independence was used. This test determines whethertwo or more attributes are associated or not. The calculated value of 2 was comparedwith the table value of 2 for a given degree of freedom at certain specified level ofsignificance (generally 5% is selected). If at the stated level the calculated value of 2 ismore than the table value, the difference is considered to be significant i.e., the attributesare associated/ related. On the other hand, if the calculated value is less than the tablevalue, the difference is not considered as significant and it can be concluded that theattributes are not related/associated.
The IUP Journal of Marketing Management, Vol. XII, No. 4, 201348
Personal Factors Vs. Sources of Knowledge About AgraHo: Personal factors of respondents have no significant influence on (are not associated
with) the sources of knowledge about Agra.
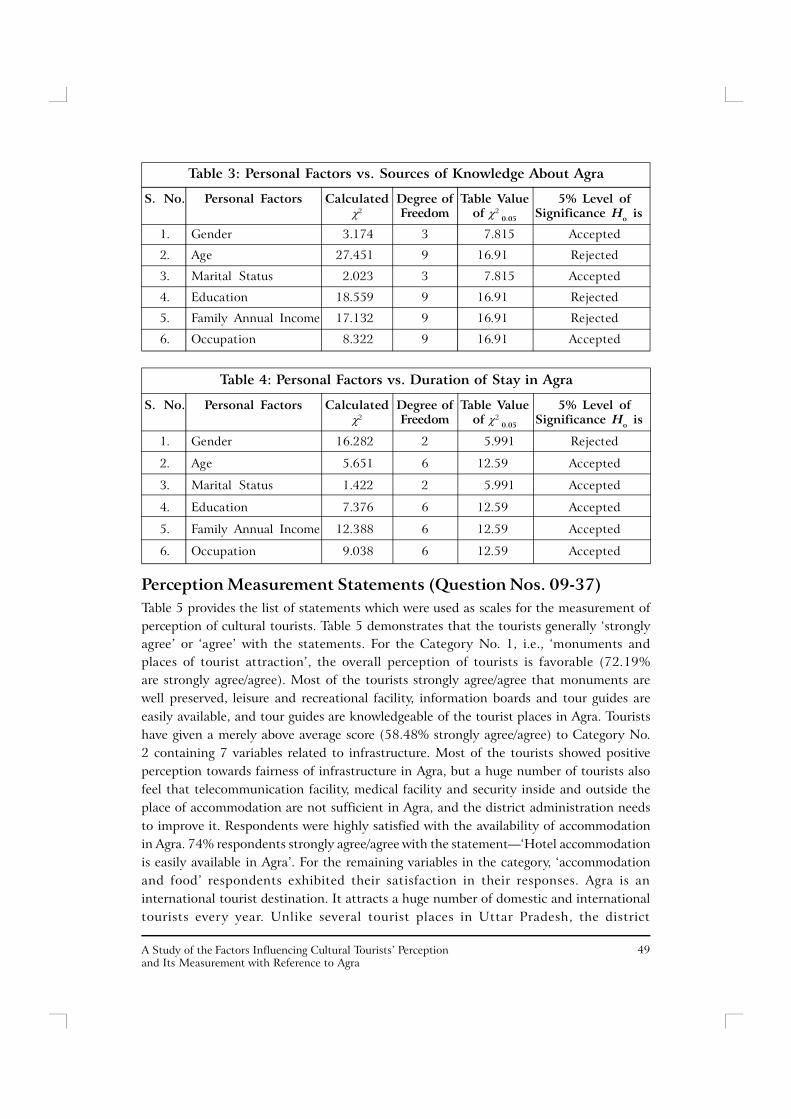
Table 3 depicts that gender, marital status and occupation of the tourists do nothave any influence on the sources of knowledge about Agra, i.e., gender, marital statusand occupation of the tourists are not related to the sources of knowledge about Agra.On the other hand age, education and family income of the tourists have an influenceon sources of knowledge about Agra.
Personal Factors Vs. Duration of Stay in AgraHo: Personal factors of respondents have no significant influence on (are not associated
with) the duration of stay at Agra.
It is clear from Table 4 that only gender of the tourists’ influences their duration ofstay at Agra. Other personal factors like age, marital status, education, family incomeand occupation of the tourists do not influence the duration of stay in Agra.
Table 2: Demographic Profile of the Tourists at Agra
Age (Years) Gender Total Family’s Annual Gender Total
Male Female Income ( ) Male Female
Below 20 22 6 28 <100,000 31 20 51
Between 21-40 115 47 162 100,000-300,000 94 29 123
Between 41-60 24 9 33 300,000-500,000 37 9 46
Above 60 11 0 11 >500,000 10 4 14
Total 172 62 234 Total 172 62 234
Education Gender Total Occupation Gender Total
Male Female Male Female
School 16 2 18 Service 81 27 108
Undergraduate 68 13 81 Business 32 8 40
Postgraduate 83 42 125 Student 51 16 67
Other 5 5 10 Other 8 11 19
Total 172 62 234 Total 172 62 234
Marital Status Gender Total
Male Female
Married 96 26 122
Unmarried 76 36 112
Total 172 62 234
49A Study of the Factors Influencing Cultural Tourists’ Perceptionand Its Measurement with Reference to Agra
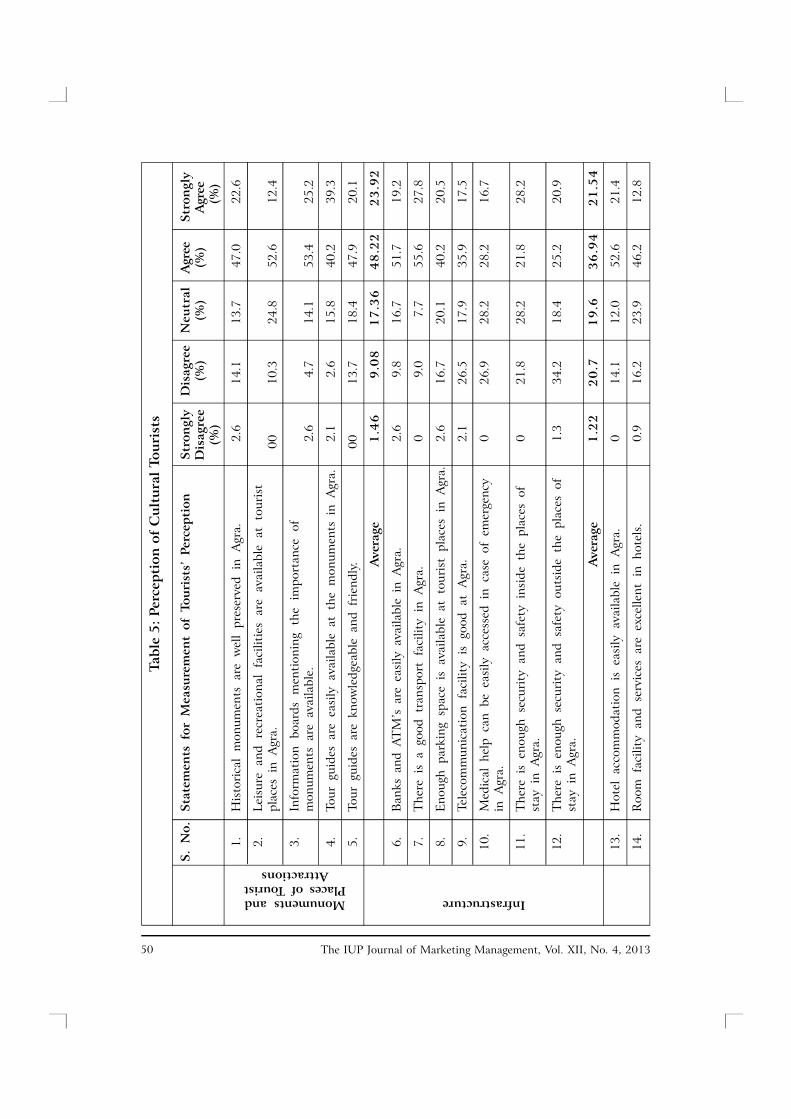
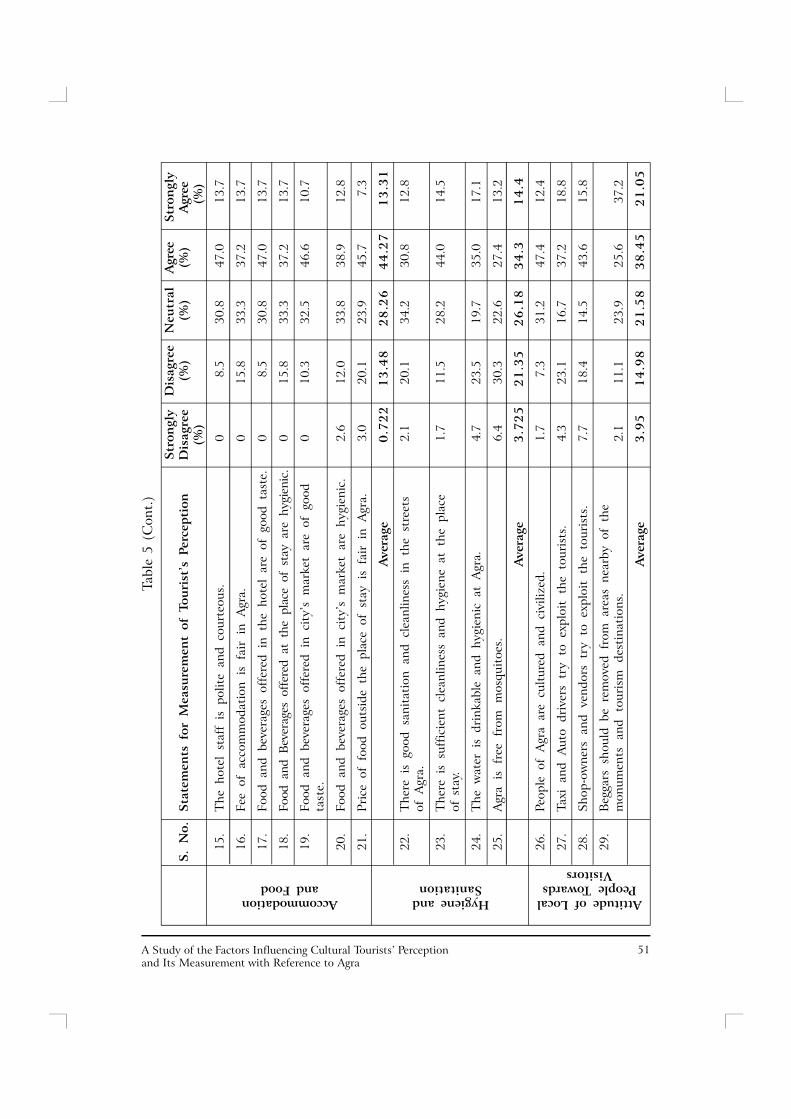
Perception Measurement Statements (Question Nos. 09-37)Table 5 provides the list of statements which were used as scales for the measurement ofperception of cultural tourists. Table 5 demonstrates that the tourists generally ‘stronglyagree’ or ‘agree’ with the statements. For the Category No. 1, i.e., ‘monuments andplaces of tourist attraction’, the overall perception of tourists is favorable (72.19%are strongly agree/agree). Most of the tourists strongly agree/agree that monuments arewell preserved, leisure and recreational facility, information boards and tour guides areeasily available, and tour guides are knowledgeable of the tourist places in Agra. Touristshave given a merely above average score (58.48% strongly agree/agree) to Category No.2 containing 7 variables related to infrastructure. Most of the tourists showed positiveperception towards fairness of infrastructure in Agra, but a huge number of tourists alsofeel that telecommunication facility, medical facility and security inside and outside theplace of accommodation are not sufficient in Agra, and the district administration needsto improve it. Respondents were highly satisfied with the availability of accommodationin Agra. 74% respondents strongly agree/agree with the statement—‘Hotel accommodationis easily available in Agra’. For the remaining variables in the category, ‘accommodationand food’ respondents exhibited their satisfaction in their responses. Agra is aninternational tourist destination. It attracts a huge number of domestic and internationaltourists every year. Unlike several tourist places in Uttar Pradesh, the district
Table 3: Personal Factors vs. Sources of Knowledge About Agra
S. No. Personal Factors Calculated Degree of Table Value 5% Level of2 Freedom of 2
0.05 Significance Ho is
1. Gender 3.174 3 7.815 Accepted
2. Age 27.451 9 16.91 Rejected
3. Marital Status 2.023 3 7.815 Accepted
4. Education 18.559 9 16.91 Rejected
5. Family Annual Income 17.132 9 16.91 Rejected
6. Occupation 8.322 9 16.91 Accepted
Table 4: Personal Factors vs. Duration of Stay in Agra
S. No. Personal Factors Calculated Degree of Table Value 5% Level of2 Freedom of 2
0.05 Significance Ho is
1. Gender 16.282 2 5.991 Rejected
2. Age 5.651 6 12.59 Accepted
3. Marital Status 1.422 2 5.991 Accepted
4. Education 7.376 6 12.59 Accepted
5. Family Annual Income 12.388 6 12.59 Accepted
6. Occupation 9.038 6 12.59 Accepted
The IUP Journal of Marketing Management, Vol. XII, No. 4, 201350
Tabl
e 5:
Per
cept
ion
of
Cul
tura
l To
uris
ts
S. N
o.St
atem
ents
for
Mea
sure
men
t of
Tou
rist
s’ P
erce
ptio
nSt
ron
gly
Dis
agre
eN
eutr
alA
gree
Stro
ngl
yD
isag
ree
(%)
(%)
(%)
Agr
ee(%
) (
%)
1.H
isto
rica
l m
onum
ents
are
wel
l pr
eser
ved
in A
gra.
2.6
14.1
13.7
47.0
22.6
2.Le
isur
e an
d re
crea
tion
al f
acili
ties
are
ava
ilabl
e at
tou
rist
plac
es i
n A
gra.
0010
.324
.852
.612
.4
3.In
form
atio
n bo
ards
men
tion
ing
the
impo
rtan
ce o
fm
onum
ents
are
ava
ilabl
e.2.
64.
714
.153
.425
.2
4.To
ur g
uide
s ar
e ea
sily
ava
ilabl
e at
the
mon
umen
ts i
n A
gra.
2.1
2.6
15.8
40.2
39.3
5.To
ur g
uide
s ar
e kn
owle
dgea
ble
and
frie
ndly
.00
13.7
18.4
47.9
20.1
Ave
rage
1.4
69
.08
17
.36
48
.22
23
.92
6.B
anks
and
AT
M’s
are
eas
ily a
vaila
ble
in A
gra.
2.6
9.8
16.7
51.7
19.2
7.T
here
is
a go
od t
rans
port
fac
ility
in
Agr
a.0
9.0
7.7
55.6
27.8
8.E
noug
h pa
rkin
g sp
ace
is a
vaila
ble
at t
ouri
st p
lace
s in
Agr
a.2.
616
.720
.140
.220
.5
9.Te
leco
mm
unic
atio
n fa
cilit
y is
goo
d at
Agr
a.2.
126
.517
.935
.917
.5
10.
Med
ical
hel
p ca
n be
eas
ily a
cces
sed
in c
ase
of e
mer
genc
y0
26.9
28.2
28.2
16.7
in A
gra.
11.
The
re i
s en
ough
sec
urit
y an
d sa
fety
ins
ide
the
plac
es o
f0
21.8
28.2
21.8
28.2
stay
in
Agr
a.
12.
The
re i
s en
ough
sec
urit
y an
d sa
fety
out
side
the
pla
ces
of1.
334
.218
.425
.220
.9st
ay i
n A
gra.
Ave
rage
1.2
22
0.7
19
.63
6.9
42
1.5
4
13.
Hot
el a
ccom
mod
atio
n is
eas
ily a
vaila
ble
in A
gra.
014
.112
.052
.621
.4
14.
Roo
m f
acili
ty a
nd s
ervi
ces
are
exce
llent
in
hote
ls.
0.9
16.2
23.9
46.2
12.8
Monuments andPlaces of Tourist
Attractions
Infrastructure
51A Study of the Factors Influencing Cultural Tourists’ Perceptionand Its Measurement with Reference to Agra
Tabl
e 5
(Con
t.)
Stro
ngl
yD
isag
ree
Neu
tral
Agr
eeSt
ron
gly
S. N
o.St
atem
ents
for
Mea
sure
men
t of
Tou
rist
’s P
erce
ptio
nD
isag
ree
(%)
(%)
(%)
Agr
ee(%
) (
%)
15.
The
hot
el s
taff
is
polit
e an
d co
urte
ous.
08.
530
.847
.013
.7
16.
Fee
of a
ccom
mod
atio
n is
fai
r in
Agr
a.0
15.8
33.3
37.2
13.7
17.
Food
and
bev
erag
es o
ffer
ed i
n th
e ho
tel
are
of g
ood
tast
e.0
8.5
30.8
47.0
13.7
18.
Food
and
Bev
erag
es o
ffer
ed a
t th
e pl
ace
of s
tay
are
hygi
enic
.0
15.8
33.3
37.2
13.7
19.
Food
and
bev
erag
es o
ffer
ed i
n ci
ty’s
mar
ket
are
of g
ood
010
.332
.546
.610
.7ta
ste.
20.
Food
and
bev
erag
es o
ffer
ed i
n ci
ty’s
mar
ket
are
hygi
enic
.2.
612
.033
.838
.912
.8
21.
Pric
e of
foo
d ou
tsid
e th
e pl
ace
of s
tay
is f
air
in A
gra.
3.0
20.1
23.9
45.7
7.3
Ave
rage
0.7
22
13
.48
28
.26
44
.27
13
.31
22.
The
re i
s go
od s
anit
atio
n an
d cl
eanl
ines
s in
the
str
eets
2.1
20.1
34.2
30.8
12.8
of A
gra.
23.
The
re i
s su
ffic
ient
cle
anlin
ess
and
hygi
ene
at t
he p
lace
1.7
11.5
28.2
44.0
14.5
of s
tay.
24.
The
wat
er i
s dr
inka
ble
and
hygi
enic
at
Agr
a.4.
723
.519
.735
.017
.1
25.
Agr
a is
fre
e fr
om m
osqu
itoe
s.6.
430
.322
.627
.413
.2
Ave
rage
3.7
25
21
.35
26
.18
34
.31
4.4
26.
Peop
le o
f A
gra
are
cult
ured
and
civ
ilize
d.1.
77.
331
.247
.412
.4
27.
Taxi
and
Aut
o dr
iver
s tr
y to
exp
loit
the
tou
rist
s.4.
323
.116
.737
.218
.8
28.
Shop
-ow
ners
and
ven
dors
try
to
expl
oit
the
tour
ists
.7.
718
.414
.543
.615
.8
29.
Beg
gars
sho
uld
be r
emov
ed f
rom
are
as n
earb
y of
the
mon
umen
ts
and
tour
ism
de
stin
atio
ns.
2.1
11.1
23.9
25.6
37.2
Ave
rage
3.9
51
4.9
82
1.5
83
8.4
52
1.0
5
Accommodationand Food
Hygiene andSanitation
Attitude of LocalPeople Towards
Visitors
The IUP Journal of Marketing Management, Vol. XII, No. 4, 201352
administration of Agra pays considerable attention for cleaning the city. Yet touristswere not highly satisfied with the sanitation and hygiene in the city. Tourists have givenonly mediocre score to the variables under the category hygiene and sanitation. Localpeople engaged in providing an experience to the visitors are also a big cause of tourists’dissatisfaction and/or satisfaction. In India tourism sector is highly unorganized. Ahuge number of actors in the tourism sector are unregulated and scattered. Researchshows that the taxi and auto drivers, shopkeepers and vendors are often involved in theexploitation of the tourists in tourist places like Agra. Beggary is common to all thetourist places in India and Agra is not an exception. Men and women of all ages areengaged in begging in Agra. Many a time, beggars irritate the tourists, and more than60% of tourists ‘feel/strongly feel’ that beggars create nuisance at the tourist places andthat the district administration must immediately remove them from the tourist places.
Z-Test (Independent Sample)
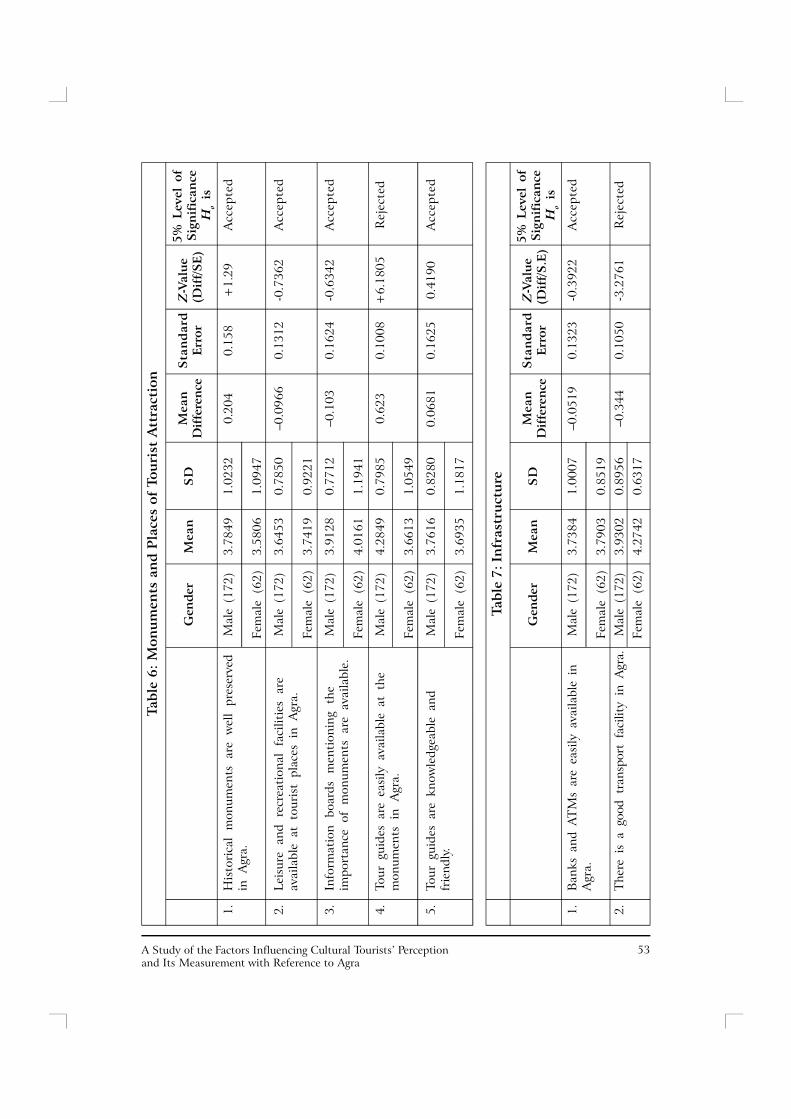
Ho: There is no significant difference between the mean perceptions of male and femaletourists regarding various tourism related variables.
At 5% level of significance, if the difference is more than ±1.96 SE, the null hypothesis,Ho is rejected. It indicates that there is a significant difference between the meanperceptions of male and female tourists. And, if it is less than ±1.96 SE, the nullhypothesis is accepted. It indicates that the difference between mean perceptions ofmale and female tourists is not significant. An insignificant difference between meanperceptions of male and female tourists states that male and female tourists have thesame perception/feeling regarding various tourism-related variables like availability ofaccommodation, quality of food, hygiene and cleanliness, transportation, etc.
Tables 6, 7, 8, 9 and 10 present statistics pertaining to the perception of male andfemale tourists regarding five broad categories affecting the tourists’ perception. Thenumber of variables in Tables 6, 7, 8, 9 and 10 are respectively 5, 7, 9, 4 and 4.
Analysis with Z-test reveals that perception of male and female tourists is significantlydifferent for the variable— availability of tour guides in Agra. And for the remaining variablesthe perception of male and female tourist’s is not significantly different (Table 6).
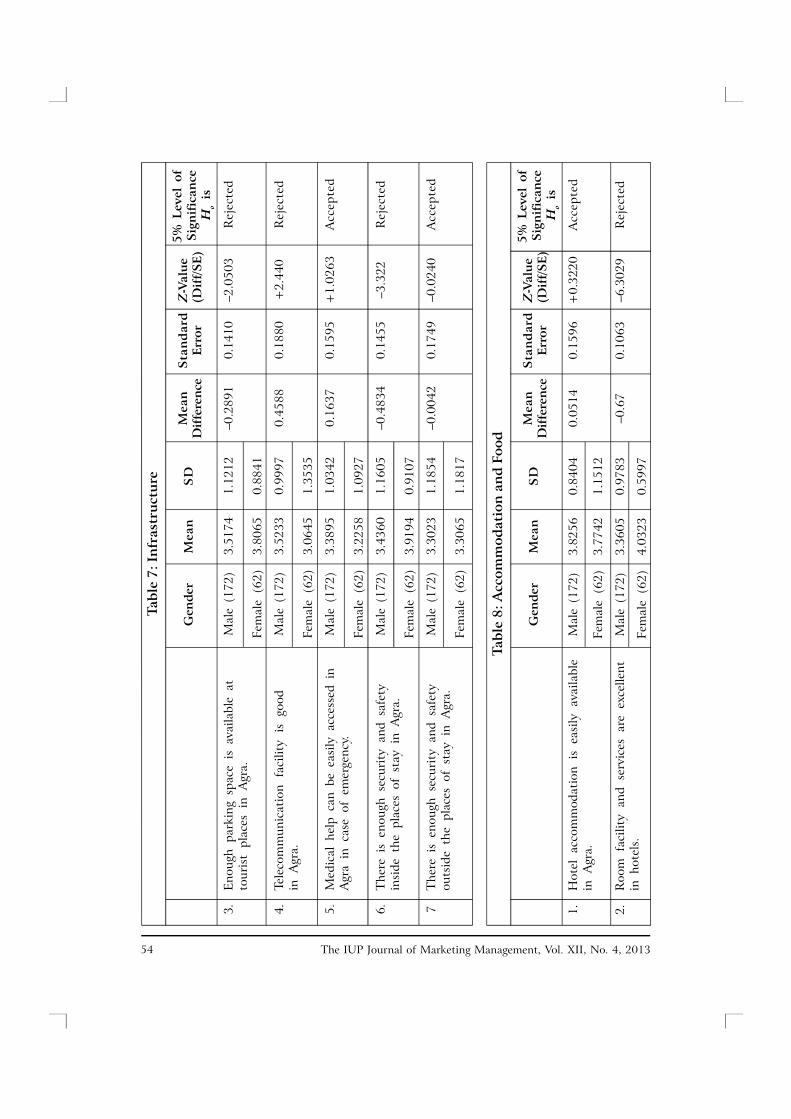
The Z-test indicates that for the variable, ‘availability of Bank’s ATM, medical help,and safety and security outside place to stay, perception of male and female tourists isnot significantly different. Whereas for the variable—fairness of transport facility,sufficiency of parking facility, fairness of tele-communication facility, and availability of safetyand security at the place of stay—the perception of male and female tourists is significantlydifferent (Table 7).
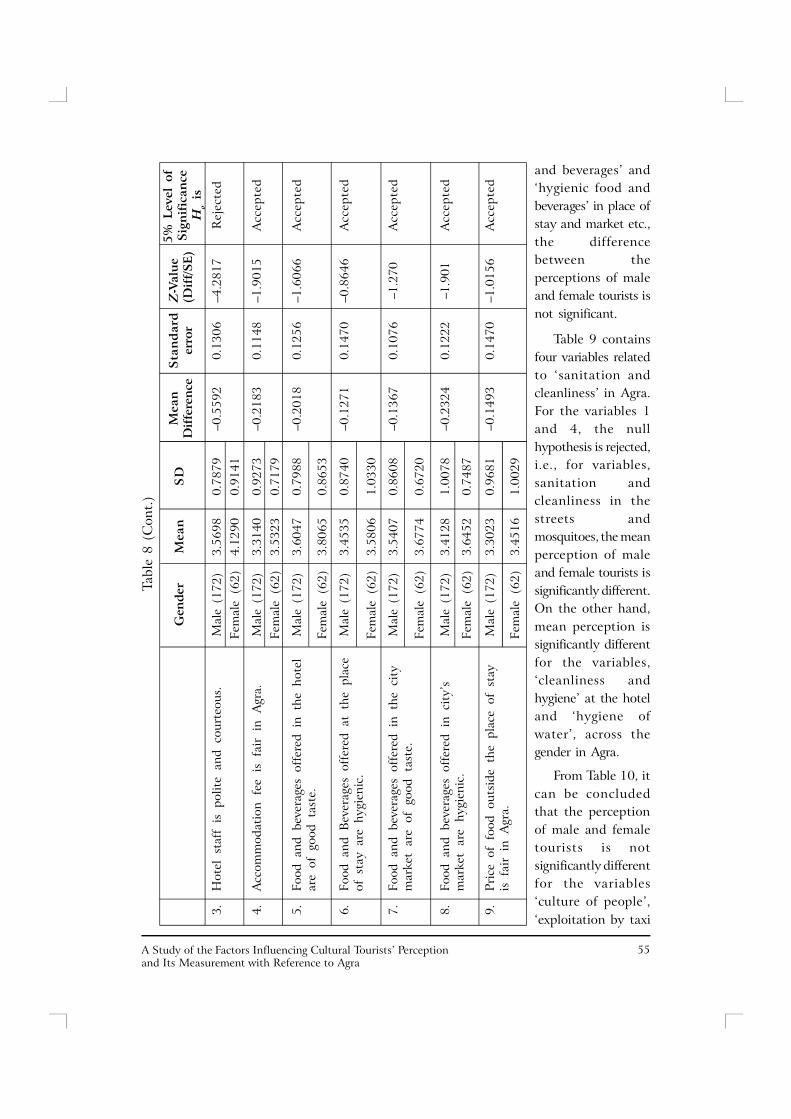
Table 8 contains nine variables under the category, ‘accommodation and food’.Perception of male and female tourists is significantly different for the variables, ‘roomservices’, and ‘humbleness of hotel staff (variable number 2 and 3)’. And for the remainingvariables, ‘availability of hotel accommodation’, ‘fee for accommodation’, ‘taste of food
53A Study of the Factors Influencing Cultural Tourists’ Perceptionand Its Measurement with Reference to Agra
Tabl
e 6:
Mon
umen
ts a
nd
Pla
ces
of T
ouri
st A
ttra
ctio
n
Gen
der
Mea
nS
DM
ean
Sta
nd
ard
Z-V
alue
5% L
evel
of
Dif
fere
nce
Erro
r (
Dif
f/SE
)Si
gnif
ican
ceH
o is
1.H
isto
rica
l m
onum
ents
are
wel
l pr
eser
ved
Mal
e (1
72)
3.78
491.
0232
0.20
40.
158
+1.
29A
ccep
ted
in A
gra.
Fem
ale
(62)
3.58
061.
0947
2.Le
isur
e an
d re
crea
tion
al f
acili
ties
are
Mal
e (1
72)
3.64
530.
7850
–0.0
966
0.13
12-0
.736
2A
ccep
ted
avai
labl
e at
tou
rist
pla
ces
in A
gra.
Fem
ale
(62)
3.74
190.
9221
3.In
form
atio
n bo
ards
m
enti
onin
g th
eM
ale
(172
)3.
9128
0.77
12–0
.103
0.16
24-0
.634
2A
ccep
ted
impo
rtan
ce o
f m
onum
ents
are
ava
ilabl
e.Fe
mal
e (6
2)4.
0161
1.19
41
4.To
ur g
uide
s ar
e ea
sily
ava
ilabl
e at
the
Mal
e (1
72)
4.28
490.
7985
0.62
30.
1008
+6.
1805
Rej
ecte
dm
onum
ents
in
Agr
a.Fe
mal
e (6
2)3.
6613
1.05
49
5.To
ur g
uide
s ar
e kn
owle
dgea
ble
and
Mal
e (1
72)
3.76
160.
8280
0.06
810.
1625
0.41
90A
ccep
ted
frie
ndly
.Fe
mal
e (6
2)3.
6935
1.18
17
Tabl
e 7:
In
fras
truc
ture
Gen
der
Mea
nS
DM
ean
Sta
nd
ard
Z-V
alue
5% L
evel
of
Dif
fere
nce
Erro
r (
Dif
f/S.
E)
Sign
ific
ance
Ho
is
1.B
anks
and
AT
Ms
are
easi
ly a
vaila
ble
inM
ale
(172
)3.
7384
1.00
07–0
.051
90.
1323
-0.3
922
Acc
epte
dA
gra.
Fem
ale
(62)
3.79
030.
8519
2.T
here
is
a go
od t
rans
port
fac
ility
in
Agr
a.M
ale
(172
)3.
9302
0.89
56–0
.344
0.10
50-3
.276
1R
ejec
ted
Fem
ale
(62)
4.27
420.
6317
The IUP Journal of Marketing Management, Vol. XII, No. 4, 201354
Tabl
e 7:
In
fras
truc
ture
Gen
der
Mea
nS
DM
ean
Sta
nd
ard
Z-V
alue
5% L
evel
of
Dif
fere
nce
Erro
r (
Dif
f/SE
)Si
gnif
ican
ceH
o is
3.E
noug
h pa
rkin
g sp
ace
is a
vaila
ble
atM
ale
(172
)3.
5174
1.12
12–0
.289
10.
1410
–2.0
503
Rej
ecte
dto
uris
t pl
aces
in
Agr
a.Fe
mal
e (6
2)3.
8065
0.88
41
4.Te
leco
mm
unic
atio
n fa
cilit
y is
goo
dM
ale
(172
)3.
5233
0.99
970.
4588
0.18
80+
2.44
0R
ejec
ted
in A
gra.
Fem
ale
(62)
3.06
451.
3535
5.M
edic
al h
elp
can
be e
asily
acc
esse
d in
Mal
e (1
72)
3.38
951.
0342
0.16
370.
1595
+1.
0263
Acc
epte
dA
gra
in c
ase
of e
mer
genc
y.Fe
mal
e (6
2)3.
2258
1.09
27
6.T
here
is
enou
gh s
ecur
ity
and
safe
tyM
ale
(172
)3.
4360
1.16
05–0
.483
40.
1455
–3.3
22R
ejec
ted
insi
de t
he p
lace
s of
sta
y in
Agr
a.Fe
mal
e (6
2)3.
9194
0.91
07
7T
here
is
enou
gh s
ecur
ity
and
safe
tyM
ale
(172
)3.
3023
1.18
54–0
.004
20.
1749
–0.0
240
Acc
epte
dou
tsid
e th
e pl
aces
of
stay
in
Agr
a.Fe
mal
e (6
2)3.
3065
1.18
17
Tabl
e 8:
Acc
omm
odat
ion
an
d Fo
od
Gen
der
Mea
nS
DM
ean
Sta
nd
ard
Z-V
alue
5% L
evel
of
Dif
fere
nce
Erro
r (
Dif
f/SE
)Si
gnif
ican
ceH
o is
1.H
otel
acc
omm
odat
ion
is e
asily
ava
ilabl
eM
ale
(172
)3.
8256
0.84
040.
0514
0.15
96+
0.32
20A
ccep
ted
in A
gra.
Fem
ale
(62)
3.77
421.
1512
2.R
oom
fac
ility
and
ser
vice
s ar
e ex
celle
ntM
ale
(172
)3.
3605
0.97
83–0
.67
0.10
63–6
.302
9R
ejec
ted
in h
otel
s.Fe
mal
e (6
2)4.
0323
0.59
97
55A Study of the Factors Influencing Cultural Tourists’ Perceptionand Its Measurement with Reference to Agra
and beverages’ and‘hygienic food andbeverages’ in place ofstay and market etc.,the differencebetween theperceptions of maleand female tourists isnot significant.
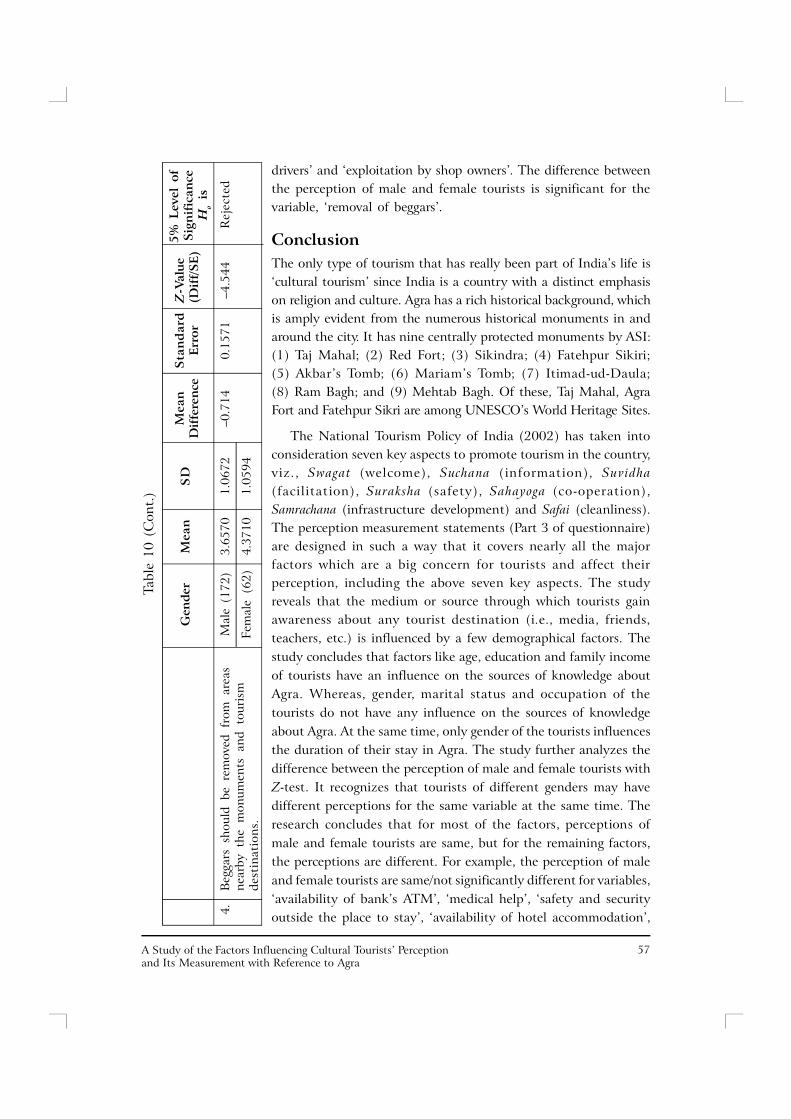
Table 9 containsfour variables relatedto ‘sanitation andcleanliness’ in Agra.For the variables 1and 4, the nullhypothesis is rejected,i.e., for variables,sanitation andcleanliness in thestreets andmosquitoes, the meanperception of maleand female tourists issignificantly different.On the other hand,mean perception issignificantly differentfor the variables,‘cleanliness andhygiene’ at the hoteland ‘hygiene ofwater’, across thegender in Agra.
From Table 10, itcan be concludedthat the perceptionof male and femaletourists is notsignificantly differentfor the variables‘culture of people’,‘exploitation by taxi
Tabl
e 8
(Con
t.)
Gen
der
Mea
nS
DM
ean
Sta
nd
ard
Z-V
alue
5% L
evel
of
Dif
fere
nce
erro
r (
Dif
f/SE
)Si
gnif
ican
ceH
ois
3.H
otel
sta
ff i
s po
lite
and
cour
teou
s.M
ale
(172
)3.
5698
0.78
79–0
.559
20.
1306
–4.2
817
Rej
ecte
dFe
mal
e (6
2)4.
1290
0.91
41
4.A
ccom
mod
atio
n fe
e is
fai
r in
Agr
a.M
ale
(172
)3.
3140
0.92
73–0
.218
30.
1148
–1.9
015
Acc
epte
dFe
mal
e (6
2)3.
5323
0.71
79
5.Fo
od a
nd b
ever
ages
off
ered
in
the
hote
lM
ale
(172
)3.
6047
0.79
88–0
.201
80.
1256
–1.6
066
Acc
epte
dar
e of
goo
d ta
ste.
Fem
ale
(62)
3.80
650.
8653
6.Fo
od a
nd B
ever
ages
off
ered
at
the
plac
eM
ale
(172
)3.
4535
0.87
40–0
.127
10.
1470
–0.8
646
Acc
epte
dof
sta
y ar
e hy
gien
ic.
Fem
ale
(62)
3.58
061.
0330
7.Fo
od a
nd b
ever
ages
off
ered
in
the
city
Mal
e (1
72)
3.54
070.
8608
–0.1
367
0.10
76–1
.270
Acc
epte
dm
arke
t ar
e of
goo
d ta
ste.
Fem
ale
(62)
3.67
740.
6720
8.Fo
od a
nd b
ever
ages
off
ered
in
city
’sM
ale
(172
)3.
4128
1.00
78–0
.232
40.
1222
–1.9
01A
ccep
ted
mar
ket
are
hygi
enic
.Fe
mal
e (6
2)3.
6452
0.74
87
9.Pr
ice
of f
ood
outs
ide
the
plac
e of
sta
yM
ale
(172
)3.
3023
0.96
81–0
.149
30.
1470
–1.0
156
Acc
epte
dis
fai
r in
Agr
a.Fe
mal
e (6
2)3.
4516
1.00
29

The IUP Journal of Marketing Management, Vol. XII, No. 4, 201356
Tabl
e 10
: A
ttit
ude
of L
ocal
Peo
ple
Tow
ards
Vis
itor
s
Gen
der
Mea
nS
DM
ean
Sta
nd
ard
Z-V
alue
5% L
evel
of
Dif
fere
nce
Erro
r (
Dif
f/SE
)Si
gnif
ican
ceH
o is
1.Pe
ople
of
Agr
a ar
e cu
ltur
ed a
nd c
ivili
zed.
Mal
e (1
72)
3.62
790.
8590
0.04
70.
1268
+0.
373
Acc
epte
d
Fem
ale
(62)
3.58
060.
8598
2.Ta
xi a
nd a
uto
driv
ers
try
to e
xplo
it t
heM
ale
(172
)3.
4244
1.05
97–0
.027
0.19
62–0
.138
Acc
epte
dto
uris
ts.
Fem
ale
(62)
3.45
161.
4105
3.Sh
op-o
wne
rs a
nd v
endo
rs t
ry t
o ex
ploi
tM
ale
(172
)3.
3488
1.13
19–0
.248
0.18
61–1
.332
Acc
epte
dth
e to
uris
ts.
Fem
ale
(62)
3.59
681.
2989
Tabl
e 9:
San
itat
ion
an
d C
lean
lin
ess
Gen
der
Mea
nS
DM
ean
Sta
nd
ard
Z-V
alue
5% L
evel
of
Dif
fere
nce
Erro
r (
Dif
f/SE
)Si
gnif
ican
ceH
o is
1.T
here
is
good
san
itat
ion
and
clea
nlin
ess
Mal
e (1
72)
3.23
260.
9694
–0.3
319
0.15
39–2
.156
5R
ejec
ted
in t
he s
tree
ts o
f A
gra.
Fem
ale
(62)
3.56
451.
0654
2.T
here
is
suff
icie
nt c
lean
lines
s an
dM
ale
(172
)3.
5291
0.88
14–0
.196
70.
1502
–1.3
095
Acc
epte
dhy
gien
e at
the
pla
ce o
f st
ay.
Fem
ale
(62)
3.72
581.
0584
3.W
ater
is
drin
kabl
e an
d hy
gien
ic i
n A
gra.
Mal
e (1
72)
3.09
301.
1661
–1.0
199
0.12
57–0
.811
3A
ccep
ted
Fem
ale
(62)
4.11
290.
7037
4.A
gra
is f
ree
from
mos
quit
oes.
Mal
e (1
72)
3.01
161.
1496
–0.3
594
0.17
30–2
.077
4R
ejec
ted
Fem
ale
(62)
3.37
101.
1767
57A Study of the Factors Influencing Cultural Tourists’ Perceptionand Its Measurement with Reference to Agra
Tabl
e 10
(C
ont.
)
Gen
der
Mea
nS
DM
ean
Sta
nd
ard
Z-V
alue
5% L
evel
of
Dif
fere
nce
Erro
r (
Dif
f/SE
)Si
gnif
ican
ceH
ois
4.B
egga
rs s
houl
d be
rem
oved
fro
m a
reas
Mal
e (1
72)
3.65
701.
0672
–0.7
140.
1571
–4.5
44R
ejec
ted
near
by t
he m
onum
ents
and
tou
rism
dest
inat
ions
.Fe
mal
e (6
2)4.
3710
1.05
94
drivers’ and ‘exploitation by shop owners’. The difference betweenthe perception of male and female tourists is significant for thevariable, ‘removal of beggars’.
ConclusionThe only type of tourism that has really been part of India’s life is‘cultural tourism’ since India is a country with a distinct emphasison religion and culture. Agra has a rich historical background, whichis amply evident from the numerous historical monuments in andaround the city. It has nine centrally protected monuments by ASI:(1) Taj Mahal; (2) Red Fort; (3) Sikindra; (4) Fatehpur Sikiri;(5) Akbar’s Tomb; (6) Mariam’s Tomb; (7) Itimad-ud-Daula;(8) Ram Bagh; and (9) Mehtab Bagh. Of these, Taj Mahal, AgraFort and Fatehpur Sikri are among UNESCO’s World Heritage Sites.
The National Tourism Policy of India (2002) has taken intoconsideration seven key aspects to promote tourism in the country,viz., Swagat (welcome), Suchana (information), Suvidha(facilitation), Suraksha (safety), Sahayoga (co-operation),Samrachana (infrastructure development) and Safai (cleanliness).The perception measurement statements (Part 3 of questionnaire)are designed in such a way that it covers nearly all the majorfactors which are a big concern for tourists and affect theirperception, including the above seven key aspects. The studyreveals that the medium or source through which tourists gainawareness about any tourist destination (i.e., media, friends,teachers, etc.) is influenced by a few demographical factors. Thestudy concludes that factors like age, education and family incomeof tourists have an influence on the sources of knowledge aboutAgra. Whereas, gender, marital status and occupation of thetourists do not have any influence on the sources of knowledgeabout Agra. At the same time, only gender of the tourists influencesthe duration of their stay in Agra. The study further analyzes thedifference between the perception of male and female tourists withZ-test. It recognizes that tourists of different genders may havedifferent perceptions for the same variable at the same time. Theresearch concludes that for most of the factors, perceptions ofmale and female tourists are same, but for the remaining factors,the perceptions are different. For example, the perception of maleand female tourists are same/not significantly different for variables,‘availability of bank’s ATM’, ‘medical help’, ‘safety and securityoutside the place to stay’, ‘availability of hotel accommodation’,
The IUP Journal of Marketing Management, Vol. XII, No. 4, 201358
‘taste of food and beverages’, ‘cleanliness and hygiene at the hotel and hygiene of water’,‘culture of people’, ‘exploitation by taxi drivers’, ‘exploitation by shop owners’, etc.Whereas perception of male and female tourists are not same or significantly differentfor the variables, ‘availability of tour guides’, ‘fairness of transport facility’, ‘sufficiencyof parking facility’, ‘fairness of telecommunication facility’, ‘availability of safety andsecurity at the place of stay’, ‘room services’, ‘humbleness of hotel staff ’, ‘sanitation andcleanliness in the streets’, and ‘removal of beggars’.J
Bibliography1. United Nations (1991), “Resolution of the International Conference on Travel and
Tourism Statistics, Ottawa: Canada”, pp. 4-6, United Nations. Economic and SocialCouncil; United Nations. Economic Commission for Africa, June 24-28.
2. Annual Report 2010-2011, Ministry of Tourism, Government of India, p. 66.
3. Beerli A and Martin J D (2003), “Tourists Characteristics and the Perceived Imageof Tourist Destinations: A Quantitative Analysis – A Case Study of Lanzarote,Spain”, Tourism Management, Vol. 25, No. 5, pp. 623-636.
4. Bonink C and Richards G (1992), “Cultural Tourism in Europe, A Transnational ResearchInitiative of ATLAS Consortium”, ATLAS, University of North London, October.
5. Clark J (1990), “Pessimism versus Populism: The Problematic Politics of PopularCulture”, in Richard Butsch (Ed.), For Fun and Profit: The Transformation of Leisureinto Consumption, pp. 28-44, Temple University Press.
6. Cohen E (1979), “A Phenomenology of Tourist Experiences”, Sociology, Vol. 13,No. 2, pp. 179-202.
7. Cohen E (1988), “Authenticity and Commoditization in Tourism”, Annals of TourismResearch, Vol. 15, No. 3, pp. 371-386.
8. Dolnicar S (2002), “Activity-Based Market Sub-Segmentation of Cultural Tourists”,Journal of Hospitality and Tourism Management, Vol. 9, No. 2, pp. 94-105.
9. ECTARC (1989), “Contribution to Drafting of Chapters for Cultural Tourism”, inRichard Butsch (Ed.), For Fun And Profit: Transformation of Leisure in to Consumption,pp. 28-44, Temple University Press, Philadelphia.
10. Foo L and Rossetto A (1998), “Cultural Tourism in Australia: Characteristics andMotivations”, Bureau of Tourism Research, Occasional Paper No. 27, Canberra,Australia.
11. Gupta S P (1997), Statistical Method, 28th Edition, Sultan Chand and Sons,pp. A 4.3-A 4.8.
12. Hall E T (1976), Beyond Culture, p. 16, Anchor Books/Doubleday, New York.
59A Study of the Factors Influencing Cultural Tourists’ Perceptionand Its Measurement with Reference to Agra
13. Hofstede G (1980), Culture’s Consequences: International Differences in Work-RelatedValues, pp. 21-23, Sage Publications, London.
14. Hughes H L (1996), “Redefining Cultural Tourism”, Annals of Tourism Research,Vol. 23, No. 3, pp. 707-709.
15. Hughes H L (2002), “Culture and Tourism: A Framework for Further Analysis”,Managing Leisure, Vol. 7, No. 3, pp. 164-175.
16. “India Tourism Statistics at a Glance: 2010”, pp. 1-17, Ministry of Tourism,Governemnt of India.
17. Jefferson A and Lickorish L (1988), Marketing Tourism: A Practical Guide, p. 59,Longman, Harlow.
18. Johnson N (1995), “Cast in Stone: Monuments, Geography, and Nationalism”,Environment and Planning D: Society and Space, Vol. 13, No. 1, pp. 51-65.
19. Kesic T (1999), Consumer Behavior, p. 119, Adeco, Zagreb.
20. Kivela J (1996) “Marketing in the Restaurant Business: A Theoretical Model forIdentifying Customers Determinant Choice Variable and their Impact on RepeatPurchase in the Restaurant Industry”, Austilian Journal of Hospitality Mgt., Vol. 3,No. 1, pp. 13-23.
21. Kotler P (1984), Marketing Management: Analysis, Planning, and Control, 5th Edition,p. 463, Prentice-Hall, New York.
22. Lonner W J (1994), “Culture and Human Diversity”, in E J Trickett, R J Wattsand Birman D (Eds.), Human Diversity: Perspectives on People in Context ,pp. 230-243, San Francisco, Jossey-Bass.
23. MacCannell D (1976), The Tourist: A New Theory of the Leisure Class ,p. 25, Macmillan, London.
24. Mcintosh R W and Goeldner C (1986), Tourism: Principles, Practices and Philosophies,5th Edition, Wiley, New York.
25. Mcintosh R W and Goeldner C (1990), Tourism: Principles, Practices and Philosophies,6th Edition, Wiley, New York.
26. Mckercher B (2002), “Towards a Classification of Cultural Tourists”, InternationalJournal of Tourism Research, Vol. 4, No. 1, pp. 29-38.
27. Mckercher B and Du Cros H (2003), “Testing a Cultural Tourism Typology”, TheInternational Journal of Tourism Research, Vol. 5, No. 1, pp. 45-58.
28. Medlik S and Middleton V T C (1973), “Product Formulation in Tourism”, Tourismand Marketing, Vol. 13, Berne: AIEST.
29. Mulholland J (1991), The Language of Negotiation, Routledge: London.
The IUP Journal of Marketing Management, Vol. XII, No. 4, 201360
30. “National Tourism Policy” (2002), p. 6, Department of Tourism, Ministry of Tourismand Culture, Government of India.
31. Palmer C (1999), “Tourism and the Symbols of Identity”, Tourism Management,Vol. 20, pp. 313-321.
32. Richards W S (1993), How to Market Tourist Attractions, Festivals and Events, Longman,London.
33. Rust R T and Oliver R L (1994), “Service Quality: Insights and ManagerialImplication From The Frontier”, in R T Rust and R L Oliver (Eds.), Service Quality:New Directions in Theory and Practice, pp. 1-19, Thousands Oaks, Sage, CA.
34. Schiffman L G and Kanuk L L (2004), Consumer Behavior, p. 158, Pearson PrenticeHall, New Jersey.
35. Silberberg T (1995), “Cultural Tourism and Business Opportunities for Museumsand Heritage Sites”, Tourism Management, Vol. 16, No. 5, pp. 361-365.
36. Singh L K (2008), Indian Cultural Heritage Perspective for Tourism, p. 109, ISHABooks, New Delhi.
37. Stebbins R A (1996), “Cultural Tourism as Serious Leisure”, Annals of TourismResearch, Vol. 23, No. 4, pp. 948-950.
38. Tomlinson J (1991), “Cultural Emperialism: A Critical Introduction”, p. 4, Printer:London.
39. “Tourism Statistics at A Glance” (2011), pp. 2, 4, 5, 10, 15, Ministry of Tourism,Government of India.
40. Travel and Tourism Economic Impact 2012: India, World Travel and Tourism Council(WTTC), p. 12.
41. Travel and Tourism Economic Impact 2013: India, World Travel and Tourism Council(WTTC) pp. 2, 3, 4, 6.
42. Williams R (1976), Keywords: A Vocabulary of Culture and Society, p. 87, London.
43. Witt S F and Moutinho L (1994), Tourism Marketing and Management Handbook,2nd Edition, Prentice Hall: London.
44. Wood R E (1984), “Ethnic Tourism, the State and Cultural Change in SoutheastAsia”, Annals of Tourism Research, Vol. 11, pp. 186-197.
45. WTO (2000), “Cultural Heritage and Tourism Development”, Report on theInternational Conference on Cultural Tourism, Cambodia, WTO.
46. www.agra.nic.in
47. Zeppel H (1992), “Cultural Tourism in Australia: A Growing Travel Trend”, MaterialCulture Unit/Department of Tourism, James Cook, Townsville.
61A Study of the Factors Influencing Cultural Tourists’ Perceptionand Its Measurement with Reference to Agra
Appendix
A Study of Cultural Tourist’s Perception of Agra (UP)Questionnaire
Part 1: Personal Profile
Please indicate the most appropriate response.
1. What is your gender?
a. Male b. Female
2. What is your age (years)?
a. <20 b. Between 21-40
c. Between 41-60 d. >61
3. What is your marital status?
a. Married b. Unmarried
4. What is your education?
a. School b. Undergraduate
c. Postgraduate d. Others
5. What is your family’s annual income ( )?
a. <100,000 b. 100,000 -300,000
c. 300,000-500,000 d. >500,000
6. What is your occupation?
a. Service b. Business
c. Student d. Others
Part 2: Trip to Agra
7. How did you come to know about Agra/Sources of knowledge about Agra?
a. Media Advertisement/News b. Friends
c. Family/Teachers d. Others
8. What is your duration of stay in Agra?
a. < 1 day/24 hours b. 2-4 days
c. 5-7 days d. > 7 days
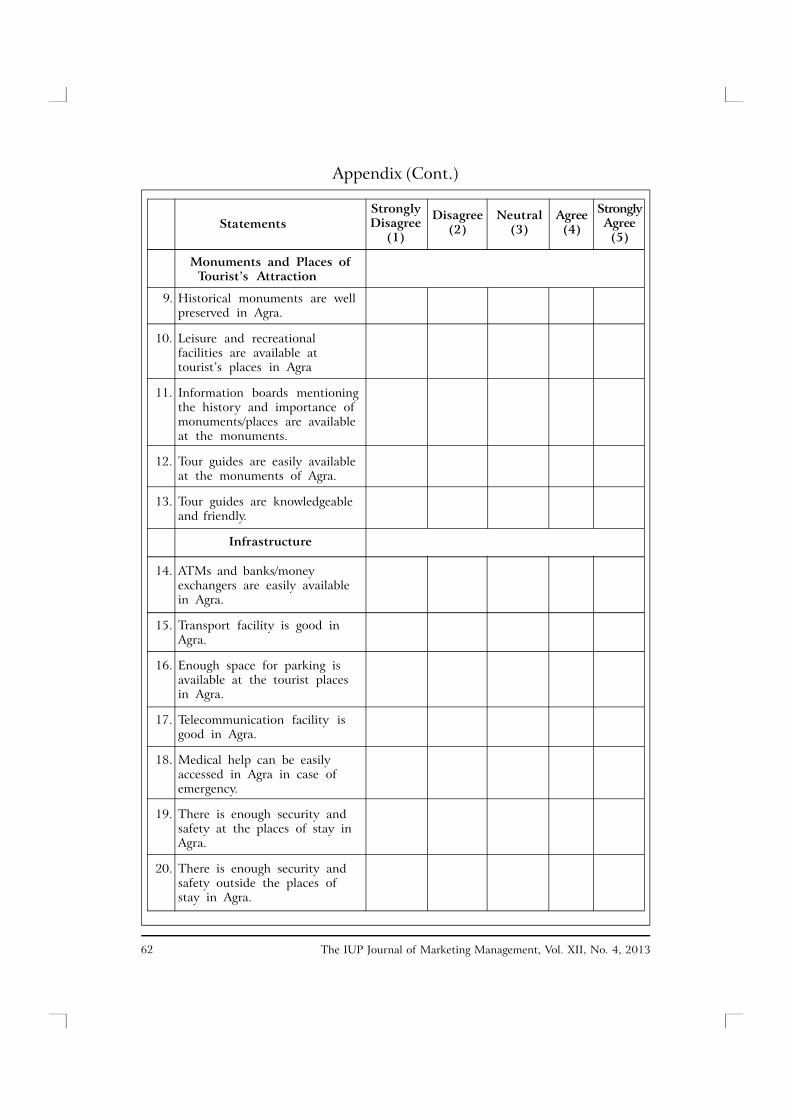
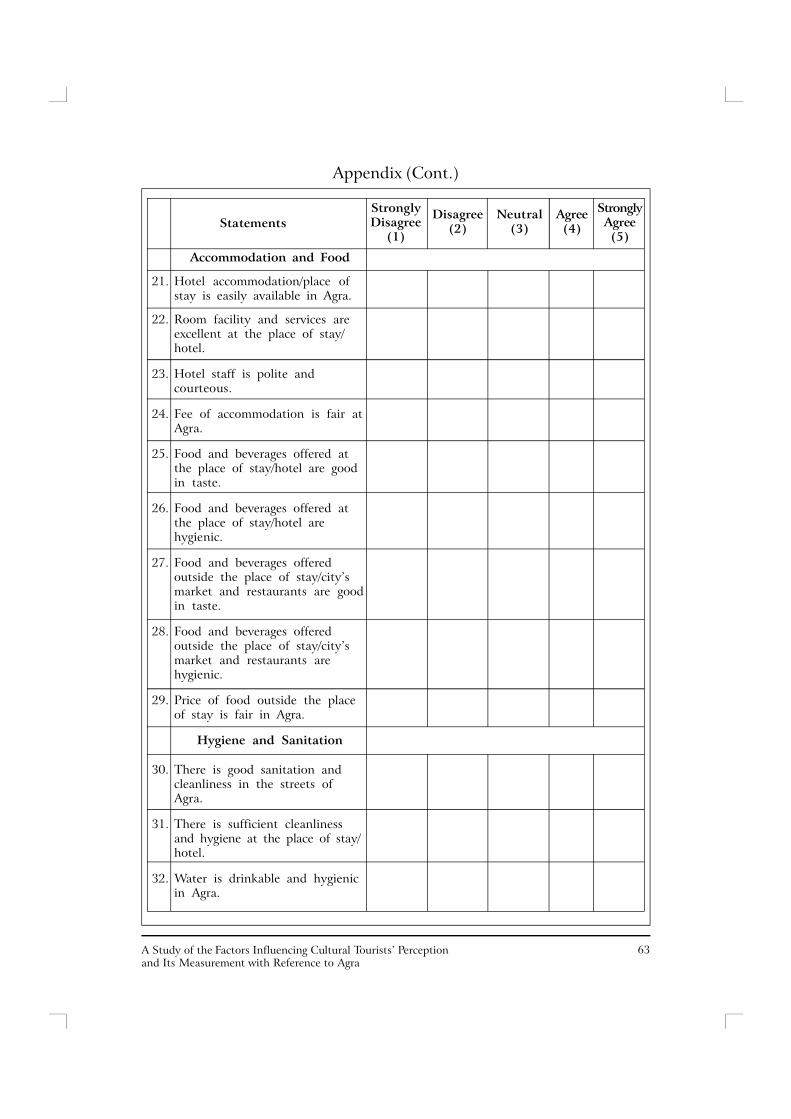
Part 3The following statements relate to your opinions regarding various tourism-relatedfeatures which may affect your perception of Agra. Please show the extent to which youthink Agra offers the features given in the statements. If you feel a feature is not atall present in Agra, tick the number 1. If you feel a feature is absolutely available inAgra, tick 5. If your feelings are less strong, tick one of the numbers in the middle.
The IUP Journal of Marketing Management, Vol. XII, No. 4, 201362
Monuments and Places ofTourist’s Attraction
9. Historical monuments are wellpreserved in Agra.
10. Leisure and recreationalfacilities are available attourist’s places in Agra
11. Information boards mentioningthe history and importance ofmonuments/places are availableat the monuments.
12. Tour guides are easily availableat the monuments of Agra.
13. Tour guides are knowledgeableand friendly.
Infrastructure
14. ATMs and banks/moneyexchangers are easily availablein Agra.
15. Transport facility is good inAgra.
16. Enough space for parking isavailable at the tourist placesin Agra.
17. Telecommunication facility isgood in Agra.
18. Medical help can be easilyaccessed in Agra in case ofemergency.
19. There is enough security andsafety at the places of stay inAgra.
20. There is enough security andsafety outside the places ofstay in Agra.
StronglyDisagree
(1)
Disagree(2)
Neutral(3)
Agree(4)
StronglyAgree(5)
Statements
Appendix (Cont.)
63A Study of the Factors Influencing Cultural Tourists’ Perceptionand Its Measurement with Reference to Agra
Appendix (Cont.)
StronglyDisagree
(1)
Disagree(2)
Neutral(3)
Agree(4)
StronglyAgree(5)
Statements
Accommodation and Food
21. Hotel accommodation/place ofstay is easily available in Agra.
22. Room facility and services areexcellent at the place of stay/hotel.
23. Hotel staff is polite andcourteous.
24. Fee of accommodation is fair atAgra.
25. Food and beverages offered atthe place of stay/hotel are goodin taste.
26. Food and beverages offered atthe place of stay/hotel arehygienic.
27. Food and beverages offeredoutside the place of stay/city’smarket and restaurants are goodin taste.
28. Food and beverages offeredoutside the place of stay/city’smarket and restaurants arehygienic.
29. Price of food outside the placeof stay is fair in Agra.
Hygiene and Sanitation
30. There is good sanitation andcleanliness in the streets ofAgra.
31. There is sufficient cleanlinessand hygiene at the place of stay/hotel.
32. Water is drinkable and hygienicin Agra.

The IUP Journal of Marketing Management, Vol. XII, No. 4, 201364
StronglyDisagree
(1)
Disagree(2)
Neutral(3)
Agree(4)
StronglyAgree(5)
Statements
Appendix (Cont.)
33. Agra is free from mosquitoes.
34. People of Agra are cultured andcivilized.
35. Taxi and auto drivers try toexploit the tourists.
36. Shop-owners and vendors try toexploit the tourists.
37. Beggars should be removed fromareas nearby the monumentsand tourism destinations/beggarnuisance should be controlled.
Reference # 03J-2013-11-03-01

Reproduced with permission of the copyright owner. Further reproduction prohibited withoutpermission.