Overview of the Justice Center for Bronx DD Family Support Conference May 22, 2014.

A Study of Procedural Justice & Criminal Justice System Legitimacy Ensuring a high quality of justice for all and increasing New Yorkers’
trust and confidence in the justice system
Rachel Johnston Director of Research
Camila Gripp Research Manager
Thomas O’Brien Postdoctoral Fellow
Caroline Sarnoff Executive Director
Alexandra Cox Postdoctoral Fellow and Lecturer
at the University of Essex

@JCollaboratory
Table of ContentsProject Overview ������������������������������������������������������������������������������������������1Survey Design & Implementation ����������������������������������������������������������������������������������������������������������� 2
Descriptive Statistics of Survey Sample ������������������������������������������������������������������������������������������������3
Descriptive Statistics of Interview Sample ������������������������������������������������������������������������������������������� 8
Perceptions of ‘Community’ ������������������������������������������������������������������� 10Neighborhood Identification, Participation, & Safety �����������������������������������������������������������������������15
Neighborhood Identity (Survey Data) ������������������������������������������������������������������������������������������������16
Community Strength (Interview Data) ��������������������������������������������������������������������������������������������������12
Neighborhood Participation (Survey and Interview Data) �������������������������������������������������������������22
Neighborhood Safety (Survey and Interview Data) ������������������������������������������������������������������������� 27
Perceptions of ‘Government’ �����������������������������������������������������������������34Cooperation and Participation with Government ���������������������������������������������������������������������������� 34
Understanding of City Government and Services (Interview Data) �������������������������������������������� 34
Community Voice in Public Policy (Survey and Interview Data) �������������������������������������������������� 37
Community Cooperation with Police (Survey Data) ������������������������������������������������������������������������ 43
Perceptions of Police (NYPD) ����������������������������������������������������������������49Personal Experiences with Police in the Neighborhood (Survey Data) ������������������������������������49
Differences in Contact �����������������������������������������������������������������������������������������������������������������������������50
Feelings About Police Contact��������������������������������������������������������������������������������������������������������������50
Reason for Contact �����������������������������������������������������������������������������������������������������������������������������������54
Policing Legitimacy and Effectiveness (Survey Data) ����������������������������������������������������������������������61
Initiatives to Build Trust with Community (Survey Data) �����������������������������������������������������������������64
Perceptions of Sincerity (Survey and Interview Data) ��������������������������������������������������������������������65
Stop, Question, and Frisk (Survey Data) ���������������������������������������������������������������������������������������������69

@JCollaboratory
Racial Disparities and Procedural Injustice ������������������������������������������73Neighborhood Disadvantage ���������������������������������������������������������������������������������������������������������������� 73
Procedural Justice and Access to Resources: Opportunities for Improvement �������������������� 74
Conclusion ��������������������������������������������������������������������������������������������������76References �������������������������������������������������������������������������������������������������������������������������������������������������� 78
Acknowledgements ��������������������������������������������������������������������������������������������������������������������������������� 80
TABLES
Table A-1 Self-Reported Race/Ethnicity of Respondents by Gender Identity �������������������������������������������������������������������������������������4Table A-2 Survey Respondents & NYC Residents by Borough ������������������������������������������������������������������������������������������������������������� 5Table A-3 New York City Registered Voters by Party as of 1 November 2017����������������������������������������������������������������������������������� 6Table A-4: Self-Reported 2016 Family Income of Survey Respondents and New York City Residents, 2015 (estimated) ����7Table B-1 Mean Age of Survey and Interview Participants ���������������������������������������������������������������������������������������������������������������������� 8Table B-2 Interviewees by Gender and Race/Ethnicity���������������������������������������������������������������������������������������������������������������������������� 9Table B-3 Percentage of Female Interviewees by Race / Ethnicity ���������������������������������������������������������������������������������������������������� 10Table B-4 Interviewees and 2017 NYC Population by Borough ���������������������������������������������������������������������������������������������������������� 10Table B-5 Self-Reported 2016 Family Income of Interviewees ������������������������������������������������������������������������������������������������������������ 12Table B-6 Highest Level of Education Completed by Interviewees ����������������������������������������������������������������������������������������������������13Table 1 Group-based Differences in Reported Neighborhood Engagement on 1 (Never) to 4 (Frequently) Scale �������������� 23Table 2 Involvement in Community Activities ������������������������������������������������������������������������������������������������������������������������������������������ 24Table 3 Group-based Differences in Reported Trust, Social Cohesion, Collective Efficacy, and Beliefs About Safety in the Neighborhood on 1 (Strongly Disagree) to 5 (Strongly Agree) Scale ��������������������������������������������������������������������������������������������������27Table 4 Interview Responses to Neighborhood Safety ������������������������������������������������������������������������������������������������������������������������ 30Table 5 Interviewees Perception of Voice in Government ������������������������������������������������������������������������������������������������������������������ 39Table 6 Contact with Police by Respondent Age ����������������������������������������������������������������������������������������������������������������������������������� 49
FIGURES
Figure A-1 Survey Respondents by Age Group and Gender Identity ���������������������������������������������������������������������������������������������������3Figure A-2 Race of Survey Respondents and New York City Residents ���������������������������������������������������������������������������������������������4Figure A-3 Survey Respondents by Years of Residence in Current Neighborhood ������������������������������������������������������������������������ 5Figure A-4 Self-Reported Political Orientation of Survey Respondents ���������������������������������������������������������������������������������������������� 6Figure A-5: Highest Level of Education Completed by Survey Respondents������������������������������������������������������������������������������������7Figure B-1 Interviewees by Age Group and Gender Identity ����������������������������������������������������������������������������������������������������������������� 8Figure B-2 Interviews by Borough of Residence ���������������������������������������������������������������������������������������������������������������������������������������11Figure B-3 Estimated Length of Residence in Current Neighborhood �����������������������������������������������������������������������������������������������11

@JCollaboratory
Figure B-4 Self-Reported Political Orientation of Interviewees ����������������������������������������������������������������������������������������������������������� 12Figure B-5 Highest Level of Education Completed by Interviewees ��������������������������������������������������������������������������������������������������13Figures 1 and 2 Neighborhood Identification (responses to survey questions 3 and 4) �������������������������������������������������������������� 15Figure 3 Tag Cloud of Most Frequently Used Words by Interview Participants when Defining Community ������������������������� 16Figure 4 Do You Feel a Sense of Community in Your Neighborhood? ����������������������������������������������������������������������������������������������17Figure 5 What Does a Strong Neighborhood Mean to You? ���������������������������������������������������������������������������������������������������������������20Figure 6 Interview Mentions of Positive & Negative Neighborhood Qualities ������������������������������������������������������������������������������20Figure 7 Tag Cloud of Most Frequently Mentioned Positive Qualities ���������������������������������������������������������������������������������������������� 21Figure 8 Tag Cloud of Responses to Neighborhood Involvement ����������������������������������������������������������������������������������������������������25Figure 9 Tag Cloud of Responses to Potential Interest in Opportunities for Community Participation ����������������������������������26 Figure 10 Neighborhood Safety by Income ���������������������������������������������������������������������������������������������������������������������������������������������29Figure 11 Residents’ Beliefs about Most Frequent Crimes by Percentage of Valid Responses ��������������������������������������������������31Figure 12 City Services Mentioned During Community Interviews ��������������������������������������������������������������������������������������������������� 35Figure 13 Number of Mentions of City Agencies with Impact on Community Life ������������������������������������������������������������������������ 36Figure 14 Beliefs about Government Consideration in Defining Neighborhood Problems by Race ��������������������������������������� 38Figure 15 Beliefs about Government Consideration in Defining Neighborhood Problems by Reported Income ��������������� 38Figure 16 Beliefs about Government Consideration in Implementing Neighborhood Solutions by Race ����������������������������� 39Figure 17 NYPD Interactions (questions 9-12) ������������������������������������������������������������������������������������������������������������������������������������������ 44Figure 18 Contact with Police by Reported Family Income, 2016 ������������������������������������������������������������������������������������������������������50Figure 19 Disagreement with Positive and Negative Emotion in Relation to the NYPD ��������������������������������������������������������������� 51Figure 20 Interviewees Stopped by NYPD ����������������������������������������������������������������������������������������������������������������������������������������������52Figure 21 Quality of Police Interactions during a Stop �������������������������������������������������������������������������������������������������������������������������� 53Figure 22 Tag Cloud for Positive Interactions ������������������������������������������������������������������������������������������������������������������������������������������ 54Figure 23 What Informs Police Stops? �������������������������������������������������������������������������������������������������������������������������������������������������������55Figure 24 Opinion about Police Presence in the Neighborhood ������������������������������������������������������������������������������������������������������56Figure 25 Experiences with Police �������������������������������������������������������������������������������������������������������������������������������������������������������������56 Figure 26 Perceptions of Procedural Justice in the Neighborhood �������������������������������������������������������������������������������������������������62Figure 27 Perceptions of Procedural Justice in Personal Interactions with the NYPD in Neighborhood ������������������������������ 63
APPENDIXESAppendix A Community Survey Summary Appendix B Community Survey Script Appendix C Survey Response Frequencies Appendix D Note on Analyses Appendix E Community Interview Guide Appendix F Data Underlying Visualization on Maps Appendix G Neighborhood Participation Survey Responses by Neighborhood Tabulation Area Appendix H Survey Methodology Report Appendix I Spatial Analysis

1 @JCollaboratory
Project overviewThe New York City Mayor’s Office of Criminal Justice (MOCJ) Strategic Plan for Fiscal Years 2019- 2021 states that a successful public safety system is assessed not only with metrics like arrest and recidivism rates, but also by the quality of the justice it provides — all New Yorkers deserve to be safe and to be treated fairly and with dignity� The Strategic Plan goes one step further and promises to “put into practice principles of fairness and procedural justice�” It includes an action item to identify issues about New Yorkers’ perceptions of fairness of the justice system through surveys, other feedback mechanisms, and engagement�
In partnership with the Justice Collaboratory at Yale Law School, this study is a step towards fulfilling the goal of putting into practice “principles of fairness and procedural justice” by looking into New Yorker’s engagement with the city government, residents’ perception of municipal services and perceptions of the justice system - key parts of MOCJ’s Strategic Plan�
Vast research suggests that an individual’s interaction with and perception of their community affects their involvement in criminal behavior - however, this research is not typically linked to the individual’s perceptions about the legitimacy of governing authorities� In this study, we sought to test whether the link between citizens’ relationships to their community and their perceptions of public authority might affect their likelihood of trusting and obeying the law�
A range of experiences, across various populations, can impact attitudes about government agencies� For example, procedural justice is a key factor shaping law-abiding behaviors - research demonstrates that people who trust legal authorities are less likely to commit crimes, are more accepting of legal authority, and are more willing to cooperate with the police to maintain social order� Trust is a key front-end understanding of legal authority that, when created and maintained, minimizes the number of negative interactions between citizens, governing agencies and legal authorities�
Drawing upon existing research, we focus on key drivers of individuals’ perceptions of fairness, or lack thereof, in their dealings with the New York Police Department and local governmental agencies� We measure and compare the influences of community-member judgments about lawfulness, disparate treatment, effectiveness and fairness on their perceptions of the municipal government and the criminal justice system, grounding our analysis in legitimacy theory (i�e� trust and confidence)�
Hence, the goal of this study was to identify and measure perceptions of procedural justice in the New York City government and criminal justice system, and to deliver recommendations to MOCJ on how to increase positive perceptions� In order to accomplish these goals, the Justice Collaboratory collected and analyzed survey and interview data from New York City residents� This report detailing our findings was organized by community members’ perceptions of their community, government, and police�
���a successful public safety system is assessed not only with metrics like arrest and recidivism rates, but also by the quality of the justice it provides�
2 @JCollaboratory
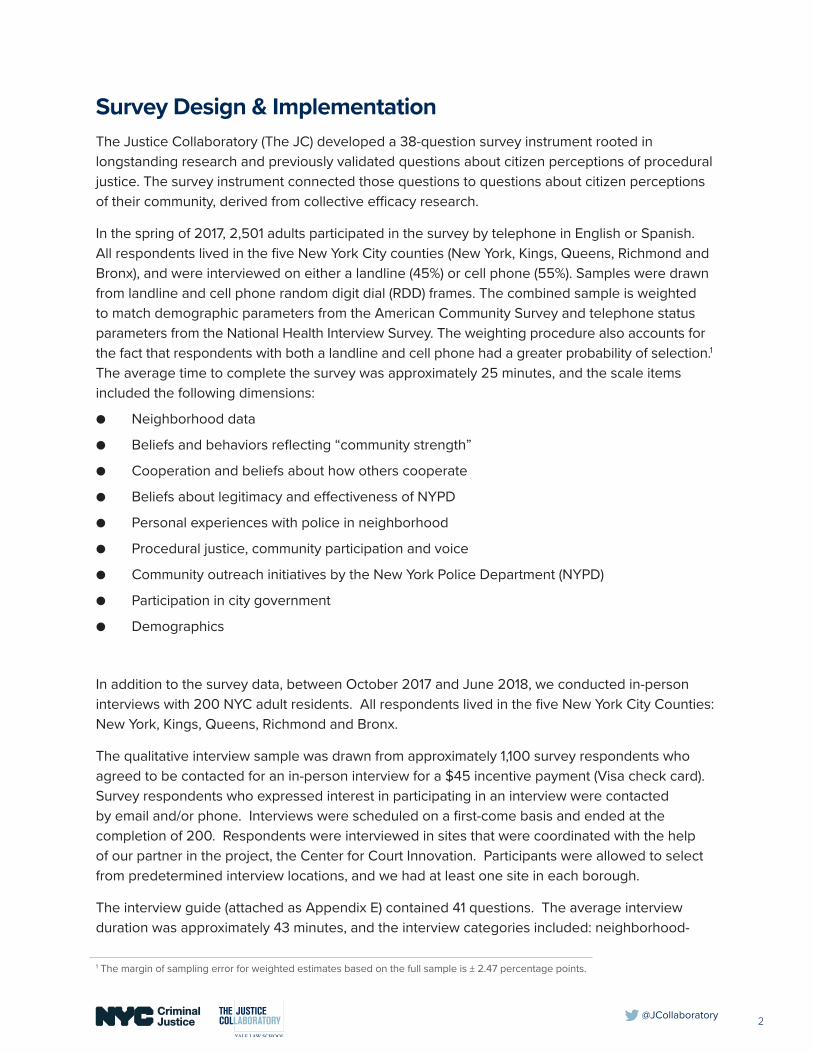
Survey Design & ImplementationThe Justice Collaboratory (The JC) developed a 38-question survey instrument rooted in longstanding research and previously validated questions about citizen perceptions of procedural justice� The survey instrument connected those questions to questions about citizen perceptions of their community, derived from collective efficacy research�
In the spring of 2017, 2,501 adults participated in the survey by telephone in English or Spanish� All respondents lived in the five New York City counties (New York, Kings, Queens, Richmond and Bronx), and were interviewed on either a landline (45%) or cell phone (55%)� Samples were drawn from landline and cell phone random digit dial (RDD) frames� The combined sample is weighted to match demographic parameters from the American Community Survey and telephone status parameters from the National Health Interview Survey� The weighting procedure also accounts for the fact that respondents with both a landline and cell phone had a greater probability of selection�1 The average time to complete the survey was approximately 25 minutes, and the scale items included the following dimensions:
● Neighborhood data
● Beliefs and behaviors reflecting “community strength”
● Cooperation and beliefs about how others cooperate
● Beliefs about legitimacy and effectiveness of NYPD
● Personal experiences with police in neighborhood
● Procedural justice, community participation and voice
● Community outreach initiatives by the New York Police Department (NYPD)
● Participation in city government
● Demographics
In addition to the survey data, between October 2017 and June 2018, we conducted in-person interviews with 200 NYC adult residents� All respondents lived in the five New York City Counties: New York, Kings, Queens, Richmond and Bronx�
The qualitative interview sample was drawn from approximately 1,100 survey respondents who agreed to be contacted for an in-person interview for a $45 incentive payment (Visa check card)� Survey respondents who expressed interest in participating in an interview were contacted by email and/or phone� Interviews were scheduled on a first-come basis and ended at the completion of 200� Respondents were interviewed in sites that were coordinated with the help of our partner in the project, the Center for Court Innovation� Participants were allowed to select from predetermined interview locations, and we had at least one site in each borough�
The interview guide (attached as Appendix E) contained 41 questions� The average interview duration was approximately 43 minutes, and the interview categories included: neighborhood-
1 The margin of sampling error for weighted estimates based on the full sample is ± 2�47 percentage points�

3 @JCollaboratory
level questions, questions about NYPD, and questions about the NYC criminal justice system� All interviews were audio-recorded and transcribed by a third-party professional transcription company� Interview transcripts were uploaded into MaxQDA and coded by eight coders (mostly students from NYC graduate schools and Yale University)�
Unlike the survey respondents, participants of the qualitative interviews did not approximate the NYC population (we did not have enough volunteers from which to select a sample to approximate the population)� In an effort to provide targeted analysis, we organized our results around three main themes:
1� Individual and collective perceptions of procedural justice and system legitimacy, and neighborhood norms and beliefs;
2� Individual perception of procedural justice of and within criminal justice systems;
3� Perception and impact of police-led initiatives to build trust�
Descriptive Statistics of Survey SampleA total of 2,501 respondents participated in the telephone survey, of which 1,264 persons identified as female (50�5%) and 1,223 identified as male (48�9%)� Participants age ranged from 18 to 95, and the mean age was 49�18) (Figure A-1)� The mean age of male respondents (45�9) was lower than the mean age of female respondents (49�5)�
Figure A-1Survey Respondents by Age Group and Gender Identity
SURVEY RESPONDENTS (by age group and gender identity)
0
20
40
60
80
100
120
140
18 - 21 22-25 26-30 31-35 36-40 41-45 46-50 51-55 56-60 61-65 66-70 71-75 76-80 81-85 86+
Male Female

4 @JCollaboratory
The majority of participants self-identified as White/Caucasian (37�8%), followed by Black (23�8%) (Table A-1)� However, the percentage of females within racial/ethnic groups ranged from a low of approximately 41% (Asian) to 55% of Black (the percentage of Hispanic females regardless of race was approximately 53%)�
Table A-1 Self-Reported Race/Ethnicity of Respondents by Gender Identity
Race/Ethnicity Male FemaleOther/
Refused Total % of Total% Female within Race/ Ethnicity
White 486 456 3 945 37�8% 48�3%
Black 267 328 0 595 23�8% 55�1%
White Hispanic 111 124 1 236 9�4% 52�5%
Black Hispanic 50 40 0 90 3�6% 44�4%
Hispanic (no race given) 93 129 1 223 8�9% 57�8%
Asian 88 61 0 149 6�0% 40�9%
Other 88 93 1 182 7�3% 51�1%
DK/Refused/NA 40 33 8 81 3�2% 40�7%
Total 1,223 1264 14 2,501 100�0% 50�5%
The sample resembles the overall racial make-up of New York City (Figure A-2), with a slightly higher percentage of White respondents and a significantly lower percent of Asians when compared to the City’s population�
Figure A-2Race of Survey Respondents and New York City Residents
SOURCE: New York City residents by race from U�S� Bureau of the Census, 2010
Black23.8%
Hispanic22%
Asian6.0%
Other/Refused10.5%
SURVEY RESPONDENTS BY RACE
White37.8%
Black25.50%
Hispanic23.60%
Asian12.60%
Other/Refused4.90%
NEW YORK CITY BY RACE
White33.30%

5 @JCollaboratory
Survey respondents were sampled by borough in approximately the same percentage as the overall population of New York City (Table A-2)� Most respondents resided in Brooklyn (30%), followed by Queens (27%), Manhattan (20%), Bronx (17%) and Staten Island (5%)�
Table A-2Survey Respondents & NYC Residents by Borough
Survey Respondents NYC Pop� Estimate 2017
# % of Total # % of Total
Bronx 429 17�2% 1,471,160 17�1%
Brooklyn 755 30�2% 2,648,771 30�7%
Manhattan 511 20�4% 1,664,727 19�3%
Queens 677 27�1% 2,358,582 27�4%
Staten Island 129 5�2% 479,458 5�6%
Total 2501 100�0% 8,622,698 100�0%
SOURCE: NYC Population Estimates from US Bureau of the Census via https://www�citypopulation�de/php/usa-newyorkcity�php
The greatest percentage of survey respondents (40%) indicated that they have lived in their current neighborhood for more than 20 years�
Figure A-3 Survey Respondents by Years of Residence in Current Neighborhood
10 - <20 Years24%
5 - <10 Years15%
2 - <5Years11%
1- <2 Years5%
<1 Year4%
SURVEY RESPONDENTS BY YEARS OF RESIDENCE IN CURRENT NEIGHBORHOOD
How long have you lived in your current neighborhood?
Unknown/Refused1%
20+ Years40%

6 @JCollaboratory
Regarding political orientation, approximately 37�6% of respondents identified as liberal or extremely liberal (Figure A-4), a percentage slightly higher than those who identified as politically moderate (33�5%)� Those who identified as “conservative” or “extremely conservative” represented 21�3% of the total sample�
Figure A-4Self-Reported Political Orientation of Survey Respondents
While we were unable to find similar data for New York City, the State voter registration data shows that the majority of registered voters in New York City are affiliated with the Democratic Party (Table A-3)� That is, nearly 87% of registered voters chose the Democratic Party (a percentage calculated using the total sum of Democratic and Republican respondents as the denominator (3,978,868))�
Table A-3New York City Registered Voters by Party as of 1 November 2017
Registered Voters by Party Active Inactive Total % of Total
Democratic Party 3,156,031 297,838 3,453,869 68�3%
Republican Party 476,614 48,385 524,999 10�4%
Conservative Party 18,379 1,840 20,219 0�4%
Green Party 7,912 980 8,892 0�2%
Other parties 123,043 16,470 139,513 2�8%
None Selected 814,834 91,516 906,350 17�9%
TOTAL 4,596,813 457,029 5,053,842 100�0%
SOURCE: Retrieved 18 January 2018 from http://www�elections�ny�gov/enrollmentcounty�html NOTE: There were 10 options from which registered voters could select party affiliation� In addition to those above were the Working Families, Independence Party, Women’s Equality Party, Reform Party, and Other parties�
Self-Reported Political Orientation of Survey Respondents
Extremely Liberal
Liberal
Moderate
Conservative
Extremely Conservative
Don't Know/Refused
220
721
839
467
188
66

7 @JCollaboratory
The greatest number of respondents reported that their yearly family income is less than $25,000 (22�7%), and just under half the sample reported a yearly family income of $50,000 or less (47�6%)� Overall, the sample is consistent with the estimated 2015 family income in New York City (Table A-4)�
Table A-4 Self-Reported 2016 Family Income of Survey Respondents and New York City Residents, 2015 (estimated)
Family Income Survey Sample NYC Est� 2015Less than $25,000 22�7% 21�2%$25,000 to under $35,000 11�7% 9�3%$35,000 to under $50,000 13�2% 11�5%$50,000 to under $75,000 14�6% 16�0%$75,000 to under $100,000 12�5% 10�8%$100,000 to under $150,000 12�4% 14�7%$150,000 to under $200,000 5�1% 6�8%$200,000 or more 7�8% 9�7%Total 100�0% 100�0%
SOURCE: NYC Est�, 2015 retrieved 18 Jan 18 from http://www1�nyc�gov/site/planning/data-maps/nyc-population/american-community-survey�page
Figure A-5 Highest Level of Education Completed by Survey Respondents
Regarding education, 72�4% of those who responded to this question in our sample reported having some college, having graduated college, or having attended graduate or professional school, compared to about 42�1% of NYC residents 25 and older (Figure A-5)�
Graduated College28.1%
GraduateProfessional
21.0%
Refused2.2%
HIGHEST LEVEL OF EDUCATION COMPLETED BY SURVEY RESPONDENTS
Some High School5.6%
Technical/Vocational1.4%
GraduatedHigh School
17.6%
Some College21.7%
Some Grade School2.4%
1 Retrieved 1/18/18 from http://www1.nyc.gov/site/planning/data-maps/nyc-population/american-community-survey.pageRetrieved 1/18/18 from http://www1�nyc�gov/site/planning/data-maps/nyc-population/american-community-survey�page

8 @JCollaboratory
Descriptive Statistics of Interview SampleThe interview sample was based on the pool of volunteers from the telephone survey, therefore not-randomly selected� Overall, about 54% of interviewees were male (approximately 49% of survey respondents were male)� Similar to survey respondents, male interviewees were slightly younger than female interviewees (the mean age of males was 45�33 compared to the mean age of females of 47�85), and on average, interviewees were slightly younger than survey respondents�
Figure B-1Interviewees by Age Group and Gender Identity
More men participated in the interviews than women, and the average age of interviewees was lower than survey respondents�
Table B-1Mean Age of Survey and Interview Participants
Male Female
Survey 47�0 51�1
Interview 45�3 47�9
Regarding race, just under half of those interviewed reported being White or Caucasian (compared to under 40% of the survey sample)�
INTERVIEWEES BY AGE AND GENDER IDENTITY
0
5
10
15
20
25
18 - 24 25-34 35-44 45-54 55-64 65-74 75+ Refused
Male Female
9 @JCollaboratory
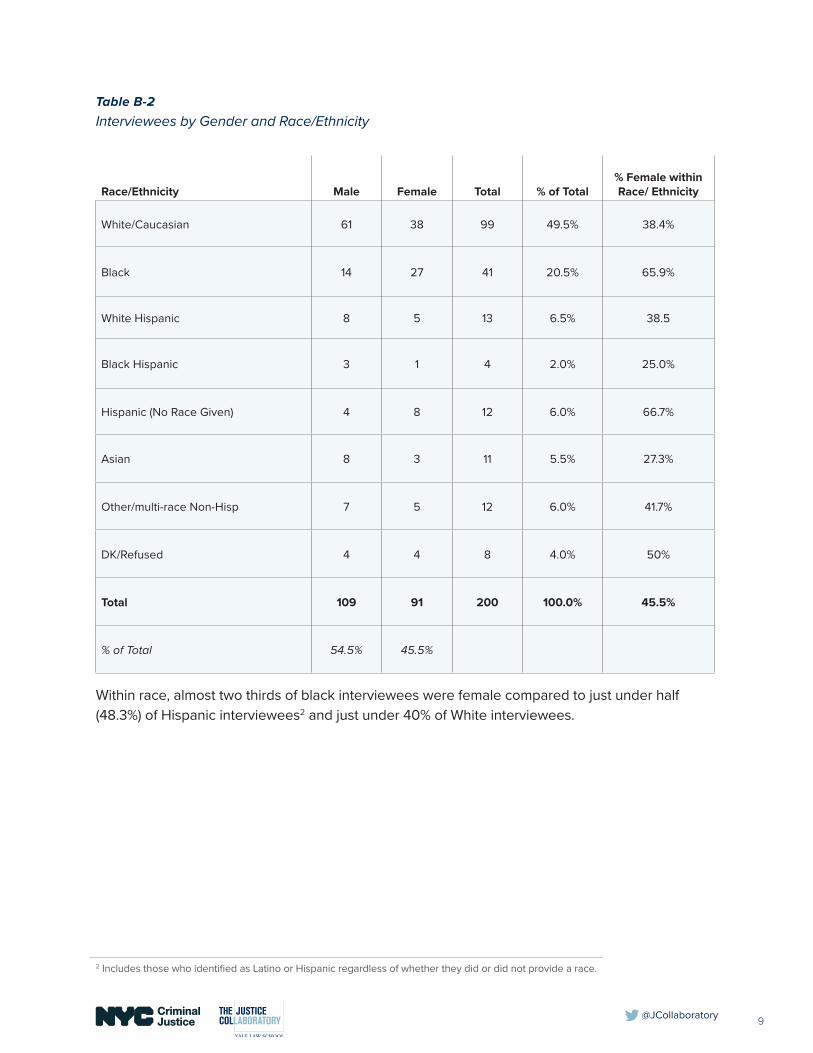
Table B-2 Interviewees by Gender and Race/Ethnicity
Race/Ethnicity Male Female Total % of Total% Female within Race/ Ethnicity
White/Caucasian 61 38 99 49�5% 38�4%
Black 14 27 41 20�5% 65�9%
White Hispanic 8 5 13 6�5% 38�5
Black Hispanic 3 1 4 2�0% 25�0%
Hispanic (No Race Given) 4 8 12 6�0% 66�7%
Asian 8 3 11 5�5% 27�3%
Other/multi-race Non-Hisp 7 5 12 6�0% 41�7%
DK/Refused 4 4 8 4�0% 50%
Total 109 91 200 100�0% 45�5%
% of Total 54.5% 45.5%
Within race, almost two thirds of black interviewees were female compared to just under half (48�3%) of Hispanic interviewees2 and just under 40% of White interviewees�
2 Includes those who identified as Latino or Hispanic regardless of whether they did or did not provide a race�

10 @JCollaboratory
Table B-3 Percentage of Female Interviewees by Race/Ethnicity
Survey Interviews
White/Caucasian 48�3% 38�4%
Black 55�1% 65�9%
Hispanic 53�4% 48�3%
Other/Refused 38�7% 45�4%
The greatest number of interviewees resided in Manhattan (one third) compared to about 20% of the total NYC population� The Bronx was under represented in interviews (about 9�5% of all interviews compared to about 17% of NYC population)
Table B-4 Interviewees and 2017 NYC Population by Borough
Interviewees NYC Pop Estimate 2017
# % of Total # % of Total
Bronx 19 9�5% 1,471,160 17�1%
Brooklyn 56 28�0% 2,648,771 30�7%
Manhattan 66 33�0% 1,664,727 19�3%
Queens 45 22�5% 2,358,582 27�4%
Staten Island 14 7�0% 479,458 5�6%
Total 200 100�0% 8,622,698 100�0%
SOURCE: NYC Population Estimates from US Bureau of the Census via https://www�citypopulation�de/php/usa-newyorkcity�php

11 @JCollaboratory
Figure B-2Interviews by Borough of Residence
The greatest number of interviewees reported living in their current neighborhood for an estimated 20 or more years�
Figure B-3 Estimated Length of Residence in Current Neighborhood
Most interviewees reported that they were politically “moderate” (37%) followed closely by “liberal” (34%)� Only 10�5% of interviewees said they were “conservative” or “extremely conservative” (compared to about 21% of survey respondents)�
Manhattan33%
Queens23%
Staten Island7%
Bronx9%
INTERVIEWS BY BOROUGH OF RESIDENCE
Brooklyn28%
10 - <20 Years24%
5 - <10 Years14%
2 - <5Years11%
1- <2 Years5%
<1 Year2%
ESTIMATED LENGTH OF RESIDENCE IN CURRENT NEIGHBORHOOD
How long have you lived in your current neighborhood?
Unknown/Refused1%
20+ Years43%
12 @JCollaboratory
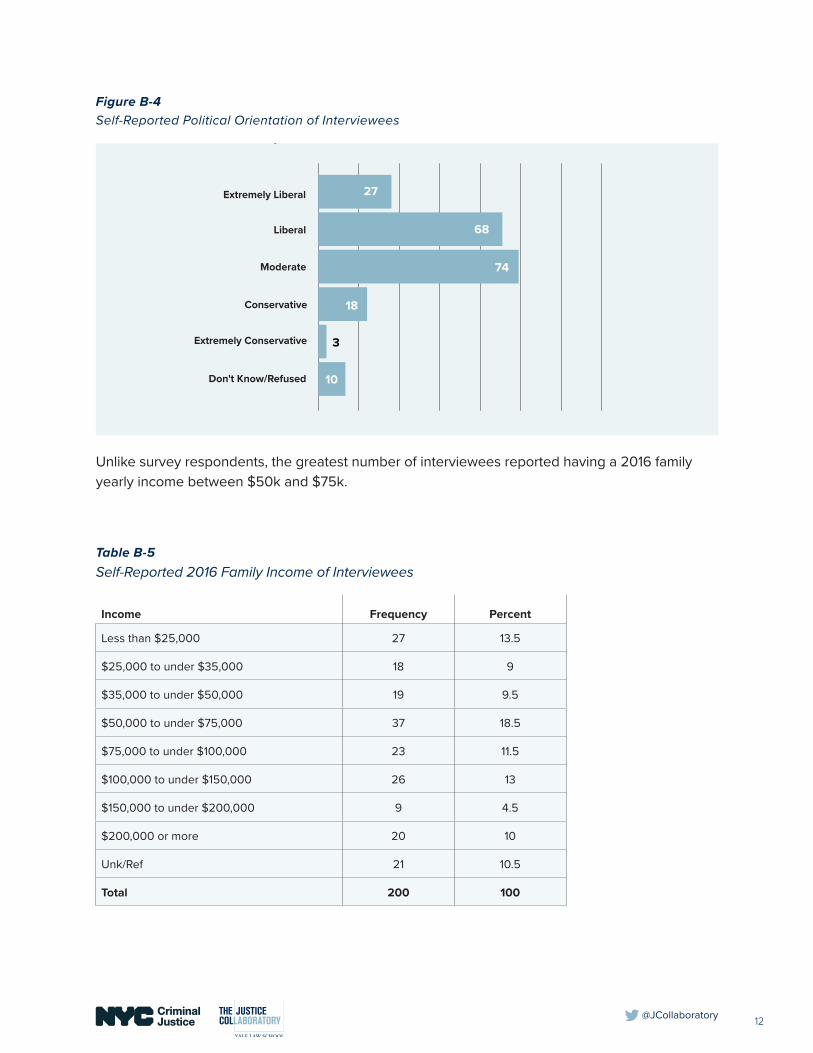
Figure B-4Self-Reported Political Orientation of Interviewees
Unlike survey respondents, the greatest number of interviewees reported having a 2016 family yearly income between $50k and $75k�
Table B-5 Self-Reported 2016 Family Income of Interviewees
Income Frequency Percent
Less than $25,000 27 13�5
$25,000 to under $35,000 18 9
$35,000 to under $50,000 19 9�5
$50,000 to under $75,000 37 18�5
$75,000 to under $100,000 23 11�5
$100,000 to under $150,000 26 13
$150,000 to under $200,000 9 4�5
$200,000 or more 20 10
Unk/Ref 21 10�5
Total 200 100
Self-Reported Political Orientation of Interviewees
Extremely Liberal
Liberal
Moderate
Conservative
Extremely Conservative
Don't Know/Refused
27
68
74
18
10
3

13 @JCollaboratory
More than one third of the interviewees reported that they had graduated from college and another 30% said they had education beyond an undergraduate degree� Approximately 90% of the interviewees reported having at least some college education�
Table B-6 Highest Level of Education Completed by Interviewees
Highest Level Frequency Percent
Did Not Complete High School 4 2
High School Graduate 14 7
Some College 51 25�5
College Graduate 73 36�5
Post-Graduate Work and Beyond 58 29
Total 200 100
Figure B-5Highest Level of Education Completed by Interviewees
College Graduate37%
PostGraduate
29%
HIGHEST LEVEL OF EDUCATION COMPLETED BY INTERVIEWEES
High SchoolGraduate
7%
SomeCollege
25%
Less thanHigh School
2%

14 @JCollaboratory
Perceptions of ‘Community’ Neighborhood Identification, Participation, & Safety
Robert Sampson, an urban sociologist and one of the most respected neighborhood scholars, argues that residential communities have significant and powerful impacts on our lives� Where we live influences nearly every aspect of human development and achievement� Concentrated disadvantage leads to stigmatization which leads to cynicism and alienation from public institutions - a potentially self-reinforcing dynamic� Pat Sharkey, building on the work of Sampson, argues that spatial stratification plays a central role in maintaining and reproducing inequality� Both Sampson and Sharkey have demonstrated that neighborhood residents and organizations play a significant role in improving communities (Sampson & Sharkey, 2008)�
There is a large body of research (largely survey data) on satisfaction with one’s community, and many variables have been shown to be related, such as infrastructure, job opportunities, and social dimensions (relationships, participation, commitment, viability, heterogeneity, power distribution, and pride)� There are no simple conclusions, however, and no simple formula or recipe for community satisfaction� The takeaway is that the nuances associated with community satisfaction may mean that the best answer to why people like where they live is complex and difficult to isolate with total accuracy�
Literature on the effects of the neighborhood environment on individual lives demonstrates that the characteristics of a neighborhood can impact individuals on a range of outcomes: educational (Turley, 2003), attainment, health (Steptoe & Feldman 2001), employment (Weinberg et al� 2004), etc�� Galster (2012), however, has shown that there are difficulties isolating distinct causal relationships between neighborhood characteristics and their influence on the individual� Nonetheless, a sense of belonging in a community leads to stronger interpersonal relationships, which in turn leads to healthier communities� People (especially in urban areas) rely on their communities to provide life necessities (access to food, services, etc�)� Researchers have demonstrated that people who feel a strong sense of community are more likely to participate in community activity (Chavis & Wandersman, 1990) and less likely to relocate to other communities (taking consumer and tax dollars with them)� Everyone has a stake in ensuring community satisfaction�
A significant challenge for local government is to strike a balance between improving the infrastructure to make neighborhoods more livable while preserving the qualities that support both new and long-term residents� Our research sought to understand some of the nuances of what is important for community satisfaction in order to understand how the City can improve quality of life for everyone, increase, and capitalize on the benefits of community attachment�
In this section, we seek to provide insight into NYC residents’ neighborhood connections� Survey participants were asked a variety of questions about their neighborhood and local community� We asked about beliefs and behaviors demonstrating community strength, participation in their local community (like involvement with specific activities), how closely their identity was tied to the neighborhood, and their overall perceptions of safety in the neighborhood� By understanding neighborhood-level perceptions of community and resident involvement, MOCJ can develop
15 @JCollaboratory
strategically tailored programs to build tighter community bonds and increase perceptions of legitimacy�
Neighborhood Identity Survey Data
Neighborhood is an important part of the identity of New Yorkers, and people’s sense of belonging promotes collective efficacy� Collective efficacy means that social ties among neighborhood residents cause them to work toward collective goals, such as public order or the control of crime� Agreeing on what constitutes acceptable behavior (norms) and reinforcing it with one another (informal social control), creates an organized environment� Organized environments foster collective efficacy because the unity of the community, consciously organized or not, creates a powerful block to which legislators and administrators must respond�
Community survey participants were asked to reflect on the relationship between their sense of identity and their neighborhood�
We asked���
“Do you agree or disagree that being a part of the neighborhood you live in is important to the way you think of yourself as a person?”
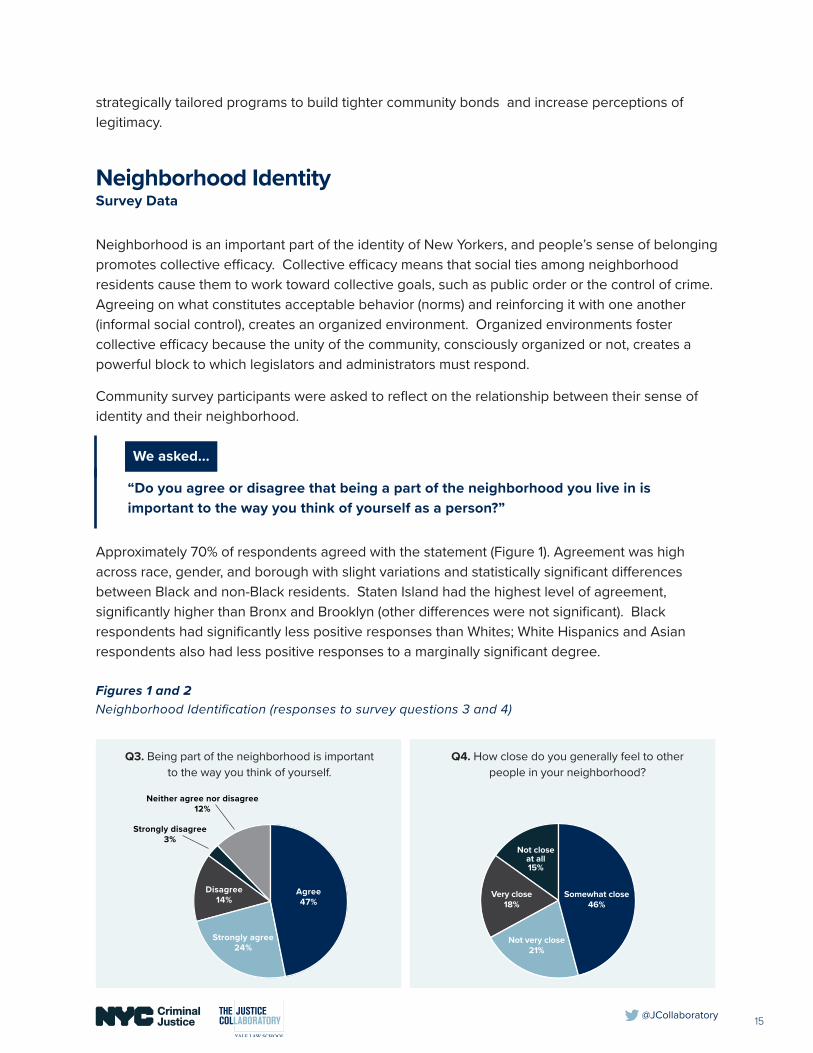
Approximately 70% of respondents agreed with the statement (Figure 1)� Agreement was high across race, gender, and borough with slight variations and statistically significant differences between Black and non-Black residents� Staten Island had the highest level of agreement, significantly higher than Bronx and Brooklyn (other differences were not significant)� Black respondents had significantly less positive responses than Whites; White Hispanics and Asian respondents also had less positive responses to a marginally significant degree�
Figures 1 and 2Neighborhood Identification (responses to survey questions 3 and 4)
Agree47%
Disagree14%
Neither agree nor disagree12%
Strongly disagree3%
Strongly agree24%
Somewhat close46%
Very close18%
Not closeat all15%
Not very close21%
Q3� Being part of the neighborhood is important to the way you think of yourself�
Q4� How close do you generally feel to other people in your neighborhood?

16 @JCollaboratory
Community StrengthSurvey Data
In order to develop a more nuanced understanding of how people experience their social relations and neighborhood, interview participants were asked for their definition of the word community (What does the word “community” mean to you?)�
One-hundred and ninety-nine participants offered us definitions based on their own understanding of the word “community�” Most answers contained the words “neighbors”, “together”, “different” and “groups�” In addition to the sense that communities share a geographic space (“neighbors”, “living”, “building”, “block”, “proximity”, “physical”), participants also described “different” individuals brought “together” by common interests, values and beliefs� Moreover, answers frequently alluded to “support” and the idea that within a community, individuals care for each other� Thus, communities are perceived as networks that provide a sense of “safety”, familiarity and “group connection�”
Figure 3Tag Cloud of Most Frequently Used Words by Interview Participants when Defining Community
A community means to me people living in close proximity, who relate to their environment – to the people around them – with respect and take ownership of not only their property but of the lifestyle�” (66 y/o, female, White, $50-75K, Manhattan resident)
Community to me means a supportive environment, helpful� A community is almost like an extended family� They may not be your blood, but it’s people who will look out for you� People that, if they see something going on, that maybe possibly your property or something they’ll actually speak out and tell you� [���] You can work together for the greater good of the neighborhood, you know?” (38 y/o, female, Black, less than $25k, Brooklyn resident)
To me, community means I guess it’s like when people come together, you know? I guess it’s like when, when you live in a neighborhood and you see some trash on the street and you’re like “Well, this is my neighborhood� I’m gonna pick it up�” [���] It’s a neighborly feeling where you would be willing to give up your own time, energy, or money for a neighbor, because they might do the same for you�” (42 y/o, female, Asian, $75-100k, Brooklyn resident)
A tag cloud is a visual representation of the frequency of word use in qualitative data; the relative size of the word in a tag cloud represents the frequency of its use�

17 @JCollaboratory
In a follow-up question, participants were asked whether they feel a sense of community in the area where they live� Most participants responded to this question affirmatively (61%), while 16% offered negative answers and 23% made ambiguous or contradictory statements (coded as “unclear”)�
Figure 4Do You Feel a Sense of Community in Your Neighborhood?
Participants who answered affirmatively, spoke about topics such as safety enhancing the life of their neighborhood and community-building opportunities, as well as community ties built through religious organizations, local boards, small local businesses and generally helpful and friendly neighbors�
After a certain time, when it started getting dark I was afraid to come out of my house because the crime level was so high� Robberies, shootings even though it happened during the day you were so afraid to come out� Now, I can feel free; I actually can say I’m not afraid of my community� To me, it makes it special because there are very few communities you can say that about� It’s become more friendly in the community� You can feel it even with the youth� If I get in the elevator and there’s a couple of youth coming, and I hold the door for them, they’re polite, thank you, ma’am, have a good day, I feel comfortable� Whereas before if I saw somebody in the elevator I would hold back�” (67 y/o, female, Hispanic, $50-75k, Bronx resident)
Positive 61%Unclear
23%
Negative16%
Sense of Community

18 @JCollaboratory
I have a very close-knit neighborhood� I know all my neighbors� Everyone says hello� So, I feel really safe there and it’s like even if there are things that happen, we have a very fast police force� There are police officers pretty much stationed on every block, but it doesn’t feel like they’re being – because they don’t trust you or they think it’s a dangerous neighborhood�” (38 y/o, female, Black, under $25k, Brooklyn resident)
Yeah, everybody takes care of, on the block I live on everybody’s always watching, making sure everything’s okay, not being nosy, but we help, we try to help each other� [T]here’s mostly senior citizens, so you know, sometimes you try to help them out� There are younger people, there are a couple young guys that shovel the snow, take out their garbage� I just had surgery on my hip, that’s why I’m not working, but one of the young kids came over and was helping me out, I’ve known him since he was a little kid, he came over to help me out with the garbage and stuff�” (51 y/o, male, White, over $200k, Queens resident)
Participants who answered negatively spoke about lack of local ties, low sense of belonging, lack of political affinities, growing presence of tourists in their neighborhood, “big buildings” and “gentrification�” Although most participants mentioned diversity as a positive quality of their neighborhood, some also mentioned feelings of isolation, while others stated that the presence of groups with different cultural, ethnic, socioeconomic or religious background prevents the development of strong community ties�
My neighborhood] feels very, very white, to me� Yeah� Sometimes I get a little uncomfortable, you know? [���] Because we all have a tinge of racism� We have our own views of race and how we were raised and how we view race, so I – it’s, it’s funny� I know friends who will be – get a little scared if they see a bunch of black men on the corner, but it’s weird because I get a little scared when I see a bunch of white guys� [���] But it’s a different vibe, right, because it’s like it’s not like a – maybe it’s me being classist, right? But it’s like the working class versus the upper crust or whatever, I don’t feel threatened by those upper crusty people� Whereas, the working class, I get a little – sometimes I get a little nervous� You know? They’ve had a few too many PBRs or something – Are they gonna say something? Are they gonna shout a slur at me?” (42 y/o, female, Asian, $75-100k, Brooklyn resident)

19 @JCollaboratory
Question
“What does a strong neighborhood mean to you?”
Interview participants were also asked to describe their vision of a “strong neighborhood�” Responses shared examples of what makes a neighborhood strong, including:
● sharing responsibilities for the greater good of community residents,
● being an active participant in the community,
● sharing a vision for what they want for the community,
● and having strong connections to each other�
While some participants provided their definition of a “strong-neighborhood” to include availability of services, most responses focused on citizens’ “involvement” in local problems and politics, and caring about the neighborhood’s “maintenance and cleanliness�” Answers also referenced relational characteristics such as “good relationships with neighbors,” “sense of community” and the presence of people who “care for each other�” The word “together” was used most frequently by respondents (30%)�
[��] if somebody needed something or they asked me for something I wouldn’t be afraid of helping them and they could do the same for me or for us or whatever� Regardless of if they’re connected to us or anybody else, we still can work together�” (32 y/o, female, White, $25-35K range, resident of Manhattan)
Everybody’s getting up and going to work, contributing to the beautification and doing their part, you know?” (35 y/o, female, Black, $100-150k range, resident of the Bronx)

20 @JCollaboratory
Figure 5What Does a Strong Neighborhood Mean to You?
An example of how people talked about strong communities follows:
A strong neighborhood for me is…Very politically active� Very united on all fronts, you know? Not just one but on every aspect� If there’s a problem with housing, people are congregating to talk about what can we do to stick up for each other� If there’s a problem with immigration – you know, if the immigration police comes, we come together and talk about what – how to know your rights� Talk about knowing your rights, you know? Having a good relationship with the police� That’s – to me, that’s a strong connection� Having a connection with your tenants association in the building, knowing about having a united consensus about what’s going on in the community together and how – and what can we do to make it better�” (26 y/o, male, Hispanic, under $25K, Manhattan resident)
In 200 interviews, about half of the participants mentioned both positive and negative qualities of their neighborhood equally, while 31% mentioned positive qualities more frequently, and 19�5% mentioned negative qualities more frequently�
Figure 6 Interview Mentions of Positive & Negative Neighborhood Qualities
SharedResponsibility
33%Active
Involvement25%
StrongConnections
13%Common Vision
/Consensus21%
Other8%
Positive &Negative
Qualities, 49%More PositiveQualities, 31%
More NegativeQualities, 20%
Qualities of a “Strong Neighborhood”
Interview Mentions of Positive and Negative Neighborhood Qualities

21 @JCollaboratory
When talking about the positive qualities of their neighborhood, participants largely mentioned availability of public services (transportation, schools, libraries and sanitation)� There were also frequent mentions of a sense of community and good relationships with neighbors, as well as proximity to stores, restaurants and entertainment options�
Figure 7 Tag Cloud of Most Frequently Mentioned Positive Qualities
I feel like we have – actually, we are close to Columbia Presbyterian� We’re close to a subway station� There’s a library in walking distance� There’s a post office, walking distance� We saved the – the community’s active, so we saved the supermarket that was going to be turned into a CVS and the community went, went up in arms about that� So there’s an active community�” (69 y/o, female, White, over $200k, Manhattan resident)
In describing the negative qualities of their neighborhood, participants brought up seemingly contradictory matters: unkept buildings but also the presence of “new”, “tall” buildings, characteristics of gentrification�
The worse, I would say […] a lot of buildings are falling apart where they need to invest some money in building up the appearance of the neighborhood�” (67 y/o, female, Hispanic, $50-75K, resident of the Bronx)
[…] there are all kinds of these, kind of, you know, strange corporate landlords that are coming in buying buildings right and left and cleaning them up and basically kicking the rents up literally from you know, $1,000, $2,000 a month to $9,000 a month now� So, it’s a neighborhood that is losing its character very quickly�” (60 y/o, male, Hispanic, $100-150K, resident of Manhattan)�

22 @JCollaboratory
Among negative qualities frequently brought up were matters related to relationships with neighbors (lack of interaction, noise disturbance, poor upkeep of property); crime, parking, high rent; homelessness and problems with sanitation�
The worst [characteristics] are the proliferation of chain stores and gentrification� […] It used to feel much more like a neighborhood than it does now�” (64 y/o, male, White, under $25K, Manhattan resident)
I mean if you don’t have a community that is on board with keeping the neighborhood clean and everything, it makes those who have that job – it makes their job that much more difficult� There are people who just don’t care, you know?” (50 y/o, female, Black, under $25K, Brooklyn resident)
Neighborhood Participation Survey and Interview Data
Because community participation has been shown to correlate with individual perceptions of government and police, survey respondents were asked about the specific ways and the frequency with which they participate in their neighborhood politically and economically� Specifically, respondents were asked how often they:
Survey Question
a) …attend meetings involving local officials to discuss neighborhood problems? b) …vote in local elections? c) …communicate your views about neighborhood issues to elected officials? d) …talk with your neighbors about problems in your neighborhood? e) …shop in your neighborhood? f) …eat out or go to a movie or other type of entertainment event in your neighborhood?

23 @JCollaboratory
Table 1 below describes some group differences in community members’ reports of engagement with their neighborhood, including political forms of engagement (e�g�, voting, discussing neighborhood problems), and economic forms of engagement (e�g�, shopping in the neighborhood)� For these questions, community members were asked to respond if they engaged in the activity “Never”, “Almost Never”, “Sometimes”, or “Frequently”� Responses are represented numerically on a 1-4 scale (e�g�, “Never” is equal to 1, “Almost Never” is equal to 2, “Sometimes” is equal to 3, and “Frequently” is equal to 4)� We note that the differences pointed out below are statistically significant but in reality quite small (as noted in the average anchor response of specific groups when compared to others)�3 The statements in the survey came from past research assessing economic and political engagement in communities (Tyler & Jackson, 2014)�4
Table 1 Group-based Differences in Reported Neighborhood Engagement on 1 (Never) to 4 (Frequently) Scale
Group Activity
Average anchor response of
group
Mean numeric response
Average anchor response of
others
Mean numeric response
Black partici-pants report…
…attending meetings involving local officials to discuss neighborhood problems�
“Almost Never” 1�92 “Almost Never” 1�75
…voting in local elections� “Sometimes” 3�14 “Sometimes” 3�01
…talking to neighbors about problems in (their) neighborhood
“Sometimes” 2�72 “Sometimes” 2�65
…communicating (their) views about neighborhood issues to elected officials�
“Sometimes” 2�03 “Almost Never” 1�94
…eating out or going to a movie or other type of entertainment event in (their) neighborhood�
“Sometimes” 2�89 “Sometimes” 3�01
…shopping in the neighborhood “Frequently” 3�64 “Frequently” 3�64
3 Means testing on the items above for race (Black / not Black), gender (female / not female), contact with police in previous two years, precinct crime rate, and borough (Table 2) reveal correlations between political and economic engagement (items a, b, e and f of the survey instrument)� Using 2016 crime data from NYC Open data and 2016 population estimates (provided to us by MOCJ), we calculated crime rates for each precinct for major crimes (murder, rape, robbery, felony assault, grand larceny and burglary)� Three precincts were extreme outliers and were removed from analyses using precinct crime rate: 22 (Central Park), 14 (Time Square), and 18 (Midtown North)� The remaining 75 precincts were divided into quartiles: the 1st quartile had the lowest rates (from 2�73 per 1,000 to 6�64 per 1,000) and the 4th had the highest (from 14�48 per 1,000 to 18�39 per 1,000)� These categories were used in ANOVA tests�
4 T-tests were used for dichotomous independent variables (Black, female, contact with police) and ANOVA for nominal (borough) and ordinal (precinct crime rate) independent variables�

24 @JCollaboratory
Hispanic participants report…5
…attending meetings involving local officials to discuss neighborhood problems�
“Almost Never” 1�60 “Almost Never” 1�84
Females report…6
…attending meetings involving local officials to discuss neighborhood problems�
“Almost Never” 1�84 “Almost Never” 1�73
People who had contact with NYPD in their neigh-borhood in the past two years report …7
…talking with (their) neighbors about problems in ( their) neighborhood�
“Sometimes” 2�85Between “Almost
Never” and “Sometimes”
2�57
During interviews, on the other hand, we were able to capture more nuanced answers regarding neighborhood involvement and participation� We asked participants to talk about their community involvement, and 44% of participants said that they consider themselves “involved in the life of their neighborhood�” A slightly smaller number of participants (40�5%) indicated that they are not actively involved in the community� Active participants were asked about the kind of activities they engaged with, and non-active participants were asked why they did not feel engaged� This group was also asked about activities/groups that they would potentially be interested in getting involved with�
Table 2 Involvement in Community Activities
Respondents Percentage
Actively involved 88 48%
Not actively involved 81 44%
Undefined/unclear answers 15 8%
Total* 184 100%
*Not all 200 participants answered to these questions
5 No significant differences were observed when Hispanics were compared against other racial groups for all other activities� The same pattern was true for comparisons of Whites against other racial groups (differences in numeric means did not reflect differences in average responses)�
6 No significant differences were observed when we compared different gender groups�
7 No other significant differences observed when we compared against the opposite group�
25 @JCollaboratory
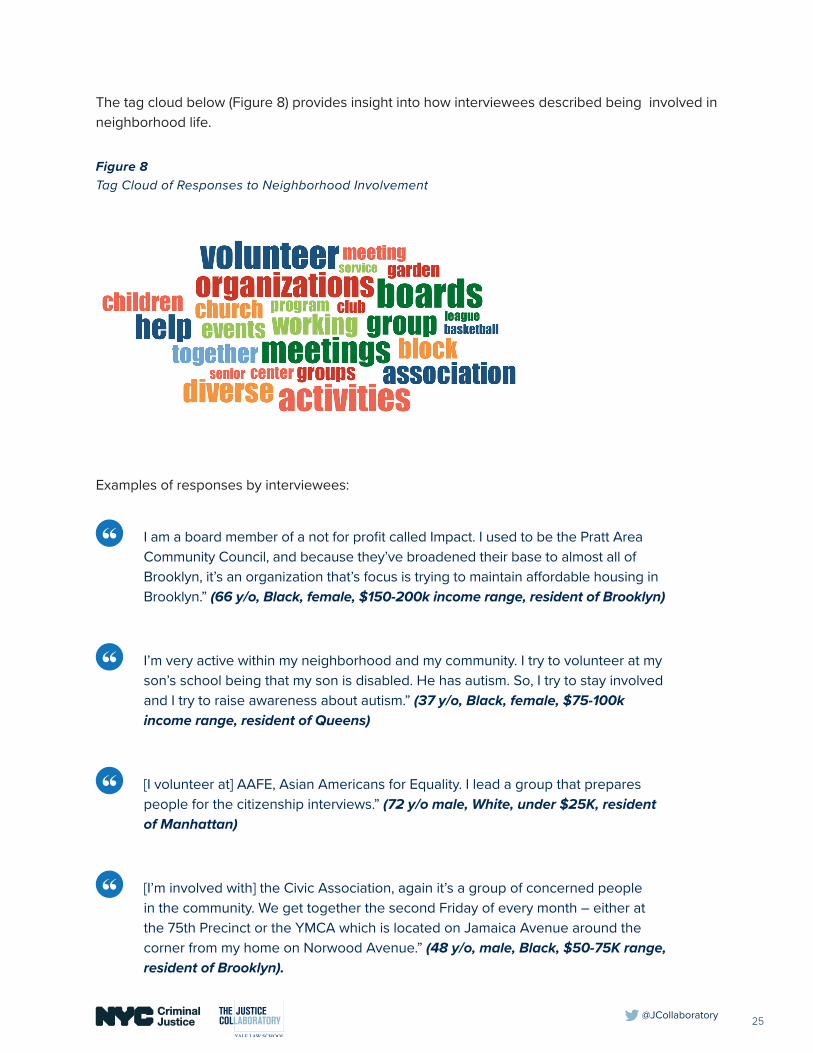
The tag cloud below (Figure 8) provides insight into how interviewees described being involved in neighborhood life�
Figure 8Tag Cloud of Responses to Neighborhood Involvement
Examples of responses by interviewees:
I am a board member of a not for profit called Impact� I used to be the Pratt Area Community Council, and because they’ve broadened their base to almost all of Brooklyn, it’s an organization that’s focus is trying to maintain affordable housing in Brooklyn�” (66 y/o, Black, female, $150-200k income range, resident of Brooklyn)
I’m very active within my neighborhood and my community� I try to volunteer at my son’s school being that my son is disabled� He has autism� So, I try to stay involved and I try to raise awareness about autism�” (37 y/o, Black, female, $75-100k income range, resident of Queens)
[I volunteer at] AAFE, Asian Americans for Equality� I lead a group that prepares people for the citizenship interviews�” (72 y/o male, White, under $25K, resident of Manhattan)
[I’m involved with] the Civic Association, again it’s a group of concerned people in the community� We get together the second Friday of every month – either at the 75th Precinct or the YMCA which is located on Jamaica Avenue around the corner from my home on Norwood Avenue�” (48 y/o, male, Black, $50-75K range, resident of Brooklyn).

26 @JCollaboratory
Participants who said that they are not involved in neighborhood activities mentioned not being aware of opportunities for engagement, not being interested in participating or not having the time to do so� Fifty-five respondents answered a follow-up question about potential interests� They mentioned: volunteering opportunities in community boards, associations, classes (fitness and arts), as well as activities for the youth (sports and professional coaching) and the elderly� The most frequently used words by interviewees provide insight into the types of activities that could potentially encourage their involvement in the life of their neighborhood (Figure 9)�
Figure 9Tag Cloud of Responses to Potential Interest in Opportunities for Community Participation
Examples of responses by interviewees:
I was actually reading about Speaker’s Corner in London, so that’s something that we need, especially in Queens, since we’re diverse� We’re one of the most diverse counties and having the Speaker’s Corner to be here would be amazing�” (18 y/o, male, Asian, less than $25k, resident of Queens)
I would actually like to be more involved in youth development programs […] If I could – in some way – help them to improve their appearance, their self-esteem, knowing that there’s different opportunities, put them in touch with my colleagues, people I went to college with, I would like to do something like that or be a part of that if there was something available�” (31 y/o, female, Black, $100-150K, resident of Brooklyn)
27 @JCollaboratory
Neighborhood Safety Survey and Interview Data
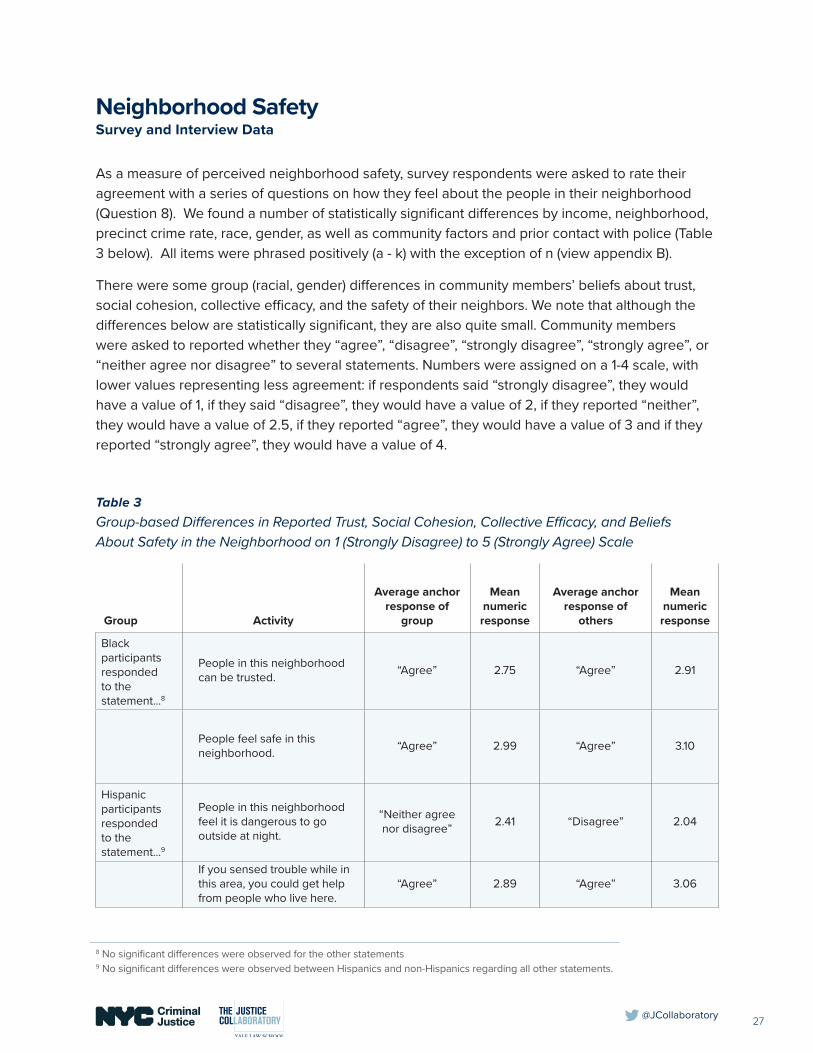
As a measure of perceived neighborhood safety, survey respondents were asked to rate their agreement with a series of questions on how they feel about the people in their neighborhood (Question 8)� We found a number of statistically significant differences by income, neighborhood, precinct crime rate, race, gender, as well as community factors and prior contact with police (Table 3 below)� All items were phrased positively (a - k) with the exception of n (view appendix B)�
There were some group (racial, gender) differences in community members’ beliefs about trust, social cohesion, collective efficacy, and the safety of their neighbors� We note that although the differences below are statistically significant, they are also quite small� Community members were asked to reported whether they “agree”, “disagree”, “strongly disagree”, “strongly agree”, or “neither agree nor disagree” to several statements� Numbers were assigned on a 1-4 scale, with lower values representing less agreement: if respondents said “strongly disagree”, they would have a value of 1, if they said “disagree”, they would have a value of 2, if they reported “neither”, they would have a value of 2�5, if they reported “agree”, they would have a value of 3 and if they reported “strongly agree”, they would have a value of 4�
Table 3 Group-based Differences in Reported Trust, Social Cohesion, Collective Efficacy, and Beliefs About Safety in the Neighborhood on 1 (Strongly Disagree) to 5 (Strongly Agree) Scale
Group Activity
Average anchor response of
group
Mean numeric response
Average anchor response of
others
Mean numeric response
Black participants responded to the statement���8
People in this neighborhood can be trusted� “Agree” 2�75 “Agree” 2�91
People feel safe in this neighborhood� “Agree” 2�99 “Agree” 3�10
Hispanic participants responded to the statement���9
People in this neighborhood feel it is dangerous to go outside at night�
“Neither agree nor disagree” 2�41 “Disagree” 2�04
If you sensed trouble while in this area, you could get help from people who live here�
“Agree” 2�89 “Agree” 3�06
8 No significant differences were observed for the other statements 9 No significant differences were observed between Hispanics and non-Hispanics regarding all other statements�

28 @JCollaboratory
Females responded to the statement���10
You care about what happens to other people in your neighborhood�
“Agree” 3�41 “Agree” 3�36
People in this neighborhood feel it is dangerous to go outside at night�
“Disagree 2�19 “Disagree” 2�06
People who reported contact with NYPD in their neighborhood in the past two years responded to the statement���11
People feel safe in this neighborhood� “Agree” 3�02 “Agree” 3�10
The items above come from measures of social cohesion, trust and collective efficacy used in past research (Jackson, Bradford, Stanko, & Hohl, 2012; Tyler & Huo, 2002)�
Overall, respondents offered positive answers regarding social cohesion, trust and safety in their neighborhoods� The average response to questions framed positively was “agree”� There were some small group differences, for example, Black participants disagreed slightly more with the idea that “people in the neighborhood are trustworthy” and that they “think of them as friends”, and agreed more with the idea that people feel that “it is dangerous to go outside at night�” Females agree more with one question about social cohesion (“caring about what happens to neighbors”), but disagreed more with another (“thinking of neighbors as friends”); females also agreed more with the idea that “it is dangerous to go outside at night” and disagreed more with the perception that “the neighborhood is safe�” People who have had contact with the NYPD in their neighborhood in the past two years agreed more than others on one item regarding social cohesion, that is, “caring about what happens to neighbors”, but disagreed with an item on collective efficacy (“people in this neighborhood act with courtesy to one another”; from Bradford et al�, 2012)� Yet, these small numeric differences, although statistically significant, did not result in different average responses�
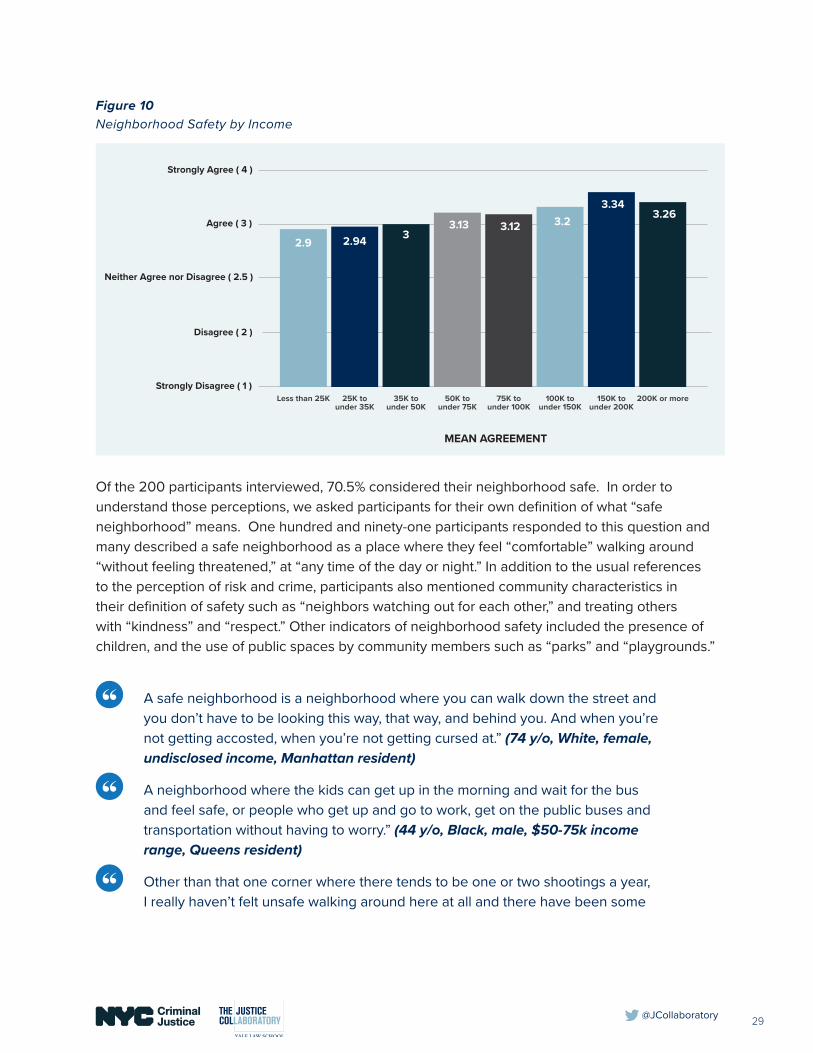
A way to understand how NYC residents experience “fairness” is to analyze differences in responses to quality of life questions by demographic variables� For example, income is related to feelings of safety – a reflection of physical conditions of where the poor versus the wealthy live� The differences in how safe people felt in their neighborhood were significantly related to reported family income (2016)�
10 No significant differences were observed when females were compared to males� 11 No significant differences were observed when we compared against the opposite group�
29 @JCollaboratory
Figure 10Neighborhood Safety by Income
Of the 200 participants interviewed, 70�5% considered their neighborhood safe� In order to understand those perceptions, we asked participants for their own definition of what “safe neighborhood” means� One hundred and ninety-one participants responded to this question and many described a safe neighborhood as a place where they feel “comfortable” walking around “without feeling threatened,” at “any time of the day or night�” In addition to the usual references to the perception of risk and crime, participants also mentioned community characteristics in their definition of safety such as “neighbors watching out for each other,” and treating others with “kindness” and “respect�” Other indicators of neighborhood safety included the presence of children, and the use of public spaces by community members such as “parks” and “playgrounds�”
A safe neighborhood is a neighborhood where you can walk down the street and you don’t have to be looking this way, that way, and behind you� And when you’re not getting accosted, when you’re not getting cursed at�” (74 y/o, White, female, undisclosed income, Manhattan resident)
A neighborhood where the kids can get up in the morning and wait for the bus and feel safe, or people who get up and go to work, get on the public buses and transportation without having to worry�” (44 y/o, Black, male, $50-75k income range, Queens resident)
Other than that one corner where there tends to be one or two shootings a year, I really haven’t felt unsafe walking around here at all and there have been some
Strongly Disagree ( 1 )
Disagree ( 2 )
Neither Agree nor Disagree ( 2.5 )
Agree ( 3 )
Strongly Agree ( 4 )
Less than 25K
NEIGHBORHOOD SAFETY BY INCOME
MEAN AGREEMENT
2.9
25K tounder 35K
2.94
35K tounder 50K
3
50K tounder 75K
3.13
75K tounder 100K
3.12
100K tounder 150K
3.2
150K tounder 200K
3.34
200K or more
3.26

30 @JCollaboratory
nights where I’ve come home by myself really late and I’ve never felt unsafe� If anything, I feel like – because I know my neighbors now especially – there’s a sense of looking out for each other�” (39 y/o, female, White, over $200K, Brooklyn resident)
Participants also mentioned their neighborhoods feel safer now than in times past�
Things can happen, they can happen anywhere, but I feel that the chances of something happening are a whole lot less than what they were before� Whereas before it was an 80 percent chance that if I went to throw out my garbage, I was gonna get mugged in the hallway� Or some guy was gonna approach me and try to get into my apartment� Now, it’s down to a 30 percent chance that could happen; it’s a big difference�” (67 y/o, female, Hispanic, $50-75k income range, Bronx resident)
Table 4 Interview Responses to Neighborhood Safety
Respondents Percentage
Positive 141 73%
Negative 28 15%
Unclear 23 12%
Total* 192 100%

31 @JCollaboratory
Qualitative interview participants were also asked about the types of crime that they believe occur most frequently in the area where they live� Approximately half of those who responded to this question mentioned non-violent thefts (47%), followed by drug selling and use (38%)� Unsurprisingly, less participants mentioned violent offenses against persons such as gun violence (7%) and assault (4%)� Among all offenses labelled under “all others”, respondents mentioned sexual assault and rape (3%), homicide (2%), domestic violence (2%), hit and runs (1%) and unlicensed sales (1%), among others�
Figure 11 Residents’ Beliefs about Most Frequent Crimes by Percentage of Valid Responses
Interestingly, the qualitative interviews allowed us to observe apparent contradictions on respondents’ answers – individuals who believed violent crimes are the most common type of offenses in the areas where they live, did not always report feeling unsafe� Conversely, a percentage of respondents who stated that they feel unsafe in their neighborhoods, believed that minor offenses are the most common type of crimes in the area where they live�
Most Frequent Crimes (percentage of all respondents' mentions)
0 5 10 15 20 25 30 35 40 45 50
47Non-Violent Thefts
Drug Selling and Use
Altercations
Vehicle Theft
Vandalism
Assault
Gun Violence
House Break-Ins
Gang Violence
All Other
38
9
9
7
7
7
6
20
4

32 @JCollaboratory
This apparent contradiction can be explained by the fact that perceptions of safety are also conditioned by factors other than actual crime rates� As numerous scholars have explored, residents’ perception of safety is strongly linked to gender, age, race and the structure of the local economy and labor market (Snedker 2012; Valera & Guardia 2014; Crowl 2017)�
One participant, for instance, a 30 year-old female who resided in Brooklyn, spoke about feeling safe in her neighborhood despite being conscious of the existence of violent crime�
[���] do I feel safe in my neighborhood? Yes, because – it’s like I said earlier – if I come in at 3:00 a�m� – 4:00 a�m� at night alone, I know nothing will happen� And I know that even though there’s gang activities going on – gangs, drugs – I know nothing will happen to me� I would not feel safe if I’m in Long Island, or Queens – because they don’t know me, and – and it’s very quiet� Quieter the neighborhood, the scarier [sic] I am – but there’s always people outside, so I feel safe�” (30 y/o, female, multirace, $50-75k, Brooklyn resident)
A 70 year-old female who resides in Manhattan, on the other hand, described feeling unsafe� Despite the prevalence of non-violent crime, she believed her gender and age make her more vulnerable�
[���] they say it’s a low crime area but I don’t feel that way� A lot of people are new and I don’t know them� [���] If you went outside you could always see somebody you know� I don’t take chances, I’m older now; my children are grown and I don’t know these people� [���] we could get a memo or something out telling people not to open their doors, especially the seniors to be very cautious because if people knew; two ladies said to me they canceled getting on the elevator, don’t get on the elevator by yourself, they’re robbing women� I know two people who were supposedly pick-pocketed or robbed; I don’t know how high it is, how many people this is has happened to� [���] I don’t feel free getting on the elevator at night or anytime by myself�” (70 y/o, female, multirace, $25-35k, Manhattan resident)
33 @JCollaboratory
Conclusions:
Perceptions of “Community”
● Our research findings on perceptions of community contribute to our understanding of collective efficacy, the process through which social ties among neighborhood residents contribute to collective goals (eg: public order or crime control)� Neighbors agree on what is acceptable behavior and reinforce it in each other�
● Residents want to lead the conversations, being heard is not enough� For example, they want to sit on the board, rather than be invited to attend the meetings� Participatory actions could help address these concerns�
● Only 44% of participants said that they consider themselves “involved in the life of their neighborhood�” Respondents are inclined to participate but they don’t know how - they require additional and creative outreach to get involved�
● Communities want and need additional programming to create a tipping point for neighborhood involvement� The qualitative data provided specific examples of initiatives that build social capital (Speakers Corner, Civic Association, non-profit councils)�
● While NYC residents generally feel strong ties to their neighborhood, marginalized populations experience neighborhoods and community differently� The people and places that feel excluded (Blacks, Hispanics, females, Bronx residents) need targeted programing and support�
● 76% of survey respondents considered their neighborhood safe but within the sample, black women felt significantly less safe in their neighborhood� 70�5% of interviewees reported feeling safe in their neighborhood, and referenced community ties beyond the absence of crime when defining safety�
● People who report higher income also report feeling more safe than those with lower reported income�
● When talking about the positive qualities of their neighborhood, participants largely mentioned availability of public services�

34 @JCollaboratory
Perceptions of ‘Government’ Cooperation and Participation with Government
Survey and interview participants were asked a variety of questions about city government, specifically how they interact with, understand, and view their government and agency providers (including NYPD)� MOCJ and the Mayor’s Office have implemented multiple initiatives to show that the government cares about their residents’ well-being and opinions, that the government values transparency, and that decisions about city resources are fair and equitable� We present our findings regarding the success of these efforts to individuals and at a collective level�
Understanding of City Government and Services Interview Data
To capture a nuanced understanding of how NYC residents feel about their city, in-depth in-person interviews included questions about the government, city services, and participants’ understanding of what services the city provides� An example of how interviewees talked about what the city government is supposed to do:
City government – I personally think about the local level and the state level (���) [it] is just the councilmember from my community when I think about city government� How is he doing? What is he doing for our neighborhood? And also what is he doing to preserve the neighborhood and also make it better, and his own agenda?” (26 y/o, male, Hispanic, $25-35K, Manhattan resident )
Interviewees were asked what city services they use, they are aware of, and are most important to their community� Overall, responses were either neutral (demonstrating knowledge) or positive (stating which agencies matter the most and why)� Moreover, with few exceptions, when respondents provided anecdotes about the agencies they named, they were generally positive�

35 @JCollaboratory
We asked participants to name services provided by the City government� Figure 12 below shows which services were most mentioned among all answers - police, sanitation, fire department, and transit (MTA and DOT services)�
Figure 12 City Services Mentioned During Community Interviews
For the most part, interviewees showed good knowledge of the scope of services that the City provides, as well as appreciation for those services�
It is not surprising that police have the highest profile of any New York City agency� When asked “what city agency has most impact in your life and the life of your neighborhood?” 98 of the 200 participants interviewed said NYPD� After the police, the second most mentioned agency was the Department of Sanitation�12
From a ground opportunity, I think it’s the NYPD� In the past, I would see beat cops� I don’t necessarily see that anymore� Maybe they are there and I just don’t run into them� But there used to be these community to beat cops who would get to know people� I don’t know if they do that anymore� It could be that I just don’t hang out in the streets as much and see that� Obviously, sanitation is critical� Obviously, transit is critical� The DOE, that’s a whole other ball but I think it’s very important� They’ve got a lot of problems at the DOE too� So I think that everybody needs to be working – and health, of course, that’s another issue� Every agency is important�” (39 y/o, female, multirace, +$200k income range, Brooklyn resident).
Garbage/Sanitation
12%
Other13%
SocialServices
3%HealthCare4%
Politicians4%
Parks & Rec4%
PublicHousing/NYCHA
5%
Police24%
Fire9%Transit
8%
Education8%
Libraries6%
12 Answers that alluded to the service provided by the agency were aggregated under the agency’s name� For example, “garbage collection”, “waste collection” or “sanitation” were aggregated under the Department of Sanitation (DSNY)�
36 @JCollaboratory
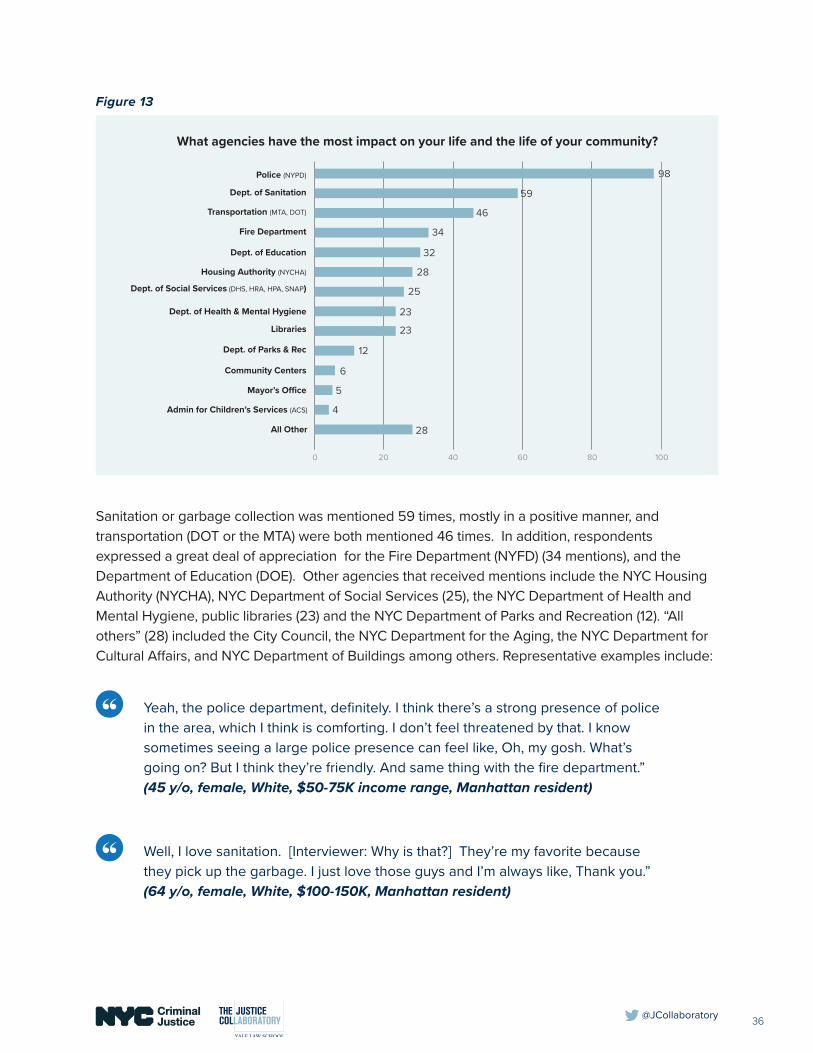
Figure 13 Number of Mentions of City Agencies with Impact on Community Life
Sanitation or garbage collection was mentioned 59 times, mostly in a positive manner, and transportation (DOT or the MTA) were both mentioned 46 times� In addition, respondents expressed a great deal of appreciation for the Fire Department (NYFD) (34 mentions), and the Department of Education (DOE)� Other agencies that received mentions include the NYC Housing Authority (NYCHA), NYC Department of Social Services (25), the NYC Department of Health and Mental Hygiene, public libraries (23) and the NYC Department of Parks and Recreation (12)� “All others” (28) included the City Council, the NYC Department for the Aging, the NYC Department for Cultural Affairs, and NYC Department of Buildings among others� Representative examples include:
Yeah, the police department, definitely� I think there’s a strong presence of police in the area, which I think is comforting� I don’t feel threatened by that� I know sometimes seeing a large police presence can feel like, Oh, my gosh� What’s going on? But I think they’re friendly� And same thing with the fire department�” (45 y/o, female, White, $50-75K income range, Manhattan resident)
Well, I love sanitation� [Interviewer: Why is that?] They’re my favorite because they pick up the garbage� I just love those guys and I’m always like, Thank you�” (64 y/o, female, White, $100-150K, Manhattan resident)
What agencies have the most impact on your life and the life of your community?
0 20 40 60 80 100
98Police (NYPD)
Transportation (MTA, DOT)
Dept. of Sanitation
Fire Department
Housing Authority (NYCHA)
Dept. of Education
Dept. of Social Services (DHS, HRA, HPA, SNAP)
Dept. of Health & Mental Hygiene
Dept. of Parks & Rec
Libraries
Community Centers
Admin for Children’s Services (ACS)
Mayor’s O�ce
All Other
59
46
34
32
28
28
25
23
23
12
6
5
4

37 @JCollaboratory
I love going to the library because nowadays – I mean, they had library cuts, I remember that� They had cuts for the pay, and they actually laid off a lot of librarians because nobody really goes out to the library, but it’s a good place [���]� It’s like that local library, if it shuts down, there’s probably countless and countless people that’s not gonna get their knowledge that they need to obtain� Libraries are important�” (18 y/o, male, Asian, under $25k, Queens resident)
It should be noted that despite being asked specifically about the municipal government, interviewees could not always differentiate responsibilities of different spheres of government� Lack of knowledge about services provided by non-governmental organizations supported by governmental agencies was also evident� One participant, for example, offered the following response when asked about the presence of NGOs in his neighborhood�
Well, let me just say this� Everybody’s connected� Right? Because you have the police department� You have the fire department� You have the churches� You have the hospitals� You have the prisons� That’s coordinated, and you have the gyms, and you have the adult day care centers�” (60 y/o, male, Black, undisclosed income, Bronx resident)
In the quote below, a participant stated when answering about impactful city services:
[���] I’ve had friends who have had real trouble with Social Security� I don’t know� Maybe that’s federal; that’s probably federal� Yeah, I don’t know how to extinguish [sic] exactly which ones to talk about�” (64 y/o, female, White, $100-150k, Manhattan resident)
Community Voice in Public Policy Survey and Interview Data
The community survey asked “How much do the people in city government consider your views and the views of people like yourself when deciding what problems are most important in your neighborhood?” (Q14a)� Only half (52%) of the responses were positive; most people responded with “somewhat�” Statistically significant differences were indicated by borough and precinct crime rate, but not by demographic variables such as race or gender, or by people who had contact with police in the previous two years� Staten Island participants responded negatively more often than residents of other boroughs, with significant differences between Manhattan and Queens respondents� The same is true when asked about implementing plans to address problems, with significant differences present between Staten Island and all boroughs, except for Brooklyn�

38 @JCollaboratory
Figure 14 Beliefs about Government Consideration in Defining Neighborhood Problems by Race
Men and women answered to this question similarly, but there was variation by race� In regards to the question of how often the City government considers the views of participants’ and people like them in deciding what problems are most important to deal with, we noted that Black and Hispanics feel less heard compared to Whites and Asians� We also observed differences by reported family income�
Figure 15 Beliefs about Government Consideration in Defining Neighborhood Problems by Reported Income
White0.00
0.05
0.30
0.35
0.20
0.25
0.10
0.15
0.40
0.45
0.50
Black Hispanic/White Hispanic/Black All Hispanic Asian
BELIEFS ABOUT GOVERNMENT CONSIDERATION IN DEFINING NEIGHBORHOOD PROBLEMS BY RACE
How much do the people in city government consider your views and the views ofpeople like yourself when deciding what problems are most important in your
neighborhood?
Not much at all A little Somewhat A great deal
Under $25K $25K tounder $50K
$50K tounder $100K
$100K tounder 200K
$200K or more
How much do the people in the city government consider your views and theviews of people like yourself when deciding what problems are most
important to your neighborhood?
0%
20%
40%
60%
80%
100%
51.2% 54.1% 54.1%61.6%
48.8% 45.9% 45.9%38.4%
55.0%
45.0%
% great deal/somewhat % at little/not much

39 @JCollaboratory
Half of the sample responded in the negative (a little, not much at all) (Figure 16) to the follow-up question (14b) “How much do the people in city government consider your views and the views of people like yourself when actually implementing plans to handle problems in your neighborhood?”
Figure 16 Beliefs about Government Consideration in Implementing Neighborhood Solutions by Race
Differences were notable between Hispanics (mostly Hispanic-Blacks) and Whites when we asked survey respondents about the City government consideration of their opinions when actually implementing neighborhood solutions�
In order to expand on the survey findings, interviewees were asked a similar question but in an open-ended format: “When creating policies, do you believe that local government agencies incorporate the opinion of people in your neighborhood?” One hundred and fifty-seven (of 200) provided direct responses, with a similar split between “yes”, “no”, and “I don’t know” or “it depends”�
Table 5 Interviewees Perception of Voice in Government
Respondents Percentage
Positive 52 33%
Negative 46 29%
Unclear 59 38%
Total* 157 100%
White0.00
0.05
0.30
0.35
0.20
0.25
0.10
0.15
0.40
0.45
0.50
Black Hispanic/White Hispanic/Black Hispanic(unspecified
race)Asian
BELIEFS ABOUT GOVERNMENT CONSIDERATION IN IMPLEMENTING NEIGHBORHOOD SOLUTIONS BY RACE
How much do the people in city government consider your views and the views ofpeople like yourself when deciding what problems are most important in your
neighborhood?
Not much at all A little Somewhat A great deal

40 @JCollaboratory
Of those who responded negatively (29%) with elaboration, some expressed beliefs that the government is more responsive to the interests of those with “money and power” (9)� Others stated that politicians have “ulterior” or “corrupt interests” (10)� Approximately half of those who responded negatively, however, said that local needs are not acknowledged, or that their expressed opinions and needs are heard, but not really taken into consideration (27)�
Mostly no� A lot of the decisions that are made are not addressing the neighborhood� They take it upon themselves whatever they feel is best for the neighborhood� You can’t know what’s best for the neighborhood if you don’t go out to the neighborhood really needs�” (67 y/o, female, Hispanic, $50-75k, Bronx resident)
[���] I think that they have these meetings� They let people ask questions and talk or whatever, but I think – for the most part – they already have their mind made up and they know what they’re gonna do and they kind of do these meetings so that they can say that they’re giving the community a voice when, in reality, not really�” (44 y/o, female, White, $50-75k, Staten Island resident)
I don’t� I don’t� I don’t� I think the local community leaders listen, document, and forward the information� I believe that� But I think when policy and procedures are being made, I don’t think that actual people who will be receiving those – I don’t think they’re actually kept in mind� I don’t� I don’t think the right people are brought to the table to discuss those things because when they write policy and procedure, there’s a financial aspect that goes with that and where the money is, where the power is, and – So, no, I don’t� I don’t think� No�” (50 y/o, male, Hispanic, $35-50k, Bronx resident)
Among those whose responses were “unclear” or “it depends”, many said that only active individuals or communities are “heard” by City government� That is, only “the loudest voices get heard,” a perception that shifts the onus of participation to the constituents�
I think in some neighborhoods more than others, yes� I think that in neighborhoods where people are vocal and – where people are vocal, yes, and then even more so, if there are vocal people that have money and put their money where their mouth is�” (39 y/o, female, White, $200+, resident of Brooklyn)

41 @JCollaboratory
Not particularly� The City’s too big� I really wish you could do what Staten Island tried to do years ago…Tried to break away from the City� Nassau County used to be part of Queens� Now it’s its own entity, it’s own county� Because you’ve got too many people, and when you centralize the way it is now, things happen on a much, much slower pace� I said, If every community or borough had its own thing, I think things would be done far more efficiently�” (68 y/o, female, Black, $35-50K, resident of Queens)
To measure if participants had knowledge of various channels for political participation, interviewees were asked “How do you think city agencies get information about community opinions?” The 100 valid responses included as the most frequently used channels: direct outreach (through community meetings, town halls, and other public forums (52)); surveys, polls and other research (24); and contact with political representatives (particularly council members (18))�
At least in my neighborhood and I think it’s true for a lot of neighborhoods in New York from what I gather, city council is doing now for example, there is a lot of person-to-person contact� I mean I’ve actually seen my council member here and there in the district� There’s also they’re very active in terms of not only communicating say via email, but also making their offices available to you� They give you their address and their phone number [���]” (60 y/o, male, Hispanic, $100-150k, Manhattan resident)
Well, grassroots organizations, community boards, people having surveys, speaking to people doing their research� Right now, technology, so I’m assuming Facebook, Twitter, anything where people are voicing their frustrations, their opinions about what’s going on in New York City�” (26 y/o, female, Black, $50-75k, Brooklyn resident)
Participants were asked what channels the city could use to increase residents’ participation�
Question:
“How could city agencies collect & integrate information about community opinions into decision-making?”
Of the 82 individual suggestions, the most common was direct, proactive solicitation from City representatives (sometimes referred to as “canvassing”)� The second most frequent response was “surveys or polls”, and other mentions included community meetings, online surveys, social media or apps�

42 @JCollaboratory
They could send out a simple post card with prepaid postage, or one of those you can mail it anywhere in the United States that has very simple questions about things that are on the ballot for this season for the election season� Anything like that, most of the time people do throw that stuff out but who knows? A lot of people may be interested in what they’re being asked, and they can send back some useful information� Another thing they could do is just have more active housing agents going around, at least on that subject have people going around asking them how is their living situation here, is there any way we can make this better? Whenever there’s a decision that needs to be made they can incorporate their opinions�” (24 y/o, male, Hispanic, $25-35K, Bronx resident)
Perhaps a more salient point:
Well, they’ve already got tremendous information gathering services� So, how to improve on that? I don’t know� I think the problem there is just what they’re doing with the information� They have plenty of it�” (63 y/o, male, White, undisclosed income, Queens resident)
Participants were aware of many input points for their opinions, but about one third believed that those opinions do not matter to the City�
You know it’s an interesting thing because it’s very frustrating to voice your opinion and then have it not heard and have it not acted on� I think that having public-private partnerships, having a better town hall system, having – You know it’s interesting� This one-on-one conversation, for example, is a great way to go so that people could be heard�” (67 y/o, female, White, $100-150, Manhattan resident)
It’s the matter of – actually, care� I mean, okay� I think they already know what they’re gonna do and they decided what they’re gonna do, and they know that they have to listen to the – they listen, they know they have to listen to us� But they need to actually put into effect some stuff we say� Instead of just saying, Okay, I heard your demands, I heard your comments� But we’re just gonna move on with what we want to�” (undisclosed age, female, Black, $75-100, Brooklyn resident)
Many participants talked about community-based meetings, and a number of those complained about scheduling�

43 @JCollaboratory
So, I feel like there’s a lot that could be done to reach out to people to make sure that they know that they have an opportunity to give their opinions about something and to make it easy for them to do it online or I don’t know drop it off at the library or something� There’s gotta be a lot of other ways to collect people’s opinions besides having to go to these meetings at locations that sometimes maybe people can’t even get to and at times that people can’t get to them, you know? But it seems like the only way to do it is if you can go to these meetings, which I think is ridiculous�” (44 y/o, female, White, $50-75k, Staten Island resident)
The city should develop capacity to solicit more direct opinions, and make sure city residents learn about opportunities to participate� Knowledge about participation channels and how to access them was scarce� As previously cited scholars have emphasized, providing more opportunities for citizen participation and input in government performance evaluation and policy decision making is an important strategy for improving trust in government�
Community Cooperation with Police Survey Data
Survey respondents were asked several questions about interacting with the NYPD� To understand the extent to which voluntary cooperation is a collective property, respondents were asked about how likely they would be to cooperate in reporting crime under various circumstances and how likely someone in their neighborhood would be to cooperate in these ways with NYPD�
The items were phrased as follows:
How likely would YOU (Q9)/ SOMEONE IN YOUR NEIGHBORHOOD (Q11) be to:
a) Answer questions from the NYPD about someone in your neighborhood suspected of a crime?
b) Report dangerous or suspicious activity?
c) Call the NYPD to report a crime in which you were the victim?
e) Report for jury service if summoned?
How likely would YOU (Q10) SOMEONE IN YOUR NEIGHBORHOOD (Q12) be to report if you witnessed in your neighborhood��� :
a) non-violent crime (such as vandalism)?
b) a violent crime (such as assault)?

44 @JCollaboratory
Survey findings demonstrate that 1) respondents believe that their neighbors would behave differently than they would; and 2) respondents significantly vary in responses to both sets of scenarios based on demographic and residential variables� Respondents generally feel that their neighbors would be slightly less likely than themselves to: answer questions about a suspicious persons (a), report suspicious activity (b) and to call the police if they were victimized (d)�
Figure 17 NYPD Interactions (questions 9-12)
Using simple t-tests,13 we found significant differences across variables� For example, respondents who had contact with the NYPD in the previous two years more frequently said that they would report suspicious activity than those who had not had police contact� There were also significant disparities within race and gender� Black respondents less frequently reported suspicious activity or their own victimization to the NYPD than respondents of other races� And when asked about their neighbors’ behavior, they reported that neighbors would also be less likely to answer questions about a neighborhood suspect and to report victimization compared to other races�
The observations below summarize our main findings:
● Black participants report that they would be significantly less likely to:
● Answer questions from the NYPD about someone in (their) neighborhood suspected of a crime
● Black participants also reported significantly lower expectations than non-Blacks that their neighbors would answer such questions
% very/somewhat likely % not at all/not too likely
You Neighbors
9/11a. Answer NYPD Qs about crimesuspect in your neighborhood?
0%
20%
10%
40%
30%
60%
50%
80%
70%
100%
90%
86.3%
13.7% 16.1%
83.9%
You Neighbors
9/11b. Report dangerous/suspicious activity?
0%
20%
10%
40%
30%
60%
50%
80%
70%
100%
90%
92.8%
7.2% 10.7%
89.3%
You Neighbors
9/11d. Report victimization to NYPD?
0%
20%
10%
40%
30%
60%
50%
80%
70%
100%
90%
95.2%
4.8% 5.2%
94.8%
13 A t-test compares the average values of two groups to determine if differences are statistically significant�

45 @JCollaboratory
● Call the NYPD to report a crime in which (they) were a victim
● Black participants also reported significantly lower expectations than non-Blacks that their neighbors would report such a crime
● Report to the NYPD a non-violent crime (like vandalism)
● Black participants also reported significantly lower expectations than non-Blacks that their neighbors would report such a crime
● Report to the NYPD a violent crime (like assault)
● Black participants also reported significantly lower expectations than non-Blacks that their neighbors would report such a crime
● There was no significant difference between Black and non-Black participants on how likely they would be to:
● Report for jury service if summoned
● Also no significant difference in regards to how they would expect someone in their neighborhood to act
● Report dangerous or suspicious activity
● Also no significant difference in regards to how they would expect someone in their neighborhood
● Compared to other races, Hispanics reported that they would be significantly less likely to:*
● Report for jury service if summoned
● Report to the NYPD a violent crime (like assault)
● Report to the NYPD a non-violent crime in their neighborhood (such as vandalism)
● Answer questions from the NYPD about someone in (their) neighborhood suspected of a crime
● Report dangerous or suspicious activity
● Call the NYPD to report a crime in which they were a victim
● Report for jury service if summoned
*No significant differences were found in how they believe their neighbors would act�

46 @JCollaboratory
● Females reported that they would be significantly more likely to:
● Report to the NYPD a non-violent crime (like vandalism)
● Report dangerous or suspicious activity
● However, females reported that others in their neighborhood would be significantly less likely to report dangerous or suspicious activity
● Call the NYPD to report a crime in which they were the victim
● However, there was no significant gender difference in how likely they expected their neighbors to report a crime in which (they) were the victim
● Those who have had contact with NYPD in their neighborhood in the past two years report that they would be significantly more likely to:
● Report dangerous or suspicious activity
● However, to a marginally significant degree, they report significantly lower expectations that others in their neighborhood would report dangerous or suspicious activity
● Report for jury service if summoned
● Report to the NYPD a violent crime (like assault)
● Report to the NYPD a non-violent crime (like vandalism)
The main borough differences were between those in Brooklyn or the Bronx compared to the rest of the sample�
● People in Brooklyn reported that they would be significantly less likely to:
● Answer questions from the NYPD about someone in (their) neighborhood suspected of a crime
● Participants in Brooklyn also reported a significantly lower expectation that others in their neighborhood would answer such questions
● Report dangerous or suspicious activity
● Call the NYPD to report a crime in which (they) were a victim
● Those in Brooklyn also reported significantly lower expectations that others in their neighborhood would report such a crime
47 @JCollaboratory
● People in the Bronx report that they would be significantly less likely to:
● Report a violent crime in their neighborhood
● They also report lower expectations that others in their neighborhood would report such a crime
● Answer questions from the NYPD about someone in (their) neighborhood suspected of a crime
● Those in the Bronx also report significantly lower expectations that other people in their neighborhood would answer such questions
● Report for Jury Service if summoned
● Those in the Bronx also report significantly lower expectations that other people in their neighborhood would report for jury service
Conclusions
Perceptions of “Government”
● Neighborhood-level self-reported likelihood of cooperation is significantly related to what people predict others in their neighborhood will do� By mapping responses and comparing people’s prediction of their neighbors’ behavior to their neighbors actual responses, we noticed that individuals’ responses predict perceptions of others to cooperate� This suggests that people are aware of their neighbors’ attitudes about cooperation�
● Black respondents, particularly Black Hispanics, less frequently report suspicious activity or their own victimization to the NYPD than respondents of other races�
● When asked about their neighbors’ behaviors, Black respondents report that neighbors would also be unlikely to answer questions about a neighborhood suspect and to report victimization, when compared to other races�
● In general, participants don’t feel heard by City government� When asked “How much do the people in city government consider your views and the views of people like yourself when deciding what problems are most important in your neighborhood?” only half (52%) responded positively, with the majority responding “somewhat�” Perception of voice was also different by race: Whites feel that their opinions are heard and taken into consideration more often than Blacks and Hispanics�

48 @JCollaboratory
● There are disparities in responses by income� Nearly 62% of individuals who reported a family income of $200k or greater in 2016 believe that their opinions are considered by the city government “somewhat” or “a great deal” compared to just 45% of respondents with a reported income of $25k to $50k�
● A major takeaway from interviews is that the City should consider more direct solicitation of opinions, but only if there is a way for those opinions to be reported back to the community, in order to ensure residents that their voices are being heard�
● People don’t always know the difference between services provided by the city, state, and federal government, and sometimes conflate non-profits with city services� Yet, NYC residents interviewed for this study were able to identify numerous city agencies, and for the most part, were grateful for those services� Police have the highest profile of any New York City agency - NYPD was mentioned by nearly half of the interview participants (98 of 200)�

49 @JCollaboratory
Perceptions of Police (NYPD) Survey and community interview respondents were asked multiple questions on their perceptions about police� Specifically, questions focused on policing legitimacy and effectiveness, personal experience with police in the neighborhood they lived in, procedural justice, and community outreach efforts on behalf of the NYPD� We collected summary information about individual interactions, including age at contact with police, income, feelings about the contact, and police presence� Analyses of these data are discussed below�
Personal experiences with police in the neighborhoodSurvey Data
Survey respondents were asked, “Have you had any personal contact with NYPD officers in your neighborhood in the past two years” to which approximately 38% said “yes�” By age range, 43% of those 51 to 60 years of age answered “yes” (the greatest percentage) compared to just under 28% of those aged 71 to 80 (the lowest percentage)� As this question asked about any personal contact (as opposed to being stopped by police), the findings are not counter-intuitive�
Table 6 Contact with Police by Respondent Age
Age Range Yes No Total Y/N %Yes
18 - 20 39 91 130 30�0%
21 -25 67 132 199 33�7%
26 - 30 89 132 221 40�3%
31-40 160 237 397 40�3%
41-50 154 216 370 41�6%
51-60 194 257 451 43�0%
61-70 141 256 397 35�5%
71-80 50 129 179 27�9%
81-90 16 40 56 28�6%
91-100 24 55 79 30�4%
TOTAL 934 1545 2479 37�7%

50 @JCollaboratory
Differences in Contact
Contact with police (distinct from being stopped by police) is slightly higher for men (39%) compared to women (36%), and for respondents who reported incomes between $150k and $200k per year (close to 50%) compared to only about 28% (the lowest percentage) of those who reported incomes of less than $25k (Figure 18)�
Figure 18 Contact with Police by Reported Family Income, 2016
Feelings about police contact
Survey participants were asked a series of questions about police encounters, quality of these interactions, and their perceptions about community-outreach organized by the NYPD� These questions were phrased both positively and negatively, and responses were collected on a five point scale from “strongly agree” to “strongly disagree” (including a “neither” option)� “When you think about the NYPD in your neighborhood, do you feel:”
Less than$25,000
$25,000 tounder $35,000
$35,000 tounder $50,000
$50,000 tounder $75,000
$75,000 tounder $100,000
$100,000 tounder $150,000
$150,000 tounder $200,000
$200,000 ormore
(vol) Don’t know/Refused
0%
20%
40%
60%
80%
100%
Yes No

51 @JCollaboratory
Figure 19 Disagreement with Positive and Negative Emotion in Relation to the NYPD14
Black and Hispanic-Black participants indicated feeling less reassurance and more threat around the NYPD, when answers were broken down� All racial groups except for Asians also indicated feeling more more anger around the NYPD than non-Hispanic White participants�
Past research has indicated that these emotions are related to how people think of the NYPD and whether they would cooperate in reporting crime to the police�
In a multiple regression analysis, reassurance, anger, and threat have positively, negatively and negatively (respectively) predicted beliefs about legitimacy of the NYPD in the neighborhood� Together, they account for 60% of why people differ in their views of police as legitimate�
Reassurance and threat are positively and negatively (respectively) related to willingness to cooperate with NYPD, while anger was not uniquely related to cooperation� Together, these two emotions (reassurance and threat) accounted for 14% of the differences between people who reported that they would or would not cooperate in reporting crime to the NYPD�
Interview participants were asked whether they have ever been stopped by a police officer in New York City (as a driver or a pedestrian)� Sixty-one percent of 187 total valid answers indicated that the participant had been stopped by the police before (Figure 20)�
White Non-Hispanic Black AsianHispanic/White Hispanic/Black Hispanic
1
1.5
2
2.5
3
3.5
4
Emotions around NYPD by Race/Ethnicity
Reassurance Threat Anger
14 Responses to positive items are coded with 1 = “strongly agree” and 5 = “strongly disagree” so that higher numbers indicated disagreement with positive items, which suggest negative attitudes� Responses to negative items are coded with 1 = “strongly disagree” and 5 = “strongly agree” so that higher numbers indicate agreement with negative items, which also suggest negative attitudes�

52 @JCollaboratory
Figure 20 Interviewees Stopped by NYPD
Of those who have been stopped, 48% classified their interaction negatively, describing the officer or the encounter as “disrespectful”, “rude,” “annoying,” or “scary�”
So they pulled me over for talking on a cell phone� And I think that it was three or four cops; so it was trainees and they’re were doing a drive by� They were so incredibly harsh, and rude, and made my children cry�” (39 y/o, female, other/multirace, over $200k+ income range, Brooklyn resident)
They just were saying that they were looking for a burglar or something and he was like, “Oh, we don’t care if you have drugs� We just want to know if you have any guns� We heard you had guns�” But I don’t know, I didn’t really pay it any mind because that’s how you get hostile and then you get upset […] I mean they were just very rude�” (40 y/o, male, Black, under $25k income range, Bronx resident)
Have beenstopped
61%
Have notbeen stopped
39%

53 @JCollaboratory
Figure 21 Quality of Police Interactions
Forty percent of participants described their interaction as “positive” and 12% described their interactions as neutral (6%) or “sometimes good, sometimes bad” (6%)� Two examples follow:
It was a polite, professional experience because I was stopped for a traffic violation, and the officer and I were polite to one another and it worked out well�” (55 y/o, male, White, $50-75k income range, Staten Island resident)
In my neighborhood, it’s good� I haven’t seen any policemen doing anything unfair or horrible or disrespectful things to people in my neighborhood� I can only speak on that, but yeah� Anytime I’ve interacted with them it’s been nice and Hello, ma’am� How are you?” (38 y/o, female, Black, under $25k, Brooklyn resident)
Negative48%Positive
40%
Neutral6%
Positive &Negative
6%

54 @JCollaboratory
Figure 22 Tag Cloud for Positive Interactions15
Reason for Contact
When asked about reasons for which they would call the police, participants mentioned traffic accidents, crimes (when victims or witnesses) and other emergencies� Interestingly, 12% of participants (17) indicated reluctance to call the police and a strong preference for resolving problems without police assistance:
I think in terms of situations where there’s a lot of anger, there’s a lot of force, in a situation where people are fighting, people are contentious, I wouldn’t call the police because for the most part, the police will just show up and arrest everybody� They’re not really trying to hear anything� They’re not trying to deescalate the situation� They’re just ready to throw on cuffs and knock people up against walls�” (19 y/o, male, Black, $75-100k, resident of Brooklyn)
I don’t like them, they don’t serve any public need� I think it’s good that they exist so people who do commit crimes can be paranoid that something might happen to them, but the police as an institution I don’t respect at all�” (24 y/o, male, White, $200k+, resident of Manhattan)
15 The tag cloud for frequent words used by respondents who had negative interactions with police officers did not yield a significant result given the large number of responses using positive adjectives in the negative form (i�e� “the police officer was not courteous”)�

55 @JCollaboratory
I’m not gonna call the cops� I’m not interested, not that I’m not interested, but I just don’t feel as though – I don’t respect what’s going on right now with the NYPD so and a big thing that people are saying like, ‘If you don’t like it then don’t call us’ and I don’t want to� I don’t want to call you� If I need help I’m gonna call my dad or my stepdad or my uncle or whomever�” (20 y/o, female, Black, $35-50K, resident of Staten Island)
Interviewees were also asked, “What factors do you believe inform a police officer when deciding to make a stop?” In 181 valid answers, 42% of respondents indicated that police stops are based on “suspicious behavior or recognition of a suspect,” while 38�8% indicated that demographic characteristics such as “race, ethnicity or age” are the deciding factors� Almost 1 in 5 respondents (19�2%) brought up other reasons such as “public safety,” “safety of officers themselves,” and “quotas” (Figure 23)�
Figure 23 What Informs Police Stops?
During the qualitative interviews participants were asked whether they would like to see more or less police in their neighborhood� Of 173 valid answers, 59% of respondents said that they currently “see the right amount” of police in their neighborhood or were indifferent about it� Thirteen percent said that they would like to see less police in their neighborhood, and 28% said that they would like to see more police officers around�
Suspicious behavior /Recognition of suspects
Race, Ethnicity, Age Other0.0%
15.0%
10.0%
5.0%
20.0%
25.0%
35.0%
40.0%
30.0%
45.0%
42.0%38.8%
19.2%
What Informs Police Stops?

56 @JCollaboratory
Figure 24 Opinion about Police Presence in the Neighborhood
In addition to participants’ opinions about their interaction with police officers in the context of a stop, interviewees were asked about their personal interactions, or interactions of close friends and family members with police officers (i�e� during arrests, visits to a precinct, or when police responded to a service call)� Of 187 valid answers, 35% of respondents described a higher number of positive experiences with police officers (compared to negative experiences), while 31% described a higher number of negative experiences (compared to positive experiences)� Twenty-seven percent, on the other hand, described an equal number of positive and negative experiences, and 7% considered their experiences to have been “neutral” (neither positive or negative)�
Figure 25 Experiences with Police16
Desirability of Police Presence in Neighborhood
0% 10% 20% 30% 40% 50% 60% 70%
Neutral / Right Amount of Police
Not Enough / Want More Police
Too Much / Want Fewer Police
59%
28%
13%
Positive35%
Negative31%
Positive &Negative
27%
Neutral7%
16 Not in the context of a stop�
57 @JCollaboratory
Positive comments about encounters with police officers included the use of words such as “professional”, “respectful”, “pleasant” and “friendly” to describe experiences� Of the 172 positive interactions described, 37% were “non-specified casual interactions” between civilians and officers (the greatest percentage of responses)� These were occasions in which civilians approached officers to ask questions or to engage in conversation� One example of such descriptions is presented below:
I have gone up to police officers to ask them questions, there might be something going on, and I wanna know what’s going on, I will approach them and ask the question� I’ve always gotten responses that were polite�” (66 y/o, female, Black, 150-200k, Brooklyn resident)
The second most common situation in which respondents experienced a positive encounter with police was during a request for help (23%), followed by a situation in which the respondent (or somebody close to them) was victim of a crime (20%)�
I called the police about three months ago, my neighbor was sitting in the hallway with no clothing� She was naked� I couldn’t seem to talk to her because she was having a violent episode� I called the police� They were very nice about it� They dealt with her with respect even though she was nasty to them� The police officer came and asked me if I was okay� They were very pleasant�” (67 y/o, female, Hispanic, $50-75k, Bronx resident)
I had a bicycle stolen from my front porch� I reported it and the policeman came out� They were kind� They listened, but there’s not much you can do with something like that� But I was treated with respect�” (65 y/o, male, White, $150-200k, Staten Island resident)
A common thread throughout most positive experiences was respondents’ appreciation for tactful and courteous treatment by police officers, in agreement with the theory of procedural justice (Tyler, 2006)� Factors such as how willing police officers are to listen to people and show concern for their circumstances were considered important, as were their general politeness and helpfulness�
[���] I was not very happy� But the police officers who stopped me were polite, and courteous, and gave me my paperwork, and appeared broadly sympathetic, while at the same time, giving me the citation� So, I would say that was a posi – was a negative interaction because I didn’t want to be there, but it was positive in terms of their behavior�” (39 y/o, female, White, $50-75k, Brooklyn resident)

58 @JCollaboratory
One time the police was called to my house because there was a big argument and my nephew was there, and sometimes when people see a child they – the officers would then call child services, but instead they told – they pulled us aside, they took extra time to make sure we got – everybody in the house got to a good place and a resolution, and they told us that they’re not gonna report anything or call child services because it could look bad just over a little argument and misunderstanding�” (22 y/o, female, Hispanic, $25-35k, Queens resident)
Information sharing was also cited as an important factor, especially in relation to victims who expected to be informed about progress in their cases�
They were nice when I lost my money���They were very professional and that police-lady she was very kind in terms of trying to get me to just trust her and I had to follow up with a detective and it was two Latino detectives, actually� So, I don’t know if they were connected with me because of my name, like “Let’s go for someone that reflects who she is” or whatever� But they were very professional and what I mean by that is they followed up accordingly and they would call me periodically and let me know how they were doing – which I thought was very kind because it was an unnerving experience�” (64 y/o, female, Hispanic, $50-75k, Manhattan resident)
Most positive experiences with police were described by White respondents�17 Although Whites represented 51% of the total interview sample, 62�5% of those who described positive encounters with police officers were White� Conversely, while 21% of respondents were Black, only 12�5% of those who described positive experiences were Black�18
One hundred and sixty-six negative experiences between respondents and police officers in New York City were described during interviews� The negative experiences fell into 3 main categories, according to the respondent’s position: crime victim, someone calling for help, or crime suspect� In most of these negative experiences (24%), crime victims described feeling unheard, unattended to in a timely manner, not properly treated or generally dissatisfied with the results of the police services they were provided with�
Again, for me, another negative one was when I did get robbed� You get questioned in a way where they think you’re lying and it’s very aggressive� It’s not even like, “Okay, you’re hearing my side of the story, but I may be lying, so you have to press me�” But it was really aggressive, like, “No, you’re just lying�” And you’re just like, “Whoa, okay, I don’t feel like you’re helping me� So, if I don’t feel like you’re gonna help me and you’re the police – you’re the NYPD – then who’s gonna help me?” (21 y/o, female, Hispanic, less than $25k, Bronx resident)
17 Generally 50 years old or older�
18 There was no significant gender or borough discrepancy� Females, for example, comprised 44�5% of the total sample of interviewed and 45�8% of those who described positive experiences�

59 @JCollaboratory
The second most frequently described negative experiences were instances in which people reached out to the police for help but felt like occurrences were not addressed properly, with respect for the rule of law, efficiency or courtesy (17%)�
Some kids were doing something outside, I don’t know what made her come to my house [policewoman]� They thought they [suspects] came to my apartment [���]� She pulled her gun� I said “they’re not here, I don’t know what you’re talking about, nobody came here�” She reached for her gun and told me “let me see�” It frightened me� I was so frightened I didn’t think to get her badge or anything� [���] They’re not supposed to be reaching for a gun� You don’t do that�” (70 y/o, female, multirace, $25-35k, Manhattan resident)
I called 9-1-1, and the police came, and they were incredibly rude to me, “Get out of the way! Get out of the way!” I said, “I tried to be helpful� I just called you,” and that was really an unpleasant encounter with the New York Police Department�” (69 y/o, male, White, over $200k, Manhattan resident)
A similar number of experiences (16%) referred to circumstances in which dissatisfied civilians were suspected of committing an infraction or crime� Moreover, although some participants mentioned not having had direct negative encounters with police, they spontaneously expressed knowledge of negative encounters experienced by others in situations that they have witnessed or learned about through the news media�
Well, I haven’t experienced a negative experience directly, but I’ve seen the police act in ways that I consider negative – screaming at people� A couple of specific incidences where I felt the police behavior was totally out of line�” (64 y/o, male, White, less than $25k, Manhattan resident)
I had to go to the precinct, but it was very frightening� I’m very scared of the police� I never go into the precinct� I don’t know why� I mean, I know that they’re supposed to help us, but I’m just scared of the police� [���] Look at all those killings of black young men� And, of course, it’s always presented like that person deserved it or that person provoked the police, but I don’t always believe that�” (64 y/o, female, Hispanic, $50-75k, Manhattan resident)
Negative experiences were largely characterized by lack of procedural justice (64%)� Participants who described negative encounters spoke almost unanimously about police officers’ lack of politeness or attention� Fewer experiences referred to negative outcomes (28%), such as issuance

60 @JCollaboratory
of tickets and summonses, arrests, unsatisfactory victim response or non-resolution of a problem for which police were called� A third common characteristic of 8% of all negative experiences was participant’s belief that police officers engaged in some type of misconduct� The passages below respectively exemplify these three classifications:
Honestly, I think the No� 1, let’s start here, how about some basic common decency� Just be polite� My interactions with police have been overwhelmingly negative in just sort of a general sense� I don’t know� My wife had an issue where she was afraid she might’ve had an identity theft� And so, I called the local precinct and said, “How do you deal with this?” And he told me to call 9-1-1� And I said, “Really? The emergency line?” And his answer was, “Did I fucking stutter?” That kind of interaction is common� And I’m a middle-class, white man� So, that’s the best it gets� That’s where I think we have to begin�” (52 y/o, male, White, $75-100k, Queens resident)
My house was broken into� We called the police� [���] I was waiting for them to arrive, they took their sweet time� On top of that, they made it seem as if nothing happened; it wasn’t that serious� [���] They didn’t seem empathetic at all� They left – throughout the investigation detectives came and left this huge mess when they were looking for evidence� It was ridiculous� Nobody stayed in touch with us� The whole time we had to push to get information, to see what the progress was� Ultimately there was no closure with the case in the sense where they said they got the guy, or didn’t get the guy� Eventually, I saw in the paper that the guy was caught, and it was someone who lived in our neighborhood, but they didn’t reach out to us to let us know�” (66 y/o, female, White, $100-150k, Manhattan resident)
I’ve witnessed NYPD beat my mom up and beat my brother up in front of my eyes on my steps� [���] They were having a family argument or something like that� One of the neighbors or somebody passing by the house called the police and they just rolled up on the house ready to throw people against the wall� My mom had long dreads and they ended up ripping out a bunch of her hair, grabbing her around her waist and throwing her on the floor and stuff like that� And my older brother was trying to get them off and they eventually arrested him and they arrested her and they took them into holding and I seen them throw my brother down a flight of stairs�” (19 y/o, male, Black, $75-100k, Brooklyn resident)
Twenty-seven percent of participants who provided us with valid responses described an equal number of positive and negative experiences, and 7% described their experiences as “neutral”�
Unlike positive experiences, negative experiences were independent of respondents’ borough of residence, age and race - i�e� the proportion of Whites, Blacks and Hispanics who described

61 @JCollaboratory
negative encounters matched the racial proportions of our sample�19 A difference in gender, however, was observed; although women made up 44�5% of the sample, they narrated 53�3% of all negative experiences�
For both self-initiated and police-initiated encounters, it appears that what respondents found to be remarkable was police politeness, courtesy, helpfulness, fairness, willingness to explain the situation and to listen to what they had to say� This reinforces the importance of procedurally just policing, particularly in times when police legitimacy has been impacted by evidence of SQF activity that violates the requirements in New York State and federal law for unbiased, individualized and justifiable stops (Fagan & Geller, 2015; Fagan, Tyler & Meares, 2016), as well as highly publicized and controversial deaths caused by police action throughout the country (Nix et al�, 2017)�
Policing Legitimacy & Effectiveness Survey Data
Survey participants were asked about police in their neighborhood, including the three components of legitimacy: trust and confidence; obligation; and normative alignment�
● Trust and confidence refers to how much people trust NYPD in their intentions and competence�
● Obligation assesses whether people believe that NYPD officers in their neighborhood are legitimate authorities and therefore should be obeyed with regard to the decisions they make�
● Normative alignment refers to what extent the NYPD in their neighborhood use their power in ways that align with one’s own values�
Section VII of the survey asked participants to report their agreement with several statements about how fairly police in their neighborhood treat people and make decisions (procedural justice)� These are different from the procedural justice questions regarding personal experience because we asked people to reflect about how they think NYPD in their neighborhood act generally, not just towards them personally� We assessed beliefs about procedural justice in the neighborhood using scales validated in past research (e�g�, Tyler & Jackson, 2014)� Data from these sections of the survey were used in these analyses� We measured procedural justice by responses to the following:
Question
We want to ask you not just about your own experience, but also about what generally happens in your neighborhood� We realize you may not know for sure,
19 Our sample of interviewees was 51% White, 21% Black, 16�5% Hispanic, and 5�5% Asian� Among those who described a negative experience with the police in New York City, 51�1% were White, 21�1% were Black, 14�4% were Hispanic, and 4�4% were Asian�

62 @JCollaboratory
but we just want to know what you think� There are no right or wrong answers� Based upon what you have seen or heard, how often do the NYPD in your neighborhood do the following:
���Use fair procedures when making decisions about what to do?
���Treat people fairly?
���Treat people with courtesy and respect?
Community members evaluated the NYPD in their neighborhood as “often” using procedural justice� Given a range of options including “Never”, “Almost Never”, “Seldom”, “Sometimes”, and “Always”, the average response ranged between “Often” and “Always”� There was variation between ethnic groups; the most positive responses came from White, Hispanic, and Asian respondents� Significantly less positive responses come from Black respondents, whose responses ranged on average between “Seldom” and “Often”� Although perceptions were overall positive, it was not universal (Figure 26 below)�
Figure 26 Perceptions of Procedural Justice in the Neighborhood
As in past research and polling (e�g�, Fingerhut, 2017; Tyler, 2005; Tyler & Huo, 2002), the data demonstrate that Blacks and Hispanics expressed significantly less favorable views about police than other racial groups (Figure 21)� The results show that Black and Hispanic respondents had less positive beliefs about procedural justice of NYPD in their neighborhood than non-Blacks and non-Hispanic, responding that police are “sometimes” rather than “frequently” or “always” procedurally just more than those who are not Black or Hispanic (although they rarely responded that police are “never” procedurally just)�
1
1.5
2
2.5
3
3.5
4.5
4
Black White Hispanic Other

63 @JCollaboratory
A total of 905 survey respondents indicated that they had contact with NYPD in the previous two years�20 They were asked a subset of questions to gage perceptions of NYPD as following procedural justice principles, including the statements:
A� The officers made their decisions about what to do in a fair way�
B� The officers treated me fairly�
C� The officers listened to what I had to say before they made decisions about what to do�
D� I was treated the same way that others would be in a similar situation�
E� The officers made their decisions based upon the facts�
F� The officers were honest in what they said to me�
G� The officers tried to do the right thing in this situation�
H� The officers tried to take account of my needs and concerns�
I� The officers treated me politely and with respect�
J� The officers respected my rights�
Figure 27 Perceptions of Procedural Justice in Personal Interactions with the NYPD in Neighborhood
1
1.5
2
2.5
3
3.5
4.5
4
Black White Hispanic Other
20 Respondents who indicated that they had contact with NYPD in the previous two years were asked “Please think about the time in the past two years that stands out most clearly in your mind in which you personally dealt with NYPD officers in your neighborhood, in a situation in which you were directly involved and not just a witness� Please think about this experience that stands out most clearly in your mind…I am going to make a series of statements about this personal experience you had with the NYPD in your neighborhood� For each, please tell me again whether you strongly agree, agree, disagree, strongly disagree, or neither agree nor disagree�”

64 @JCollaboratory
Black and Hispanic respondents expressed significantly less agreement to these questions, indicating that they experienced their interactions as less procedurally just�
Demographic factors shape the experiences and behaviors that people report on surveys� For example, people in neighborhoods with greater percentages of Black residents express less positive beliefs about procedural justice and legitimacy of NYPD in their neighborhood, and report less cooperative behavior, independent of their own race�
Although Black participants indicated that they view the NYPD as less legitimate, the racial difference disappears when we control for beliefs about procedural justice of the NYPD� That is, differences in how fair racial groups perceive the NYPD to be, explain differences in the perceptions of legitimacy (beyond race)� In order to test if community-held beliefs or norms are related to individuals’ beliefs regarding procedural justice, participants were asked their level of agreement with several statements about the fairness of police treatment and decision-making� Respondents were asked to think about how NYPD in their neighborhood act generally, not just towards them personally� Our analyses suggest that the level of procedural justice that participants perceive within a neighborhood predicts cooperation (e�g� the questions reflected in Figure 26)� Since analyses control for participants’ personal beliefs about procedural justice (their individual scores), it suggests that neighborhood norms have an impact above personal beliefs�
Initiatives to Build Trust with Community Survey Data
A central goal of this project was to analyze the impact of community-level initiatives that police take to build trust with communities� In academic research, “reconciliation” between authorities and communities means a process and set of actions that authorities, such as police, take within communities in an effort to build trust� Reconciliation efforts are often implemented within communities that have long histories of distrust with police� This research is the first to test the impact of knowledge about police-led community-level actions to build trust with communities�
Police across the country, including in New York City, have embarked on initiatives to build trust with communities� In New York City, this includes the New York Police Community Affairs Department and programs such as the Neighborhood Coordination Officer program� Our survey data captured the impact that police-led initiatives have on legitimacy and cooperation, separate from the impact of beliefs about NYPD interactions, reflected in respondents’ beliefs about procedural justice�
Our survey addressed this question in two ways� First, we asked respondents whether they had heard of any initiatives by NYPD intended to build trust with the community in their neighborhood� (The initiatives were intentionally undefined because we wanted to capture all programs that respondents think are intended to build trust with the community, rather than focusing on whether a specific program is implemented in selected neighborhoods�) We used the phrase “initiatives to build trust” in the survey� “Yes” respondents were asked to describe the initiative in one sentence� Reading through brief participant descriptions, five categories emerged� Respondents believed

65 @JCollaboratory
that these initiatives are:
1� meetings between police and the community, including police participation in neighborhood meetings (247 mentions) or meetings with religious groups (24 separate mentions);
2� “outreach” or “reach(ing) out” (undefined) (65 mentions);
3� meeting with youth, such as walking them across neighborhoods or visiting schools (“school”, “youth”, “kids”, “child”; mentioned 131 times);
4� events like a community fair or “crime night out” (57 mentions); and
5� the police response following a “crime” (19 mentions of responses)
Also noteworthy, the words “safe”, “protect”, or “secure” were frequent mentions (24 times)�
The second way the survey addressed this question was by asking respondents about community participation in police decision-making� Participants were asked how often their views and the views of others like them are considered by police in determining which problems receive the highest priority� Respondents were also asked how often their views are considered when determining neighborhood policing strategies�
Knowledge of police-led initiatives and perceptions of how often community participates in police decision-making predict stronger beliefs about the legitimacy of NYPD and more cooperative behavior, even when controlling for demographic characteristics such as race and ethnicity, as well as political orientation, income and education, and beliefs about procedural justice� These controls suggest that the association between knowledge of initiatives and beliefs about legitimacy and cooperation is not due to a simple “pro-police” orientation common to both variables�
Perceptions of Sincerity Survey and Interview Data
Respondents who knew of a police-led initiative were asked to rate their perceptions of its sincerity; in other words, we asked if participants believed that goals of police-led initiatives were sincerely intended to help the community� In general, most agreed that initiatives were sincerely intended to help the community� These perceptions are critical to how the initiative impacts police-community relations�21
To test the effect of initiatives that participants did not perceive as sincere we compared three groups:
1� Participants who have knowledge of an initiative and perceive it as sincere
21 These results will be published and described in more depth in a forthcoming paper in the Journal of Regulation & Governance (O’Brien, Tyler, & Meares, in press)�

66 @JCollaboratory
2� Participants who have knowledge of an initiative and perceive it as insincere (or did not answer the question)
3� Participants who have no knowledge of an initiative
Our analyses demonstrated that people who knew about an initiative and perceived it as sincere viewed the NYPD as more legitimate than others� However, those who did not perceive the initiative as sincere viewed the NYPD as less legitimate than people who did not know of any initiatives� Our analyses controlled for potential confounding variables, suggesting a causal relationship� In other words, police-led initiatives that are intended to help communities likely help legitimacy when perceived as sincere but may actually harm the legitimacy of the police when they are perceived as insincere�
To supplement our knowledge of community awareness of police-led initiatives, community members were asked during interviews the same question they were asked on the survey: Do you know of any NYPD initiative, current or past, to build trust or improve relations between the community and the police? Of 186 participants who responded to this question, nearly one third of participants said that they have no knowledge of such initiatives�
I don’t know of anything specifically� But I’ve heard somewhere in the ether that they know their PR is pretty bad, so that they’re trying to do something about it� But I don’t know any details� I don’t know what their plans are�” (60 y/o, Black, female, $50-75k income range, Queens resident)
In approximately 2 in 3 interviews (127 total), the respondent had some knowledge of efforts to improve police-community relations� A number of interviewees mentioned knowledge of NYPD messages about community initiatives, although not necessarily first hand� Examples include:
We work with the police, the 113th Precinct� In fact, we just met with their detective this past Saturday� We had that detective participate in a civic meeting, 32 people showing up, bombarding him with questions, and getting answers�” (68 y/o, female, Black, $35-50k income range, Queens resident)
Follow-up questions for participants with knowledge of NYPD initiatives included: Why do you think that the NYPD takes or would take such initiatives? and Who do you think the NYPD is trying most to help in these efforts? One hundred and sixty five interviews contained relevant responses� A subset of interviews was further analyzed for more specific content� In this sub-sample, 11 respondents said that police-led initiatives are for the good of the community and 7 believed that they are intended to improve relationships between the community and the police� Ten interviewees expressed the belief that the initiatives are intended only to help the NYPD (and not communities) with varying levels of cynicism�

67 @JCollaboratory
Well, it’s the – it’s relations� Public relations� That’s what they call it, public relations� Right? It’s very important in the community, because that precinct, in that community, in that neighborhood, supposed to serve and protect� Not shoot first and everything like that� You know? Just shoot people because they looked at you – you thought they pulling a gun, or they go in their pocket and it’s a wallet and you’re getting shot� Next thing you know they dead on the street and it’s a wallet in they pocket�” (117247: 60 y/o, male, Black, undisclosed income, Bronx resident)
Other responses included that initiatives are politics/political administration efforts (3), to reduce crime (3), and focus on young people (4), elderly (2), “minority” communities (3) or shop owners (1)�
Community members were asked “Do you think these efforts will or could help improve relationships between police and community? Why or why not?” Of the 53 coded segments (in a sub-sample of 52 interviews), no respondents explicitly stated “no”; 29 said “yes” and 24 qualified their affirmative response�
I hope so� I think it’s a long road� I think there’s a lot of damage that’s been done and there’s a lot of distrust� So, I think it’s going to take a long time but, you know, I think you’ve got to start somewhere�” (27 y/o, female, white, $100-150k income range, Queens resident)
I think it could, yes� Because if there’s a way to build trust that we can trust the police, that would be beneficial to both the police and the local community, to all people, to elected officials, to our city as a whole, but I don’t know that we are there yet�” (50 y/o, male, Hispanic, $100-150k income range, Manhattan resident)
I believe they do� Simply because it builds trust, it builds understanding, it builds familiarity, and it also helps build community�” (63 y/o, male, White, income undisclosed, Queens resident)
Half of the respondents said that in order for these police-led initiatives to succeed, the focus should be on NYPD building individual relationships (getting to know people, listening, developing trust)�
So, I think they should just go out of their way to be more nice to people, you know? Hold the door open for the old lady you know like give up your spot in line for whatever it is� And I know it’s not really their job and I know that� It’s not their responsibility to do that, but if they want to improve their public image and not be looked at as negative as much as they are, they could do that you know�” (20 y/o, male, Hispanic, $75-100k, Manhattan resident)

68 @JCollaboratory
More specific recommendations included more training (7), community participation (being part of the community) (7), getting out of cars and walking the neighborhoods (7), and improving accountability for police officers (6)� Interviewers also called for more diversity in hiring (2), community building (formally working to improve communities) (3), and addressing prejudice and discrimination that stems from the structure of institutions (institutional racism) (2)�
Yeah� It could� But on the other hand, if an officer is really good at their job, they’re gonna get promoted and then you got a newbie and start that process all over again� If you’re going to police, I don’t think there’s anything wrong� Park the car somewhere, go for a walk through the neighborhood� Just go for a walk� You don’t have to ride� You don’t see anything� You’re moving too quickly� You don’t hear anything� You can’t hear� You got the window up�” (73 y/o, male, White, income undisclosed, Brooklyn resident)
Two interviewees said that communities must take actions of their own volition in order to improve relationships with police�
I hear the police are saying all day long on TV and radio you know, “We have to be friends� We have to get to know each other�” I don’t ever hear the other people who they’re talking about� I never hear them saying, “We’ve got to get to know the police better�” It takes two�” (88 y/o, female, White, income undisclosed, Manhattan resident)
Interestingly, a number of interviewees mentioned specific incidents of police abuse of power, including the Eric Garner killing (mentioning Garner specifically) (3), use of police chokeholds (6), Michael Brown and Ferguson, MO (3), Philando Castile (2), Tamir Rice (3), and Trayvon Martin (1), and an NYPD rape whistleblower firing (1)�
Me, personally, I just don’t see it because I think there’s one thing and one thing only that is gonna improve the relationship between urban communities and the police and that is – I’m just throwing numbers out there – but I think the police force – regardless of how many members are on that police force – five to ten maybe even more of a percentage of the police force is dirty, is unscrupulous, is immoral� And I think that 85 to 90 percent of good cops that want to have a good relationship with the community, they need to band together and get rid of that five to ten percent of dirty cops that they know are dirty cops� And once they do that and that gets televised and people start to see the good cops don’t want have anything to do with the bad cops� So, they’re doing everything that they can to push these bad cops out� When the community see that, that will improve relationships in the community with the police�” (48 y/o, male, Black, $50-75k income range, Brooklyn resident )

69 @JCollaboratory
Stop, Question, and Frisk Survey Data
Previous research in New York City suggests that stops are most harmful to legitimacy when they are experienced as unfair (Tyler, Fagan, & Geller, 2014)� A limitation to this research, however, is that it cannot tell us which aspects of stops impact perceptions of procedural justice� A central element of people’s judgements about whether police are procedurally just is the motives that they believe drive behaviors� When people conclude the reason for police actions are unfair, they view police as procedurally unjust�
Integrating publically available data on the Stop, Question and Frisk (SQF) program with our survey-data allowed us to test the relationship between program implementation and people’s beliefs about NYPD� We also tested whether a variation in police justification for stops predicted how people evaluate NYPD� To categorize the stops that people make, we used the circumstances and “additional circumstances” that police marked for stops across the 189 Neighborhood Tabulation Areas (NTAs)�
Previous research has categorized some stop justifications as more subjective than others, and vulnerable to bias (Fagan, Ayres, & Conyers, 2014)� These include furtive movement, evasive movement, and suspicious bulge� Fagan et al� contrasted the more subjective justifications for stops to what they believe to be more objective: actions indicative of violence; actions indicative of a drug transaction; casing a victim or location; and fitting a relevant description� Their findings indicate that the number of subjective justifications marked per stop predicts a lower likelihood of finding criminal activity for any stop, and the number of more objective justifications predicts a higher likelihood� These findings suggest that more subjective justifications produce inefficient policing�
NYPD policy requires officers to record specific information any time they make a SQF stop� With regard to the reason for making the stop, officers are allowed to select “Y” or “N” in any combination� It is important to note that officers are not forced to select a “Y” or “N” for each reason option, and can leave options blank or mark “Y” or “N” in any combination� The stop reasons on the form have changed from year to year�
In 2016, there were 272 different combinations of Y / N recorded as reason for stop� The most common combination (27%) was to select Y for “Fits a Relevant Description” and N for all other reasons� The second most common combination (20�7%) was Y for “Other” and N for all other reasons� Of the 12,405 recorded SQFs in 2016, 2,234 (18%) included a Y for the variable “Furtive Movements” alone or in combination with other recorded reasons�22
22 We have not consulted with NYPD on how their SQF data is gathered or audited, and we do not have any specific knowledge about data weakness or other variables that may be important to the interpretation of these data� Future analyses must include input from NYPD before weighting findings too heavily�

70 @JCollaboratory
In our research, we classified SQF justifications as follows:
More Subjective (More Potential for Bias) More Objective (Less Potential for Bias)
Furtive Movements Actions Indicative of a Drug Transaction
Suspicious Bulge Actions of Engaging in a Violent Crime
Evasive Movement Carrying Suspicious Object
Casing a Victim or Location
Fits a Relevant Description
All justifications could be subjective, however, we believe those that are “more subjective” may reflect decision-making that was not been fully considered�23 In other words, it may be the case that officer acting more on instinct or impulse may not consider the rules that govern their behavior� In these cases, their actions may be justified in more vague or subjective terms� Justifications in our research were categorized to reflect this concept�
Because officers are not forced to mark “Y” or “N” for every justification category, our analyses control the number from each category (more subjective and more objective), as well as the total number of stops from the year 2016, the year preceding collection of the survey data� We tested whether the more subjective justifications predict the following survey responses regarding NYPD:
● Procedural Justice of NYPD in the neighborhood ● Trust in NYPD
We controlled for crime using the historical “complaint” data from New York City Open Data spanning 2014-2016� All analyses accounted for important individual-level variables that tend to predict beliefs about police (race, income, education, political ideology, age, and the number of times a person has been stopped by NYPD)� We also controlled for important aspects of the neighborhood, including crime rate (based on complaint data from 2014-2016),24 the number of justifications per stop, and the total number of stops�
Stops also predicted both beliefs about procedural justice and trust of NYPD� Higher rates of stops that have more subjective justifications were related to less positive views of NYPD as procedurally just and less trust of NYPD� In addition, more stops within a neighborhood was related to less positive views of police as procedurally just� These relationships account for (and are therefore not due to) race or ethnicity, political ideology, or age�
23 We are not claiming that “more subjective” means that actions were ill considered or unjustifiable, only that this novel line of inquiry is thought provoking and potentially beneficial for the City to gain insight into policy and practice�
24 We calculate crime rates using the sum of complaints within an NTA divided by the population of the NTA�

71 @JCollaboratory
Conclusions
Experiences with Police
● The majority of respondents have had contact with NYPD in the past two years, although experiences differ significantly by race, gender, location, individual experiences, etc�
● White respondents most often feel that NYPD practice procedural justice principles in their interactions�
● As shown in past research and polling, Black respondents are significantly less likely to express positive beliefs about procedural justice, beliefs about NYPD as legitimate and less likely to cooperate by reporting crime� Black respondents also feel less safe in their neighborhoods than others� Hispanics hold significantly less positive beliefs about procedural justice than others� People who hold conservative political ideology and report higher income have higher perceptions of safety, legitimacy, and cooperation�
● Nearly half of interviewees (48%) classify their interaction with NYPD negatively� Among these participants, description of the encounters or the police officer(s) frequently include “rude,” “annoying,” “scary,” and “disrespectful�”
● Demographic factors shape the experiences and behaviors reflected in survey research� Contextual race effects suggest that greater percentages of Black respondents in a neighborhood predict lower beliefs about procedural justice, legitimacy, and cooperative behavior�
● When controlling for beliefs about procedural justice, neither the race of the respondent nor the residential Black population are significant predictors of legitimacy� This suggests that the reason for differences in legitimacy and cooperation is due to differences in experiences of procedural justice�
● The average-level of procedural justice that participants perceive within a neighborhood is a marginally significant predictor25 of people’s cooperation in reporting crime, suggesting that neighborhood norms may impact personal beliefs�
● More than 2 in 5 (42%) interviewees mention “suspicious behavior” or “recognition of a suspect” as the primary reason for a stop� Nearly 40% of interviewees believe demographic characteristics (such as race, ethnicity, age) are the primary factor that influences police stops and nearly 20% mention other reasons such as “public safety”, “safety of officers themselves,” and “quotas�”
25 The neighborhood level procedural justice is marginally significant, p = �085

72 @JCollaboratory
● People generally perceive police-led initiatives in a positive light, but vary on how sincerely they see the intent behind those initiatives�
● Police-led community initiatives may have a positive impact when people learn about them and perceive that they are sincerely intended to help the community� This may be a particularly useful way of building legitimacy among communities who feel targeted by the criminal justice system�
● People who report knowledge of a police-led initiative but do not view the intention as sincere, view the NYPD as less legitimate than people with no knowledge of such initiatives�
● The impact of police-led initiatives is likely part of long processes rather than a single event� By this we mean that we would expect that people must perceive initiatives as consistent with positive changes in procedural justice of NYPD in interpersonal interactions� They must believe that NYPD are going to follow-up the initiative by ensuring fair treatment and respect towards community members�
● Community members learn about NYPD’s desire to build trust through media, but seem to favor opportunities for direct contact aimed at building relationships or addressing specific community problems�
● These data suggest that reaching out to communities to build legitimacy and cooperation can have a significantly positive impact when it involves adequate local presence (as opposed to messages delivered via media)�
● Interviewees recognize and appreciate officers getting to know the neighborhood, however, only 5% of the interviewee report that they know a police officer who works in their neighborhood�
● Nearly 3 in 5 interviewees say that they “see the right amount” of police in their neighborhood or are indifferent to the question� Nearly 3 in 10 say they would like more neighborhood policing and about 13% say they would like to see fewer police�

73 @JCollaboratory
Racial Disparities and Procedural InjusticeProcedural justice creates access to opportunities by building an environment where community members relate to authority and engage with government� When people feel that authorities treat them unfairly, with disrespect, they are less likely to engage� In effect, community members that do not believe that authorities will treat them fairly and with respect lose access to government� Analyses of our survey data in conjunction with demographic data of city residents demonstrate that this “relational bridge” varies along racial lines, for both individuals and neighborhoods�
The broadest example of this is people’s belief that they can participate in government-making� Averages across groups are not widely divergent, but Black respondents voiced significantly less agreement when asked whether the city government listens to them when creating and implementing policies� Responses to the same set of questions pertaining to people’s beliefs about NYPD show similar racial divides: Black respondents expressed the least agreement, and all ethnic minority groups (except Asians) agreed significantly less than Whites�
National polling has long demonstrated that Black and African Americans have less positive views of police than White Americans (Pew Research Center, 2010; Shaw & United States, 2015; Newport, 2016)� Our data, unsurprisingly, also evidenced this� Respondents who identified as Black view police as less procedurally just and legitimate than White respondents; they also cooperate less with police and expressed less agreement with the statement that police are effective at controlling crime when compared to White participants� Research has also demonstrated that in areas with high concentrations of disadvantage, people are more cynical about the law in general (e�g�, Sampson & Bartusch, 1998)� Our research tested whether disadvantage is related to people’s beliefs about procedural justice and legitimacy�
Neighborhood DisadvantageRacial disparities in how people relate to government and police exist at the neighborhood-level� Our research tested whether aspects of the neighborhoods where people live play a role in predicting beliefs about government and police� In other words, given that Blacks have less positive views of police, it would not be surprising that residents of neighborhoods that have high proportions of Black residents have less positive views of police� We tested if indicators of neighborhood disadvantage26 predict people’s beliefs about government and police beyond individual-level demographic factors� Our analyses account for important predictors of beliefs about policing at the individual-level: race/ethnicity; citizenship status; gender; political ideology (liberal-conservative); age; socioeconomic status (education and income); and the number of times people reported having been stopped by NYPD in the past two years� Our findings are consistent with sociological research suggesting that concentrated disadvantage creates cynicism about the law, but goes further to suggest that disadvantage reduces beliefs about procedural justice, trust in police, and voluntary cooperation in reporting crime�
26 Includes the percentage of Black residents and the percentage of people in poverty�

74 @JCollaboratory
Respondents who live in areas with higher percentages of Black residents and residents in poverty have less positive views about the procedural justice of NYPD (accounting for individual-level predictors such as respondents’ race and income)� The relationship between neighborhood characteristics and beliefs about authorities is not due to individual respondent’s race or income� These results strongly suggest that concentrated disadvantage is related to trust between NYPD and community members� Across all outcomes except for cooperation, both the percentage of Black residents and residents in poverty predict less positive attitudes; only the percent of residents in poverty predict cooperation�
One plausible explanation for these attitudes is that police may behave differently in highly disadvantaged neighborhoods� To test if this is the case, we combined the SQF data (discussed earlier in this report) with demographic data to determine if indicators of concentrated disadvantage are related to justifications for police stops� In addition, we examined whether crime rates are related to SQF justifications (some argue that disparities in levels of SQFs are justified based on crime rates rather than neighborhood demographics)�
We found that police use of “subjective” justifications for making stops is related to the percentage of Black residents and of residents in poverty� In contrast, the crime rate is not predictive of attitudes about police use of procedural justice, that is, we cannot confidently expect perceptions of procedural justice to be lower in areas where crime is higher when controlling for other relevant variables� Our statistical analyses account for important predictors of beliefs about policing at the individual-level to be: race; citizenship status; gender; political ideology (liberal-conservative); age; socioeconomic status (education and income); and the number of times people reported having been stopped by NYPD in the past two years�
Our analyses cannot demonstrate causality, but they highlight the need for improving community members’ perceptions of procedural justice in areas with higher rates of Black residents and residents living in poverty�
Procedural Justice and Access to Resources: Opportunities for Improvement The analyses demonstrate racial, ethnic, and economic differences in the relationship between police and communities� This is a problem because it can create disparities in who will engage with police and government; and when people are unwilling to engage with police and government, police and government will have fewer opportunities to demonstrate positive change� And while access to opportunities is disproportionately distributed, it is also limited by perceptions of procedural justice and legitimacy (it can be argued that racial disparities and access to procedural justice are correlated)� People living in areas with higher rates of Black residents and residents in poverty feel that authorities do not treat them fairly, compromising their opportunity to engage with governmental authorities� And the cycle of procedural injustice that follows limits access to opportunities and resources�

75 @JCollaboratory
This cycle will continue unless there is an intentional effort to engage people that do not see police/government as legitimate with the goal of 1) giving them procedurally just experiences and 2) increasing their trust in police/government and 3) participating in government�
Police-led initiatives may help reduce these barriers� Our research finds that when people are aware of sincere police-led initiatives to benefit communities, they view NYPD as more legitimate and are more cooperative with them� Understanding which initiatives community members see as sincere is a first step toward decreasing disparities�
Don’t feel heard
Don’t trust police/government
Don’t perceive police/government legitimate
Procedurally injust experience with police/government
Don’t participate/engage
Won’t perceive police/government as legitimate
Won’t cooperate or participate
Won’t feel heard
Won’t participate, engage with police/government
Won’t trust police/government

76 @JCollaboratory
ConclusionWe have structured this research report around three sets of findings and recommendations� In our first set we have highlighted the need and room to increase participation and public voice in the New York City government� When participation increases, more community members are brought into decision-making processes, which means that the government can ultimately be more responsive to community needs�
As we have discussed throughout this report, engagement of lower-income communities in New York needs to be fostered� New Yorkers’ sense that their voice is heard and taken into account by the City administration varies significantly according to their annual income� Data from a subset of interview participants showed that residents believe that only the “loudest voices get heard” - that is, one’s representation depends on their ability to make themselves heard in the absence of more equitable and inclusive forms of de facto participation� As we have shown, “de facto” is an important caveat� Many New Yorkers feel that they are heard but not listened to, that is, they do not believe that their demands and opinions are actually taken into consideration by the municipal bureaucracy and elected officials when implementing policies�
Such disbelief in the impacts and importance of political participation is discouraging - a subset of residents reported feeling like participation is time and resource consuming, and often “pointless” given the absence of visible outcomes� This finding evidences the need for further transparency and accountability� In well-functioning democratic processes, not only do transparency and accountability enable the public to participate in decision-making for the distribution and use of fiscal resources, but they also help ensure that these decisions are carried out, and indicate where revisions are necessary� Retaining a sense of fairness as to how participation occurs and how resources are allocated across the city is also essential� To this end, the City should increase transparency and consider innovative success metrics�
Our findings have also shown that the City must develop a more comprehensive and effective communications strategy� This strategy should include broadcasting of information as well as advertisement of channels for participation� Participation channels should also be expanded, and the City should increase the use of internet-based technology (i�e� online surveys, social media forums, etc�) to communicate with residents�
In our second set of findings and recommendations we have discussed New York residents’ perception of legitimacy and fairness of the criminal justice system� Although our findings show that in general, NYC criminal justice system is perceived as procedurally just, this perception varies greatly with one’s demographic characteristics� As previous research has evidenced, lower-income Black and Hispanic residents perceive the police as less legitimate than White respondents� This disparity has negative effects beyond individual opinions and relationships with law enforcement agents� It makes entire communities more skeptical of the legitimacy of the government in general, and legal authorities and law enforcement agents in particular�

77 @JCollaboratory
Based on these findings, we recommend the development of “fairness self-assessment tools” to be used by agencies for which perceptions of legitimacy are most important� As with other constructs, measuring fairness requires an understanding of different fairness definitions� Emerging topics in the criminal justice literature have provided novel insights into the theoretical and practical importance of fairness, and have resulted in refinements in the way scholars have been tailoring fairness metrics� A more detailed discussion of fairness metrics, however, exceeds the scope of this study�
In our third set of findings and recommendations we have shown that perception of sincerity of community outreach initiatives is a predictor of police legitimacy, and that initiatives perceived as insincere may harm legitimacy� While those who believe the NYPD efforts to improve relationships with communities to be sincere tend to perceive the police as more legitimate, those who believe efforts are not sincere see the police as less legitimate than those who are unaware of any efforts� As we know from past research, legitimacy predicts law-abidance and voluntary cooperation� Based on these findings, we recommend follow-up research to ascertain which initiatives people perceive as sincere, particularly in areas with high concentrations of disadvantage� To do so, the city should consolidate a database of all the different initiatives intended to improve police-community relations, and refine forms of evaluating their perceived efficiency and sincerity�
While findings evidence that attempts at creating more procedurally just modes of policing are recognized by residents, this perception is not equally distributed� In certain disadvantaged areas perceptions of police legitimacy are low, particularly among Black residents� Interactions with law enforcement constitute a significant element in how residents perceive their government� As our research has shown, one in every two residents mentioned the police when asked about city agencies with the most impact on their lives and the lives of their community�
Our research confirms that there are many opportunities to increase perceptions of fairness and transparency� Many local governments have created programs and policies to impact procedural justice and related concepts, but the possibilities for innovation in this area are limitless�

78 @JCollaboratory
References
Bursik, R� J� Jr� (1988)� Social disorganization and theories of crime and delinquency: problems and prospects� Criminology, 26(4), 519–552�
Bursik, R�, & Grasmick, H� G� (1993)� Neighborhoods and crime: The dimensions of effective community control� New York: Lexington Books�
Chavis, D� M� and Wandersman, A� (1990)� Sense of community in the urban environment: A catalyst for participation and community development� American Journal of Community Psychology, 18(1), 55-81�
Crowl, J� N� (2017)� The effect of community policing on fear and crime reduction, police legitimacy and job satisfaction: an empirical review of the evidence� Police Practice and Research, 18(5), 449-462�
Fagan, J�, Conyers, G�, & Ayres, I� (2014)� No Runs, Few Hits and Many Errors: A Story in Five Parts about Racial Bias in Stop and Frisk Policing in New York� At Conference on Empirical Legal Studies, San Francisco, CA�
Fagan, J�, & Geller, A� (2015)� Following the script: Narratives of suspicion in Terry stops in street policing� The University of Chicago Law Review�, 82 (1), 51-88�
Fagan, J�, Tyler, T� R�, & Meares, T� L� (2016)� Street stops and police legitimacy in New York� In: Delpeuch, T� & Ross, J� E� (eds�) Comparing the democratic governance of police intelligence: New models of participation and expertise in the United States and Europe� (pp� 203-231)� Northampton, MA: Edward Elgar Publishing Ltd�
Fingerhut, H� (2017)� “Deep racial, partisan divisions in Americans’ views of police officers�” Pew Research Center� Retrieved from http://www�pewresearch�org/fact-tank/2017/09/15/deep-racial-partisan-divisions-in-americans-views-of-police-officers/
Newport, F� (2016, July 8)� Gallup� “Public Opinion Context: Americans, Race and Police”� Retrieved from: https://news�gallup�com/opinion/polling-matters/193586/public-opinion-context-americans-race-police�aspx
Galster, G� C� (2012)� The mechanism (s) of neighbourhood effects: Theory, evidence, and policy implications� In: van Ham, M� et al� (eds�) Neighbourhood effects research: New perspectives (pp� 23-56)� Springer, Dordrecht�
Nix, J�, Campbell, B� A�, Byers, E� H�, & Alpert, G� P� (2017)� A bird’s eye view of civilians killed by police in 2015: Further evidence of implicit bias� Criminology & Public Policy, 16(1), 309-340�
O’Brien, T�C�, Tyler, T�R�, & Meares, T�L�, (in press)� A Community-Level Model of Authority: Building Popular Legitimacy with Reconciliatory Gestures and Participation� Journal of Regulation & Governance�
Pew Research Center� 2010� Blacks Upbeat About Black Progress , Prospects� Available at: http://pewsocialtrends�org/pubs/749/Blacks-upbeat-about-Black-progress-obama-el

79 @JCollaboratory
Sampson, R� J�, & Bartusch, D� J� (1998)� Legal cynicism and (subcultural?) tolerance of deviance: The neighborhood context of racial differences� Law and Society Review, 32(4), 777-804�
Sampson R� J� & Groves W �B� (1989)� Community structure and crime: testing social-disorganization theory� American Journal of Sociology, 94(4), 774–802�
Sampson, R� J�, & Sharkey, P� (2008)� Neighborhood selection and the social reproduction of concentrated racial inequality� Demography, 45(1), 1-29�
Shaw, T� M�, & United States� (2015)� The Ferguson report: Department of Justice investigation of the Ferguson Police Department�
Snedker, K� A� (2012)� Explaining the gender gap in fear of crime: Assessments of risk and vulnerability among New York City residents� Feminist Criminology, 7(2), 75-111�
Steptoe, A�, Feldman, P�, (2001)� Neighborhood problems as sources of chronic stress: development of a measure of neighborhood problems, and association with socioeconomic status and health� Annals of Behavioral Medicine, 23(3), 177−185�
Turley, R� N� L� (2003)� When do neighborhoods matter? The role of race and neighborhood peers� Social Science Research, 32(1), 61-79�
Tyler, T� R� (2005)� Policing in black and white: Ethnic group differences in trust and confidence in the police� Police Quarterly, 8(3), 322-342�
Tyler, T� R�, Fagan, J�, & Geller, A� (2014)� Street stops and police legitimacy: Teachable moments in young urban men’s legal socialization� Journal of Empirical Legal Studies, 11(4), 751-785�
Tyler, T� R� & Huo, Y� J� (2002)� Trust in the Law: Encouraging Public Cooperation With the Police and the Courts� New York: Russell Sage Foundation
Tyler, T� R�, & Jackson, J� (2014)� Popular legitimacy and the exercise of legal authority: Motivating compliance, cooperation, and engagement� Psychology, Public Policy, and Law, 20(1), 78-95
Valera, S�, & Guàrdia, J� (2014)� Perceived insecurity and fear of crime in a city with low-crime rates� Journal of Environmental Psychology, 38, 195-205�
Weinberg, B� A�, Reagan, P� B� and Yankow, J� J� (2004)� Do neighborhoods affect work behavior? Evidence from the NLSY79� Journal of Labor Economics, 22(4), 891–924�
Weichselbaum, S� (2018, July 16)� “Yelp for Cops”� The Marshall Project� Retrieved from https://www�themarshallproject�org/2018/07/16/yelp-for-cops
80 @JCollaboratory
Mayor’s Office of Criminal JusticeElizabeth GlazerKwan-Lamar Blount-HillEric CumberbatchAsheley Van NessAllie MeizlishAmy Sananman
Center for Court InnovationAdam ManskyAaron Charlop-PowersSuvi Hynynen AlsoCatherine Alexander, CJAMolly Aunger, Justice Collaboratory Monica Bell, Yale Law SchoolShasha Brown, Butler Community CenterJeffrey Fagan, Columbia Law SchoolAmanda Geller, Columbia UniversityEfrain Mejia, CJACharlie O’Brien, New York State Defenders AssociationMegan Quattlebaum, Council of State GovernmentsJulien Teitler, Columbia UniversityChristopher Wimer, Columbia University
Interview Location Contact PersonsJoseph Barrett, Center for Court InnovationAmanda Berman, Red Hook Community Justice CenterShasha Brown, Butler Community CenterOlivia Dana, Staten Island Justice CenterEdith Lopez, Harlem Community Justice CenterKimberly Marino, Butler Community CenterNora McDonnell, Center for Court InnovationSally Sanchez, Queens Youth Justice Center
Interviewers & Coders:Stephane Andrade, Yale UniversityStephanie Cardenas, John Jay CollegeCarmela Dormani, CUNY Graduate CenterJacqy Dougherty, John Jay CollegeJessica Gaskin, John Jay CollegeNatalie Gordon, John Jay CollegeEdwin Grimsley, CUNY Graduate CenterMichael Houlihan, St� Norbert CollegeManoj Illickal, Brooklyn CollegeHollis Kegg, John Jay CollegeKristyn Jones, John Jay CollegeMelissa McLeod, CUNY School of Public Health Christiane Schwartz, Rutgers UniversityAnna Stenkamp, John Jay CollegeChristopher Thomas, John Jay CollegeDaniel Thompson, Yale UniversityKalfani Ture, Yale UniversityJanet Yim, Yale University
Acknowledgements