A study of polar ozone depletion based on sequential ...
14
HAL Id: hal-00296153 https://hal.archives-ouvertes.fr/hal-00296153 Submitted on 16 Feb 2007 HAL is a multi-disciplinary open access archive for the deposit and dissemination of sci- entific research documents, whether they are pub- lished or not. The documents may come from teaching and research institutions in France or abroad, or from public or private research centers. L’archive ouverte pluridisciplinaire HAL, est destinée au dépôt et à la diffusion de documents scientifiques de niveau recherche, publiés ou non, émanant des établissements d’enseignement et de recherche français ou étrangers, des laboratoires publics ou privés. A study of polar ozone depletion based on sequential assimilation of satellite data from the ENVISAT/MIPAS and Odin/SMR instruments J. D. Rösevall, D. P. Murtagh, Jakub Urban, A. K. Jones To cite this version: J. D. Rösevall, D. P. Murtagh, Jakub Urban, A. K. Jones. A study of polar ozone depletion based on sequential assimilation of satellite data from the ENVISAT/MIPAS and Odin/SMR instruments. Atmospheric Chemistry and Physics, European Geosciences Union, 2007, 7 (3), pp.899-911. hal- 00296153
Transcript of A study of polar ozone depletion based on sequential ...

HAL Id: hal-00296153https://hal.archives-ouvertes.fr/hal-00296153
Submitted on 16 Feb 2007
HAL is a multi-disciplinary open accessarchive for the deposit and dissemination of sci-entific research documents, whether they are pub-lished or not. The documents may come fromteaching and research institutions in France orabroad, or from public or private research centers.
L’archive ouverte pluridisciplinaire HAL, estdestinée au dépôt et à la diffusion de documentsscientifiques de niveau recherche, publiés ou non,émanant des établissements d’enseignement et derecherche français ou étrangers, des laboratoirespublics ou privés.
A study of polar ozone depletion based on sequentialassimilation of satellite data from the ENVISAT/MIPAS
and Odin/SMR instrumentsJ. D. Rösevall, D. P. Murtagh, Jakub Urban, A. K. Jones
To cite this version:J. D. Rösevall, D. P. Murtagh, Jakub Urban, A. K. Jones. A study of polar ozone depletion basedon sequential assimilation of satellite data from the ENVISAT/MIPAS and Odin/SMR instruments.Atmospheric Chemistry and Physics, European Geosciences Union, 2007, 7 (3), pp.899-911. �hal-00296153�

Atmos. Chem. Phys., 7, 899–911, 2007www.atmos-chem-phys.net/7/899/2007/© Author(s) 2007. This work is licensedunder a Creative Commons License.
AtmosphericChemistry
and Physics
A study of polar ozone depletion based on sequential assimilation ofsatellite data from the ENVISAT/MIPAS and Odin/SMRinstruments
J. D. Rosevall, D. P. Murtagh, J. Urban, and A. K. Jones
Department of Radio & Space Science, Chalmers Univ. of Technology, Goteborg, Sweden
Received: 3 July 2006 – Published in Atmos. Chem. Phys. Discuss.: 10 October 2006Revised: 14 December 2006 – Accepted: 12 February 2007 – Published: 16 February 2007
Abstract. The objective of this study is to demonstrate howpolar ozone depletion can be mapped and quantified by as-similating ozone data from satellites into the wind driventransport model DIAMOND, (Dynamical Isentropic Assim-ilation Model for OdiN Data). By assimilating a large set ofsatellite data into a transport model, ozone fields can be builtup that are less noisy than the individual satellite ozone pro-files. The transported fields can subsequently be compared tolater sets of incoming satellite data so that the rates and geo-graphical distribution of ozone depletion can be determined.By tracing the amounts of solar irradiation received by differ-ent air parcels in a transport model it is furthermore possibleto study the photolytic reactions that destroy ozone.
In this study, destruction of ozone that took place inthe Antarctic winter of 2003 and in the Arctic winterof 2002/2003 have been examined by assimilating ozonedata from the ENVISAT/MIPAS and Odin/SMR satellite-instruments. Large scale depletion of ozone was observedin the Antarctic polar vortex of 2003 when sunlight returnedafter the polar night. By mid October ENVISAT/MIPAS dataindicate vortex ozone depletion in the ranges 80–100% and70–90% on the 425 and 475 K potential temperature levelsrespectively while the Odin/SMR data indicates depletion inthe ranges 70–90% and 50–70%. The discrepancy betweenthe two instruments has been attributed to systematic errorsin the Odin/SMR data.
Assimilated fields of ENVISAT/MIPAS data indicateozone depletion in the range 10–20% on the 475 K potentialtemperature level, (∼19 km altitude), in the central regionsof the 2002/2003 Arctic polar vortex. Assimilated fields ofOdin/SMR data on the other hand indicate ozone depletionin the range 20–30%.
Correspondence to: J. D. Rosevall([email protected])
1 Introduction
For more than two decades massive photochemical depletionof ozone has been observed each spring below∼22 km alti-tude in the Antarctic polar vortex (Farman et al., 1985). In-dications of corresponding, albeit smaller depletion of ozonein the Arctic spring have also been found (Rex et al., 1998;Newman et al., 2002). The standard explanation for thesephenomena involves activation of chlorine reservoir speciesin heterogeneous reactions that take place on aerosol-particlesurfaces in so called polar stratospheric clouds. Polar strato-spheric clouds consist of both crystalline and liquid aerosolsof nitric- and sulphuric-acid that form inside the polar vortexduring the polar winter night. Since it is less stable and there-fore warmer, far fewer polar stratospheric clouds howeverform in the Arctic polar vortex than in its Antarctic counter-part.
When sunlight returns to the polar region after the winter,ozone is lost in photochemical reactions driven by catalystspecies such as Clx, NOx and HOx. Ozone losses that occurabove 25 km in the Arctic and Antarctic regions are mainlycaused by NOx. The near total depletion of ozone that occurin the Antarctic polar vortex below∼22 km altitude is how-ever predominately caused by Clx built up during the winter(Solomon, 1999). Ozone losses driven by Clx are on the otherhand much smaller in the Arctic vortex and occur mainly af-ter colder than average winters.
To measure how much ozone is destroyed one must fol-low air parcels that move in the stratosphere so they can besampled at consecutive times. The so called Match tech-nique is a lagrangian approach to this problem (Rex et al.,1998). It involves calculating three dimensional trajecto-ries of air parcels that undergo wind driven advection onisentropic surfaces and vertical transport due to radiativecooling of the winter stratosphere. Ozone destruction inthe air parcels is subsequently estimated by comparing bal-loon sonde measurements at the start and at the end of the
Published by Copernicus GmbH on behalf of the European Geosciences Union.

900 J. D. Rosevall et al.: A study of polar ozone depletion
Latitude
Alti
tude
km
425
475
525
575
625
675
725
775
825
875
925975
−60 −30 0 30 60
15
20
25
30
35
Fig. 1. Average December altitudes of the isentropic levels used inthe DIAMOND model. Potential temperatures in Kelvin.
calculated trajectories. It should be possible to use this tech-nique also with satellite data but individual satellite measure-ments are by and large more noisy which makes the methodmore difficult to implement. Ozone depletion is instead of-ten estimated by taking daily averages of all satellite mea-surements inside the polar vortex. To keep track of the polarvortex which moves, changes its shape and sinks during thewinter, stratospheric constituents with low chemical reactiv-ity can be followed (Proffitt et al., 1993). Sampling the entirepolar vortex at once does however give a rather low spatialresolution. The temporal and spatial coverage of the Matchtechnique is on the other hand limited by the number of bal-loon sondes available for analysis.
The objective of this study is to demonstrate how ozonedepletion can be mapped and quantified by assimilatingozone data from satellites into a wind driven transport model.By assimilating large sets of satellite data the random noisein the individual satellite ozone profiles is averaged out inthe model. The transported fields can subsequently be com-pared to later sets of incoming satellite data for the purposeof determining the rates and geographical distribution of po-lar ozone depletion.
In Sect. 2 of this paper we present a low-diffusive trans-port and assimilation model, DIAMOND, that has been de-veloped to carry out the strategy outlined above. The modelhas been used for studying destruction of polar ozone in thelower stratosphere by assimilating ozone profiles from theOdin/SMR and ENVISAT/MIPAS satellite-instruments, de-scribed in Sect. 3 and Sect. 4. The assimilated ozone fieldsin the DIAMOND model have been validated by comparisonto balloon sonde measurements made at the south pole andat Ny-Alesund (79◦ N, 12◦ E). Vertical transport in the polarvortex has furthemore been traced by assimilating chemicallyinert nitrous oxide retrieved by Odin/SMR.
A study of vertical transport in the polar vortex of theAntarctic winter of 2003 is presented in Sect. 5 and a studyof ozone depletion during that winter is presented in Sect. 6.Vertical transport and ozone depletion in the Arctic winterof 2002/2003 is studied in Sect. 7 and Sect. 8 respectively.The ozone depletion estimates found using the DIAMONDmodel are discussed and compared to other studies in Sect. 9.
2 The DIAMOND model
The DIAMOND model, (Dynamical Isentropic AssimilationModel for OdiN Data), has been designed to accomplish low-dispersive off-line wind-driven ozone transport in the lowerstratosphere. Horizontal advection has been modeled on 12separate isentropic surfaces between 425 and 975 K whichcorrespond roughly to altitudes in the range 15 to 35 km. SeeFig. 1. Since potential temperatures in dry air are conservedunder adiabatic conditions vertical transport across isentropiclayers is generally slow in temperate and polar regions. Anexception to near adiabatic conditions occurs however duringthe polar winter night when there is strong radiative cool-ing of air masses inside the polar vortex. In this study verti-cal transport has been monitored by keeping track of chem-ically stable N2O that has been assimilated in parallel withthe ozone fields.
The DIAMOND model is used for quantifying polar ozonedepletion by subtracting passively transported ozone fieldsfrom fields of assimilated satellite data. Chemistry has there-fore been omitted from the model. The reactivity of ozonein the polar regions tend furthermore to be rather low at al-titudes below 25 km except when fast photolytic destructionof ozone occurs in air masses that have been heterogenicallyClOx activated during the winter.
2.1 Transport model
The DIAMOND model has been designed for studying thepolar regions. Horizontal transport has therefore been mod-eled on a square grid that is centred over one pole and ex-tends to the equator. See Fig. 2. With a grid like this it hasbeen possible to achieve high spatial resolution without us-ing ultra fine time discretisation which is generally a limitingfactor for latitude/longitude grids that have very fine zonalgrid spacing near the poles. The simplicity of the grid hasalso facilitated implementing the advection scheme. The factthat the grid does not provide global coverage is on the otherhand a disadvantage but it is tolerable since equatorial airmasses need several weeks to reach the regions surroundingthe polar vortex. Another obvious disadvantage is that thesquare shape of the grid is distorted in the equatorial region.By transforming the off-line wind fields to the local non-Cartesian coordinate systems one can eliminate transporta-tion errors but the use of a rhomboid grid adds some numer-ical diffusivity to the transport scheme. The square shape of
Atmos. Chem. Phys., 7, 899–911, 2007 www.atmos-chem-phys.net/7/899/2007/

J. D. Rosevall et al.: A study of polar ozone depletion 901
the grid is however well retained over the polar regions whereozone depletion occurs. A grid spacing of 167×167 km (overthe pole) and a time-step of 10 min length has been used inthis study.
Horizontal off-line wind driven advection has been imple-mented using the Prather transport scheme (Prather, 1986).It is a mass conservative Eulerian type of transport schemethat achieves very low numerical diffusivity by storing andtransporting the first and second order spatial derivatives oftracer fields as well as the average tracer concentration ineach grid-box. The Prather scheme is thus much more timeconsuming than a simple upstream transport scheme but thelow numerical diffusivity achieved is essential when quan-tifying ozone depletion processes that proceed over severalmonths. Wind fields obtained from the European Centre forMedium-range Weather Forecasts, ECMWF, have been usedto force the advection scheme in this study.
Vertical transport is generally not implemented in the DI-AMOND model except when there is substantial radiativecooling of air masses inside the polar vortex during the polarnight. The rate of decent of air masses in the vortex is de-termined by assimilating chemically inert N2O and tracingthe vortex average concentrations on different model levels.(The decent in the Antarctic vortex of 2003 and the Arcticvortex of 2002/2003 are presented in Sects. 5 and 7 respec-tively.) The rates of decent obtained are subsequently usedto drive vertical transport of ozone inside the vortex. Thevertical transport is implemented using one using one simpleupstream step per day.
2.2 Assimilation scheme
Satellite data are assimilated into the DIAMOND model us-ing a sequential algorithm that can be described as a variantof the familiar Kalman filter. A field containing estimates ofthe errors in the model is thus built up and transported along-side the ozone field for the purpose of weighting in new datain an optimal way. In each model time-step the assimilationalgorithm updates the subset of grid points that are locatedwithin 3000 km of any satellite observations that have beenmade. New data is weighted in according to the formula be-low whereXb is a column vector containing the subset ofmodel grid-points that are affected by assimilation,Xa is thesame subset of the model grid after assimilation andY is avector containing the satellite data to be assimilated.H is anoperator for linear interpolation from the model grid to thelocations of the satellite measurements andW is an optimalweighting matrix that is derived in each time-step (Daley,1991).
Xa = Xb + W(Y − H(Xb)) (1)
The optimal weighting matrix,W, is derived using estimatesof the noise in the satellite measurements, given in a covari-
Fig. 2. The shape of the grid used in the DIAMOND model.
ance matrixR, and estimates of the errors in the model field,given by two covariance matricesSbo andSoo.
W = Sbo(Soo + R)−1 (2)
To be more precise,Sbo is a cross covariance matrix of themodel errors in the vectorXb and the model errors at thepoints of satellite observations,H (Xb). Soo is on the otherhand a covariance matrix for the errors inH (Xb) alone.
R =
⟨
(Y − Yt )(Y − Yt )T⟩
(3)
Sbo =
⟨
(Xb − Xt )(H(Xb) − H(Xt ))T⟩
(4)
Soo =
⟨
(H(Xb) − H(Xt ))(H(Xb) − H(Xt ))T⟩
(5)
Xt andYt in the formulae above denote the true atmosphericconcentrations of the tracer at the grid-points and at thepoints of satellite observations respectively and
⟨ ⟩
denotesthe operator for expectation values.
To deriveW it is thus necessary to estimate the matrixesSbo and Soo. A computationally efficient solution to thisproblem can be implemented by estimating the correlationbetween different points in the model, (indexedi andj ), withan empirical correlation functionF(i, j) so that onlyσi , (theestimated error standard deviations in the actual grid points),have to be stored and transported (Menard et al., 2000).
Sij = σiσj ∗ F(i, j) (6)
The correlation function,F(i, j), must be chosen empiri-cally to fit the particular transport model that it is used with.
www.atmos-chem-phys.net/7/899/2007/ Atmos. Chem. Phys., 7, 899–911, 2007

902 J. D. Rosevall et al.: A study of polar ozone depletion
0 1 2 3 4 50
20
40
60
80
100
120
140
160
180
200
(1/M)(Y−H(X))T(Soo
+R)−1(Y−H(X))
Num
ber
of p
rodu
cts
Model distributionTheoretical χ2−distribution
Fig. 3. The correlation distance parameterL has been tuned toa value for which the distribution of the dimensionless quadraticform (Y − H(X))T (Soo + R)−1(Y − H(X)) fits a theoreticalχ2-distribution.
One way to simplify this process is to assume thatF(i, j) isa function of the geographical distance,rij , between the twogrid pointsi andj . This methodology has for example beendescribed in (Khattatov et al., 2000) where several differentfunction types were evaluated as candidates forF(rij ). Onefunction that they found favourable was the Gaussian shapedfunction. It has therefore been used in the Diamond model.
F(i, j) = exp(
−
r2ij
2L2
)
(7)
The Gaussian function is fitted to the model by adjusting theparameterL to a value where empirical agreement is reachedbetweenF(rij ) and error correlations observed in the model.
Assimilation of new data is obviously a process that lowersthe error standard deviation estimates in theσ field. Con-sequently Kalman filtering theory describes how the fieldshould be updated when assimilation has occurred.
σa2
= σb2− diag(WST
bo) (8)
There are on the other hand also factors like chemical pro-cesses in the stratosphere and imperfections in the transportscheme that makes it necessary to add a growth term to theσ
field. In the DIAMOND model, linear increment with timehas been used to approximate the growth of uncertainty inthe tracer fields.
σ(t+1t) = σt + kσ ∗ 1t (9)
Both L andkσ are parameters that must be tuned empiri-cally. Ideally they should be set to values that minimise the
−4 −3 −2 −1 0 1 2 3 40
100
200
300
400
500
Num
ber
of S
MR
mea
sure
men
ts
(SMR−Model) /ppm
Odin/SMR
−4 −3 −2 −1 0 1 2 3 40
1000
2000
3000
4000
(MIPAS−Model) /ppm
Num
ber
of M
IPA
Sm
easu
rem
ents
ENVISAT/MIPAS
Fig. 4. Observations minus model background on the 475 K poten-tial temperature level. All observations included in the histogramswere made north of 30◦ N during January, February and March of2003.
difference between model forecasts,Hn(X), and individualsatellite observations,yn, in a least squares sense.
N∑
n=1
(yn − Hn(X))2/
N (10)
This least squares value is however not very sensitive to ei-ther L or kσ once the assimilation model has run for a fewdays. The error growth rates,kσ , on the different modellevels has therefore been set to values for which agreementis achieved between the model error standard deviation es-timates,σx , and the observed variance between model andsatellite observations.
L has on the other hand been derived by evaluating thequadratic form in expression (11) below. The dimensionlessvalues given by the expression are expected to be distributedaccording to the so calledχ2-function of order equal toM(the number of elements inY ) if the matricesR andSoo pro-vide correct estimates of the error covariances for the vectorsY and H(X) respectively. R is not controlled by any as-similation parameter since it is supplied in the satellite data.The non diagonal elements inSoo are on the other hand func-tions ofL. The parameter has thus been tuned to the value920 km for which the expectedχ2-distribution was found,(see Fig. 3).
(Y − H(X))T (Soo + R)−1(Y − H(X)) ∼ χ2M (11)
3 Odin/SMR
The Odin satellite, launched in 2001 as a joint venture bythe national space agencies of Sweden, Canada, Finland and
Atmos. Chem. Phys., 7, 899–911, 2007 www.atmos-chem-phys.net/7/899/2007/

J. D. Rosevall et al.: A study of polar ozone depletion 903
Fig. 5. Assimilated fields of ozone on the 475 K potential temperature level compared to fields passively transported from 1 August of 2003.The fields in the top row represent the number of hours of sunlight that has fallen on the air masses in the model since 1 August, the middlerow contains assimilated fields of ozone profiles from ENVISAT/MIPAS and the bottom row contains fields passively transported from 1August without any new data assimilated into them. The dashed lines outline the border of the polar vortex.
France, completes∼15 near-terminator polar orbits per daywith descending nodes at 06:00 h local solar time. Its payloadconsists of two different limb scanning instruments, SMR(Sub-Millimetre Radiometer) and OSIRIS (Optical Spectro-graph/InfraRed Imaging System), that obtain vertical profilesof ozone and other trace species in the middle atmosphere(Murtagh et al., 2002). The SMR instrument is however alsoused for radio-astronomy which means that 50% of the satel-lites operational time is used for astrophysics instead of Earthobservations.
The OSIRIS instrument detects visible and infrared lightscattered from the sun. It can therefore not make observa-tions when the sun is below the horizon of the satellite in thewinter hemisphere. Consequently no data from the OSIRISinstrument has been used in this study.
The SMR instrument comprises four tunable Schottky-diode single-sideband heterodyne microwave receivers. Inthe basic mode for stratospheric observations, two of thereceivers covering the 486–504 GHz and 541–558 GHz fre-quency bands respectively, are used to detect microwaveemission lines in the spectra of O3, N2O, ClO and HNO3.Two separate lines, centred at 501.5 GHz and 544.9 GHz re-spectively, are observed in the spectrum of ozone. The ozonedata used in this study have been retrieved from the 501.5
GHz line using the Chalmers-v2.0 retrieval scheme. The ran-dom noise standard deviation in the individual ozone profilesis below 1.5 ppmv and the estimated systematic errors areless than 0.75 ppmv (Urban et al., 2006, 2005). In the po-lar regions the ozone profiles thus obtained cover altitudesin the range 12–50 km with∼3 km altitude resolution. TheN2O data used in this study have been retrieved from a line at502.3 GHz using the same software. The N2O profiles coveraltitudes in the range 12–60 km with∼1.5 km altitude res-olution. The noise in the individual N2O profiles is below30 ppbv and the estimated systematic errors are less than12 ppbv (Urban et al., 2006, 2005).
4 ENVISAT/MIPAS
The ENVISAT satellite, launched in 2002 by the EuropeanSpace Agency (ESA), completes∼15 polar orbits per daywith descending nodes at 10:00 h local solar time. Its missioncomprises monitoring the land, ice, oceans and atmosphereof the Earth providing data for environmental research. Tendifferent instruments are included in its payload, three ofwhich GOMOS, MIPAS and SCIAMACHY were designedto study trace gases in the atmosphere.
www.atmos-chem-phys.net/7/899/2007/ Atmos. Chem. Phys., 7, 899–911, 2007
904 J. D. Rosevall et al.: A study of polar ozone depletion
425K
2003−08−1547
5K52
5K57
5K 2003−08−30 2003−09−14 2003−09−29 2003−10−14 %
−100
−80
−60
−40
−20
0
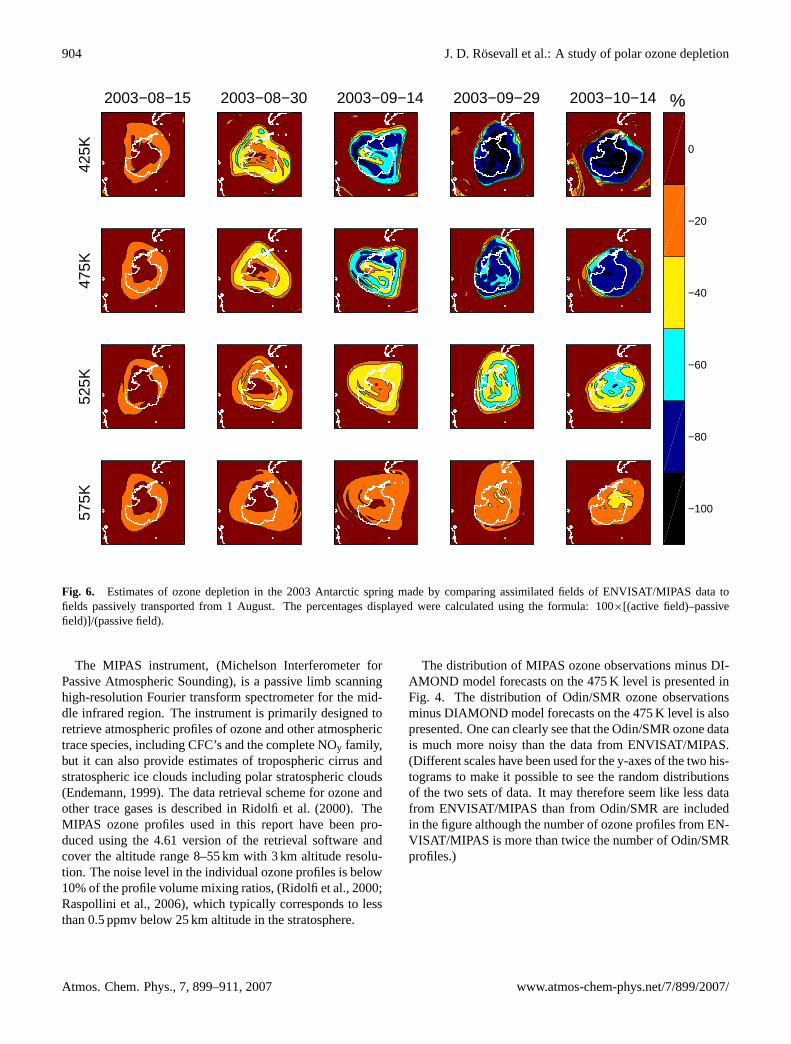
Fig. 6. Estimates of ozone depletion in the 2003 Antarctic spring made by comparing assimilated fields of ENVISAT/MIPAS data tofields passively transported from 1 August. The percentages displayed were calculated using the formula: 100×[(active field)–passivefield)]/(passive field).
The MIPAS instrument, (Michelson Interferometer forPassive Atmospheric Sounding), is a passive limb scanninghigh-resolution Fourier transform spectrometer for the mid-dle infrared region. The instrument is primarily designed toretrieve atmospheric profiles of ozone and other atmospherictrace species, including CFC’s and the complete NOy family,but it can also provide estimates of tropospheric cirrus andstratospheric ice clouds including polar stratospheric clouds(Endemann, 1999). The data retrieval scheme for ozone andother trace gases is described in Ridolfi et al. (2000). TheMIPAS ozone profiles used in this report have been pro-duced using the 4.61 version of the retrieval software andcover the altitude range 8–55 km with 3 km altitude resolu-tion. The noise level in the individual ozone profiles is below10% of the profile volume mixing ratios, (Ridolfi et al., 2000;Raspollini et al., 2006), which typically corresponds to lessthan 0.5 ppmv below 25 km altitude in the stratosphere.
The distribution of MIPAS ozone observations minus DI-AMOND model forecasts on the 475 K level is presented inFig. 4. The distribution of Odin/SMR ozone observationsminus DIAMOND model forecasts on the 475 K level is alsopresented. One can clearly see that the Odin/SMR ozone datais much more noisy than the data from ENVISAT/MIPAS.(Different scales have been used for the y-axes of the two his-tograms to make it possible to see the random distributionsof the two sets of data. It may therefore seem like less datafrom ENVISAT/MIPAS than from Odin/SMR are includedin the figure although the number of ozone profiles from EN-VISAT/MIPAS is more than twice the number of Odin/SMRprofiles.)
Atmos. Chem. Phys., 7, 899–911, 2007 www.atmos-chem-phys.net/7/899/2007/

J. D. Rosevall et al.: A study of polar ozone depletion 905
425K
2003−08−1547
5K52
5K57
5K 2003−08−30 2003−09−14 2003−09−29 2003−10−14 %
−100
−80
−60
−40
−20
0
Fig. 7. Estimates of ozone depletion in the 2003 Antarctic spring made by comparing assimilated fields of Odin/SMR data to fields passivelytransported from 1 August. The percentages displayed were calculated using the formula: 100×[(active field)–(passive field)]/(passive field).
5 Vertical transport in the Antarctic polar vortex of2003
N2O data from Odin/SMR have been assimilated in the DI-AMOND model to keep track of the vertical transport pro-cesses. The mixing ratio of N2O decreases rapidly withaltitude since the species is destroyed by high energy UV-radiation in the upper stratosphere. N2O is on the other handchemically inert at lower altitudes and in the polar night andcan therefore be used as a passive tracer to monitor trans-port in the polar vortex. Time series of model vortex averageN2O mixing ratios are plotted in Fig. 9. The vortex averagesare defined as the average mixing ratio on the 30 million km2
area with lowest N2O concentration on each potential tem-perature level in the DIAMOND model. N2O samples ofequal size have thus been obtained on all levels in the vortexwhich makes the sample averages relevant for tracing verticaltransport in it. Using samples with constant size throughoutthe months studied is furthermore a consistent way of defin-ing the polar vortex. The 30 million km2 samples are how-
ever well retained within the vortex borders as defined by thecontours of maximum gradient in the N2O fields.
The N2O mixing ratios in Fig. 9 decrease rapidly fromMay to late July, indicating fast radiative cooling of the polarvortex during this period. From early August to late Octoberthe mixing ratios were on the other hand more stable whichindicates that transport between different potential tempera-ture levels was slow. By following the vortex average N2Omixing ratios we estimate that the potential temperatures onall four levels described in Fig. 9 decreased by∼10 K duringAugust and remained stable in September and October. Ver-tical transport thus had a small impact on the ozone mixingratios in the vortex during these months since the potentialtemperature difference between model levels is 50 K and theozone mixing ratios in the polar vortex generally differ with10–20% between model levels.
www.atmos-chem-phys.net/7/899/2007/ Atmos. Chem. Phys., 7, 899–911, 2007

906 J. D. Rosevall et al.: A study of polar ozone depletion
−30 0 30 60 900
2
4
425
K
ENVISAT/MIPASppm
MIPASSonde
−30 0 30 60 900
2
4Odin/SMRppm
SMRSonde
−30 0 30 60 900
2
4
475
K
−30 0 30 60 900
2
4
−30 0 30 60 900
2
4
525
K
−30 0 30 60 900
2
4
−30 0 30 60 900
2
4
Days from 1 August 2003
575
K
−30 0 30 60 900
2
4
Days from 1 August 2003
Fig. 8. Assimilated satellite data compared to balloon sonde measurements made over the south pole during the Antarctic winter of 2003.The solid lines represent the ozone mixing ratios found directly over the south pole in the DIAMOND model and the stars represent sondemeasurements made at the same location. The sonde data has been obtained from the Network for the Detection of Atmospheric CompositionChange (NDACC) and is publicly available (see http://www.ndacc.org).
−90 −60 −30 0 30 60 900
50
100
150
200
250
Days from 1 August 2003
ppbV
Average N2O Mixing Ratios in the Polar Vortex
425 K475 K525 K575 K
Fig. 9. Time evolution of the average N2O mixing ratios on dif-ferent potential temperature levels in the Antarctic polar vortex of2003. The vortex averages have been obtained from assimilatedfields of Odin/SMR N2O data.
6 Ozone depletion in the Antarctic Winter of 2003
The ozone destruction that occurred in the Antarctic polarvortex of 2003 has been studied by comparing assimilatedfields of ozone to ozone fields that have been passively trans-ported from 1 August of that year. To avoid issues associ-ated with spin-up of the model the initial ozone fields wereobtained by assimilating ozone profiles into the DIAMONDmodel for more than two months prior to 1 August. Verticaltransport was not implemented in the Diamond model after1 August since assimilated N2O fields indicated little suchtransport (see Sect. 5).
The time evolution on the 475 K potential temperaturelevel can be seen in Fig. 5. The top fields in the figure repre-sent the hours of sunlight that had fallen on the air masses inthe model since 1 August. The middle row contains assim-ilated fields of ozone profiles from ENVISAT/MIPAS andthe bottom row contains fields passively transported from 1August without any new data assimilated into them. The ini-tial ozone fields were obtained by assimilating ozone profilesinto the DIAMOND model for more than two months priorto 1 August. Substantial depletion of ozone can be seen in
Atmos. Chem. Phys., 7, 899–911, 2007 www.atmos-chem-phys.net/7/899/2007/

J. D. Rosevall et al.: A study of polar ozone depletion 907
−30 0 30 60 901
3
5
425
K
ENVISAT/MIPASppm
MIPASSonde
−30 0 30 60 901
3
5Odin/SMRppm
SMRSonde
−30 0 30 60 901
3
5
475
K
−30 0 30 60 901
3
5
−30 0 30 60 901
3
5
525
K
−30 0 30 60 901
3
5
−30 0 30 60 902
4
6
Days from 1 January 2003
575
K
−30 0 30 60 902
4
6
Days from 1 January 2003
Fig. 10. Assimilated satellite data compared to balloon sonde measurements made over Ny-Alesund (79◦ N, 12◦ E) during the Arctic winterof 2002/2003. Same source of sonde data as in Fig. 8.
the polar vortex as the air masses become exposed to sun-light. Large scale ozone destruction thus occurs first at theouter edges of the vortex in August and reaches the centralpolar vortex by the end of September.
Quantitative estimates of the 2003 Antarctic ozone deple-tion have been made using assimilated fields of ozone datafrom ENVISAT/MIPAS and Odin/SMR. See Figs. 6 and 7respectively. Both sets indicate that ozone destruction startedat the outer edges of the polar vortex in August and spread tothe central vortex by mid September. The Odin/SMR fieldshowever indicate significantly less depletion than the EN-VISAT/MIPAS fields on the 425 and 475 K potential tem-perature levels. By mid October the ENVISAT/MIPAS dataindicate ozone depletion in the ranges 80–100% and 70–90%on the 425 and 475 K levels respectively while the Odin/SMRdata indicates depletion in the ranges 70–90% and 50–70%.
An obvious prerequisite for obtaining correct estimates ofpolar ozone depletion using the method presented above isthat the satellite instruments used to collect the ozone datadetects all ozone depletion that occurs in a quantitatively cor-rect manner. Constant systematic errors in the satellite datacan be tolerated but they must not change over the time pe-riod that is studied.
The assimilated fields obtained from ENVISAT/MIPASand Odin/SMR data have been compared to balloon sondemeasurements in Fig. 8. The stars represent balloon sondemeasurements made at the south pole and the solid lines rep-resent the ozone concentrations found in the DIAMOND as-similation model over the same location. One can see that theassimilated fields of ENVISAT/MIPAS data agree fairly wellto the balloon sondes except on the 525 K level from lateSeptember throughout October when the assimilated fieldsgive ozone concentrations that are roughly 1 ppm higher thanthe sonde measurements. Otherwise the concentrations in theassimilated fields of ENVISAT/MIPAS data generally staywithin 0.25 ppm of the sondes. (A separate paper is currentlyunder preparation in which the assimilation model is used forvalidating MIPAS data.)
The assimilated fields obtained using Odin/SMR data doon the other hand not agree well with the sonde measure-ments on the 425, 475 and 525 K potential temperature lev-els. The assimilated ozone concentrations are too low beforelarge scale depletion occurs and too high after the ozone holehas formed. Estimates of ozone depletion made using this setof data will thus underestimate the ozone depletion. Thesebiases are currently under investigation by the Odin/SMRscience team at the Chalmers University of Technology.
www.atmos-chem-phys.net/7/899/2007/ Atmos. Chem. Phys., 7, 899–911, 2007

908 J. D. Rosevall et al.: A study of polar ozone depletion
−60 −30 0 30 600
50
100
150
200
250
Days from 1 January 2003
ppbV
Average N2O Mixing Ratios in the Arctic Polar Vortex
425 K475 K525 K575 K
Fig. 11. Time evolution of the average N2O mixing ratios ondifferent potential temperature levels in the Arctic polar vortex of2002/2003. The vortex averages have been obtained from assimi-lated fields of Odin/SMR N2O data.
7 Vertical transport in the Arctic polar vortex of2002/2003
The time evolution of vortex average N2O mixing ratios inthe Arctic winter of 2002/2003 are presented in Fig. 11. Sub-stantial vertical transport across the model potential temper-ature levels are indicated by the falling mixing ratios. Weestimate that the potential temperatures of air masses fell by∼1 K per day in November and December and by∼0.7 Kper day in January and early February. The ozone mixingratios in the vortex increased therefore during the same pe-riod due to vertical transport of more ozone rich air massesfrom higher altitudes. Due to this effect vertical transport hasbeen implemented in the DIAMOND transport model whenused to estimate ozone depletion in the Arctic polar vortex of2002/2003.
8 Ozone depletion in the Arctic Winter of 2002/2003
Temperatures in the 2002/2003 Arctic polar vortex werelow enough to sustain polar stratospheric clouds from midNovember to mid January leading to 15–30% activation ofchlorine reservoir species in January and February (EORCU,2003). ClOx catalyzed photochemical destruction of ozonewas therefore possible in sunlit areas of the vortex.
Assimilated fields of ENVISAT/MIPAS and Odin/SMRdata have been compared to ozone sonde measurementsmade at Ny-Alesund (79◦ N, 12◦ E), see Fig. 10. The EN-VISAT/MIPAS fields agree well to the sonde data whilediscrepancies can be seen between the sondes and the
Odin/SMR fields. Neither sonde nor satellite data howevershow any clear signs of ozone depletion. (Ny-Alesund waslocated outside the polar vortex for a 10 day period in the lat-ter half of February causing low ozone mixing ratios on the425 K potential temperature level and elevated mixing ratioson the levels above during this period.)
Ozone depletion occurring in the Arctic polar vortex af-ter 1 January 2003 have furthermore been studied using themethodology outlined in Sect. 6. The time evolution on the475 K potential temperature level is presented in Fig. 12.Row (A) in the figure describes the number of sunlit hoursfrom 1 January, row (B) describes the temperatures on therespective days and the white lines outline the polar vortexborder defined as the contour of maximum gradient in theassimilated N2O fields. Rows (C) and (D) describe ozonedepletion derived using ENVISAT/MIPAS data and rows (E)and (F) describe ozone depletion derived using Odin/SMRdata. Vertical transport at a rate of 0.7 K per day was imple-mented in the vortex during January and the first 10 days ofFebruary when deriving rows (C) and (E) while no verticaltransport was implemented when deriving rows (D) and (F).By including vertical transport in the passive transport modelwe observe∼5% additional ozone destruction compared towhen vertical transport is not implemented.
The ENVISAT/MIPAS fields in rows (C) and (D) indicate10–20% ozone destruction in the central polar vortex by theend of January. The fields do on the other hand not indicateany significant destruction of ozone near the outer edges ofthe vortex which is unlike the pattern observed in the south-ern hemisphere where large-scale destruction of ozone be-gins at the vortex outer edges before it reaches the vortex cen-tre. One plausible explanation for the difference is that largescale chlorine activation only occurred in the colder centralregions of the 2002/2003 Arctic polar vortex.
The Odin/SMR fields in rows (E) and (F) indicate 20–30% ozone depletion in the central vortex by the end of Jan-uary. The areas affected by ozone destruction subsequentlygrow until mid February after which large scale mixing occuracross the vortex border masking the effect of the precedingozone destruction.
9 Conclusions
In this study we have demonstrated how the DIAMONDtransport and assimilation model can be used to map andquantify Antarctic as well as Arctic polar ozone depletion.The ozone destruction observed in the Antarctic polar vor-tex of 2003 was spatially confined to regions where sunlighthad returned after the polar night. Large scale ozone deple-tion thus started at the outer edges of the vortex in Augustand reached the central region by mid september. The ozonedestruction found in the Arctic winter of 2002/2003 was onthe other hand mainly confined to the central regions of thevortex.
Atmos. Chem. Phys., 7, 899–911, 2007 www.atmos-chem-phys.net/7/899/2007/

J. D. Rosevall et al.: A study of polar ozone depletion 909
Fig. 12. A study of Arctic ozone depletion on the 475 K potential temperature level during the winter of 2002/2003 made by comparingassimilated fields of ENVISAT/MIPAS and Odin/SMR ozone data to fields passively transported from 1 January. The percentages displayedwere calculated using the formula: 100×[(active field)–(passive field)]/(passive field). Row(A) describes the number of hours of sunlight thathas fallen on the air masses in the model since 1 January. Row(B) describes the temperatures on the 475 K potential temperature level. Rows(C) and(D) describe estimates of ozone depletion made by comparing assimilated fields of ENVISAT/MIPAS data to passively transportedfields. Vertical transport was implemented in DIAMOND when deriving row (C) but not when deriving row (D). Rows(E) and(F) describeestimates of ozone depletion made using assimilated fields of Odin/SMR data. Vertical transport was implemented in DIAMOND whenderiving row (E) but not when deriving row (F). The solid white lines outline the border of the polar vortex.
www.atmos-chem-phys.net/7/899/2007/ Atmos. Chem. Phys., 7, 899–911, 2007

910 J. D. Rosevall et al.: A study of polar ozone depletion
Significant differences have been found between esti-mates of ozone depletion made using data from the EN-VISAT/MIPAS and Odin/SMR instruments. In the Antarc-tic winter of 2003 assimilated fields of ENVISAT/MIPASdata indicated vortex ozone depletion in the ranges 80–100%and 70–90% on the 425 and 475 K levels respectively whileOdin/SMR data indicated depletion in the ranges 70–90%and 50–70% on the same levels. By comparing the assimi-lated fields to balloon sondes released at the south pole wehave deduced that this discrepancy can be attributed to sys-tematic errors in the Odin/SMR data. See Fig. 8.
Estimates of Arctic ozone depletion on the 475 K level be-tween 1 January and the end of February are presented inFig. 12. Using data from ENVISAT/MIPAS we have de-duced 10–20% ozone depletion in the central region of thevortex while we have deduced 20–30% depletion using datafrom Odin/SMR.
The rates of ozone depletion in the Arctic winter of2002/2003 has been studied using the Match method inStreibel et al. (2006) and by obtaining vortex averages ofozone zonde measurements in Christensen et al. (2005). Bothpapers describe 1.0–1.25 ppmv accumulated vortex ozonelosses on the 475 K level during January and February whichcorresponds to∼30% destruction of the vortex ozone on thatlevel. The two studies thus agree with the results we haveobtained using Odin/SMR data while the ENVISAT/MIPASinstrument seems to be underestimating the ozone depletionin the Arctic winter of 2002/2003.
Acknowledgements. Odin is a Swedish-led satellite project fundedjointly by the Swedish National Space Board (SNSB), the CanadianSpace Agency (CSA), the National Technology Agency of Finland(Tekes) and the Centre National d’etudes Spatiales (CNES) inFrance. We thank the European Space Agency (ESA) for providingENVISAT/MIPAS data. ECMWF wind and temperature fieldshave been downloaded from the data centre at Norsk Institutt forLUftforskning (NILU) operated under the EU supported SCOUTproject. This work has also been supported by the ChalmersEnvironmental Initiative (www.miljo.chalmers.se/cei).
Edited by: P. Espy
References
Christensen, T., Knudsen, B. M., Streibel, M., Andersen, S. B., Be-nesova, A., Braathen, G. O., Claude, H., Davies, J., De Backer,H., Dier, H., Dorokhov, V., Gerding, M., Gil, M., Henchoz, B.,Kelder, H., Kivi, R., Kyro, E., Litynska, Z., Moore, D., Peters,G., Skrivankova, P., Stubi, R., Turunen, T., Vaughan, G., Viatte,P., Vik, A. F., von der Gathen, P., and Zaitcev, I.: Vortex-averagedArctic ozone depletion in the winter 2002/2003, Atmos. Chem.Phys., 5, 131–138, 2005,http://www.atmos-chem-phys.net/5/131/2005/.
Daley, R.: Atmospheric data analysis, Cambridge University Press,1991.
Endemann, M.: MIPAS instrument concept and performance, Pro-ceedings of the European Symposium on Atmospheric Measure-
ments from Space, ISSN 1022-6656 (European Space Researchand Technology Center – European Space Agency, Noordwijk,The Netherlands, 1999) , WPP-161, Vol. 1, 29–43, 1999.
EORCU: The Northern Hemisphere Stratosphere in the 2002/2003winter, Tech. rep., The European Ozone Research CoordinatingUnit, Department of Chemistry, University of Cambridge, UK,2003.
Farman, J. C., Gardiner, B. G., and Shanklin, J. D.: Large losses oftotal ozone in Antarctica reveal seasonal ClOx/NOx interaction,Nature, 315, 207–210, 1985.
Khattatov, B. V., Lamarque, J.-F., Lyjak, L. V., Menard, R.,Levelt, P., Tie, X., Brasseur, G. P., and Gille, J. C.: As-similation of Satellite Observations of Long-lived ChemicalSpecies in Global Chemistry Transport Models, J. Geophys.Res., 105(D23), 29135, doi:10.1029/2000JD900466, 2000.
Menard, R., Cohn, S. E., Chang, L.-P., and Lyster, P. M.: Strato-spheric assimilation of Chemical Tracer Observations Using aKalman Filter, parts i and ii, Mon. Wea. Rev., 128, 2654–2686,2000.
Murtagh, D., Frisk, U., Merino, F., Ridal, M., Jonsson, A., Stegman,J., Witt, G., Eriksson, P., Jimenez, C., Megie, G., de la Noe, J.,Ricaud, P., Baron, P., Pardo, J. R., Hauchcorne, A., Llewellyn,E. J., Degenstein, D. A., Gattinger, R. L., Lloyd, N. D., Evans,W. F. J., McDade, I. C., Haley, C. S., Sioris, C., von Savigny,C., Solheim, B. H., McConnell, J. C., Strong, K., Richardson,E. H., Leppelmeier, G. W., Auvinen, H., and Oikarinen, L.: Anoverview of the Odin atmospheric mission, Can. J. Phys., 80,309–319, 2002.
Newman, P. A., Harris, N. R. P., Adriani, A., Amanatidis, G. T.,Anderson, J. G., Braathen, G. O., Brune, W. H., Carslaw, K. S.,Craig, M. S., DeCola, P. L., Guirlet, M., Hipskind, R. S., Kurylo,M. J., Kullmann, H., Larsen, N., Megie, G. J., Pommereau,J.-P., Poole, L. R., Schoeberl, M. R., Stroh, F., Toon, O. B.,Trepte, C. R., and Roozendael, M. V.: An overview of theSOLVE/THESEO 2000 campaign, J. Geophys. Res., 107(D20),8259, doi:10.1029/2001JD001303, 2002.
Prather, M. J.: Numerical Advection by Concervaion of Second-Order Moments, J. Geophys. Res., 91(D6), 6671–6681, 1986.
Proffitt, M. H. K., Aiken, J. J., Margitan, M., Lovenstein, J. R, andPodolske, A.: Ozone loss inside the northern polar vortex duringthe 1991–1992 winter, Science, 261, 1150–1154, 1993.
Raspollini, P., Bellotti, C., Burgess, A., Carli, B., Carlotti, M., Cec-cherini, S., Dinelli, B. M., Dudhia, A., Flaud, J. M., Funke, B.,Hopfner, M., Lopez-Puertas, M., Payne, V., Piccolo, C., Reme-dios, J. J., Ridolfi, M., and Spang, R.: MIPAS level 2 operationalanalyses, Atmos. Chem. Phys., 6, 5605–5630, 2006,http://www.atmos-chem-phys.net/6/5605/2006/.
Rex, M., von der Gathen, P., Harris, N. R. P., Lucic, D., Knudsen,B. M., Braathen, G. O., Reid, S. J., De Backer, H., Claude, H.,Fabian, R., Fast, H., Gil, M., Kyro, E., Mikkelsen, I. S., Rum-mukainen, M., Smit, H. G., Stahelin, J., Varotsos, C., and Za-itcev, I.: In situ measurements of stratospheric ozone depletionrates in the Arctic winter 1991/1992: A Lagrangian approach, J.Geophys. Res., 103(D5), 5843, doi:10.1029/97JD03127, 1998.
Ridolfi, M., Carli, B., Carlotti, M., von Clarmann, T., Dinelli, B. M.,Dudhia, A., Flaud, J. M., Morris, P. E., Raspollini, P., Stiller, G.,and Wells, R. J.: Optimized forward model and retrieval schemefor MIPAS near-real-time data processing, Appl. Opt., 39, 1323–1340, 2000.
Atmos. Chem. Phys., 7, 899–911, 2007 www.atmos-chem-phys.net/7/899/2007/

J. D. Rosevall et al.: A study of polar ozone depletion 911
Solomon, S.: Stratospheric ozone depletion: A reviewof concepts and history, Rev. Geophys., 37, 275–316,doi:10.1029/1999RG900008, 1999.
Streibel, M., Rex, M., von der Gathen, P., Lehmann, R., Harris,N. R. P., Braathen, G. O., Reimer, E., Deckelmann, H., Chipper-field, M., Millard, G., Allaart, M., Andersen, S. B., Claude, H.,Davies, J., De Backer, H., Dier, H., Dorokov, V., Fast, H., Gerd-ing, M., Kyro, E., Litynska, Z., Moore, D., Moran, E., Nagai, T.,Nakane, H., Parrondo, C., Skrivankova, P., Stubi, R., Vaughan,G., Viatte, P., and Yushkov, V.: Chemical ozone loss in the Arcticwinter 2002/2003 determined with Match, Atmos. Chem. Phys.,6, 2783–2792, 2006,http://www.atmos-chem-phys.net/6/2783/2006/.
Urban, J., Lautie, N., Le Flochmoen, E., Murtagh, D., Ricaud, P.,De La Noe, J., Dupuy, E., Drouin, A., El Amraoui, L., Eriks-son, P., Frisk, U., Jimenez, C., Kyrola, E., Llewellyn, E. J.,Megie, G., Nordh, L., and Olberg, M.: The northern hemi-sphere stratospheric vortex during the 2002/03 winter: Subsi-dence, chlorine activation and ozone loss observed by the OdinSub-Millimetre Radiometer, Geophys. Res. Lett., 31, L07103,doi:10.1029/2003GL019089, 2004.
Urban, J., Lautie, N., Le Flochmoen, E., Jimenez, C., Eriksson, P.,De La Noe, J., Dupuy, E., Ekstrom, M., El Amraoui, L., Frisk,U., Murtagh, D., Olberg, M., and Ricaud, P.: Odin/SMR limbobservations of stratospheric trace gases: Level 2 processing ofClO, N2O, HNO3, and O3, J. Geophys. Res., 110, D14307,doi:10.1029/2004JD005741, 2005.
Urban, J., Murtagh, D., Lautie, N., Barret, B., Dupuy, E., de LaNoe, J., Eriksson, P., Frisk, U., Jones, A., le Flochmoen, E., Ol-berg, M., Piccolo, C., Ricaud, P., and Rosevall, J.: Odin/SMRLimb Observations of Trace Gases in the Polar Lower Strato-sphere during 2004–2005, Proc. ESA Atmospheric Science Con-ference, 8–12 May 2006, Frascati, Italy, European Space Agencypublications, ESA-SP-628, http://earth.esrin.esa.it/workshops/atmos2006/participants/68/paperfrascati2006.pdf, 2006.
www.atmos-chem-phys.net/7/899/2007/ Atmos. Chem. Phys., 7, 899–911, 2007