A shared numerical representation for action and...
14
*For correspondence: dave@in. cnr.it † These authors contributed equally to this work Competing interests: The authors declare that no competing interests exist. Funding: See page 12 Received: 17 March 2016 Accepted: 18 July 2016 Published: 09 August 2016 Reviewing editor: Richard Ivry, University of California, Berkeley, United States Copyright Anobile et al. This article is distributed under the terms of the Creative Commons Attribution License, which permits unrestricted use and redistribution provided that the original author and source are credited. A shared numerical representation for action and perception Giovanni Anobile 1,2† , Roberto Arrighi 1† , Irene Togoli 1 , David Charles Burr 1,3,4 * 1 Department of Neuroscience, Psychology, Pharmacology and Child Health, University of Florence, Florence, Italy; 2 Department of Developmental Neuroscience, Stella Maris Scientific Institute, Pisa, Italy; 3 Institute of Neuroscience, National Research Council, Pisa, Italy; 4 School of Psychology, University of Western Australia, Perth, Australia Abstract Humans and other species have perceptual mechanisms dedicated to estimating approximate quantity: a sense of number. Here we show a clear interaction between self-produced actions and the perceived numerosity of subsequent visual stimuli. A short period of rapid finger- tapping (without sensory feedback) caused subjects to underestimate the number of visual stimuli presented near the tapping region; and a period of slow tapping caused overestimation. The distortions occurred both for stimuli presented sequentially (series of flashes) and simultaneously (clouds of dots); both for magnitude estimation and forced-choice comparison. The adaptation was spatially selective, primarily in external, real-world coordinates. Our results sit well with studies reporting links between perception and action, showing that vision and action share mechanisms that encode numbers: a generalized number sense, which estimates the number of self-generated as well as external events. DOI: 10.7554/eLife.16161.001 Introduction Animals, including humans, estimate spontaneously and reasonably accurately the approximate quantity of arrays of objects, without recourse to other forms of representation, such as density (Cicchini et al., 2016). Even newborn infants of less than 3 days show selective habituation to num- ber (Izard et al., 2009). There is now very good evidence in both human and non-human primates that number is encoded by intraparietal and prefrontal cortex (Castelli et al., 2006; Dehaene et al., 2003; Harvey et al., 2013; Nieder, 2005, 2012, 2016; Nieder et al., 2006; Nieder and Miller, 2004; Piazza and Eger, 2016; Piazza et al., 2004, 2007), even in numerically naive monkeys (Viswanathan and Nieder, 2013). All these studies point to the existence of a visual sense of num- ber within a parietal–frontal network (Dehaene, 2011). A truly abstract sense of number should be capable of encoding the numerosity of any set of dis- crete elements, displayed simultaneously or sequentially, in whatever sensory modality. Some evi- dence exists for such a generalized number sense. Neurons in the lateral prefrontal cortex (lPFC) of behaving monkeys encode numerosity for both auditory and visual sensory modalities, suggesting supra-modal numerosity processing (Nieder, 2012). Another study reported separate populations of neurons in the intraparietal sulcus (IPS) responding selectively to sequential or simultaneous numeri- cal displays, while a third set of neurons showed numerosity selectivity for both simultaneous and sequential presentations, suggesting that the information about spatial and temporal numerosity converges to a more abstract representation (Nieder et al., 2006). There is also evidence from func- tional imaging in humans for a right lateralized fronto-parietal circuit activated by both auditory and visual number sequences, and that right IPS is involved in processing both sequential and simulta- neous numerosity formats (Castelli et al., 2006; Piazza et al., 2006). Anobile et al. eLife 2016;5:e16161. DOI: 10.7554/eLife.16161 1 of 14 RESEARCH ARTICLE
-
Upload
nguyendien -
Category
Documents
-
view
218 -
download
0
Transcript of A shared numerical representation for action and...

*For correspondence: dave@in.
cnr.it
†These authors contributed
equally to this work
Competing interests: The
authors declare that no
competing interests exist.
Funding: See page 12
Received: 17 March 2016
Accepted: 18 July 2016
Published: 09 August 2016
Reviewing editor: Richard Ivry,
University of California, Berkeley,
United States
Copyright Anobile et al. This
article is distributed under the
terms of the Creative Commons
Attribution License, which
permits unrestricted use and
redistribution provided that the
original author and source are
credited.
A shared numerical representation foraction and perceptionGiovanni Anobile1,2†, Roberto Arrighi1†, Irene Togoli1, David Charles Burr1,3,4*
1Department of Neuroscience, Psychology, Pharmacology and Child Health,University of Florence, Florence, Italy; 2Department of DevelopmentalNeuroscience, Stella Maris Scientific Institute, Pisa, Italy; 3Institute of Neuroscience,National Research Council, Pisa, Italy; 4School of Psychology, University of WesternAustralia, Perth, Australia
Abstract Humans and other species have perceptual mechanisms dedicated to estimating
approximate quantity: a sense of number. Here we show a clear interaction between self-produced
actions and the perceived numerosity of subsequent visual stimuli. A short period of rapid finger-
tapping (without sensory feedback) caused subjects to underestimate the number of visual stimuli
presented near the tapping region; and a period of slow tapping caused overestimation. The
distortions occurred both for stimuli presented sequentially (series of flashes) and simultaneously
(clouds of dots); both for magnitude estimation and forced-choice comparison. The adaptation was
spatially selective, primarily in external, real-world coordinates. Our results sit well with studies
reporting links between perception and action, showing that vision and action share mechanisms
that encode numbers: a generalized number sense, which estimates the number of self-generated
as well as external events.
DOI: 10.7554/eLife.16161.001
IntroductionAnimals, including humans, estimate spontaneously and reasonably accurately the approximate
quantity of arrays of objects, without recourse to other forms of representation, such as density
(Cicchini et al., 2016). Even newborn infants of less than 3 days show selective habituation to num-
ber (Izard et al., 2009). There is now very good evidence in both human and non-human primates
that number is encoded by intraparietal and prefrontal cortex (Castelli et al., 2006; Dehaene et al.,
2003; Harvey et al., 2013; Nieder, 2005, 2012, 2016; Nieder et al., 2006; Nieder and Miller,
2004; Piazza and Eger, 2016; Piazza et al., 2004, 2007), even in numerically naive monkeys
(Viswanathan and Nieder, 2013). All these studies point to the existence of a visual sense of num-
ber within a parietal–frontal network (Dehaene, 2011).
A truly abstract sense of number should be capable of encoding the numerosity of any set of dis-
crete elements, displayed simultaneously or sequentially, in whatever sensory modality. Some evi-
dence exists for such a generalized number sense. Neurons in the lateral prefrontal cortex (lPFC) of
behaving monkeys encode numerosity for both auditory and visual sensory modalities, suggesting
supra-modal numerosity processing (Nieder, 2012). Another study reported separate populations of
neurons in the intraparietal sulcus (IPS) responding selectively to sequential or simultaneous numeri-
cal displays, while a third set of neurons showed numerosity selectivity for both simultaneous and
sequential presentations, suggesting that the information about spatial and temporal numerosity
converges to a more abstract representation (Nieder et al., 2006). There is also evidence from func-
tional imaging in humans for a right lateralized fronto-parietal circuit activated by both auditory and
visual number sequences, and that right IPS is involved in processing both sequential and simulta-
neous numerosity formats (Castelli et al., 2006; Piazza et al., 2006).
Anobile et al. eLife 2016;5:e16161. DOI: 10.7554/eLife.16161 1 of 14
RESEARCH ARTICLE
Psychophysical evidence showing little cost in cross-modal or cross-format matching also points
to a common number sense spanning sensory modalities and formats. For example, human adults
are very efficient in making cross-modal and cross-format judgments, with very little cost in either
accuracy or reaction times when comparing auditory with visual temporal sequences or dot arrays
(Barth et al., 2003; Brannon, 2003). Developmental work also show similar accuracy in pre-school-
ers for comparing spatial array of dots either with other spatial arrays, or with sequences of sounds
(Barth et al., 2005). Preferential-looking studies show infants prefer to look at screens displaying
adults faces numerically matched with the soundtrack of adult voices (Jordan and Brannon, 2006),
and abstract visual ensembles (shapes) numerically matched with on-going sequence of sounds
(Izard et al., 2009). However, not all agree: Tokita & Ishiguchi (Tokita and Ishiguchi, 2012) reported
significantly lower precision for cross-format number comparisons in adults, than for within format
comparisons.
That there is little or no cost in these matches is certainly indicative of efficient transfer of informa-
tion between senses, but says little about the mechanisms involved. The match is made at the deci-
sion level, so the interaction could be at any stage up to and including decision mechanisms. One of
the more powerful psychophysical techniques to probe mechanisms is adaptation (Mollon, 1974;
Thompson and Burr, 2009). Number, like most other primary visual attributes, is also highly suscep-
tible to adaptation (Schwiedrzik et al., 2016; Burr and Ross, 2008): visually inspecting for a few
seconds a large number of items results in the perceived numerosity of a subsequent ensemble to
be strongly underestimated, and vice-versa after adaptation to low numbers (Burr and Ross, 2008).
More recently we have shown that adaptation to numerosity also occurs with sequentially presented
stimuli, and that the adaptation effects are both cross-modal and cross-format (Arrighi et al., 2014):
adapting to sequences of tones affects the perceived numerosity of a subsequently presented series
of flashes (and vice versa), and adapting to sequences of flashes affects the perceived numerosity of
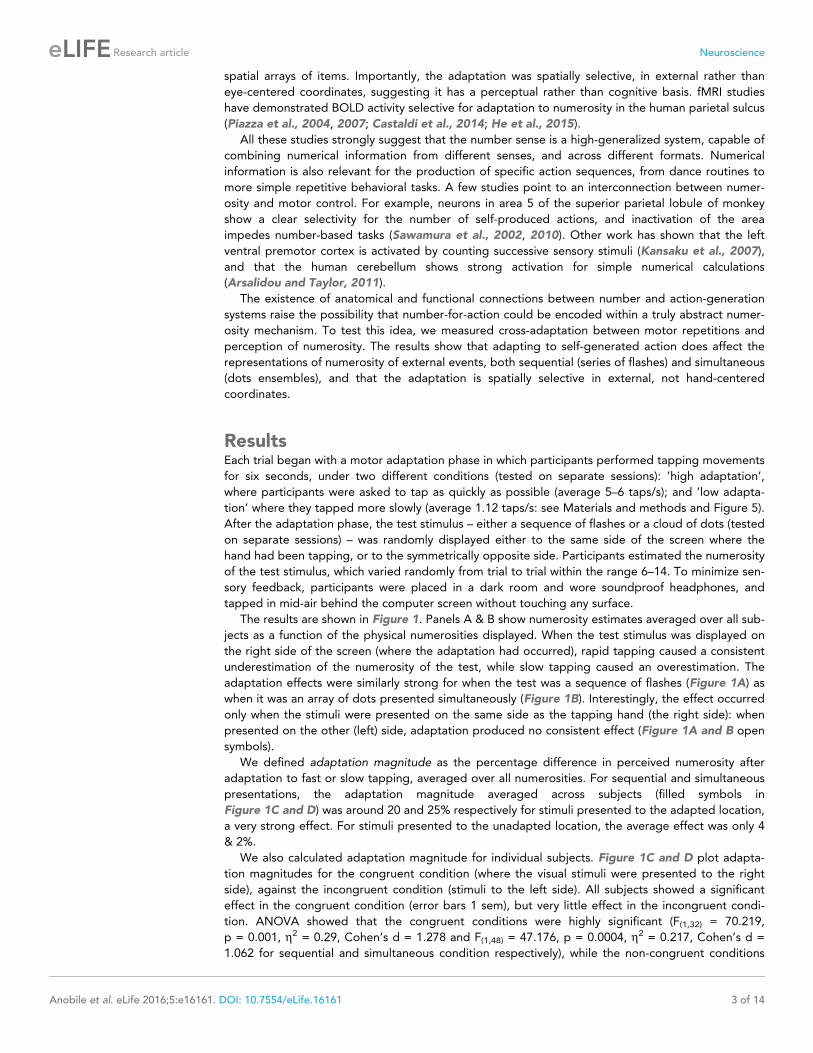
eLife digest Humans and many other animals have the ability to make spontaneous and rapid
estimates of the approximate number of items that they can see. This sense of number, or
“numbersense”, is particularly important in humans, as evidence suggests that it lays the
groundwork for acquiring mathematical skills.
Researchers have many questions about numbersense. Is it a kind of perception? Or does it
require more active thought, like counting? Do people have the same sense of number when they
view, hear or touch items that depict the same number? Having a sense of number is essential for
carrying out certain actions, like the following the steps in a dance, but the connection between
action and numbersense is not entirely clear.
A process called adaptation means that viewing specific stimuli for a period of time can affect
what people think they see subsequently. For example, viewing large numbers of dots makes
subsequent smaller groups of dots seem like they contain fewer dots than they actually do. Anobile,
Arrighi et al. have now investigated the link between action and numbersense by asking volunteers
to tap one hand either rapidly or slowly in one spot for a short time. The volunteers were then
shown a series flashes or a cloud of dots in the region where they had been tapping and asked to
estimate the number of flashes or dots.
After fast tapping, the volunteers greatly underestimated the numbers of flashes or dots that
they saw; after slow tapping, they overestimated the numbers. However, if the images were shown
far away from where the volunteers had been tapping, their estimates were more accurate.
Overall, the results suggest that adaptation is controlled by space-specific sensory mechanisms
rather than some kind of active counting. Furthermore, numbersense appears to have a generalized
form that is shared by the brain regions responsible for perception and action. Because
numbersense and mathematical ability are linked, this strong connection between action and
number perception may have important implications for understanding and treating math-related
learning disabilities. Anobile, Arrighi et al. next plan to study how movement-driven adaptation
affects numbersense in children and adults with these conditions.
DOI: 10.7554/eLife.16161.002
Anobile et al. eLife 2016;5:e16161. DOI: 10.7554/eLife.16161 2 of 14
Research article Neuroscience
spatial arrays of items. Importantly, the adaptation was spatially selective, in external rather than
eye-centered coordinates, suggesting it has a perceptual rather than cognitive basis. fMRI studies
have demonstrated BOLD activity selective for adaptation to numerosity in the human parietal sulcus
(Piazza et al., 2004, 2007; Castaldi et al., 2014; He et al., 2015).
All these studies strongly suggest that the number sense is a high-generalized system, capable of
combining numerical information from different senses, and across different formats. Numerical
information is also relevant for the production of specific action sequences, from dance routines to
more simple repetitive behavioral tasks. A few studies point to an interconnection between numer-
osity and motor control. For example, neurons in area 5 of the superior parietal lobule of monkey
show a clear selectivity for the number of self-produced actions, and inactivation of the area
impedes number-based tasks (Sawamura et al., 2002, 2010). Other work has shown that the left
ventral premotor cortex is activated by counting successive sensory stimuli (Kansaku et al., 2007),
and that the human cerebellum shows strong activation for simple numerical calculations
(Arsalidou and Taylor, 2011).
The existence of anatomical and functional connections between number and action-generation
systems raise the possibility that number-for-action could be encoded within a truly abstract numer-
osity mechanism. To test this idea, we measured cross-adaptation between motor repetitions and
perception of numerosity. The results show that adapting to self-generated action does affect the
representations of numerosity of external events, both sequential (series of flashes) and simultaneous
(dots ensembles), and that the adaptation is spatially selective in external, not hand-centered
coordinates.
ResultsEach trial began with a motor adaptation phase in which participants performed tapping movements
for six seconds, under two different conditions (tested on separate sessions): ’high adaptation’,
where participants were asked to tap as quickly as possible (average 5–6 taps/s); and ’low adapta-
tion’ where they tapped more slowly (average 1.12 taps/s: see Materials and methods and Figure 5).
After the adaptation phase, the test stimulus – either a sequence of flashes or a cloud of dots (tested
on separate sessions) – was randomly displayed either to the same side of the screen where the
hand had been tapping, or to the symmetrically opposite side. Participants estimated the numerosity
of the test stimulus, which varied randomly from trial to trial within the range 6–14. To minimize sen-
sory feedback, participants were placed in a dark room and wore soundproof headphones, and
tapped in mid-air behind the computer screen without touching any surface.
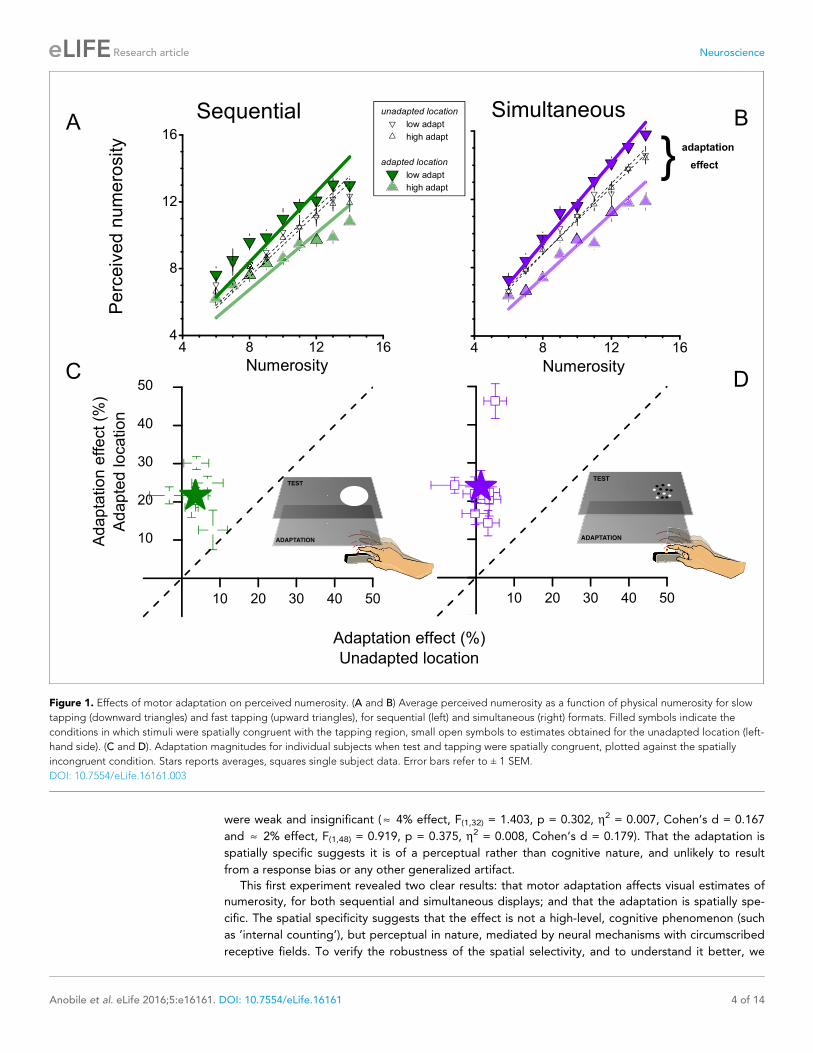
The results are shown in Figure 1. Panels A & B show numerosity estimates averaged over all sub-
jects as a function of the physical numerosities displayed. When the test stimulus was displayed on
the right side of the screen (where the adaptation had occurred), rapid tapping caused a consistent
underestimation of the numerosity of the test, while slow tapping caused an overestimation. The
adaptation effects were similarly strong for when the test was a sequence of flashes (Figure 1A) as
when it was an array of dots presented simultaneously (Figure 1B). Interestingly, the effect occurred
only when the stimuli were presented on the same side as the tapping hand (the right side): when
presented on the other (left) side, adaptation produced no consistent effect (Figure 1A and B open
symbols).
We defined adaptation magnitude as the percentage difference in perceived numerosity after
adaptation to fast or slow tapping, averaged over all numerosities. For sequential and simultaneous
presentations, the adaptation magnitude averaged across subjects (filled symbols in
Figure 1C and D) was around 20 and 25% respectively for stimuli presented to the adapted location,
a very strong effect. For stimuli presented to the unadapted location, the average effect was only 4
& 2%.
We also calculated adaptation magnitude for individual subjects. Figure 1C and D plot adapta-
tion magnitudes for the congruent condition (where the visual stimuli were presented to the right
side), against the incongruent condition (stimuli to the left side). All subjects showed a significant
effect in the congruent condition (error bars 1 sem), but very little effect in the incongruent condi-
tion. ANOVA showed that the congruent conditions were highly significant (F(1,32) = 70.219,
p = 0.001, h2 = 0.29, Cohen’s d = 1.278 and F(1,48) = 47.176, p = 0.0004, h2 = 0.217, Cohen’s d =
1.062 for sequential and simultaneous condition respectively), while the non-congruent conditions
Anobile et al. eLife 2016;5:e16161. DOI: 10.7554/eLife.16161 3 of 14
Research article Neuroscience
were weak and insignificant ( » 4% effect, F(1,32) = 1.403, p = 0.302, h2 = 0.007, Cohen’s d = 0.167
and » 2% effect, F(1,48) = 0.919, p = 0.375, h2 = 0.008, Cohen’s d = 0.179). That the adaptation is
spatially specific suggests it is of a perceptual rather than cognitive nature, and unlikely to result
from a response bias or any other generalized artifact.
This first experiment revealed two clear results: that motor adaptation affects visual estimates of
numerosity, for both sequential and simultaneous displays; and that the adaptation is spatially spe-
cific. The spatial specificity suggests that the effect is not a high-level, cognitive phenomenon (such
as ’internal counting’), but perceptual in nature, mediated by neural mechanisms with circumscribed
receptive fields. To verify the robustness of the spatial selectivity, and to understand it better, we
ADAPTATION
TEST
ADAPTATION
TEST
4 8 12 164
8
12
16
4 8 12 16
10 20 30 40 50
10
20
30
40
50
10 20 30 40 50
NumerosityDC
Bunadapted location
low adapt
high adapt
adapted location
low adapt
high adapt
Pe
rce
ive
d n
um
ero
sity
Numerosity
A
} adaptation
effect
SimultaneousA
da
pta
tio
n e
ffe
ct (%
)
Ad
ap
ted
lo
ca
tio
n
Adaptation effect (%)
Unadapted location
Sequential
Figure 1. Effects of motor adaptation on perceived numerosity. (A and B) Average perceived numerosity as a function of physical numerosity for slow
tapping (downward triangles) and fast tapping (upward triangles), for sequential (left) and simultaneous (right) formats. Filled symbols indicate the
conditions in which stimuli were spatially congruent with the tapping region, small open symbols to estimates obtained for the unadapted location (left-
hand side). (C and D). Adaptation magnitudes for individual subjects when test and tapping were spatially congruent, plotted against the spatially
incongruent condition. Stars reports averages, squares single subject data. Error bars refer to ± 1 SEM.
DOI: 10.7554/eLife.16161.003
Anobile et al. eLife 2016;5:e16161. DOI: 10.7554/eLife.16161 4 of 14
Research article Neuroscience

repeated the experiment with a new subject pool, changing the tapping hand and location. In this
experiment we tested only the simultaneous presentation, as this is the most revealing (and surpris-
ing) result.
The violet symbols of Figure 2A replicate the results of the previous experiment, tapping with
the right (dominant) hand and testing on both right and left sides (randomly interleaved): the adap-
tation effect was again strong for stimuli presented on the same side (filled symbols), and non-exis-
tent for stimuli on the other side (open symbols) (F(1,40) = 70.207, p = 0.000397, h2 = 0.116, Cohen’s
d = 0.724; F(1,40) = 2.036, p=0.213, h2 = 0.0019, Cohen’s d = 0.0873; for adapted and unadapted
location respectively). The red symbols of Figure 2B show the results for tapping on the left with the
TEST
ADAPTATION
TEST
ADAPTATION
ADAPTATION
TEST
4 8 12 164 8 12 164
8
12
16
4 8 12 164
8
12
16
10 20 30
10
20
30
B
Perc
eiv
ed n
um
ero
sity
Numerosity
Numerosity
Adapting hand: LEFT
Adapted position: LEFT
Adapting hand: RIGHT
Adapted position: RIGHT
Numerosity
A
DC
unadapted location
low adapt
high adapt
adapted location
low adapt
high adapt
Adapting hand: RIGHT
Adapted position: LEFT
Adapta
tion e
ffect
(%
)
Adapte
d location
Adaptation effect (%)
Unadapted location
Figure 2. Reference frame of motor adaptation. (A) Average perceived numerosity as a function of physical numerosity for the slow-and fast-tapping
conditions (downward and upward triangles respectively), for right-hand tapping. Filled symbols refer to trials when the stimuli were presented in the
spatial region where the subjects had tapped (right side) small open symbols to trials when the stimuli were presented on the other side. This data
replicates Figure 1B with a fresh subject pool. (B) Same as A, except subjects tapped with their left hands. Filled symbols refer to testing in the same
spatial region where the subjects had tapped (left side), small open symbols to the right side. Other conventions like A. (C) Same as A, except the right
hand tapped on the left side of the screen. Filled symbols refer to testing on the same spatial region where the subjects had tapped (left side), small
open symbols to the right side. (D) Adaptation magnitudes for individual subjects when test and tapping were spatially congruent, plotted against the
spatially incongruent condition. Color-coding as for A, B and C (purple: right hand, right side; red: left hand, left side; orange: right hand, left side).
Stars reports averages, squares single subject data. Error bars refer to ± 1 SEM.
DOI: 10.7554/eLife.16161.004
Anobile et al. eLife 2016;5:e16161. DOI: 10.7554/eLife.16161 5 of 14
Research article Neuroscience
left (non-dominant) hand: again the effects occurred only for visual stimuli presented on the congru-
ent side (left), although they were somewhat weaker (F(1,40) = 9.305, p = 0.028, h2 = 0.05, Cohen’s d
= 0.4588; F(1,40) = 0.265, p = 0.629, h2 = 0.001, Cohen’s d = 0.0633; for adapted and unadapted
location respectively). Figure 2C shows results for tapping with the dominant (right) hand on the left
side of the screen. Here, adaptation was found only for stimuli presented to the left side of the
screen, suggesting that it is spatially selective in external rather than hand-centered coordinates
(F(1,40) = 36.840, p = 0.002, h2 = 0.104, Cohen’s d = 0.6814; F(1,40) = 1.380, p = 0.293, h2 = 0.0023,
Cohen’s d = 0.096; for adapted and unadapted location respectively). Figure 2D shows the results
for all six subjects. There is some variability between subjects, particular in the crossed condition,
where one subject showed adaptation to stimuli on the right after tapping on the left with the right
hand, but by and large the individual data reinforce the group data.
In the previous experiment, subjects tapped in mid air to minimize sensory feedback. In the next
series of experiments we manipulated the amount of sensory feedback in the adaptation phase to
examine interactions between sensory and motor signals. In the first condition (tactile only), subjects
tapped a mouse behind the monitor, allowing for tactile feedback (Figure 3A). The adaptation effect
in this condition was strong, around 20% (F(1,40) = 743.738, p = 0.0001, h2 = 0.203, Cohen’s d =
1.009). In the next condition (visual and tactile), the monitor accompanied each mouse-tap with a
flash, to give visual as well as tactile feedback. Despite the extra feedback, adaptation remained
around 20%, (F(1,40) = 36.746, p = 0.002, h2 = 0.184, Cohen’s d = 0.949) as shown in panel B of Fig-
ure 3. The last adaptation condition (visual only) comprised a sequence of visual flashes whose rates
were determined by the adapting motor routine of the previous conditions (visual and tactile).
Again, the adaptation effect was found to be strong (F(1,40) = 61.740, p = 0.001, h2 = 0.230, Cohen’s
d = 1.093), and similar to the other conditions, around 20% (Figure 3C), making these three adapta-
tion conditions equally effective as tapping in mid-air (F(4,29) = 0.475, p = 0.754, h2 = 0.07, Cohen’s
d = 0.548: see Figure 3D).
We also verified the results with a two-alternative forced-choice technique. Subjects adapted to
high or low tapping rates, as in the first experiment (no tactile or visual feedback), then two clouds
of dots were simultaneously presented to the right (adapted) and left (unadapted) positions. The
numerosity of each stimulus varied from trial to trial over the range 5–20, and subjects indicated
which stimulus appeared more numerous. Figure 4A plots average responses as a function of the
difference between the right and the left stimulus (normalized to the average of the two numerosi-
ties), to yield psychometric functions. The effect of adaptation was again clear: adapting to low tap-
ping rates shifts the curve to the left (compared with baseline), consistent with an overestimation of
the perceived numerosity (t(5) = 3.285, p = 0.021, Cohen’s d = 1.101) and high tapping rates caused
the opposite effect, even if weaker (t(5) = 1.237, p = 0.27, Cohen’s d = 0.558). The differences in the
points of subjective equality (PSEs, given by the 50% point of the curves) of the two adapting condi-
tions again gives an index of magnitude of adaptation, around 15%. Figure 4B shows the PSEs for
adaptation to the two conditions. Despite some variability amongst subjects the effects are quite
robust and statistical significant as shown by a two-tailed paired t-test: t(5) = 3.56, p = 0.029,
Cohen’s d = 1.612. This experiment confirms the main results with a different technique, and also
confirms the spatial selectivity of the adaptation: if adaptation was not spatially selective, it would
work equally on the presentations to the left and right sides, annulling the effect.
DiscussionThis study shows that estimates of numerosity, both sequential and simultaneous, are strongly
biased after adapting to repetitive finger tapping: rapid tapping decreases apparent numerosity,
slow tapping increases it. The effect is spatially selective, primarily in external rather than hand-cen-
tered coordinates.
There has been a long-standing debate as to whether adaptation effects operate on numerosity
per se, or via texture-density mechanisms (Burr and Ross, 2008; Anobile et al., 2014,
2015, 2016; Bell et al., 2015; Dakin et al., 2011; Durgin, 1995, 2008; Morgan et al., 2014;
Ross and Burr, 2012; Ross, 2010; Tibber et al., 2012, 2013). A similar argument could be made
here: that the adaptation was to temporal frequency, rather than to numerosity. As with spatial
adaptation, there are many reasons to suggest that this is unlikely. However, the cross-format
Anobile et al. eLife 2016;5:e16161. DOI: 10.7554/eLife.16161 6 of 14
Research article Neuroscience

adaptation (adapt to tapping sequence and test on dot array) clearly rules out this possibility: the
spatial arrays are not temporally modulated. It is numerosity that is being adapted, not temporal
frequency.
The current results reinforce the many previous studies (Izard et al., 2009; Nieder, 2012;
Nieder et al., 2006; Barth et al., 2003; Brannon, 2003; Barth et al., 2005; Jordan and Brannon,
2006; Arrighi et al., 2014; Jordan et al., 2005) discussed in the introduction that point to the exis-
tence of a generalized sense of number. Most of these studies relied principally on cross-modal com-
parisons of number, which could occur at any processing stage, up to and including decision
mechanisms. The spatial selectivity shown in our study suggests that the interaction is perceptual
rather than cognitive: adapting on the left side did not affect stimuli on the right, and vice versa.
Importantly, the specificity was in external coordinates, as adapting the left field with the right hand
ADAPTATION
TEST
ADAPTATION
TEST
ADAPTATION
TEST
4 8 12 164
8
12
16
4 8 12 164
8
12
16
4 8 12 164
8
12
16
Numerosity
Pe
rce
ive
d n
um
ero
sity
Visual and tactile
no-adapt
adapt to HIGH
DC
B
}
Vision only
adaptation
effect
Aadapt to LOW
mid-air tapping
Tactile only
0
10
20
30
40
50A
da
pta
tio
n E
ffe
ct
(%)
Simulta
neous
Sequentia
l
Tactile only
Vision only
Vis & Tact
Figure 3. Role of sensory feedback of motor adaptation on perceived numerosity. (A), (B), (C) Average responses as a function of physical numerosity
for slow adaptation (downward triangles), fast adaptation (upward triangles) and no adaptation (diamonds), for the three different conditions. (D) Bar
graphs report the average adaptation effect for all adapting conditions (tactile only - red; visual and tactile - blue, visual only – black and the 2
conditions of Exp 1: sequential-green and simultaneous-violet). Open symbols show single subject data. Error bars report ± 1 SEM. All the conditions
provided significant effects (all p-values < 0.05). The magnitude of the effect does not differ between conditions (p > 0.05).
DOI: 10.7554/eLife.16161.005
Anobile et al. eLife 2016;5:e16161. DOI: 10.7554/eLife.16161 7 of 14
Research article Neuroscience

caused adaptation for visual stimuli presented to the left, not the right visual field. This complements
nicely the result of our previous study (Arrighi et al., 2014), where we showed that adaptation to
visual sequences affects number perception of both sequential and simultaneous presentations, in a
spatially selective manner. Interspersing an eye-movement between adaptation and test showed
that the adaptation was spatially specific in external rather than eye-centered coordinates: as the
current study shows the selectivity is external, not hand-centered. It would be interesting to look at
the spatial tuning of the adaptation on a finer grain, to define the size of the adaptation field. The
present study shows that the adaptation is at least broadly tuned, confined to a particular hemifield.
It would be very informative to determine whether there was also selectivity within each hemifield,
and on how fine a grain.
Some may find the spatial selectivity of the adaptation difficult to reconcile with the concept of a
generalized, abstract sense of number. However, cross-modal effects can also show spatial selectiv-
ity. For example, cross-modal integration of visual and auditory (or tactile) information occurs only if
the stimuli are spatially coincident (within certain bounds) (Slutsky and Recanzone, 2001). Similarly
event time, which certainly transcends modalities, and also seems to be coded in parietal cortex
(Leon and Shadlen, 2003), is affected by motion adaptation, in a spatially selective manner
(Burr et al., 2007; Fornaciai et al., 2016). Interestingly, the spatial selectivity of the adaptation is in
-60 -40 -20 0 20 40 60
0.00
0.25
0.50
0.75
1.00
-30 -15 0 15 30
-30
-15
0
15
30
B
Rig
ht m
ore
nu
me
rou
s (
p)
Normalized difference (%)
Baseline
Adapt to high
Adapt to low
NUMEROSITY DISCRIMINATION
A
Hig
h a
da
pta
tio
n -
PS
E s
hift (%
)
Low adaptation - PSE shift (%)
ADAPTATION
WHERE MORE?
Figure 4. Forced-choice measurement of motor adaptation. (A) Psychophysical functions for pooled data (6 subjects) after adaptation to fast (light
violet circles), slow (dark violet triangles) or no (black squares) tapping. The curves indicate the proportion of trials when the test (presented on the
right, the same side of tapping) was seen as more numerous than the unadapted stimulus (presented on the left), as a function of the numerosity
difference (normalized by the averaged of the two stimuli). Adaptation to slow tapping shifted the curve leftwards, showing that subjects were biased to
perceive the stimulus as more numerous that it was; and adaptation to fast tapping shifted it rightwards. The point where the best-fitting curves pass
50% is considered the point of subjective equality (PSE, indicated by the coloured arrows). (B) PSEs for individual subjects after adaptation to fast
tapping (ordinate) against those after adaptation to low motor repetitions (abscissa). The filled star shows results for data averaged across subjects.
Error bars report ± 1 SEM.
DOI: 10.7554/eLife.16161.006
Anobile et al. eLife 2016;5:e16161. DOI: 10.7554/eLife.16161 8 of 14
Research article Neuroscience
external – not eye-based – coordinates as we observed for number, here and in the previous study
(Arrighi et al., 2014).
We tested adaptation to action under various feedback conditions: visual and tactile, only visual,
only tactile, and minimal feedback. All conditions produced similar amounts of adaptation. In the
’minimal feedback’ conditions, where subjects tapped in mid-air, there was no tactile feedback from
hitting a surface. We could not, however, remove all forms of kinaesthetic feedback, and therefore
cannot be certain whether the adaptation signal was the intension to move, or the sensory proprio-
ceptive feedback from the finger. But both are signals about action, whether they are ’inflow’ or
’outflow’. It is interesting that this condition with reduced perceptual feedback produced the same
amount of adaptation, as did the conditions with visual and/or tactile feedback. It is also interesting
that the vision-only condition produced similar adaptation.
Many studies have suggested that vision and action are linked (Arrighi et al., 2011; Goodale and
Milner, 1992). This study is a further clear example of their interconnection, in the encoding the
numerosity of internally generated actions and externally generated events.
Materials and methods
ParticipantsA total of 15 adults (13 naıve to the purpose of the study, 2 author; mean age 27, all right-handed
with normal or corrected-to-normal vision) participated in the numerosity estimation experiments.
Six of them were tested in the sequential condition (test stimuli: sequences of flashes) and 7 of them
in the ’simultaneous condition’ in which test stimuli consisted of array of dots simultaneously pre-
sented. Three of these (2 author and 1 naıve subject) also participated, together with 3 additional
naıve subjects (mean age of group: 28), in the second experiment investigating the reference frame
of the motor adaptation after-effect. Eventually, six subjects (mean age of group: 28) were tested in
the experiment concerning forced-choice discrimination of numerosity. All participants gave written
informed consent. Experimental procedures were approved by the local ethics committee (Comitato
Etico Pediatrico Regionale—Azienda Ospedaliero-Universitaria Meyer—Firenze FI) and are in line
with the declaration of Helsinki.
StimuliStimuli were created and presented with Psychophysics toolbox for Matlab and displayed on a
60 Hz - 17”, touch screen monitor (LG-FLATRON L1732P) placed at a subjects view distance of 57
cm. To eliminate auditory feedback, participants wore soundproof headphones. In some conditions,
hand movements were monitored by an infrared motion sensor device (Leap motion controller -
https://www.leapmotion.com/) running at 60 Hz.
Statistical analysesDuring the design of the experiments we computed an appropriate sample size to confidently report
an effect of motion adaptation on perceived numerosity. Sample size was measured by means of a
one-sample t-test assuming a value of 0 (no effect) as a Null Mean and retrieving a value for alterna-
tive mean and standard deviation from a previous study of our group (see Figures 4 and 5 in Arrighi,
et al. [Arrighi et al., 2014]). The analysis revealed that with a sample size of 4, a power of 0.95 was
achieved with an alpha level of 0.01. For this reason in all or experiments, we always tested a num-
ber of participants greater than 4 (see below for details).
We did not set any inclusion criteria for subject selection or their data: all data, for all experimen-
tal conditions, were analyzed and reported. In all conditions where subjects estimated numerosity
we tested statistical significance with a 2 � 9 repeated measures ANOVA with test numerosity (9 lev-
els for numerosity, range 6–14) and adaptation type (low and high) as main factors. Difference in the
adaptation effects between the several adaptation conditions (visual, tactile, visual-tactile, and the
two conditions with minimal feedback) were measured by a one-way ANOVA. In the numerosity dis-
crimination task, difference in the adaptation effects for high and low adaptation were tested for sta-
tistical significance by mean of two-tailed paired t-test.
Anobile et al. eLife 2016;5:e16161. DOI: 10.7554/eLife.16161 9 of 14
Research article Neuroscience

For t-test analyses we measured Cohen’s d. For repeated measures ANOVA and regression anal-
yses, we reported both Cohen’s d and h2. Here Cohen’s d was measured transforming h
2 into
Cohen’s d (Cohen, 1988). All data are publicly available at Figshare (Anobile et al., 2016).
Experimental procedureNumerosity estimationDuring the adaptation phase, participants made a series of tapping movements on the left or right
side of the screen until a white central fixation point turned red (the stop signal), and 1 s later the
test stimulus was presented. Participants usually completed their current movement within 500 ms,
so there was a 500 ms pause between movement-completion and test presentation. The program
continuously monitored tapping in all conditions: if a tap occurred after the presentation of the test
stimulus, the trial would be aborted: in practice this never occurred. For most experiments, subjects
tapped with their dominant (right) hand on the right side of the screen. For the second study, how-
ever, we also tested tapping with the right hand on the left side, and with the left hand tapping on
the left side.
Five separate adaptation conditions were tested. 1) ‘Visual and tactile’ (action with visual and tac-
tile feedback): each tap on the monitor surface triggered the simultaneous appearance of a visual
flash surrounding the zone where the finger touched the screen. 2) ‘Only tactile’: participants tapped
on a mouse button located beneath the screen, without visual feedback. 3) ‘Only visual’: participants
were presented with a sequence of visual events whose rate was taken from the previous the motor
adaptation condition. 4 and 5) ‘Minimal feedback’: participants tapped beyond the screen without
touching any surface, tapping with the hand floating between the screen and a infrared sensor
device fixed on the desk. In one condition the test stimuli consisted of sequence of flashes (sequen-
tial) in the other test stimuli were ensembles of dot (simultaneous). The simultaneous condition was
also used in the series of experiments shown in Figure 2 in which we tested the reference frame of
the motor adaptation effect. In one condition we replicated the previous paradigm (with fresh sub-
jects) by asking subjects to tap with the dominant (right) hand on the right side of the screen. In
another condition subjects tapped with the non-dominant (left) hand on the left side. In the third
condition participants crossed their dominant (right) hand to tap on the left side of the screen.
Two adaptation levels were tested separately for each condition. In one we asked subjects to
make as many taps as possible within the adaptation period (high adaption), in the other to tap at a
far slower rate (low adaptation): see Figure 5 for distributions of tapping rates. In all experiments,
the adaptation phase lasted 6 s, and taps were always made with the right hand, on the right side of
the monitor (hand placed 7 deg to the right of the central fixation point). After adaptation, the test
phase started. In all conditions except ‘simultaneous’, test stimuli were a series of white disks (7 deg
diameter), each presented for 40 ms within an interval of 2 s. To minimize temporal regularity, each
disk was temporally jittered with the rule that two consecutive stimuli could not be displayed with an
inter stimuli interval less then 40 ms (with a maximum ISI of 290 ms, in case of the lowest numerosity
N = 6). In the simultaneous condition, test stimuli were circular clouds of dots (ensembles of half-
white half-black non-overlapping dots, 0.3 deg diameter, presented for 250 ms within a circular
region of 7 deg of diameter) centered at 7 deg eccentricity. In the two minimal feedback conditions
(Sequential and Simultaneous), test stimuli were presented both in the adapted position and the
opposite side (centred 7 deg to the left of the central fixation point), randomly selected trial-by-trial.
In all conditions, after presentation of the test stimuli a virtual numerical keypad was displayed for
subjects to record their response by mouse-click. Nine test numerosities were used, 6–14 inclusive.
Each participant performed about 260 trials (4/5 separate sessions), roughly equally divided between
‘low’ and ‘high’ adaptation and test numerosity levels (randomly selected trial-by-trial) leading to a
total amount of trials of approximately 7500. The order of conditions was randomized between
subjects.
Before starting testing, participants were familiarized with stimuli performing a block of 20 trials
with sequential stimuli and 20 trials with dots stimuli. During the familiarization phase, we provided
feedback of the exact number of items/events displayed. No motor (adaptation) training occurred
during the training phase, and no feedback was provided during test phase. We defined an adapta-
tion index (AI) as the average percentage change in perceived numerosity after high and low adapta-
tion, averaged across all numerosity (Equation 1).
Anobile et al. eLife 2016;5:e16161. DOI: 10.7554/eLife.16161 10 of 14
Research article Neuroscience
AI¼100
n
X
n
j¼1
RLJ �RHJ
RLJ þ RHJ
� �
=2
!
(1)
with n¼ 9, the number of numerosities tested (ranging from 6 up to 14), RH the averaged response
to a given numerosity after high adaptation, RL the averaged response after low adaptation.
In the two-alternative forced-choice experiment subjects were simultaneously presented with two
clouds of dots (like those described above) to the right and the left of the central fixation point,
both centered at 7 deg. On each trial, the numerosity of the patch on the right hand side was
1 100.2
1
10
0.2
Sequential (Exp. 1)
Simultaneous (Exp. 1)
Adapt hand: RIGHT - Adapt pos RIGHT (Exp. 2)
Adapt hand: LEFT - Adapt pos LEFT (Exp. 2)
Adapt hand: RIGHT - Adapt pos LEFT (Exp. 2)
Visual and Tactile (Exp. 3)
Tactile only (Exp. 3)
Fastadapt(H
z)
Slow adapt (Hz)
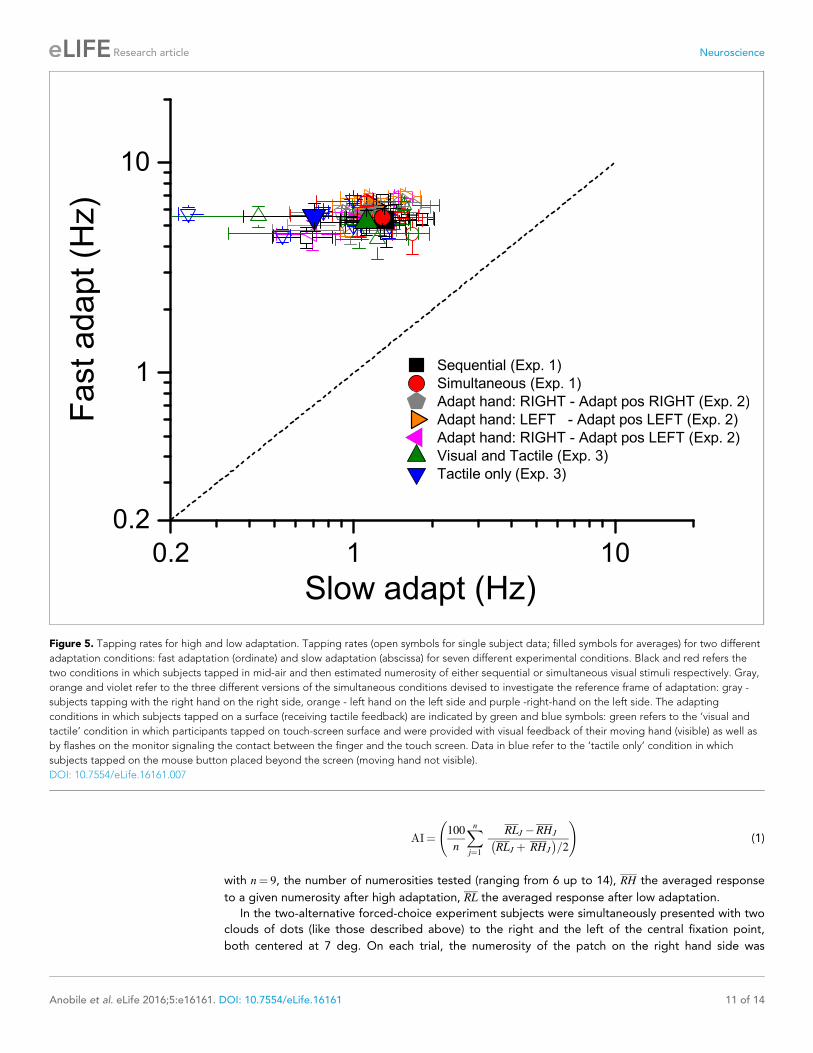
Figure 5. Tapping rates for high and low adaptation. Tapping rates (open symbols for single subject data; filled symbols for averages) for two different
adaptation conditions: fast adaptation (ordinate) and slow adaptation (abscissa) for seven different experimental conditions. Black and red refers the
two conditions in which subjects tapped in mid-air and then estimated numerosity of either sequential or simultaneous visual stimuli respectively. Gray,
orange and violet refer to the three different versions of the simultaneous conditions devised to investigate the reference frame of adaptation: gray -
subjects tapping with the right hand on the right side, orange - left hand on the left side and purple -right-hand on the left side. The adapting
conditions in which subjects tapped on a surface (receiving tactile feedback) are indicated by green and blue symbols: green refers to the ‘visual and
tactile’ condition in which participants tapped on touch-screen surface and were provided with visual feedback of their moving hand (visible) as well as
by flashes on the monitor signaling the contact between the finger and the touch screen. Data in blue refer to the ‘tactile only’ condition in which
subjects tapped on the mouse button placed beyond the screen (moving hand not visible).
DOI: 10.7554/eLife.16161.007
Anobile et al. eLife 2016;5:e16161. DOI: 10.7554/eLife.16161 11 of 14
Research article Neuroscience

chosen at random between 5 and 20 dots; that on the left differed by a random value within the
range ± 5 dots (capped between 5–20). Subjects were required to choose the more numerous. As
there was variability in the numerosity of on both sides, subjects were not tempted to make a stereo-
typical response. In separate sessions numerosity discrimination was preceded by fast tapping, slow
tapping or no-motor action (baseline). The effect of motor adaptation was measured as the differ-
ence in points of subjective equality (expressed as percentage) between high and low adaptation.
For all experiments, tapping was always with the right hand.
Tapping ratesFigure 5 plots the tapping rate for the fast against the slow adaptation conditions, expressed as
actions per second (Hz). Different colors and symbols refer to different experimental conditions (see
caption). On average (across trials and conditions), when asked to tap quickly, participants tapped at
a frequency of 5–6 Hz (for a total number of 30–36 tapping repetitions) with almost no difference
between the adapting conditions: mean 5.33 ± 0.9; 5.48 ± 0.5; 5.2 ± 0.7; 5.54 ± 0.8; 6.19 ± 0.37;
5.69 ± 0.38; 5.67 ± 0.31 for the ‘sequential’, ‘simultaneous’, ‘visual and tactile’, ‘tactile only’, ‘adapt
with the right hand in the right space’, ‘adapt with the left hand in the left space’ and ‘adapt with
the right hand in the left space’ respectively. Also tapping frequencies for the condition in which
subjects tapped slowly were similar across adapting conditions with all values ranging between 0.7
and 1.3 Hz (mean 1.31 ± 0.4; 1.29 ± 0.3; 1.12 ± 0.4; 0.7 ± 0.3; 1.18 ± 0.12; 1.07 ± 0.13; 1.18 ± 0.17
for the ‘sequential’, ‘simultaneous’, ‘visual and tactile’, ‘tactile only’, ‘adapt with the right hand in the
right space’, ‘adapt with the left hand in the left space’ and ‘adapt with the right hand in the left
space’ respectively). These data clearly indicate that regardless the tapping routine to be performed
on a rigid surface or in mid-air, the tapping temporal dynamics were always very similar.
We also tested whether there was a correlation between faster tapping rate and adaptation
effects. There was a slight, but non-significant tendency for faster tapping rates to be associated
with lower adaptation. But as the correlation was not significant, we assume that variable tapping
rates was not a cause for concern for the results of these experiments.
AcknowledgementsThis research was funded by the Italian Ministry of University and Research under the project ’Futuro
in Ricerca’ Grant number RBFR1332DJ, by the European Research Council under the Seventh Frame-
work Programme (FPT/ 2007-2013, Early Sensory Cortex Plasticity and Adaptability in Human Adults)
Grant number 338866 and from Italian Ministry of Health and by Tuscany Region under the project
’Ricerca Finalizzata’, Grant n. GR-2013-02358262 to GA.
Additional information
Funding
Funder Grant reference number Author
Ministero dell’Istruzione, del-l’Universita e della Ricerca
RBFR1332DJ Roberto Arrighi
European Research Council FP7-IDEAS-ERC 338866 David Charles Burr
Ministero della Salute GR-2013-02358262 Giovanni Anobile
The funders had no role in study design, data collection and interpretation, or the decision tosubmit the work for publication.
Author contributions
GA, Wrote the paper, Analysis and interpretation of data, Performed research, Designed the
research, Conception and design, Acquisition of data ; RA, Wrote the paper, Performed research,
Designed the research, Conception and design, Acquisition of data, Analysis and interpretation of
data; IT, Performed research, Designed the research, Acquisition of data, Analysis and interpretation
of data; DCB, Wrote the paper, Designed the research, Conception and design, Analysis and inter-
pretation of data
Anobile et al. eLife 2016;5:e16161. DOI: 10.7554/eLife.16161 12 of 14
Research article Neuroscience
Author ORCIDs
Giovanni Anobile, http://orcid.org/0000-0003-2796-0661
Roberto Arrighi, http://orcid.org/0000-0002-5435-6729
David Charles Burr, http://orcid.org/0000-0003-1541-8832
Ethics
Human subjects: All participants gave written informed consent. Experimental procedures were
approved by the local ethics committee [Comitato Etico Pediatrico Regionale-Azienda Ospedaliero-
Universitaria Meyer-Firenze (FI)] and are in line with the declaration of Helsinki.
ReferencesAnobile G, Arrighi R, Togoli I, Burr D. 2016. A shared numerical representation for action and perception.Figshare. 3406066.
Anobile G, Cicchini GM, Burr DC. 2014. Separate mechanisms for perception of numerosity and density.Psychological Science 25:265–270. doi: 10.1177/0956797613501520
Anobile G, Cicchini GM, Burr DC. 2016. Number as a primary perceptual attribute: A review. Perception 45:5–31. doi: 10.1177/0301006615602599
Anobile G, Turi M, Cicchini GM, Burr DC. 2015. Mechanisms for perception of numerosity or texture-density aregoverned by crowding-like effects. Journal of Vision 15:4. doi: 10.1167/15.5.4
Arrighi R, Cartocci G, Burr D. 2011. Reduced perceptual sensitivity for biological motion in paraplegia patients.Current Biology 21:R910–911. doi: 10.1016/j.cub.2011.09.048
Arrighi R, Togoli I, Burr DC. 2014. A generalized sense of number. Proceedings of the Royal Society 281:20141791. doi: 10.1098/rspb.2014.1791
Arsalidou M, Taylor MJ. 2011. Is 2+2=4? Meta-analyses of brain areas needed for numbers and calculations.NeuroImage 54:2382–2393. doi: 10.1016/j.neuroimage.2010.10.009
Barth H, Kanwisher N, Spelke E. 2003. The construction of large number representations in adults. Cognition 86:201–221. doi: 10.1016/S0010-0277(02)00178-6
Barth H, La Mont K, Lipton J, Spelke ES. 2005. Abstract number and arithmetic in preschool children. PNAS 102:14116–14121. doi: 10.1073/pnas.0505512102
Bell J, Manson A, Edwards M, Meso AI. 2015. Numerosity and density judgments: Biases for area but not forvolume. Journal of Vision 15:18. doi: 10.1167/15.2.18
Brannon EM. 2003. Number knows no bounds. Trends in Cognitive Sciences 7:279–281. doi: 10.1016/S1364-6613(03)00137-2
Burr D, Ross J. 2008. A visual sense of number. Current Biology 18:425–428. doi: 10.1016/j.cub.2008.02.052Burr D, Tozzi A, Morrone MC. 2007. Neural mechanisms for timing visual events are spatially selective in real-world coordinates. Nature Neuroscience 10:423–425. doi: 10.1038/nn1874
Castaldi E, Aagten-Murphy D, Tosetti M, Burr D, Morrone MC. 2014. Effects of Adaptation on NumerosityDecoding in the Human Brain. 9th Fens Forum of Neuroscience. Milan: Federation of European NeuroscienceSocieties (FENS).
Castelli F, Glaser DE, Butterworth B. 2006. Discrete and analogue quantity processing in the parietal lobe: Afunctional MRI study. PNAS 103:4693–4698. doi: 10.1073/pnas.0600444103
Cicchini M, Anobile G, Burr DC. 2016. Spontaneous perception of numerosity in humans. NatureCommunications 7:12536. In Press.
Cohen J. 1988. Statistical Power Analysis for the Behavioral Sciences (2nd ed). Hillsdale, New Jersey: L. Erlbaum.Dakin SC, Tibber MS, Greenwood JA, Kingdom FAA, Morgan MJ. 2011. A common visual metric forapproximate number and density. PNAS 108:19552–19557. doi: 10.1073/pnas.1113195108
Dehaene S, Piazza M, Pinel P, Cohen L. 2003. Three parietal circuits for number processing. CognitiveNeuropsychology 20:487–506. doi: 10.1080/02643290244000239
Dehaene S. 2011. The Number Sense (2nd ed). New York: Oxford University Press.Durgin FH. 1995. Texture density adaptation and the perceived numerosity and distribution of texture. Journalof Experimental Psychology 21:149–169. doi: 10.1037/0096-1523.21.1.149
Durgin FH. 2008. Texture density adaptation and visual number revisited. Current Biology 18:R855–R856. doi:10.1016/j.cub.2008.07.053
Fornaciai M, Arrighi R, Burr DC. 2016. Adaptation-Induced Compression of Event Time Occurs Only forTranslational Motion. Scientific Reports 6:srep23341. doi: 10.1038/srep23341
Goodale MA, Milner AD. 1992. Separate visual pathways for perception and action. Trends in Neurosciences 15:20–25. doi: 10.1016/0166-2236(92)90344-8
Harvey BM, Klein BP, Petridou N, Dumoulin SO. 2013. Topographic representation of numerosity in the humanparietal cortex. Science 341:1123–1126. doi: 10.1126/science.1239052
He L, Zhou K, Zhou T, He S, Chen L. 2015. Topology-defined units in numerosity perception. PNAS 112:E5647–E5655. doi: 10.1073/pnas.1512408112
Izard V, Sann C, Spelke ES, Streri A. 2009. Newborn infants perceive abstract numbers. PNAS 106:10382–10385.doi: 10.1073/pnas.0812142106
Anobile et al. eLife 2016;5:e16161. DOI: 10.7554/eLife.16161 13 of 14
Research article Neuroscience
Jordan KE, Brannon EM, Logothetis NK, Ghazanfar AA. 2005. Monkeys match the number of voices they hear tothe number of faces they see. Current Biology 15:1034–1038. doi: 10.1016/j.cub.2005.04.056
Jordan KE, Brannon EM. 2006. The multisensory representation of number in infancy. PNAS 103:3486–3489. doi:10.1073/pnas.0508107103
Kansaku K, Carver B, Johnson A, Matsuda K, Sadato N, Hallett M. 2007. The role of the human ventral premotorcortex in counting successive stimuli. Experimental Brain Research 178:339–350. doi: 10.1007/s00221-006-0736-8
Leon MI, Shadlen MN. 2003. Representation of time by neurons in the posterior parietal cortex of the macaque.Neuron 38:317–327. doi: 10.1016/S0896-6273(03)00185-5
Mollon J. 1974. After-effects and the brain. New Scientist 61:479–482.Morgan MJ, Raphael S, Tibber MS, Dakin SC. 2014. A texture-processing model of the ’visual sense of number’.Proceedings of the Royal Society B: Biological Sciences 281:20141137. doi: 10.1098/rspb.2014.1137
Nieder A, Diester I, Tudusciuc O. 2006. Temporal and spatial enumeration processes in the primate parietalcortex. Science 313:1431–1435. doi: 10.1126/science.1130308
Nieder A, Miller EK. 2004. A parieto-frontal network for visual numerical information in the monkey. PNAS 101:7457–7462. doi: 10.1073/pnas.0402239101
Nieder A. 2005. Counting on neurons: the neurobiology of numerical competence. Nature Reviews Neuroscience6:177–190. doi: 10.1038/nrn1626
Nieder A. 2012. Supramodal numerosity selectivity of neurons in primate prefrontal and posterior parietalcortices. PNAS 109:11860–11865. doi: 10.1073/pnas.1204580109
Nieder A. 2016. The neuronal code for number. Nature Reviews Neuroscience 17:366–382. doi: 10.1038/nrn.2016.40
Piazza M, Eger E. 2016. Neural foundations and functional specificity of number representations.Neuropsychologia 83:257–273. doi: 10.1016/j.neuropsychologia.2015.09.025
Piazza M, Izard V, Pinel P, Le Bihan D, Dehaene S. 2004. Tuning curves for approximate numerosity in the humanintraparietal sulcus. Neuron 44:547–555. doi: 10.1016/j.neuron.2004.10.014
Piazza M, Mechelli A, Price CJ, Butterworth B. 2006. Exact and approximate judgements of visual and auditorynumerosity: An fMRI study. Brain Research 1106:177–188. doi: 10.1016/j.brainres.2006.05.104
Piazza M, Pinel P, Le Bihan D, Dehaene S. 2007. A magnitude code common to numerosities and numbersymbols in human intraparietal cortex. Neuron 53:293–305. doi: 10.1016/j.neuron.2006.11.022
Ross J, Burr D. 2012. Number, texture and crowding. Trends in Cognitive Sciences 16:196–197. doi: 10.1016/j.tics.2012.01.010
Ross J, Burr DC. 2010. Vision senses number directly. Journal of Vision 10:1–8. doi: 10.1167/10.2.10Sawamura H, Shima K, Tanji J. 2002. Numerical representation for action in the parietal cortex of the monkey.Nature 415:918–922. doi: 10.1038/415918a
Sawamura H, Shima K, Tanji J. 2010. Deficits in action selection based on numerical information after inactivationof the posterior parietal cortex in monkeys. Journal of Neurophysiology 104:902–910. doi: 10.1152/jn.01014.2009
Schwiedrzik CM, Bernstein B, Melloni L. 2016. Motion along the mental number line reveals sharedrepresentations for numerosity and space. eLife 5:e10806. doi: 10.7554/eLife.10806
Slutsky DA, Recanzone GH. 2001. Temporal and spatial dependency of the ventriloquism effect. Neuroreport12:7–10. doi: 10.1097/00001756-200101220-00009
Thompson P, Burr D. 2009. Visual aftereffects. Current Biology 19:R11–R14. doi: 10.1016/j.cub.2008.10.014Tibber MS, Greenwood JA, Dakin SC. 2012. Number and density discrimination rely on a common metric: Similarpsychophysical effects of size, contrast, and divided attention. Journal of Vision 12. doi: 10.1167/12.6.8
Tibber MS, Manasseh GS, Clarke RC, Gagin G, Swanbeck SN, Butterworth B, Lotto RB, Dakin SC. 2013.Sensitivity to numerosity is not a unique visuospatial psychophysical predictor of mathematical ability. VisionResearch 89:1–9. doi: 10.1016/j.visres.2013.06.006
Tokita M, Ishiguchi A. 2012. Behavioral evidence for format-dependent processes in approximate numerosityrepresentation. Psychonomic Bulletin & Review 19:285–293. doi: 10.3758/s13423-011-0206-6
Viswanathan P, Nieder A. 2013. Neuronal correlates of a visual "sense of number" in primate parietal andprefrontal cortices. PNAS 110:11187–11192. doi: 10.1073/pnas.1308141110
Anobile et al. eLife 2016;5:e16161. DOI: 10.7554/eLife.16161 14 of 14
Research article Neuroscience