A scoping study characterising dust drift from aerial ... · Characterising dust drift from aerial...
67
A scoping study characterising dust drift from aerial application of 1080: Waimea Kawhaka, November 2015 July 2016 Prepared by Emission Impossible Ltd & AirQuality Ltd PREPARED FOR: The Ministry of Health CLIENT REPORT No: FW15060 PREPARED BY: Louise Wickham, Paul Baynham REVIEWED BY: Surekha Sridhar, Dr Brett Wells
Transcript of A scoping study characterising dust drift from aerial ... · Characterising dust drift from aerial...

A scoping study characterising dust drift from aerial application of 1080:
Waimea Kawhaka, November 2015
July 2016
Prepared by Emission Impossible Ltd & AirQuality Ltd
PREPARED FOR: The Ministry of Health
CLIENT REPORT No: FW15060
PREPARED BY: Louise Wickham, Paul Baynham
REVIEWED BY: Surekha Sridhar, Dr Brett Wells


Characterising dust drift from aerial application of 1080 July 2016 INSTITUTE OF ENVIRONMENTAL SCIENCE AND RESEARCH LIMITED
ACKNOWLEDGEMENTS
ESR acknowledges the assistance of the following organisations and individuals:
Vector Control Services who carried out the aerial 1080 application and provided assistance with selecting monitoring sites and comments on the operational details of the draft report.
The landowners who provided access to their land for monitoring (and an electrical supply for inhalable particulate monitoring at the site located 1,000 metres outside the application zone).
Dr Cheryl Brunton, Evan McKenzie and Dr Naty Foronda who provided comments on the draft report.
Manager
Co-author
Co-author
Chris Nokes
Louise Wickham
Paul Baynham
Science Leader, Risk and Response Group, ESR
Senior Air Quality Specialist, Emission Impossible Limited
Senior Air Quality Specialist, AirQuality Limited
Peer reviewer
Peer reviewer
Surekha Sridhar
Dr Brett Wells
Senior Air Quality Specialist,
Emission Impossible Limited Managing Director,
AirQuality Limited
DISCLAIMER
The Institute of Environmental Science and Research Limited (ESR) has used all reasonable
endeavours to ensure that the information contained in this client report is accurate. However ESR
does not give any express or implied warranty as to the completeness of the information contained in
this client report or that it will be suitable for any purposes other than those specifically contemplated
during the Project or agreed by ESR and the Client.


Characterising dust drift from aerial application of 1080 July 2016 INSTITUTE OF ENVIRONMENTAL SCIENCE AND RESEARCH LIMITED Page i
EXECUTIVE SUMMARY
The purpose of this scoping study was to:
Detect and characterise 1080 particulate downwind of an aerial baiting application
Air quality monitoring for 1080 in inhalable particulate, measured as total suspended particulate (TSP), and deposited particulate was undertaken before, during and after a 1080 aerial application operation near Kumara on the West Coast on 5 November 2015. Five monitoring stations were located:
(i) Inside the aerial application zone
(ii) At the boundary of the application zone
(iii) 180 metres outside the application zone
(iv) 330 metres outside the application zone
(v) 415 metres outside the application zone.
A sixth monitoring station was also located 1,000 metres outside the application zone for measurement of TSP (only). Monitoring of meteorology was also undertaken at the site 180 metres outside the application zone.
The monitoring did not reveal any significant temporal variation in TSP downwind of the
1080 aerial application. All measured downwind TSP concentrations were low (< 10
micrograms per cubic metre, µg/m3) and consistent with upwind measured concentrations,
with one exception. The one exception was a two hour period of elevated (70 µg/m3) short-
term TSP at the monitoring station on the boundary of the application zone. These elevated
levels correlated with an unexpected visit by a bee keeper on the morning after the aerial
application and are most likely due to diesel truck exhaust emissions.
The results suggest that if suspended particulate is generated from 1080 aerial application
then it is only generated in small quantities.
1080 was not detected in TSP at monitoring sites inside the application zone, at the boundary of the application zone or at monitoring sites located 330 metres and 415 metres outside the application zone. However, 1080 was detected in TSP measured at the site located 180 metres outside the application zone. This singular positive result could have arisen from:
Sample contamination; or
Intermittent or variable suspended particulate from aerial application upwind of this site only and subsequent drift.
We do not consider there is sufficient certainty to draw any firm conclusions about the source. The amount of measured 1080 was extremely small (<0.025 micrograms in more than five cubic metres of air sampled).
1080 was not detected in any of the deposited particulate gauges, however, the limitations of the monitoring method need to be borne in mind. (1080 is highly soluble and degrades within 1-8 days whereas the monitors contained demineralised water and were left in situ for 2 days after the application to try to capture re-entrained dust).

Characterising dust drift from aerial application of 1080 July 2016 INSTITUTE OF ENVIRONMENTAL SCIENCE AND RESEARCH LIMITED Page ii
It should be noted that this was a scoping study and the findings are not conclusive. There are many parameters that potentially affect dust generation from aerial application of 1080 and these parameters change in practice with each application.
For example, the generation of suspended particulate and any associated 1080 emissions from 1080 aerial application may be significantly different in applications where:
Larger helicopters (with larger/faster blades and/or larger buckets) are used
Lower flying altitudes are employed
Smaller (ie, 6 gram) baits are employed.
We recommend repeating the field research in other geographical locations.

Characterising dust drift from aerial application of 1080 July 2016 INSTITUTE OF ENVIRONMENTAL SCIENCE AND RESEARCH LIMITED Page iii
CONTENTS
EXECUTIVE SUMMARY ......................................................................... I
1. INTRODUCTION ................................................................................. 1
1.1 AIMS OF THIS SCOPING STUDY ......................................................................................... 1
1.2 DEFINITIONS.......................................................................................................................... 1
1.3 BACKGROUND....................................................................................................................... 2
2. METHOD ............................................................................................ 5
2.1 SITE LOCATION ..................................................................................................................... 5
2.2 MONITORING OVERVIEW .................................................................................................... 6
2.3 MONITORING DETAILS ......................................................................................................... 6
2.4 SECURITY .............................................................................................................................. 9
3. RESULTS ......................................................................................... 11
3.1 METEOROLOGY .................................................................................................................. 16
3.2 TOTAL SUSPENDED PARTICULATE (TSP) ....................................................................... 19
3.3 1080 IN TSP .......................................................................................................................... 30
3.4 1080 IN DEPOSITED PARTICULATE .................................................................................. 31
3.5 OPERATIONAL REVIEW ..................................................................................................... 32
4. DISCUSSION .................................................................................... 35
5. CONCLUSIONS ................................................................................ 38
5.1 KEY LEARNINGS FROM THIS RESEARCH ....................................................................... 38
5.2 LIMITATIONS AND RECOMMENDATIONS FOR FUTURE STUDIES ............................... 39
APPENDIX A: CHAIN OF CUSTODY ................................................... 41
APPENDIX B: DATA CAPTURE ........................................................... 44
APPENDIX C: MONITORING SITE DETAILS ...................................... 46
APPENDIX D: TOXICOLOGY ANALYSES ........................................... 53
Characterising dust drift from aerial application of 1080 July 2016 INSTITUTE OF ENVIRONMENTAL SCIENCE AND RESEARCH LIMITED Page iv
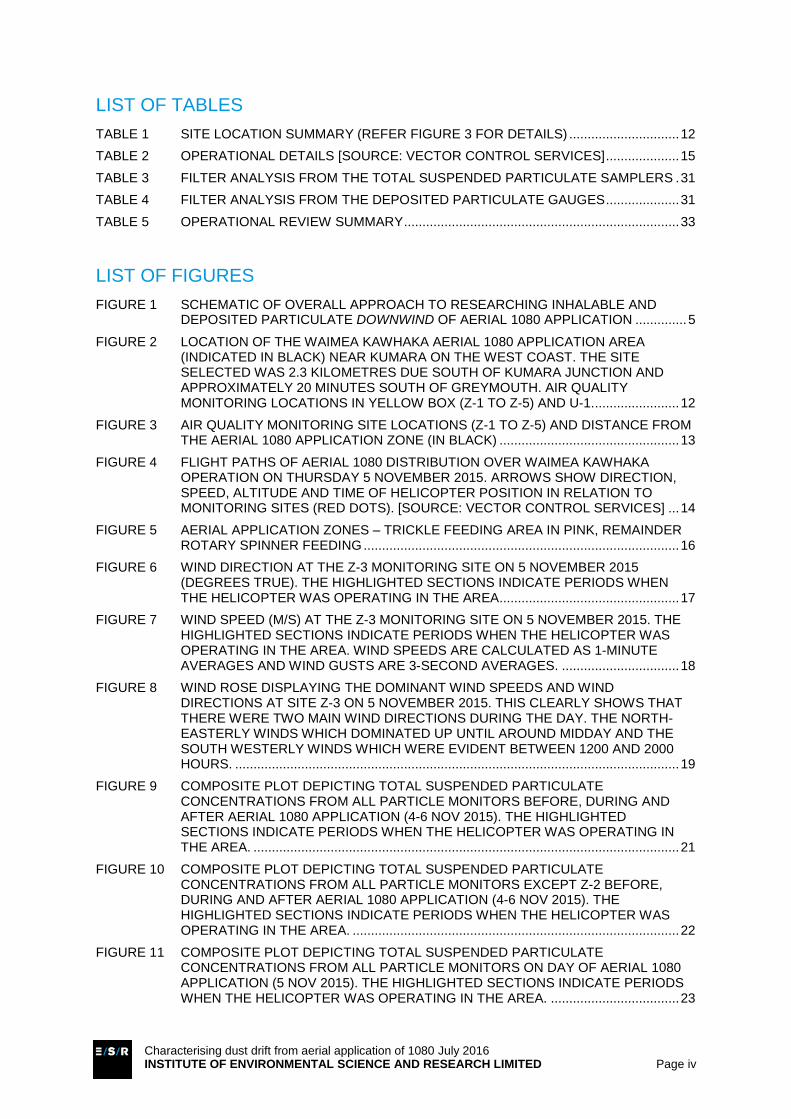
LIST OF TABLES
TABLE 1 SITE LOCATION SUMMARY (REFER FIGURE 3 FOR DETAILS) .............................. 12
TABLE 2 OPERATIONAL DETAILS [SOURCE: VECTOR CONTROL SERVICES] .................... 15
TABLE 3 FILTER ANALYSIS FROM THE TOTAL SUSPENDED PARTICULATE SAMPLERS . 31
TABLE 4 FILTER ANALYSIS FROM THE DEPOSITED PARTICULATE GAUGES .................... 31
TABLE 5 OPERATIONAL REVIEW SUMMARY ........................................................................... 33
LIST OF FIGURES
FIGURE 1 SCHEMATIC OF OVERALL APPROACH TO RESEARCHING INHALABLE AND DEPOSITED PARTICULATE DOWNWIND OF AERIAL 1080 APPLICATION .............. 5
FIGURE 2 LOCATION OF THE WAIMEA KAWHAKA AERIAL 1080 APPLICATION AREA (INDICATED IN BLACK) NEAR KUMARA ON THE WEST COAST. THE SITE SELECTED WAS 2.3 KILOMETRES DUE SOUTH OF KUMARA JUNCTION AND APPROXIMATELY 20 MINUTES SOUTH OF GREYMOUTH. AIR QUALITY MONITORING LOCATIONS IN YELLOW BOX (Z-1 TO Z-5) AND U-1. ....................... 12
FIGURE 3 AIR QUALITY MONITORING SITE LOCATIONS (Z-1 TO Z-5) AND DISTANCE FROM THE AERIAL 1080 APPLICATION ZONE (IN BLACK) ................................................. 13
FIGURE 4 FLIGHT PATHS OF AERIAL 1080 DISTRIBUTION OVER WAIMEA KAWHAKA OPERATION ON THURSDAY 5 NOVEMBER 2015. ARROWS SHOW DIRECTION, SPEED, ALTITUDE AND TIME OF HELICOPTER POSITION IN RELATION TO MONITORING SITES (RED DOTS). [SOURCE: VECTOR CONTROL SERVICES] ... 14
FIGURE 5 AERIAL APPLICATION ZONES – TRICKLE FEEDING AREA IN PINK, REMAINDER ROTARY SPINNER FEEDING ...................................................................................... 16
FIGURE 6 WIND DIRECTION AT THE Z-3 MONITORING SITE ON 5 NOVEMBER 2015 (DEGREES TRUE). THE HIGHLIGHTED SECTIONS INDICATE PERIODS WHEN THE HELICOPTER WAS OPERATING IN THE AREA ................................................. 17
FIGURE 7 WIND SPEED (M/S) AT THE Z-3 MONITORING SITE ON 5 NOVEMBER 2015. THE HIGHLIGHTED SECTIONS INDICATE PERIODS WHEN THE HELICOPTER WAS OPERATING IN THE AREA. WIND SPEEDS ARE CALCULATED AS 1-MINUTE AVERAGES AND WIND GUSTS ARE 3-SECOND AVERAGES. ................................ 18
FIGURE 8 WIND ROSE DISPLAYING THE DOMINANT WIND SPEEDS AND WIND DIRECTIONS AT SITE Z-3 ON 5 NOVEMBER 2015. THIS CLEARLY SHOWS THAT THERE WERE TWO MAIN WIND DIRECTIONS DURING THE DAY. THE NORTH-EASTERLY WINDS WHICH DOMINATED UP UNTIL AROUND MIDDAY AND THE SOUTH WESTERLY WINDS WHICH WERE EVIDENT BETWEEN 1200 AND 2000 HOURS. ......................................................................................................................... 19
FIGURE 9 COMPOSITE PLOT DEPICTING TOTAL SUSPENDED PARTICULATE CONCENTRATIONS FROM ALL PARTICLE MONITORS BEFORE, DURING AND AFTER AERIAL 1080 APPLICATION (4-6 NOV 2015). THE HIGHLIGHTED SECTIONS INDICATE PERIODS WHEN THE HELICOPTER WAS OPERATING IN THE AREA. .................................................................................................................... 21
FIGURE 10 COMPOSITE PLOT DEPICTING TOTAL SUSPENDED PARTICULATE CONCENTRATIONS FROM ALL PARTICLE MONITORS EXCEPT Z-2 BEFORE, DURING AND AFTER AERIAL 1080 APPLICATION (4-6 NOV 2015). THE HIGHLIGHTED SECTIONS INDICATE PERIODS WHEN THE HELICOPTER WAS OPERATING IN THE AREA. ......................................................................................... 22
FIGURE 11 COMPOSITE PLOT DEPICTING TOTAL SUSPENDED PARTICULATE CONCENTRATIONS FROM ALL PARTICLE MONITORS ON DAY OF AERIAL 1080 APPLICATION (5 NOV 2015). THE HIGHLIGHTED SECTIONS INDICATE PERIODS WHEN THE HELICOPTER WAS OPERATING IN THE AREA. ................................... 23

Characterising dust drift from aerial application of 1080 July 2016 INSTITUTE OF ENVIRONMENTAL SCIENCE AND RESEARCH LIMITED Page v
FIGURE 12 PLOT OF THE TSP CONCENTRATION AS MEASURED AT THE Z-1 MONITORING STATION ON 5 NOVEMBER 2015. THE HIGHLIGHTED SECTIONS CORRESPOND TO HELICOPTER ACTIVITY IN THE IMMEDIATE VICINITY OF THE MONITORING SITE. .............................................................................................................................. 24
FIGURE 13 PLOT OF THE TSP CONCENTRATION AS MEASURED AT THE Z-2 MONITORING STATION ON 5 NOVEMBER 2015. THE HIGHLIGHTED SECTIONS CORRESPOND TO HELICOPTER ACTIVITY IN THE NEAR VICINITY (40 M) OF THE MONITORING SITE. .............................................................................................................................. 25
FIGURE 14 PLOT OF THE TSP CONCENTRATION AS MEASURED AT THE Z-3 MONITORING STATION ON 5 NOVEMBER 2015. THE HIGHLIGHTED SECTIONS CORRESPOND TO HELICOPTER ACTIVITY 180 METRES UPWIND. ................................................. 27
FIGURE 15 PLOT OF THE TSP CONCENTRATION AS MEASURED AT THE Z-4 MONITORING STATION ON 5 NOVEMBER 2015. THE HIGHLIGHTED SECTIONS CORRESPOND TO HELICOPTER ACTIVITY 330 METRES UPWIND. ................................................. 28
FIGURE 16 PLOT OF THE TSP CONCENTRATION AS MEASURED AT THE Z-5 MONITORING STATION ON 5 NOVEMBER 2015. THE HIGHLIGHTED SECTIONS CORRESPOND TO HELICOPTER ACTIVITY 415 METRES UPWIND. ................................................. 29
FIGURE 17 PLOT OF THE TSP CONCENTRATION AS MEASURED AT THE U-1 MONITORING STATION ON 5 NOVEMBER 2015. THE HIGHLIGHTED SECTIONS CORRESPOND TO HELICOPTER ACTIVITY IN THE WIDER AREA (1,000 METRES AWAY). ........... 30
FIGURE 18 LOADING ZONE IN RELATION TO MONITORING SITES .......................................... 36
LIST OF PHOTOS
PHOTO 1 PHOTOGRAPH OF THE MONITORING STATION AT SITE Z-4 ILLUSTRATING THE SECURITY TAPE ON THE DEVICE WITH SIGNATURES OF THE FIELD TECHNICIANS ACROSS ALL JOINS. THE SAMPLE FILTER IS SITUATED INSIDE THE METAL CASE. ....................................................................................................... 10
PHOTO 2 PICTURE FROM THE SECURITY CAMERA SHOWING THE BEEKEEPER’S TRUCK LEAVING AND TRAVELLING PAST SITE Z-3 (06/11/15, 0930 HOURS) AFTER INSTALLING THE HIVES AT SITE Z-2 ......................................................................... 20
PHOTO 3 PHOTOGRAPH OF SITE Z-1 (04/11/15, 1640 HOURS) .............................................. 24
PHOTO 4 PHOTOGRAPH OF SITE Z-2 (04/11/15, 1750 HOURS) .............................................. 25
PHOTO 5 PHOTOGRAPH OF SITE Z-3 LOOKING TO THE SOUTH (05/11/15, 0750 HOURS) . 26
PHOTO 6 PHOTOGRAPH OF SITE Z-4 LOOKING TO THE EAST (05/11/15, 0835 HOURS) .... 27
PHOTO 7 PHOTOGRAPH OF SITE Z-5 LOOKING TO THE NORTHWEST (05/11/15, 0846 HOURS) ......................................................................................................................... 29


Characterising dust drift from aerial application of 1080 July 2016 INSTITUTE OF ENVIRONMENTAL SCIENCE AND RESEARCH LIMITED Page 1
1. INTRODUCTION
Aerial application of sodium monofluoroacetate (referred to hereafter as 1080) is carried out over large areas of New Zealand to control pests such as possums and ship rats. The poison is applied to carrots or cereal pellet bait and then dropped to the target area by helicopter. Aerial application permits efficient access to steep and otherwise inaccessible terrain, as well as areas with thick vegetation.
Dust drift may potentially arise from aerial application of 1080. This is because physical abrasion from transport, loading and aerial application of 1080 bait can generate dust particles that could drift over loading zone and application zone boundaries. Some of these particles could deposit on food or crops, or in water tanks used for drinking water. Other particles may be sufficiently fine to travel significant distances and be inhaled by people.
To address this matter, the Ministry of Health commissioned the Institute of Environmental Science and Research (ESR) to research dust drift from 1080 aerial application. As a first step, this scoping study was undertaken to determine whether or not dust drift could be detected.
1.1 AIMS OF THIS SCOPING STUDY
The field research was to consider human (only) non-occupational exposure to 1080 particulate. The Ministry of Health requested the research focus on determining whether 1080 can, or cannot, be detected in field monitoring. Accordingly, this report presents findings of a field research project to:
Detect and characterise 1080 particulate downwind of an aerial baiting application
An additional objective was to provide sufficient detail to enable any future researchers to repeat or improve upon the monitoring methodology used in this study, and if necessary, to build upon its findings with additional research (eg, dispersion modelling or exposure assessment).
1.2 DEFINITIONS
For the purposes of this study, the term 'airborne dust’ includes:
bait and fragments of bait (not measured unless it happens to fall into deposited dust gauge)
bait dust - defined as particulate matter >50 micrometres (µm) in diameter up to several hundred µm and measured as deposited particulate
inhalable particulate - defined as particulate matter <40 µm in diameter and measured as total suspended particulate (TSP) using a nephelometer
coarse particulate matter - defined as particulate matter <10 µm in diameter (PM10) (included in TSP fraction but not measured separately)
fine particulate matter - defined as particulate matter <2.5 µm in diameter (PM2.5) (included in TSP fraction but not measured separately)

Characterising dust drift from aerial application of 1080 July 2016 INSTITUTE OF ENVIRONMENTAL SCIENCE AND RESEARCH LIMITED Page 2
Field research was conducted on the deposited and inhalable fractions of particulate matter (only) arising from aerial baiting operations.
1.3 BACKGROUND
We have identified two studies that investigated the presence, or otherwise, of 1080 dust downwind of the aerial application of 1080.
The first study, Bromley et al.,1 was carried out in Featherstone in 1996. This study carried out atmospheric monitoring within 100 – 400 metres of an aerial baiting operation and did not detect any 1080. However, the lack of detection was not, of itself, conclusive because:
the size fraction sampled was not stated
it is not clear if the sampling was downwind, and
the limit of detection (0.01 micrograms) was relatively high.
The second study, Wright et al. (2002),2 detected 1080 in deposited dust collected 1,000 metres downwind of the boundary of three aerially baited areas in 1997 and 1998. 1080 was also detected in plant samples collected 1,000 metres downwind of the boundary of two aerially baited areas and in leaf litter collected 600 metres downwind of the boundary of one aerially baited area. The limits of detection for this study were 0.003 µg/g particulate and 0.005 µg/g in plant material and leaf litter.
More recently, Jennings et al.3 monitored upwind and within the loading zone of an aerial application near Dunsinane in 2014. This study measured elevated levels of inhalable particulate in comparison with workplace exposure standards,4 and detected 1080 at up to 10% of workplace exposure standards, albeit only over short (15 minute) time periods. However, the monitoring was for occupational exposure purposes and did not investigate inhalable particulate or 1080 levels offsite.
Jennings et al. noted there was no visible dust cloud when the bait was loaded from bags, via a chute to the hopper. However, the study noted a significant dust cloud which extended for around 5 -10 metres from the loading zone whilst the hopper was being attached as the helicopter hovered above. The attachment process takes approximately 1 minute.
Our review of Environment Protection Authority (EPA) annual reports indicates that baits can fall outside treatment areas for a number of reasons.5 Notably, in November 2013, walkers on the Nydia Track reported that “a helicopter laying baits had flown over them and toxic pellets fell close to them leaving an awful taste in their mouth
1 Bromley A, (1996). Monitoring Atmospheric Air Quality During a 1080 Poison Airdrop Near
Featherston, April 1996, NIWA, 10 July 1996, Confidential report to Wellington Regional Council.
2 Wright G, Booth L, Morriss G, Potts M, Brown L and Eason C, (2002). Assessing potential environmental contamination from compound 1080 (sodium monofluoroacetate) in bait dust during possum control operations. New Zealand Journal of Agricultural Research. 45:1. 57-65.
3 Jennings B, (2014). 1080 Bait Drop – Air Monitoring Report, Dunsinane Site 22 October 2014, Prepared for Department of Conservation by Chemsafety, Christchurch
4 91%, 120% and 210% of workplace exposure standard time weighted average (WES-TWA)
5 eg, operator error, bait falling from bucket during turn outside treatment area, bait bouncing on rocks or steep terrain, wind.

Characterising dust drift from aerial application of 1080 July 2016 INSTITUTE OF ENVIRONMENTAL SCIENCE AND RESEARCH LIMITED Page 3
from the dust that fell around them”.6 There were also reports of baits being encountered on the Nydia Track by other members of the public despite a 20 metre exclusion zone either side of the track.
The (2002) occupational guidelines for the safe use of 1080 do not identify any sources for exposure to inhalable particulate associated with aerial bait application other than loading operations.7 In any case, these guidelines focus on occupational exposure which is not the subject of this research proposal.
We understand that the application rate of 1080 (kilograms per hectare) has decreased in recent years. We further understand that bait is now manufactured to be less likely to form fragments or ‘chaff’ to reduce bird deaths (smaller fragments are more likely to be eaten by birds and insects).8 This is likely to have an added benefit of reducing dust generation.
6 Environmental Protection Authority, (2013). Annual Report on the Aerial Use of 1080 For the Year Ended 31 December 2013. Wellington. Available at:
http://www.epa.govt.nz/Publications/2013_1080_Annual%20Report.pdf
7 Occupational Safety and Health Service, (2002). Guidelines for the safe use of sodium Fluoroacetate (1080), Department of Labour, Wellington. http://www.business.govt.nz/worksafe/information-guidance/all-guidance-items/sodium-fluoroacetate-1080-guidelines-for-the-safe-use-of/1080guidelines.pdf
8 Eason C. (2002). Sodium monofluoroacetate (1080) risk assessment and risk communication. Toxicology 181-182, p523-530.

Characterising dust drift from aerial application of 1080 July 2016 INSTITUTE OF ENVIRONMENTAL SCIENCE AND RESEARCH LIMITED Page 4
[Intentionally Blank]

Characterising dust drift from aerial application of 1080 July 2016 INSTITUTE OF ENVIRONMENTAL SCIENCE AND RESEARCH LIMITED Page 5
2. METHOD
2.1 SITE LOCATION
The primary aim of the research was to position air quality monitors downwind of an aerial application. Successfully achieving this aim required an understanding of three things.
1. Local terrain; air quality monitoring needs an open arc (ie, space) to be free of the influence of trees, buildings or structures that may impede or distort the air flow.
2. Understanding of local weather patterns, including micro-climate effects and how these affect air flow
3. Socio-political factors; we were reliant on the generosity of landowners providing space and access to monitoring locations. The use of 1080 is highly controversial in New Zealand. This means accessibility (to monitoring locations) and security were important considerations.
Figure 1 provides a schematic of the overall approach employed.
Figure 1 Schematic of overall approach to researching inhalable and deposited particulate downwind of aerial 1080 application

Characterising dust drift from aerial application of 1080 July 2016 INSTITUTE OF ENVIRONMENTAL SCIENCE AND RESEARCH LIMITED Page 6
2.2 MONITORING OVERVIEW
Air quality monitoring was undertaken before, during and after an aerial 1080 application commissioned by TBFree on a block called Waimea Kawhaka near Kumara on the West Coast on Thursday 5 November 2015. All six monitoring stations were assembled and commissioned between 10 and 15 hours prior to commencing the aerial application and continued to operate for an additional 22 to 24 hours after the aerial application concluded.
The deposited particulate gauges were deployed on 4 November 2015 and retrieved
on Saturday 7 November 2015. Deposition gauges are relatively simple devices,
consisting of a glass funnel which directs any collected particles into a solution in a
glass container. Due to a lack of preparation time, demineralised water was used
instead of distilled water. The volume of water within the gauges was minimised to
reduce the dilution effects of any 1080 particles which enter the gauge. Upon
collection, the five gauges were placed in an ice bath (to further reduce microbial
degradation) before being transported to Landcare Research’s laboratory for
analysis.
The monitoring employed remote power systems for five of the six stations and further utilised two hidden surveillance cameras at two of the sites to monitor for suspicious activity.
Analysis for 1080 was performed by Landcare Research using gas chromatography following water extraction (based on TLM 005, which has a detection limit of 0.0001 µg/mL).9
A review of aerial application reporting was undertaken using information available on the Environmental Protection Authority’s website.10 Aerial applications performed in all other regions of New Zealand during 2014 were used to evaluate the representativeness of the aerial application being monitored for this research project on the West Coast.
2.3 MONITORING DETAILS
All six TSP monitors used in the study were nephelometers. The tripod mounted nephelometers were selected for their precision, responsiveness, good temporal resolution and portability in comparison to other types of particle monitors (eg, beta-attenuation monitors, high volume samplers and TEOM’s) all of which require a mains powered supply to operate.
9 Gas chromatography method TLM 005, ‘Assay of 1080 in water, soil, and biological materials by GLC’ was developed by Landcare Research, Lincoln, based on the work of Ozawa & Tsukioka (1987, 1989). This method is accredited with IANZ (International Accreditation New Zealand) under Environmental Monitoring. NB: Detection limit for particle filters was 0.005 µg/filter.
Ozawa H, Tsukioka T 1987. Gas chromatographic determination of sodium monofluoroacetate in water by derivatization with dicyclohexylcarbodiimide. Analytical Chemistry 59: 2914–2917.
Ozawa H, Tsukioka T 1989. Determination of monofluoroacetate in soil and biological samples as the
dichloroanilide derivative. Journal of Chromatography 473: 251–259.
10 www.epa.govt.nz

Characterising dust drift from aerial application of 1080 July 2016 INSTITUTE OF ENVIRONMENTAL SCIENCE AND RESEARCH LIMITED Page 7
The monitors were all configured to monitor TSP rather than PM1011 or PM2.5
12. TSP is
often used as a proxy for assessing dust nuisance as TSP incorporates the larger particles which are visible to the naked eye and can cause surface soiling and reduced amenity effects at higher concentrations. In the context of this study, TSP results will also include the smaller PM10 and PM2.5 particles. It should be noted however that unlike PM10 there is no standard method or national environmental standard for TSP.
All six nephelometers were operated at a flow rate of 2 litres per minute +/- 0.1 litres per minute (corrected to 0° Celsius and 101.3 kPa). The flows were checked in the laboratory prior to deployment in the field using a calibrated Dry-Cal Definer with a flow range of 0 to 5,000 cc/min. Unfortunately, due to aviation security concerns, the field technicians were unable to transport the dry-cal definer on the aircraft so a replacement unit was borrowed from Environment Canterbury Regional Council upon arrival in
Christchurch.13
Each of the nephelometers was coupled with an additional particulate filter to capture any TSP dust during the aerial operation for subsequent 1080 analysis. Four of the nephelometers (Met-One E-Samplers) contained built-in filter sample holders and the flow rate through these units was limited to 2 litres per minute.
The remaining two nephelometers (Met One ES642 units) were co-located with separate sample filter holders which were constructed entirely of polyfluoroacetate (PFA) to minimise any sample contamination. These separate units were set to sample flow rates of approximately 4 litres per minute (approximately twice the flow rate of the nephelometers that they were co-located with). The increased flow rate means that more air is sampled over the sample period so this increases the chances of detecting 1080. These units were used inside the application zone (site Z-1) and at the boundary of the application zone (site Z-2) (site locations are shown in Figure 3).
Each station was powered by a 180 amp-hour, 12 volt A400 Sonnenschein battery. The batteries were fully charged immediately prior to deployment. Battery voltages were monitored regularly during the monitoring to ensure that they maintained their charge.
Upon completing the assembly of each monitoring station a cellulose filter (pore size 0.8 µm) was removed from its own re-sealable bag and inserted into each filter holder assembly. Each filter had been pre-weighed at the Landcare Research laboratory in Lincoln. Flow calibration was then performed with the filter in place.
To avoid potential contamination of the filters, filter handling was kept to a minimum and new pairs of disposable nitrile gloves were used for the insertion and removal of each filter. Sterile PTFE coated tweezers were used on one occasion to assist with the filter removal. Each filter was stored in its own separate re-sealable bag to eliminate the potential for cross-contamination. The stored bags were labelled after sample collection and kept in a secure location by the field technicians. Chain of custody documentation was completed to document sample integrity from collection through to the receipt of the samples by Landcare Research’s laboratory (refer Appendix A).
11 Particulate matter with an aerodynamic diameter of 10 microns or less
12 Particulate matter with an aerodynamic diameter of 2.5 microns or less
13 The DryCal borrowed from Environment Canterbury Regional Council was 25 months outside its scheduled calibration interval.

Characterising dust drift from aerial application of 1080 July 2016 INSTITUTE OF ENVIRONMENTAL SCIENCE AND RESEARCH LIMITED Page 8
A meteorological station was deployed at 180 metres outside the application zone (site Z-3). The meteorological station consisted of a Gill Met-Pak pro with integrated ultrasonic wind sensor mounted 2.5 metres above the ground immediately above the particle monitor. The meteorological station provided wind speed, wind direction, wind gust (3 second max), air temperature, relative humidity, dew point and barometric pressure. The meteorological station was configured to transmit data in real-time to a secure website to enable monitoring of weather conditions during the 1080 application.
On the morning of the application, a small repair was made to the meteorological station at Z-3 (change-out sim card). This did not result in the loss of any data.
The original programme recommended monitoring for 24 hours prior to the application commencing in order to assess the likely background variation in TSP. Unfortunately, the tight preparation timeframes precluded the collection of a full 24 hours of data prior to 1080 application occurring. The field technicians did manage to assemble and commission all six stations between 10 and 15 hours prior to the application commencing and continued to operate the analysers for an additional 22 to 24 hours after the application concluded.
Upon the conclusion of the aerial operation, visits were made to all sites to confirm the instruments were operating normally. Several 1080 pellets were observed within a 10 metre radius of the monitoring station within the application zone (Site Z-1). Similarly, 1080 pellets were observed within a 10 metre radius around the boundary monitoring site (Z-2), however, these only extended to the east, west and south of the site (ie, not to the north of the site outside the application zone). All instruments had continued to operate normally throughout the aerial operation.
The monitoring equipment was left in place to continue operating normally overnight and the next morning in order to capture any re-suspended particulate (in the nephelometers) or post depositional wind-blown dust (in the deposited dust gauges).14
On the morning of 6 November at 1100 hours the field technicians received a call from a bee keeper. He advised that he had just completed delivery of a number of hives adjacent to site Z-2. The technicians arrived at the site to find approximately 38 hives within a 5 metre radius of the monitoring station. The station was deactivated and the deposition gauge relocated to a site approximately 16 metres south of its previous location.
The technicians then visited and decommissioned each of the particulate monitors in turn (on 6 November), commencing with the site most distant from the application zone (site Z-5, 415 metres outside the application zone) and working backwards to the site located within the application zone (site Z-1).
Precautions were taken to minimise the risk of sample contamination. Field technicians wore Tyvek suits and a new pair of nitrile gloves immediately prior to handling particulate filters. Filters were removed and promptly placed in a sealed and labelled bag. The particulate monitor was then deactivated and the station decommissioned, leaving only the deposited particulate monitor in place.
14 Re-suspended particulate is particulate matter that has deposited and then become re-suspended in the air, for example a particle that has deposited on a road that is then re-suspended by a car driving past. Wind-blown dust is deposited particulate matter that is picked up by the wind.

Characterising dust drift from aerial application of 1080 July 2016 INSTITUTE OF ENVIRONMENTAL SCIENCE AND RESEARCH LIMITED Page 9
On Saturday 7 November, the field technicians returned to retrieve the deposition gauges from each site.
2.4 SECURITY
Due to heightened sensitivities relating to 1080 application, a number of additional precautions were taken to secure the equipment and minimise the risk of tampering. These included:
(i) Securing the instruments and sample filters with security tape and signing across the joins. This occurred immediately prior to the application and was done in such a way that it would not be possible for someone to tamper with the equipment without breaking the seals. The status of the seals were inspected at regular intervals to check for any evidence of tampering. Photo 1 below provides an example of the security tape and seals that were used at each of the monitoring stations.
(ii) Hidden security cameras (XS01) were deployed at two of the sites (Z-1 and Z-3). These cameras used IR motion sensors to capture videos and pictures during both the day and night.
(iii) Field checks on the monitors to check on wind conditions and for any visible signs of tampering throughout the daytime and at dusk.
(iv) Online checks of the monitors overnight and early in the morning (6 am)
No evidence of tampering was evident at any of the sites visited, although images from the cameras indicated that a large truck with beehives entered the area on the morning of 6 November (this was the beekeeper).

Characterising dust drift from aerial application of 1080 July 2016 INSTITUTE OF ENVIRONMENTAL SCIENCE AND RESEARCH LIMITED Page 10
Photo 1 Photograph of the monitoring station at site Z-4 illustrating the security tape on the device with signatures of the field technicians across all joins. The sample filter is situated inside the metal case.
Characterising dust drift from aerial application of 1080 July 2016 INSTITUTE OF ENVIRONMENTAL SCIENCE AND RESEARCH LIMITED Page 11
3. RESULTS
Details of data capture are provided in Appendix B. In total, 14,909 minutes of particulate data were collected from the six monitoring stations over the three day monitoring programme. Four of the samplers achieved 99.9% data capture,15 while the two in-zone particulate samplers achieved a total of 99.99% data capture.16 The meteorological station achieved 100% data capture during the monitoring programme.
Figure 2 shows the aerial application area and all monitoring locations. The monitoring locations are summarised in Table 1 and Figure 3 details those inside and close to the application zone (Z-1 to Z-5).
Figure 4 shows the flight paths on the day of the aerial 1080 application. Aerial swathes were undertaken in close proximity to the monitors at 073017 (boundary application), and between 1308 and 1425 hours. A rotary spinner was employed over all areas except for the small area (in pink) shown in Figure 5 where trickle feed was employed.
A rotary spinner is a small fan-like feeder at the bottom of the bucket that, when turned on, spins horizontally to empty the pellets from the bucket. Trickle feed relies on the gravitational rotation of paddles (like a steamboat) to empty pellets from the bucket. Rotary spinners thus have a perpendicular vector component and fling the pellets further sideways than trickle feed when compared with the forwards motion of the helicopter during aerial application.
Figure 4 and Figure 5 also differentiate the boundary application (orange blocks) undertaken at 0730 from the main 1080 aerial application near the monitoring locations (blue blocks). Additional operational details of the aerial 1080 application are in Table 2.
All monitoring data are held by ESR for future reference by any external party for investigation and/or peer review.
15 Two minutes are lost every 24 hours due to auto-zero calibration cycles timed to occur at midnight
16 1 minute of data lost due to minor communication errors
17 New Zealand daylight savings time

Characterising dust drift from aerial application of 1080 July 2016 INSTITUTE OF ENVIRONMENTAL SCIENCE AND RESEARCH LIMITED Page 12
Figure 2 Location of the Waimea Kawhaka aerial 1080 application area (indicated in black) near Kumara on the West Coast. The site selected was 2.3 kilometres due south of Kumara Junction and approximately 20 minutes south of Greymouth. Air quality monitoring locations in yellow box (Z-1 to Z-5) and U-1.
Table 1 Site Location Summary (Refer Figure 3 for details)
SITE REFERENCE SITE LOCATION
Z-1 400 metres inside the application zone
Z-2 40 metres inside the application zone
Z-3 180 metres outside the application zone
Z-4 330 metres outside the application zone
Z-5 415 metres outside the application zone
U-1 1,000 metres upwind of the application zone
Monitoring
Sites Z-1 to Z-5
(Details Fig 3)

Characterising dust drift from aerial application of 1080 July 2016 INSTITUTE OF ENVIRONMENTAL SCIENCE AND RESEARCH LIMITED Page 13
Figure 3 Air quality monitoring site locations (Z-1 to Z-5) and distance from the aerial
1080 application zone (in black)
Location of Monitoring Sites
What is not evident in Figure 3 is the 10 metre drop in elevation between the first three downwind monitoring sites (Z-1, Z-2 and Z-3) and the last two downwind monitoring sites (Z-4 and Z-5). Coupled with existing vegetation this may have provided a shadow or eddying effect on dispersion of the plume from aerial application on the (slightly) higher plateau.
To address this (small) change in elevation, site Z-4 was located at the same elevation – but not in a direct line with sites Z-1, Z-2 and Z-3. Site Z-5 was located, by necessity, at the lower elevation to achieve the required distance downwind.
Importantly, however, all monitors were located at specified distances downwind of a
1080 aerial application over a relatively large area. As such, whilst the monitors were
not directly downwind of each other, they were directly downwind of the source.

Characterising dust drift from aerial application of 1080 July 2016 INSTITUTE OF ENVIRONMENTAL SCIENCE AND RESEARCH LIMITED Page 14
Figure 4 Flight paths of aerial 1080 distribution over Waimea Kawhaka operation on Thursday 5 November 2015. Arrows show direction, speed, altitude and time of helicopter position in relation to monitoring sites (red dots). [Source: Vector Control Services]

Characterising dust drift from aerial application of 1080 July 2016 INSTITUTE OF ENVIRONMENTAL SCIENCE AND RESEARCH LIMITED Page 15
Table 2 Operational details [Source: Vector Control Services]
PARAMETER DETAILS
Name of application: Waimea Kawhaka
Name of contractor: Vector Control Services
Date of application: 5 November 2015
Location: 10,471 hectares around the townships of Kumara and Dillmanstown
Purpose: Possum control
Bait type: RS5
Concentration 1080: 1.5 g/kg (0.15%)
Size of pellets: 20 mm (12 g)
Moisture content: 12% as measured 3 weeks prior to application
Application rate: 2 kg/ha
Sowing swathe: 230 m
Helicopter altitude: 535 – 596 feet
Airspeed: 59 – 93 miles per hour
Helicopter type: Squirrel
Bucket type: Retractable legless bucket
Application type: Broadcast spinner, 0.5 m diameter, 1070 RPM
Terrain: Mixture mature native forest, regenerating bush and plantation forest on undulating, low (ie, < 500 m) hills.
Canopy height: 1 m (regenerating bush) – 20 m (Pinus radiata)
Vegetation: Variable: Some Pinus radiata but predominantly regenerating bush comprising a variety of species including beech, manuka, rata, rimu, and totara. Lots of gorse in cleared areas – particularly around monitoring locations Z1, Z2 and Z3.
Comments: No dust visible behind the helicopter bucket when flying to or from the loading zone.
No dust visible behind the helicopter bucket when carrying out aerial application with the exception of one turn (around 1025 hrs) to south of loading site. Staff present indicated that could be when the spinner was turned on.
Loading operators state that the dustiness of bag varies from bag to bag.

Characterising dust drift from aerial application of 1080 July 2016 INSTITUTE OF ENVIRONMENTAL SCIENCE AND RESEARCH LIMITED Page 16
Figure 5 Aerial application zones – trickle feeding area in pink, remainder rotary spinner feeding
3.1 METEOROLOGY
Figure 6 and Figure 7 present wind direction and wind speed on the day of aerial application with a wind rose plot in Figure 8.18 These show that during and after the boundary application (0730 hours) a light wind was blowing from the north east; ie, towards the application zone (which included Z-1 and Z-2 monitoring sites) and away from monitoring sites outside the application zone (ie, Z-3, Z-4 and Z-5). However, it should be noted that these winds were extremely light (ie, maximum ‘gust’ 1.25 m/s) and the air was very still.
Around 1000 hours the wind direction changed to a south westerly direction and the wind speed picked up slightly (although it still remained light). These light south westerly winds continued during the afternoon when the 1080 was applied to the areas in the vicinity of the monitoring sites (between 1308 and 1425 hours).
The wind shift means that any particulate generated during the aerial 1080 application in the application zone (excepting the boundary application) would most likely have been transported towards the dust monitors (ie, the monitoring locations were downwind of the aerial 1080 application).
18 It is important to note that wind measurements are recorded near ground level (2.5 metres above ground level). The wind speeds and direction at the altitude the helicopter operates may be different to those recorded on the ground. For a full description refer to Appendix C.

Characterising dust drift from aerial application of 1080 July 2016 INSTITUTE OF ENVIRONMENTAL SCIENCE AND RESEARCH LIMITED Page 17
0
90
180
270
3600
:01
0:3
6
1:1
1
1:4
6
2:2
1
2:5
6
3:3
1
4:0
6
4:4
1
5:1
6
5:5
1
6:2
6
7:0
1
7:3
6
8:1
1
8:4
6
9:2
1
9:5
6
10
:31
11
:06
11
:41
12
:16
12
:51
13
:26
14
:01
14
:36
15
:11
15
:46
16
:21
16
:56
17
:31
18
:06
18
:41
19
:16
19
:51
20
:26
21
:01
21
:36
22
:11
22
:46
23
:21
23
:56
Win
d d
irec
tio
n (D
egT)
Time (NZDT)
Wind direction at the Z-3 monitoring site on 5 November 2015
Figure 6 Wind direction at the Z-3 monitoring site on 5 November 2015 (degrees true). The highlighted sections indicate periods when the helicopter was operating in the area

Characterising dust drift from aerial application of 1080 July 2016 INSTITUTE OF ENVIRONMENTAL SCIENCE AND RESEARCH LIMITED Page 18
0
1
2
3
4
5
6
7
0:01
0:37
1:13
1:49
2:25
3:01
3:37
4:13
4:49
5:25
6:01
6:37
7:13
7:49
8:25
9:01
9:37
10:1
310
:49
11:2
512
:01
12:3
713
:13
13:4
914
:25
15:0
115
:37
16:1
316
:49
17:2
518
:01
18:3
719
:13
19:4
920
:25
21:0
121
:37
22:1
322
:49
23:2
5
Win
dsp
eed
(m/s
)
Time (NZDT)
Wind speed at Z-3 monitoring site on 5 November 2015
WindSpeed(m/s) Wind Gust
Figure 7 Wind speed (m/s) at the Z-3 monitoring site on 5 November 2015. The highlighted sections indicate periods when the helicopter was operating in the
area. Wind speeds are calculated as 1-minute averages and wind gusts are 3-second averages.

Characterising dust drift from aerial application of 1080 July 2016 INSTITUTE OF ENVIRONMENTAL SCIENCE AND RESEARCH LIMITED Page 19
Figure 8 Wind rose displaying the dominant wind speeds and wind directions at site Z-3 on 5 November 2015. This clearly shows that there were two main wind directions during the day. The north-easterly winds which dominated up until around midday and the south westerly winds which were evident between 1200 and 2000 hours.
3.2 TOTAL SUSPENDED PARTICULATE (TSP)
Figure 9 presents total suspended particulate measured at all six monitoring sites throughout the period of field research (afternoon of 4 November through until late morning/early afternoon of 6 November).
What is immediately evident from Figure 9 is the elevated concentrations of TSP occurring at Z-2 on the morning of 6 November between 0730 and 0930 hours. These elevated concentrations correlate with the (unexpected) arrival of a beekeeper who placed nearly 40 hives around the TSP monitor at site Z-2. The vehicle was clearly captured on the security camera as shown in Photo 2.
Another smaller spike of approximately 19 micrograms per cubic metre (µg/m3) at site Z-2 near the beginning of the record correlates with the installation and commissioning of the monitoring station.

Characterising dust drift from aerial application of 1080 July 2016 INSTITUTE OF ENVIRONMENTAL SCIENCE AND RESEARCH LIMITED Page 20
Photo 2 Picture from the security camera showing the beekeeper’s truck leaving and travelling past site Z-3 (06/11/15, 0930 hours) after installing the hives at site Z-2
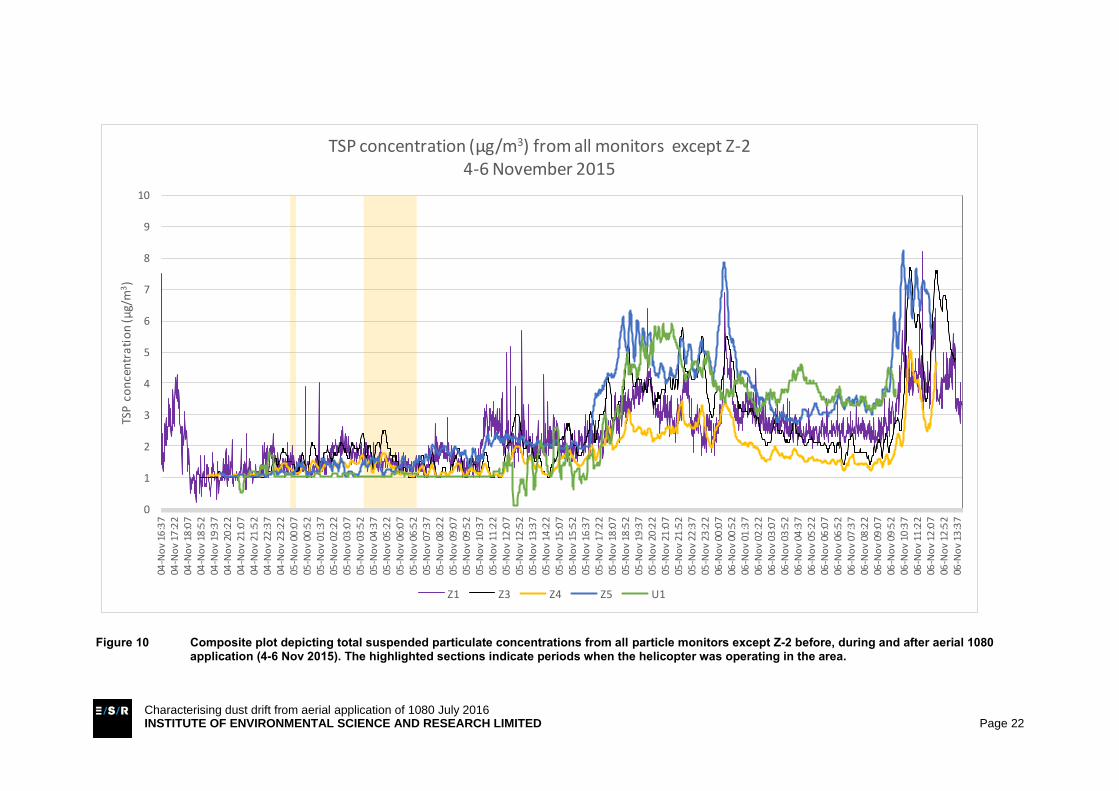
Removing Z-2 from the plot as shown in Figure 10 shows that there was no significant difference between TSP measured at the upwind and downwind sites on the day of aerial 1080 application. This also highlights how clean the air was during the monitoring period with TSP being less than 10 µg/m3 at all sites at all times. This is indicative of clean, rural air.
Figure 11 is a combined plot showing data from all six analysers during the day of the aerial 1080 application on 5 November 2015 (only). There are several points that are evident from this. First, the concentrations are very low (all less than 10 µg/m3) and appear to be indicative of clean, rural air. Most urban areas by comparison typically display concentrations at least one order of magnitude higher than those shown in Figure 11.
Secondly, the actual variation throughout the day is very low. There is a small step change in measured concentrations between 1000 and 1100 hours that correlates with the wind changing direction and picking up speed (refer Figures 6 and 7). There is another small increase around 1800 hours that is most likely due to the increased relative humidity later in the day.
Thirdly, there are no significant particulate peaks at any site evident during or after the 1080 application. This suggests that if suspended particulate is generated from 1080 aerial application then it is only generated in small quantities.
A full review of TSP at each monitoring site follows. Further details of each monitoring site, including a site log, are provided in Appendix C.

[REPORT TITLE IN FOOTER SPACE] July 2016 INSTITUTE OF ENVIRONMENTAL SCIENCE AND RESEARCH LIMITED Page 21
0
10
20
30
40
50
60
70
80
04-N
ov
16:3
704
-No
v 17
:21
04-N
ov
18:0
504
-No
v 18
:49
04-N
ov
19:3
304
-No
v 20
:17
04-N
ov
21:0
104
-No
v 21
:45
04-N
ov
22:2
904
-No
v 23
:13
04-N
ov
23:5
705
-No
v 00
:41
05-N
ov
01:2
505
-No
v 02
:09
05-N
ov
02:5
305
-No
v 03
:37
05-N
ov
04:2
105
-No
v 05
:05
05-N
ov
05:4
905
-No
v 06
:33
05-N
ov
07:1
705
-No
v 08
:01
05-N
ov
08:4
505
-No
v 09
:29
05-N
ov
10:1
305
-No
v 10
:57
05-N
ov
11:4
105
-No
v 12
:25
05-N
ov
13:0
905
-No
v 13
:53
05-N
ov
14:3
705
-No
v 15
:21
05-N
ov
16:0
505
-No
v 16
:49
05-N
ov
17:3
305
-No
v 18
:17
05-N
ov
19:0
105
-No
v 19
:45
05-N
ov
20:2
905
-No
v 21
:13
05-N
ov
21:5
705
-No
v 22
:41
05-N
ov
23:2
506
-No
v 00
:09
06-N
ov
00:5
306
-No
v 01
:37
06-N
ov
02:2
106
-No
v 03
:05
06-N
ov
03:4
906
-No
v 04
:33
06-N
ov
05:1
706
-No
v 06
:01
06-N
ov
06:4
506
-No
v 07
:29
06-N
ov
08:1
306
-No
v 08
:57
06-N
ov
09:4
106
-No
v 10
:25
06-N
ov
11:0
906
-No
v 11
:53
06-N
ov
12:3
706
-No
v 13
:21
TSP
co
nce
ntr
ati
on
(µg/
m3)
TSP concentration (µg/m3) from all monitors 4-6 November 2015
Z1 Z2 Z3 Z4 Z5 U1
Figure 9 Composite plot depicting total suspended particulate concentrations from all particle monitors before, during and after aerial 1080 application (4-6 Nov 2015). The highlighted sections indicate periods when the helicopter was operating in the area.
Characterising dust drift from aerial application of 1080 July 2016 INSTITUTE OF ENVIRONMENTAL SCIENCE AND RESEARCH LIMITED Page 22
0
1
2
3
4
5
6
7
8
9
10
04-N
ov
16:3
704
-No
v 17
:22
04-N
ov
18:0
704
-No
v 18
:52
04-N
ov
19:3
704
-No
v 20
:22
04-N
ov
21:0
704
-No
v 21
:52
04-N
ov
22:3
704
-No
v 23
:22
05-N
ov
00:0
705
-No
v 00
:52
05-N
ov
01:3
705
-No
v 02
:22
05-N
ov
03:0
705
-No
v 03
:52
05-N
ov
04:3
705
-No
v 05
:22
05-N
ov
06:0
705
-No
v 06
:52
05-N
ov
07:3
705
-No
v 08
:22
05-N
ov
09:0
705
-No
v 09
:52
05-N
ov
10:3
705
-No
v 11
:22
05-N
ov
12:0
705
-No
v 12
:52
05-N
ov
13:3
705
-No
v 14
:22
05-N
ov
15:0
705
-No
v 15
:52
05-N
ov
16:3
705
-No
v 17
:22
05-N
ov
18:0
705
-No
v 18
:52
05-N
ov
19:3
705
-No
v 20
:22
05-N
ov
21:0
705
-No
v 21
:52
05-N
ov
22:3
705
-No
v 23
:22
06-N
ov
00:0
706
-No
v 00
:52
06-N
ov
01:3
706
-No
v 02
:22
06-N
ov
03:0
706
-No
v 03
:52
06-N
ov
04:3
706
-No
v 05
:22
06-N
ov
06:0
706
-No
v 06
:52
06-N
ov
07:3
706
-No
v 08
:22
06-N
ov
09:0
706
-No
v 09
:52
06-N
ov
10:3
706
-No
v 11
:22
06-N
ov
12:0
706
-No
v 12
:52
06-N
ov
13:3
7
TSP
co
nce
ntr
ati
on
(µ
g/m
3)
TSP concentration (µg/m3) from all monitors except Z-24-6 November 2015
Z1 Z3 Z4 Z5 U1
Figure 10 Composite plot depicting total suspended particulate concentrations from all particle monitors except Z-2 before, during and after aerial 1080 application (4-6 Nov 2015). The highlighted sections indicate periods when the helicopter was operating in the area.

Characterising dust drift from aerial application of 1080 July 2016 INSTITUTE OF ENVIRONMENTAL SCIENCE AND RESEARCH LIMITED Page 23
0
1
2
3
4
5
6
7
8
9
1000
:01
00:2
800
:55
01:2
201
:49
02:1
602
:43
03:1
003
:37
04:0
404
:31
04:5
805
:25
05:5
206
:19
06:4
607
:13
07:4
008
:07
08:3
409
:01
09:2
809
:55
10:2
210
:49
11:1
611
:43
12:1
012
:37
13:0
413
:31
13:5
814
:25
14:5
215
:19
15:4
616
:13
16:4
017
:07
17:3
418
:01
18:2
818
:55
19:2
219
:49
20:1
620
:43
21:1
021
:37
22:0
422
:31
22:5
823
:25
23:5
2
TSP
co
cnen
tra
tio
n (
µg/
m3)
TSP concentration (µg/m3) from all monitors on day of application (5 Nov 2015)
Z1 Z2 Z3 Z4 Z5 U1
Figure 11 Composite plot depicting total suspended particulate concentrations from all particle monitors on day of aerial 1080 application (5 Nov 2015). The
highlighted sections indicate periods when the helicopter was operating in the area.

Characterising dust drift from aerial application of 1080 July 2016 INSTITUTE OF ENVIRONMENTAL SCIENCE AND RESEARCH LIMITED Page 24
Site Z-1: 400 metres inside the application zone
Site Z-1 is situated next to an old logging access track adjacent to a skid pile in a recently cleared pine forest. The site is exposed to winds from the west, south and east, however there is a large woodpile approximately 3 to 4 metres in height situated approximately 35 metres to the north east. Photo 3 below is a photograph taken at the site.
Figure 12 below shows the suspended particulate concentration detected by the particulate monitor at site Z-1. There are some small particulate spikes evident during the afternoon application at around the time the helicopter was applying 1080 in the area. However the magnitude of these peak is very small (3.5 µg/m3 over background concentrations) and could correspond to either general background dust associated with the helicopter’s passage or alternatively, exhaust emissions from the helicopter during upwind passes.
Photo 3 Photograph of Site Z-1 (04/11/15, 1640 hours)
Figure 12 Plot of the TSP concentration as measured at the Z-1 monitoring station on 5 November 2015. The highlighted sections correspond to helicopter activity in the immediate vicinity of the monitoring site.
0
1
2
3
4
5
6
7
00
:01
00
:44
01
:27
02
:10
02
:53
03
:36
04
:19
05
:02
05
:45
06
:28
07
:11
07
:54
08
:37
09
:20
10
:03
10
:46
11
:29
12
:12
12
:55
13
:38
14
:21
15
:04
15
:47
16
:30
17
:13
17
:56
18
:39
19
:22
20
:05
20
:48
21
:31
22
:14
22
:57
23
:40
TSP
co
nce
ntr
atio
n (
µg/
m3 )
Time (NZDT)
TSP concentration at site Z-1 on 5 November 2015

Characterising dust drift from aerial application of 1080 July 2016 INSTITUTE OF ENVIRONMENTAL SCIENCE AND RESEARCH LIMITED Page 25
There are several other small spikes in the data (1-2 µg/m3 peaks over the background concentration). A review of the security camera footage did not indicate the presence of anything near the monitors at the time the peaks occurred.
Site Z-2: 40 metres inside the application zone
Site Z-2 is also situated next to an old logging access track adjacent to a skid pile in a recently cleared pine forest. The site is exposed to winds from the west and south, however there is a large hillock approximately 10 metres in height situated approximately 20 metres to the northeast. Photo 4 below is a photograph taken at the site.
Figure 13 below reveals the suspended particulate concentration detected by the particulate monitor at site Z-2.
Photo 4 Photograph of Site Z-2 (04/11/15, 1750 hours)
Figure 13 Plot of the TSP concentration as measured at the Z-2 monitoring station on 5 November 2015. The highlighted sections correspond to helicopter activity in the near vicinity (40 m) of the monitoring site.
0
1
2
3
4
5
6
7
00
:01
00
:44
01
:27
02
:10
02
:53
03
:36
04
:19
05
:02
05
:45
06
:28
07
:11
07
:54
08
:37
09
:20
10
:03
10
:46
11
:29
12
:12
12
:55
13
:38
14
:21
15
:04
15
:47
16
:30
17
:13
17
:56
18
:39
19
:22
20
:05
20
:48
21
:31
22
:14
22
:57
23
:40
TSP
co
nce
ntr
atio
n (
µg/
m3 )
Time (NZDT)
TSP concentration at site Z-2 on 5 November 2015

Characterising dust drift from aerial application of 1080 July 2016 INSTITUTE OF ENVIRONMENTAL SCIENCE AND RESEARCH LIMITED Page 26
There are no spikes evident during either the morning application when the helicopter overflew the unit or later in the day when the bulk of the application occurred. The cyclic variation in the early hours of the morning (1.5 µg/m3 cycles) is due to the internal temperature and humidity control on the monitor and may be ignored. The increase in particulate concentration from 1030 until 1130 hours is most likely to be due to the increased wind speed. Both the Z-1 and Z-2 sites were exposed to the south west and any increase in wind speed would be noticed earlier here than at other sites. The three small spikes evident in the data correspond with visits from field technicians inspecting for any evidence of tampering and most likely originated from their vehicle exhaust emissions.
Site Z-3: 180 metres outside the application zone
Site Z-3 is situated on the corner of a logging access track adjacent to a recently cleared pine forest. A north-south running embankment is situated to the west of the site. The embankment is approximately four to five metres high and is 40 metres to the west of the monitor. The land to the north of the site drops down approximately 50 metres to the valley floor. Photo 5 below is a photograph taken at the site.
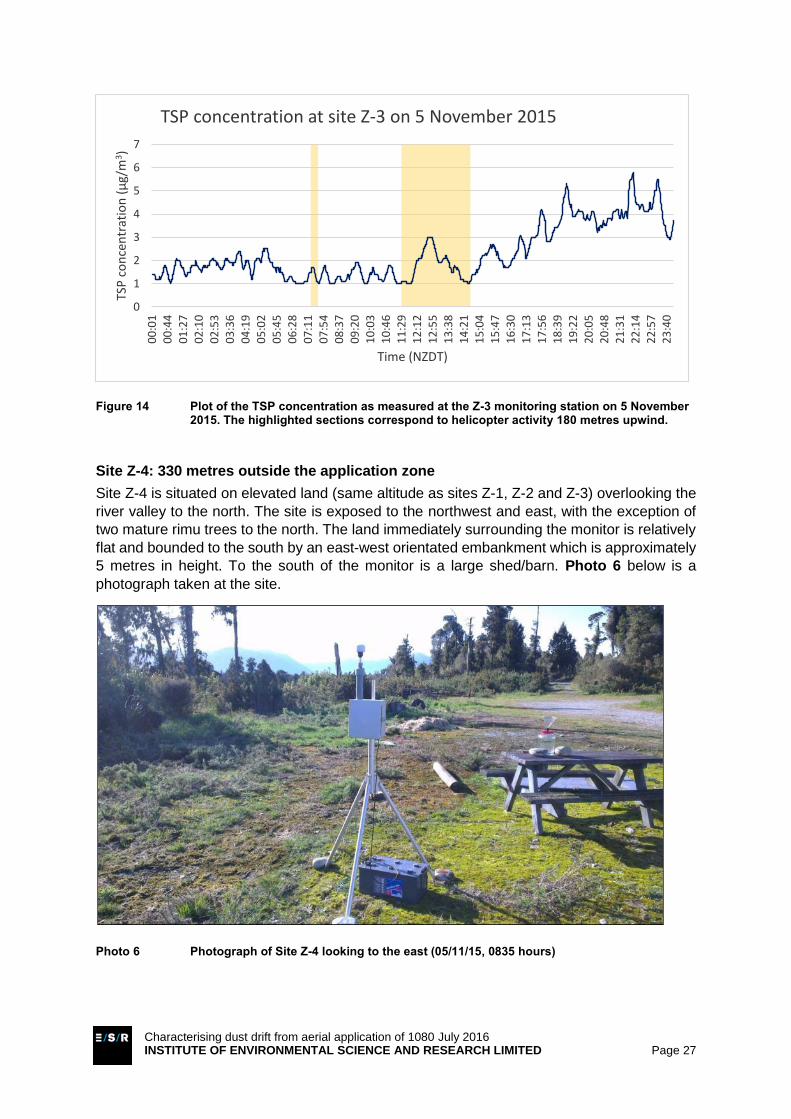
Figure 14 reveals the suspended particulate concentration detected by the particulate monitor at site Z-3. This appears to show only natural fluctuations in suspended particulate concentration in the (clean) air, with all measured concentrations below 10 µg/m3.
There are no spikes evident during the morning application or later in the day when the bulk of the 1080 application occurred. The small increase (from 1 to 3 µg/m3) in particulate concentration around midday is probably due to wind generated dust during this period.
Photo 5 Photograph of Site Z-3 looking to the south (05/11/15, 0750 hours)
Characterising dust drift from aerial application of 1080 July 2016 INSTITUTE OF ENVIRONMENTAL SCIENCE AND RESEARCH LIMITED Page 27
Figure 14 Plot of the TSP concentration as measured at the Z-3 monitoring station on 5 November 2015. The highlighted sections correspond to helicopter activity 180 metres upwind.
Site Z-4: 330 metres outside the application zone
Site Z-4 is situated on elevated land (same altitude as sites Z-1, Z-2 and Z-3) overlooking the
river valley to the north. The site is exposed to the northwest and east, with the exception of
two mature rimu trees to the north. The land immediately surrounding the monitor is relatively
flat and bounded to the south by an east-west orientated embankment which is approximately
5 metres in height. To the south of the monitor is a large shed/barn. Photo 6 below is a
photograph taken at the site.
Photo 6 Photograph of Site Z-4 looking to the east (05/11/15, 0835 hours)
0
1
2
3
4
5
6
70
0:0
10
0:4
40
1:2
70
2:1
00
2:5
30
3:3
60
4:1
90
5:0
20
5:4
50
6:2
80
7:1
10
7:5
40
8:3
70
9:2
01
0:0
31
0:4
61
1:2
91
2:1
21
2:5
51
3:3
81
4:2
11
5:0
41
5:4
71
6:3
01
7:1
31
7:5
61
8:3
91
9:2
22
0:0
52
0:4
82
1:3
12
2:1
42
2:5
72
3:4
0
TSP
co
nce
ntr
atio
n (
µg/
m3)
Time (NZDT)
TSP concentration at site Z-3 on 5 November 2015

Characterising dust drift from aerial application of 1080 July 2016 INSTITUTE OF ENVIRONMENTAL SCIENCE AND RESEARCH LIMITED Page 28
Figure 15 below reveals the suspended particulate concentration detected by the particulate
monitor at site Z-4. There are no spikes evident during either the morning application when
the helicopter overflew the unit or later in the day when the bulk of the application occurred.
The increase in particulate concentration from 1100 until 1200 hours corresponds with the
increase in wind speed during this period which would have generated some dust as the
wind picked up.
Figure 15 Plot of the TSP concentration as measured at the Z-4 monitoring station on 5 November 2015. The highlighted sections correspond to helicopter activity 330 metres upwind.
Site Z-5: 415 metres outside the application zone
Site Z-5 is situated on open flat farmland situated in a river valley and exposed to the east,
north and west. To the south, approximately 80 metres from the monitor is a stand of native
vegetation. Beyond the vegetation approximately 200 metres from the monitor, the land rises
50 metres to a plateau. Photo 7 is a photograph taken at the site.
Figure 16 reveals the suspended particulate concentration detected by the particulate monitor
at site Z-5.
There are no spikes evident during either the morning application when the helicopter overflew the unit or later in the day when the bulk of the application occurred. There is a small increase (2 µg/m3) in the suspended particulate concentration around 1700 hours in the evening. As this site is situated at a lower elevation than other sites, it is possible that a localised wind shift may have occurred at this site around that time. Field technicians visited the site approximately 1 hour later and noted a westerly wind, rather than a south westerly wind as at the other sites (Z-1 to Z-4).
0
1
2
3
4
5
6
7
00
:01
00
:44
01
:27
02
:10
02
:53
03
:36
04
:19
05
:02
05
:45
06
:28
07
:11
07
:54
08
:37
09
:20
10
:03
10
:46
11
:29
12
:12
12
:55
13
:38
14
:21
15
:04
15
:47
16
:30
17
:13
17
:56
18
:39
19
:22
20
:05
20
:48
21
:31
22
:14
22
:57
23
:40
TSP
co
nce
ntr
atio
n (
µg/
m3 )
Time (NZDT)
TSP concentration at site Z-4 on 5 November 2015

Characterising dust drift from aerial application of 1080 July 2016 INSTITUTE OF ENVIRONMENTAL SCIENCE AND RESEARCH LIMITED Page 29
Photo 7 Photograph of Site Z-5 looking to the northwest (05/11/15, 0846 hours)
Figure 16 Plot of the TSP concentration as measured at the Z-5 monitoring station on 5 November 2015. The highlighted sections correspond to helicopter activity 415 metres upwind.
0
1
2
3
4
5
6
7
00
:01
00
:44
01
:27
02
:10
02
:53
03
:36
04
:19
05
:02
05
:45
06
:28
07
:11
07
:54
08
:37
09
:20
10
:03
10
:46
11
:29
12
:12
12
:55
13
:38
14
:21
15
:04
15
:47
16
:30
17
:13
17
:56
18
:39
19
:22
20
:05
20
:48
21
:31
22
:14
22
:57
23
:40
TSP
co
nce
ntr
atio
n (
µg/
m3 )
Time (NZDT)
TSP concentration at site Z-5 on 5 November 2015

Characterising dust drift from aerial application of 1080 July 2016 INSTITUTE OF ENVIRONMENTAL SCIENCE AND RESEARCH LIMITED Page 30
Site U-1: 1,000 metres outside the application zone
Site U-1 was situated in open flat farmland situated in an east-west orientated river valley. The
monitor is immediately north of a calf shed in an open paddock. Approximately 80 metres to
the south the land drops down to an unsealed road and a river valley while approximately
600 metres to the north the land begins to rise to a ridge.
Figure 17 below reveals the particulate concentration detected by the particulate monitor at
site U-1.
Figure 17 Plot of the TSP concentration as measured at the U-1 monitoring station on 5 November 2015. The highlighted sections correspond to helicopter activity in the wider area (1,000 metres away).
The lack of variability in the early section of the record (from installation until 1130 hours) is unusual. The field technicians noted both immediately following the installation and during subsequent visits that the TSP concentration being measured by the instrument did vary. An analysis of the instrument diagnostics and post deployment calibration data did not provide any technical justification for excluding the data and the data has been left in the report for this reason. In any event, by midday when the substantive part of the aerial operation occurred, the instrumental variability was similar to that of the other instruments and the findings mirror those of the instruments. Namely that there were no spikes evident during either the morning application or later in the day when the bulk of the application occurred.
The field technicians also noted that the wind speed and direction at the upwind site was very similar to that experienced at the other sites (sites Z-1 to Z-5).
3.3 1080 IN TSP
Seven TSP filters were analysed for 1080. These comprised fives samples from monitoring sites Z-1 to Z-5, a spike and blank. Laboratory results are provided in Appendix D.
The spiked sample was collected by taking a blank filter and passing it to one of the loading crew at the loading area during the aerial application. The operator then wiped the blank filter inside one of the empty 1080 pellet bags. The contaminated filter was then placed inside its re-sealable bag and stored securely before being transported to the laboratory for
0
1
2
3
4
5
6
7
00
:01
00
:44
01
:27
02
:10
02
:53
03
:36
04
:19
05
:02
05
:45
06
:28
07
:11
07
:54
08
:37
09
:20
10
:03
10
:46
11
:29
12
:12
12
:55
13
:38
14
:21
15
:04
15
:47
16
:30
17
:13
17
:56
18
:39
19
:22
20
:05
20
:48
21
:31
22
:14
22
:57
23
:40
TSP
co
nce
ntr
atio
n (
µg/
m3 )
Time (NZDT)
TSP concentration at site U-1 on 5 November 2015

Characterising dust drift from aerial application of 1080 July 2016 INSTITUTE OF ENVIRONMENTAL SCIENCE AND RESEARCH LIMITED Page 31
1080 analysis. The purpose of the spike sample was to confirm that the laboratory tests were capable of detecting 1080 on the filter samples.
A blank filter was also sent to the laboratory for analysis. This filter was kept and stored in the same manner as the other filters, but was not used to sample any air. The blank filter served two purposes:
(i) To confirm that the batch of filters had not been contaminated in any way; and
(ii) To confirm that the filter handling procedures adopted by the field technicians were not inadvertently resulting in sample contamination.
Table 3 presents the results of the filter analysis for 1080.
Table 3 Filter analysis from the total suspended particulate samplers
SAMPLE START TIME END TIME MINUTES SAMPLED
FLOW RATE
(L/min)
VOLUME SAMPLED
(Lstandard/min)*
1080 DETECTED
(µg)
1080 CONCENTRATION
(µg/m3)
Z-1 4/11 16:36 6/11 14:04 2730 4.37 11,930 <0.005 <0.0004
Z-2 4/11 17:41 6/11 11:17 2496 4.01 10,008 <0.005 <0.0005
Z-3 4/11 18:50 6/11 13:38 2568 2.0 5136 0.025 0.0048
Z-4 4/11 19:50 6/11 12:37 2447 2.0 4894 <0.005 <0.001
Z-5 4/11 19:55 6/1112:12 2417 2.0 4834 <0.005 <0.001
Z-6 Spike - 0 0 0 7.24 N/A
Z-7 Blank - 0 0 0 <0.005 N/A
* ie, volumetric flow rate corrected to 0°Celsius and 101.3 kPa
The positive test result for the spiked sample confirms that the laboratory tests were capable of detecting 1080 particulate. The no detect result from the blank filter confirms that the filters were not contaminated and that the precautions adopted by the field technicians should be successful in preventing inadvertent sample contamination.
Table 3 shows one positive result was detected, albeit at low levels, at site Z-3 (only) which is located 180 metres outside the application zone. This is discussed further in section 4.
3.4 1080 IN DEPOSITED PARTICULATE
Table 4 presents the results of 1080 analysis from deposited particulate gauges located at Z-1 to Z-5. The results of the analysis can be found in Appendix D.
Table 4 Filter analysis from the deposited particulate gauges
SITE START TIME END TIME SAMPLING TIME (min)
1080 DETECTED (µg)
Z1 4/11 16:36 7/11 12:13 4059 <0.0001
Z2 4/11 17:41 7/11 12:04 3983 <0.0001
Z3 4/11 18:50 7/11 11:51 3901 <0.0001
Z4 4/11 19:50 7/11 11:40 3830 <0.0001
Z5 4/11 19:55 7/11 11:25 3810 <0.0001

Characterising dust drift from aerial application of 1080 July 2016 INSTITUTE OF ENVIRONMENTAL SCIENCE AND RESEARCH LIMITED Page 32
Table 4 shows that no 1080 was detected in any of the gauges, including those situated
within the application zone. This suggests that the amount of deposited particulate
generated from the aerial application of 1080 is relatively low. However, the limitations of the
method must also be borne in mind. If only small quantities of dust were generated, as
suggested by the particulate filter sample results, then any 1080 entering into the gauge may
have been diluted below the minimum detection limit of the analytical technique.
3.5 OPERATIONAL REVIEW
A total of 40 reports on aerial applications of 1080 over 758,972 hectares that were carried out in 2014 were reviewed to establish the representativeness, or otherwise, of the Waimea Kawhaka aerial application being studied. The applications were commissioned by Department of Conservation (24), TBFree (14) and OSPRI (2).
The review indicates that 1080 is typically aerially applied at either 1.0 or 2.0 kilograms per hectare with lesser application rates (eg, 0.3 - 0.75 kg/ha) being rare.19 The most commonly used helicopters are the Squirrel AS350, Hughes 500 D, E or NT and Iriquois.20 These in turn dictated the size of bucket employed (minimum 200 kg R44 up to 1,200 kg Iriquois). Most aerial applications employ broadcast spinners with trickle feed employed only in small, sensitive areas.
Table 5 summarises the finding of the operational review against key parameters of the Waimea Kawhaka study. This shows that the Waimea Kawhaka operation was representative of a normal, maximum dose (ie, 2.0 kg/ha) operation.
19 Lesser application rates only used in alpine terrain 20 Fixed wing aircraft were employed on only one reviewed application (Muzzle aerial application in Kaikoura Ranges)
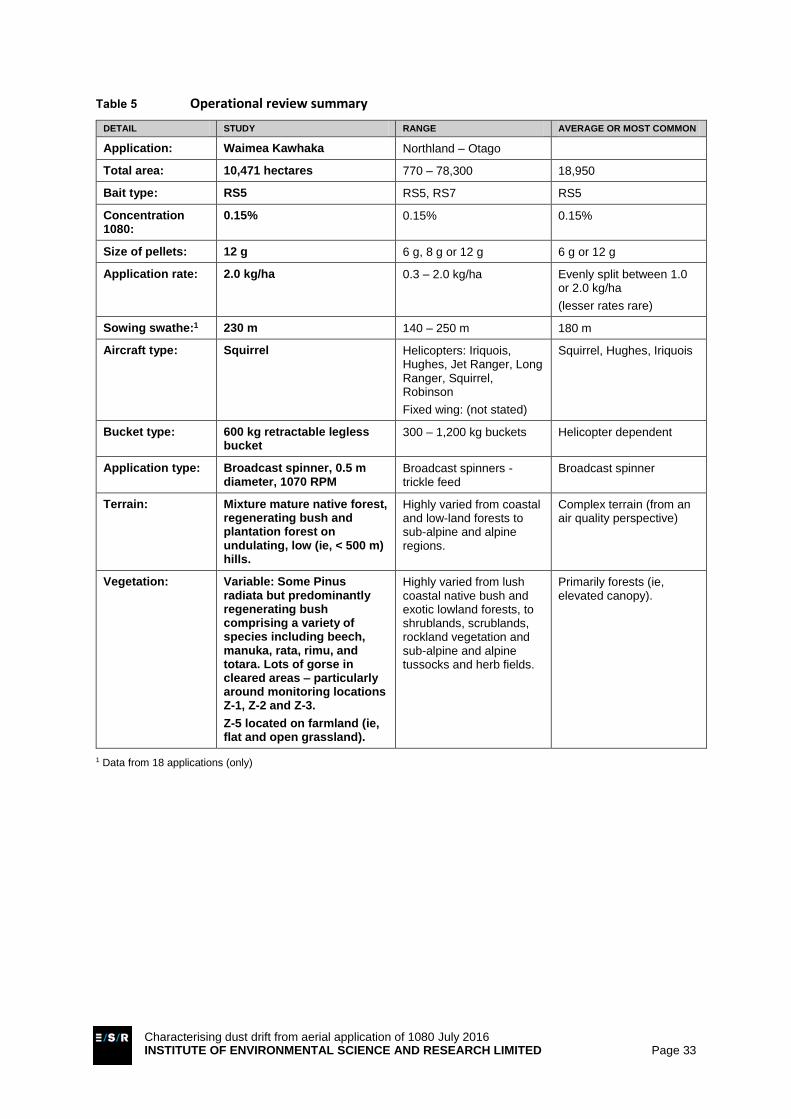
Characterising dust drift from aerial application of 1080 July 2016 INSTITUTE OF ENVIRONMENTAL SCIENCE AND RESEARCH LIMITED Page 33
Table 5 Operational review summary
DETAIL STUDY RANGE AVERAGE OR MOST COMMON
Application: Waimea Kawhaka Northland – Otago
Total area: 10,471 hectares 770 – 78,300 18,950
Bait type: RS5 RS5, RS7 RS5
Concentration 1080:
0.15% 0.15% 0.15%
Size of pellets: 12 g 6 g, 8 g or 12 g 6 g or 12 g
Application rate: 2.0 kg/ha 0.3 – 2.0 kg/ha Evenly split between 1.0 or 2.0 kg/ha
(lesser rates rare)
Sowing swathe:1 230 m 140 – 250 m 180 m
Aircraft type: Squirrel Helicopters: Iriquois, Hughes, Jet Ranger, Long Ranger, Squirrel, Robinson
Fixed wing: (not stated)
Squirrel, Hughes, Iriquois
Bucket type: 600 kg retractable legless bucket
300 – 1,200 kg buckets Helicopter dependent
Application type: Broadcast spinner, 0.5 m diameter, 1070 RPM
Broadcast spinners - trickle feed
Broadcast spinner
Terrain: Mixture mature native forest, regenerating bush and plantation forest on undulating, low (ie, < 500 m) hills.
Highly varied from coastal and low-land forests to sub-alpine and alpine regions.
Complex terrain (from an air quality perspective)
Vegetation: Variable: Some Pinus radiata but predominantly regenerating bush comprising a variety of species including beech, manuka, rata, rimu, and totara. Lots of gorse in cleared areas – particularly around monitoring locations Z-1, Z-2 and Z-3.
Z-5 located on farmland (ie, flat and open grassland).
Highly varied from lush coastal native bush and exotic lowland forests, to shrublands, scrublands, rockland vegetation and sub-alpine and alpine tussocks and herb fields.
Primarily forests (ie, elevated canopy).
1 Data from 18 applications (only)

Characterising dust drift from aerial application of 1080 July 2016 INSTITUTE OF ENVIRONMENTAL SCIENCE AND RESEARCH LIMITED Page 34
[Intentionally Blank]
Characterising dust drift from aerial application of 1080 July 2016 INSTITUTE OF ENVIRONMENTAL SCIENCE AND RESEARCH LIMITED Page 35
4. DISCUSSION
Overall, data capture was excellent. There were no identified security issues and no signs of any tampering with the equipment.
The unexpected arrival of a bee-keeper unloading nearly 40 hives early on the morning of Friday 6 November (the day after the 1080 aerial application) did impact the measured levels of total suspended particulate at site Z-2 just inside the 1080 application area. While unexpected, the delivery of the hives and the consequent increase in TSP concentration detected does not appear to have impacted on the research outcomes.
The peak TSP concentrations measured during the bee-keeper’s visit (50-70 micrograms per cubic metre, µg/m3) are indicative of normal levels in urban environments. These elevated levels highlight how clean the air was during the remainder of the monitoring period.
Meteorology
Wind speed and direction were measured at a height of 2.5 metres above ground level. Wind speed typically increases with height above ground level and the actual wind speed at the operating altitude of the helicopter could be twice as high as that measured. This would increase the dispersion of any particulate emissions.
There were cool temperatures (around 15°C) and moderate insolation at the time of aerial application in the vicinity of the sites (around 1 pm) indicating slight to moderately unstable conditions. Fortunately, the wind direction remained consistently southwest so that the monitoring locations were downwind of the aerial 1080 application.
1080 detection in TSP at site Z-3, 180 metres outside application zone
The detection of 1080 in TSP measured at site Z-3 outside the application zone is interesting because 1080 was not detected in TSP measured at other monitoring sites in the vicinity of the aerial application. There are a number of possible explanations for 1080 being detected in TSP at site Z-3 only.
Sample contamination?
The first, and most obvious, possibility is sample contamination. This possible explanation cannot be dismissed completely. However, we note that the only time the filter heads were opened was during commissioning (when 1080 was not yet present) and decommissioning (when the filters were removed and immediately bagged for transport to the laboratory). Each bag was opened only twice (commissioning and decommissioning), using single-use gloves, and the sites were decommissioned in reverse order (ie, farthest away to inside the application zone).
Further, it is difficult to conceive of any physical mechanism whereby 1080 material could be reduced to the size of suspended particulate (ie, <30 µm in diameter) during transport between the sites by the field technicians (say for example, during site security checks). Suspended particulate can be generated by tyres grinding loose material, but this typically requires heavy trucks, large amounts of material, repeated crushing and significant weathering to dry the particulate (ie, long periods of time) – none of which occurred during this study.
It is also unlikely that the beekeeper introduced 1080 contamination in TSP measured at site Z-3 because he unloaded his hives at site Z-2. Our security footage reveals that he did stop
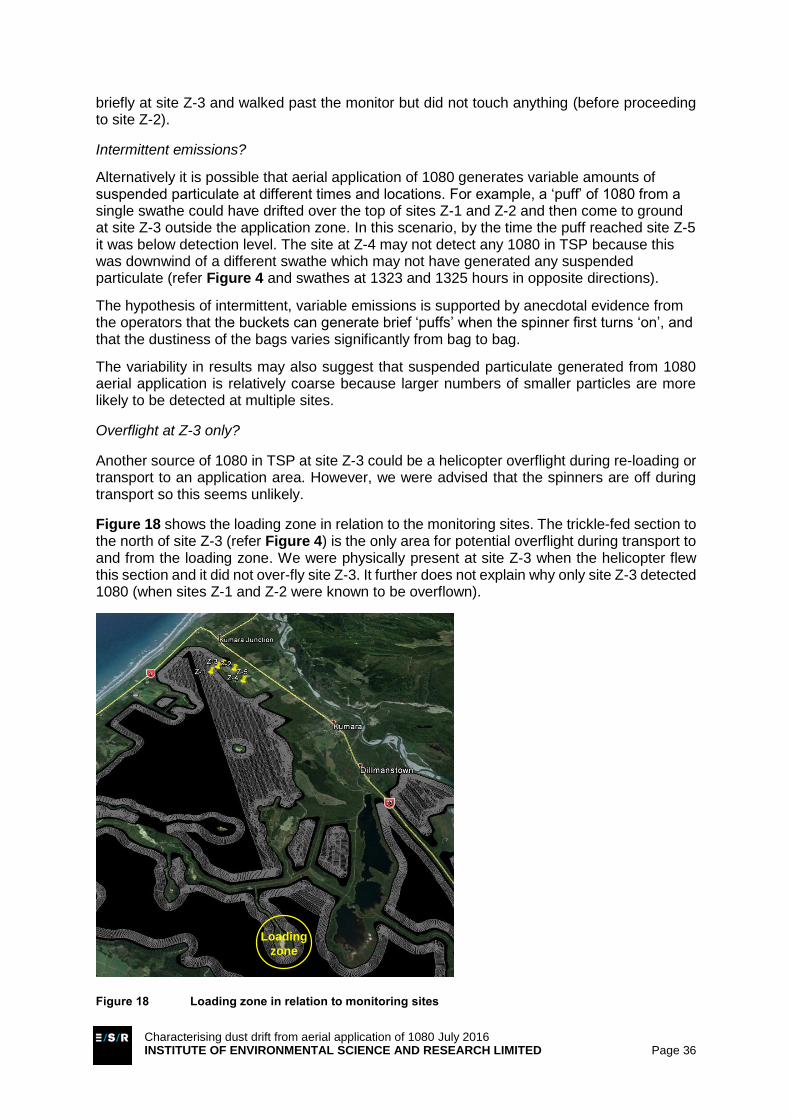
Characterising dust drift from aerial application of 1080 July 2016 INSTITUTE OF ENVIRONMENTAL SCIENCE AND RESEARCH LIMITED Page 36
briefly at site Z-3 and walked past the monitor but did not touch anything (before proceeding to site Z-2).
Intermittent emissions?
Alternatively it is possible that aerial application of 1080 generates variable amounts of suspended particulate at different times and locations. For example, a ‘puff’ of 1080 from a single swathe could have drifted over the top of sites Z-1 and Z-2 and then come to ground at site Z-3 outside the application zone. In this scenario, by the time the puff reached site Z-5 it was below detection level. The site at Z-4 may not detect any 1080 in TSP because this was downwind of a different swathe which may not have generated any suspended particulate (refer Figure 4 and swathes at 1323 and 1325 hours in opposite directions).
The hypothesis of intermittent, variable emissions is supported by anecdotal evidence from the operators that the buckets can generate brief ‘puffs’ when the spinner first turns ‘on’, and that the dustiness of the bags varies significantly from bag to bag.
The variability in results may also suggest that suspended particulate generated from 1080 aerial application is relatively coarse because larger numbers of smaller particles are more likely to be detected at multiple sites.
Overflight at Z-3 only?
Another source of 1080 in TSP at site Z-3 could be a helicopter overflight during re-loading or transport to an application area. However, we were advised that the spinners are off during transport so this seems unlikely.
Figure 18 shows the loading zone in relation to the monitoring sites. The trickle-fed section to the north of site Z-3 (refer Figure 4) is the only area for potential overflight during transport to and from the loading zone. We were physically present at site Z-3 when the helicopter flew this section and it did not over-fly site Z-3. It further does not explain why only site Z-3 detected 1080 (when sites Z-1 and Z-2 were known to be overflown).
Figure 18 Loading zone in relation to monitoring sites
Loading
zone

Characterising dust drift from aerial application of 1080 July 2016 INSTITUTE OF ENVIRONMENTAL SCIENCE AND RESEARCH LIMITED Page 37
Background contamination?
The possibility of a previous application of 1080 affecting site Z-3 was considered. However, the area on which the drop was carried out was private land and had waited for several years for a drop to take place. The decomposition rate of 1080 in soil is sufficient that previous drops are very unlikely to be a potential source of contamination in suspended particulate.
It further seems unlikely that previous drops could have affected site Z-3 and not others.
Laboratory analysis?
There is a possibility that the result for site Z-3 was a false positive from the laboratory. However, this is not supported by the blank filter showing a null result.
Alternatively, there is a possibility of false negative results at Z-1 and Z-2, ie, 1080 should have been detected (but was not) at the sites located 400 metres and 40 metres inside the application zone. However, this is contrary to the positive test result for the spiked sample which confirmed that the laboratory tests were capable of detecting 1080 particulate.
Beekeeper activity?
The beekeeper unloaded his hives at site Z-2 (on the boundary of the drop), not site Z-3 where 1080 was detected.
Implications of 1080 detection in TSP outside application zone
Assessment of the wider implications of detecting 1080 in suspended particulate outside the application zone (ie, potential public exposure and risk assessment) is outside the ambit of this scoping study as they require additional research (eg, additional monitoring and atmospheric dispersion modelling). However, it is important to note that the amount of 1080 detected is extremely low (<0.025 micrograms in more than five cubic metres of air sampled).
It is also important to note that the total suspended particulate concentration also remained extremely low (less than 10 µg/m3).21 This suggests that if suspended particulate (containing 1080 or otherwise) is generated during aerial application then it is only generated in very small amounts.
21 Except site Z-2 during the bee-keeper visit

Characterising dust drift from aerial application of 1080 July 2016 INSTITUTE OF ENVIRONMENTAL SCIENCE AND RESEARCH LIMITED Page 38
5. CONCLUSIONS
The purpose of this investigation was to detect and characterise dust drift, and 1080, downwind of an aerial 1080 application programme.
Monitoring of 1080 in total suspended particulate (TSP), deposited dust and monitoring of meteorology was undertaken before, during and after an aerial 1080 application near Kumara on the West Coast. During and after the application the wind was light and directed from the application zone towards the monitors (located within, at the boundary and at 180 metres, 330 metres and 415 metres outside the application zone). Background monitoring of TSP at a site 1,000 metres outside (upwind) of the application zone was also employed for comparative purposes.
The monitoring did not reveal any significant temporal variation in TSP downwind of the 1080 aerial application. Maximum short-term levels of TSP during and after the application were all less than 10 micrograms per cubic metre (µg/m3) as a 1-minute average at sites inside and outside the application zone. These levels were directly comparable with maximum short-term TSP levels measured at the upwind site. The results suggest that if suspended particulate is generated from 1080 aerial application then it is only generated in small quantities.
1080 was not detected in TSP at monitoring sites inside the application zone, at the boundary of the application zone or at monitoring sites located 330 metres and 415 metres outside the application zone. However, 1080 was detected at the site located 180 metres outside the application zone. This singular positive result could have arisen from:
Sample contamination
Intermittent or variable suspended particulate from aerial application upwind of site Z-3 (only) and subsequent drift.
Other possibilities (eg, overflight of this site only, background contamination, false positive or false negative results) were not considered likely.
We do not consider there is sufficient certainty to draw any firm conclusions about the source.
The amount of measured 1080 was extremely small (<0.025 micrograms in more than five cubic metres of air sampled). The fact that only one of the five deployed monitors managed to detect 1080 above the analytical detection limit (0.005 micrograms) suggests that emissions of 1080 may be intermittent and variable.
1080 was not detected in any of the deposited particulate gauges, however, the limitations of the monitoring method need to be borne in mind. (1080 is highly soluble and degrades within 1-8 days whereas the monitors contained demineralised water and were left in situ for 2 days after the application to try to capture re-entrained dust).
5.1 KEY LEARNINGS FROM THIS RESEARCH
1. The security cameras were very helpful and we recommend their use for future
studies. However, for best use they need to be within 10 metres of the monitoring site. An ideal air quality monitoring station (ie, open arc, no buildings, structures or obstructions to air flow) typically would not have anything on which to install the camera. This is where having a non-ideal site can be favourable to overall outcomes.

Characterising dust drift from aerial application of 1080 July 2016 INSTITUTE OF ENVIRONMENTAL SCIENCE AND RESEARCH LIMITED Page 39
2. No amount of planning can cover unexpected events (eg, beekeeper unloading hives). The use of warning signs on the monitoring equipment, with name and contact number, can assist.
3. Demineralised water is not as protective as distilled water in minimising potential microbial degradation of 1080 in solution. Future studies should use distilled water in the deposited particulate gauges or employ alternative measurement techniques.
4. Site selection is critical. A key reason this study was successful was because the local contractor:
read our proposal and knew what we wanted to do
knew the terrain and meteorology well
had good relationships with local land owners
facilitated excellent monitoring locations.
In the absence of such local knowledge, future studies would need significantly more time to reconnoitre and select monitoring locations prior to the research being undertaken.
5.2 LIMITATIONS AND RECOMMENDATIONS FOR FUTURE STUDIES
It should be noted that this was a scoping study and the findings are not conclusive. There are many parameters that potentially affect dust generation from aerial application of 1080 and these parameters change in practice with each application.
For example, the generation of suspended particulate and any associated 1080 emissions from 1080 aerial application may be significantly different in applications where:
Larger helicopters (with larger/faster blades and/or larger buckets) are used
Lower flying altitudes are employed
Smaller (ie, 6 gram) baits are employed.
We recommend repeating the field research in other geographical locations and when other application methods are used.
Nephelometers are excellent for measuring temporal variations in TSP which was a key feature of this investigation. However, nephelometers are an optical particulate measurement technique, which has limited accuracy compared with reference gravimetric methods. Gravimetric monitoring requires mains power which was not feasible or diesel generators which could swamp any signature from aerial application.22 Future research could attempt to co-locate gravimetric and optical methods to improve accuracy.
External peer review has also identified the following recommendations that we support for future research:
Including a laboratory spike (ie, spiking a known amount of 1080 onto a filter and then running the filter inside the monitor at the laboratory to assess percent recovery in a controlled setting)
22 It being difficult to place a generator downwind as the wind can change direction (as it did on the day of the
aerial application in this study).

Characterising dust drift from aerial application of 1080 July 2016 INSTITUTE OF ENVIRONMENTAL SCIENCE AND RESEARCH LIMITED Page 40
Including a measured field spike (ie, spiking a known amount of 1080 onto a filter and then running the filter inside the monitor in the field to assess any degradation caused by field conditions)
Including a trip spike (ie, spiking a known amount of 1080 onto the filter and then taking it to the field to be stored and transported just as field samples – but with no air drawn through it). It is then returned to the laboratory for analysis to investigate if something in the storage and transportation of the filters is leading to degradation of the pesticide on the filter.

Characterising dust drift from aerial application of 1080 July 2016 INSTITUTE OF ENVIRONMENTAL SCIENCE AND RESEARCH LIMITED Page 41
APPENDIX A: CHAIN OF CUSTODY

Characterising dust drift from aerial application of 1080 July 2016 INSTITUTE OF ENVIRONMENTAL SCIENCE AND RESEARCH LIMITED Page 42

Characterising dust drift from aerial application of 1080 July 2016 INSTITUTE OF ENVIRONMENTAL SCIENCE AND RESEARCH LIMITED Page 43

Characterising dust drift from aerial application of 1080 July 2016 INSTITUTE OF ENVIRONMENTAL SCIENCE AND RESEARCH LIMITED Page 44
APPENDIX B: DATA CAPTURE

Characterising dust drift from aerial application of 1080 July 2016 INSTITUTE OF ENVIRONMENTAL SCIENCE AND RESEARCH LIMITED Page 45
Data Capture
Site Measurement Data capture target
% Valid Data
1 Min Minutes captured
Missing minutes
Application Zone (Z1) TSP (µg/m3) 95% 99.9 2723 1
Boundary (Z2) TSP (µg/m3) 95% 99.9 2490 1
180m Outside (Z3) TSP (µg/m3) 95% 99.9 2564 4
330m Outside (Z4) TSP (µg/m3) 95% 99.9 2482 4
415m Outside (Z5) TSP (µg/m3) 95% 99.9 2417 4
1,000m Outside (U1) TSP (µg/m3) 95% 99.9 2234 4
Meteorological station (Z3) Wind, Temp & RH
100% 100% 2574 0
Summary statistics
1 minute TSP (µg/m3)
Min Max Avg
Application Zone 0.2 8.2 2.3
Boundary 0.9 72.4 2.9
180m outside boundary 1.0 7.8 2.5
330m outside boundary 1.0 5.1 1.7
415m outside boundary 1.0 8.3 2.9
1000m outside (upwind of) boundary 0.1 5.9 2.4
Data capture
Data capture rates for the duration of the monitoring programme were excellent.
Data Provided:
Location File Name Status
Application Zine (Z1) Boundary (Z2) 180m from boundary (Z3) 330m from boundary (Z4) 415m from boundary (Z5) 1000m upwind from boundary Meteorological data
Z1.xlsx Z2.xlsx Z3.xlsx Z4.xlsx Z5.xlsx U1.xlsx Met.xlsx
Reviewed Reviewed Reviewed Reviewed Reviewed Reviewed Reviewed
Instrument and Raw Data (Summary)
Daily checks (04 November – 6 November)
Adjustments to Raw Data (Summary)
Calibration data removed, invalid data removed
Other Recommendations
Nil

Characterising dust drift from aerial application of 1080 July 2016 INSTITUTE OF ENVIRONMENTAL SCIENCE AND RESEARCH LIMITED Page 46
APPENDIX C: MONITORING SITE DETAILS

Characterising dust drift from aerial application of 1080 July 2016 INSTITUTE OF ENVIRONMENTAL SCIENCE AND RESEARCH LIMITED Page 47
LOCATION: Site Z-1 400 metres inside the application zone
GPS LOCATION: 1446533E 5281149N
SITE DESCRIPTION: Situated on an old logging access track adjacent to a skid pile in recently cleared pine forest. Large woodpile situated to the NE approximately 3 to 4 metres in height ranging from 10 to 30 metres from the monitor. Surrounding vegetation consists primarily of gorse (95%) with some regenerating bush consisting of beech and Manuka.
STATION PRIMARY EQUIPMENT:
- 1 ES642 Nephelometer fitted with TSP sampling head
- 1 filter sampler fitted with TSP sampling head
- 1 Deposited particulate monitor
- 1 motion activated surveillance camera with IR sensor for night monitoring
STATION LOG:
4/11/2015 16:36 Commissioned site
4/11/2015 23:15 Checked site online
5/11/2015 06:10 Checked site online
5/11/2015 08:14 Inspected equipment confirmed normal operation
5/11/2015 14:15 Inspected equipment confirmed normal operation, got chased out by helicopter
5/11/2015 16:09 Site secure, equipment working normally
5/11/2015 19:05 Site secure equipment working normally, 1080 pellet observed within 10m of monitor. Fresh motorbike tracks on access road.
5/11/2015 21:30 Checked site online
6/11/2015 14:02 Site secure, decommissioned particle monitor
7/11/2015 12:13 Site secure, removed deposition gauge and retrieved security camera.

Characterising dust drift from aerial application of 1080 July 2016 INSTITUTE OF ENVIRONMENTAL SCIENCE AND RESEARCH LIMITED Page 48
LOCATION: Site Z-2 40 metres inside the application zone (zone boundary)
SITE DESCRIPTION: Situated on an old logging access track adjacent to a skid pile in recently cleared pine forest. Large hillock situated to the NE approximately 10 metres in height approximately 20 metres from the monitor. Surrounding vegetation consists primarily of gorse (90%) with some regenerating bush consisting of beech (5%) and Manuka (5%).
GPS LOCATION: 1446726E 5281444N
STATION PRIMARY EQUIPMENT:
- 1 ES642 Nephelometer fitted with TSP sampling head
- 1 filter sampler fitted with TSP sampling head
- 1 Deposited particulate monitor
STATION LOG:
4/11/2015 17:41 commissioned site
4/11/2015 23:15 Checked site online
5/11/2015 06:10 Checked site online
5/11/2015 08:00 Site secure, equipment working normally
5/11/2015 15:54 Site secure, equipment working normally
5/11/2015 18:50 Site secure equipment working normally, 1080 pellet observed within 10m of monitor
5/11/2015 21:30 Checked site online
6/11/2015 11:15 Beehives situated around monitor. Particle monitor decommissioned, DP gauge relocated 16 metres to the south.
7/11/2015 12:04 Site secure, removed deposition gauge

Characterising dust drift from aerial application of 1080 July 2016 INSTITUTE OF ENVIRONMENTAL SCIENCE AND RESEARCH LIMITED Page 49
LOCATION: Site Z-3 180 metres outside the application zone
GPS LOCATION: 1446925E 5281605N
SITE DESCRIPTION: Situated on the corner of a logging access track adjacent to a recently cleared pine forest. A north-south running embankment is situated to the west of the site. The embankment is approximately 4 to 5 metres high and is 40 metres to the west of the monitor. The land to the north of the site drops down approximately 50 metres to the valley floor. To the north some larger tree species including rata and rimu were evident, while regenerating species consisting of Manuka and comprosma were colonising the embankment. The cleared area to the south and east of the monitor consisted largely of gorse and Manuka.
STATION PRIMARY EQUIPMENT:
- 1 E-Sampler Nephelometer fitted with TSP sampling head with integrated particle filter
- 1 Deposited particulate monitor
- 1 Gill metpak pro with integrated ultrasonic wind sensor
- 1 motion activated surveillance camera with IR sensor for night monitoring
STATION LOG:
4/11/2015 18:50 commissioned site
4/11/2015 23:15 Checked site online
5/11/2015 06:10 Checked site online
5/11/2015 07:16 Site secure, comms fault resolved on meteorological station
5/11/2015 14:12 Site secure, equipment working normally
5/11/2015 14:35 – 15:45 Met with MoH representatives on site
5/11/2015 18:30 Site secure equipment working normally
5/11/2015 21:30 Checked site online
6/11/2015 13:30 Site secure, decommissioned particle monitor
7/11/2015 11:51 Site secure, removed deposition gauge

Characterising dust drift from aerial application of 1080 July 2016 INSTITUTE OF ENVIRONMENTAL SCIENCE AND RESEARCH LIMITED Page 50
LOCATION: Site Z-4 330 metres outside the application zone
GPS LOCATION: 1447809E 5280659N
SITE DESCRIPTION: Situated on elevated land overlooking the river valley to the north. The site is exposed to the north-west and east, with the exception of 2 mature rimu trees to the north. The land immediately surrounding the monitor is relatively flat and bounded to the south by an east-west orientated embankment which is approximately 5 metres in height. To the south of the monitor is a large shed/barn. Surrounding vegetation consists primarily of gorse (70%) with 15% Rimu and rata species respectively.
STATION PRIMARY EQUIPMENT:
- 1 E-Sampler Nephelometer fitted with TSP sampling head with integrated particle filter
- 1 Deposited particulate monitor
STATION LOG:
4/11/2015 19:10 commissioned site
5/11/2015 08:35 Site secure, equipment working normally
5/11/2015 14:02 Site secure, equipment working normally
5/11/2015 16:34 Site secure equipment working normally
6/11/2015 12:34 Site secure, decommissioned particle monitor
7/11/2015 11:40 Site secure, removed deposition gauge

Characterising dust drift from aerial application of 1080 July 2016 INSTITUTE OF ENVIRONMENTAL SCIENCE AND RESEARCH LIMITED Page 51
LOCATION: Site Z-5 415 metres outside the application zone
GPS LOCATION: E1447401 N5281330
SITE DESCRIPTION: Open flat farmland situated in a river valley and exposed to the east, north and west. To the south, approximately 80 metres from the monitor is a stand of native vegetation comprised of Rimu, Rata and Totara species. Beyond the vegetation approximately 200 metres from the monitor, the land rises 60 metres to a plateau.
STATION PRIMARY EQUIPMENT:
- 1 E-Sampler Nephelometer fitted with TSP sampling head with integrated particle filter
- 1 Deposited particulate monitor
STATION LOG:
4/11/2015 19:55 commissioned site
5/11/2015 08:46 Site secure, equipment working normally
5/11/2015 13:50 Site secure, equipment working normally
5/11/2015 18:15 Site secure equipment working normally
6/11/2015 12:00 Site secure, decommissioned particle monitor
7/11/2015 11:25 Site secure, removed deposition gauge

Characterising dust drift from aerial application of 1080 July 2016 INSTITUTE OF ENVIRONMENTAL SCIENCE AND RESEARCH LIMITED Page 52
LOCATION: Site U-1 1,000m outside the application zone
GPS LOCATION: E1449676 N5267843
SITE DESCRIPTION: Open flat farmland situated in an east-west orientated river valley. The monitor is immediately north of a calfshed in an open paddock. Approximately 80 metres to the south the land drops down to an unsealed road and a river valley while approximately 600 metres to the north the land begins to rise to a ridge.
STATION PRIMARY EQUIPMENT:
- 1 E-Sampler Nephelometer fitted with TSP sampling head
STATION LOG:
4/11/2015 20:57 commissioned site
5/11/2015 11:45 Site secure, equipment working normally
6/11/2015 10:15 Site secure, decommissioned particle monitor

Characterising dust drift from aerial application of 1080 July 2016 INSTITUTE OF ENVIRONMENTAL SCIENCE AND RESEARCH LIMITED Page 53
APPENDIX D: TOXICOLOGY ANALYSES

Characterising dust drift from aerial application of 1080 July 2016 INSTITUTE OF ENVIRONMENTAL SCIENCE AND RESEARCH LIMITED Page 54
Toxicology Laboratory
Analysis Report
Gerald Street P.O.Box 69040 Lincoln, 7640 Ph: +64 3 321 9999 Fax: +64 3 321 9998
CLIENT: Louise Wickham, Emission Impossible, Suite 1-6, 72 Dominion Road, Mt Eden
Auckland 1024
CLIENT REFERENCE No.: Telephone No:
SAMPLES: Seven air filter samples
REQUIREMENT: Examine for 1080
RECEIVED: 09 November 2015
Sample/s were received for analysis. The details were entered into the laboratory sample system and the
sample/s given a reference number. The sample details and results are as follows:
No. samples: 7
LabNo. Description 1080, µg/filter
19884 Filter sample, Z1, Application zone <MDL 19885 Filter sample, Z2, Boundary <MDL
19886 Filter sample, Z3 0.025
19887 Filter sample, Z4 <MDL
19888 Filter sample, Z5 <MDL
19889 Filter sample, Z6, Spike 7.24
19890 Filter sample, Z7 <MDL All results are reported to two significant figures.
The determination was carried out using TLM005, the assay of 1080 in water, soil and biological materials by
GLC. The method detection limit (MDL) for air filter samples is
0.005µg/filter.
TESTED BY: leb WORKBOOK REF: 99/11
These results are confidential to the client and relate only to the samples as received and tested. This report may be reproduced in full only. The samples relating to this report will be disposed of after two months from the report date unless requested otherwise by the client. Where appropriate, the above results will be included in anonymised form in the National Vertebrate Pesticide Residue Database.
Report No: T6045

Characterising dust drift from aerial application of 1080 July 2016 INSTITUTE OF ENVIRONMENTAL SCIENCE AND RESEARCH LIMITED Page 55
Toxicology Laboratory
Analysis Report
Gerald Street P.O.Box 69040 Lincoln, 7640 Ph: +64 3 321 9999 Fax: +64 3 321 9998
CLIENT: Louise Wickham, Emission Impossible, Suite 1-6, 72 Dominion Road, Mt Eden
Auckland 1024
CLIENT REFERENCE No.: Telephone No:
SAMPLES: Five deposited dust gauge samples
REQUIREMENT: Examine for 1080
RECEIVED: 09 November 2015
Sample/s were received for analysis. The details were entered into the laboratory sample system and the
sample/s given a reference number. The sample details and results are as follows:
No. samples: 5
LabNo. Description 1080, µg/mL
19879 Water sample, Deposited dust, Z-1DP <MDL 19880 Water sample, Deposited dust, Z-2DP <MDL
19881 Water sample, Deposited dust, Z-3DP <MDL
19882 Water sample, Deposited dust, Z-4DP <MDL
19883 Water sample, Deposited dust, Z-5DP <MDL All results are reported to two significant figures.
The determination was carried out using TLM005, the assay of 1080 in water, soil and biological materials by
GLC. The method detection limit (MDL) is 0.0001µg/mL and the
uncertainty (95% c.i.) is ± 12%.
TESTED BY: leb WORKBOOK REF: 99/10 These results are confidential to the client and relate only to the samples as received and tested. This report may be reproduced in full only. The
samples relating to this report will be disposed of after two months from the report date unless requested otherwise by the client. Where
appropriate, the above results will be included in anonymised form in the National Vertebrate Pesticide Residue Database
.
Report No: T6044
Date: 17/11/2015
AUTHORISED BY:
L.H.Booth, L.E. Brown
TEST PERIOD: 9-12/11/15

Characterising dust drift from aerial application of 1080 July 2016 INSTITUTE OF ENVIRONMENTAL SCIENCE AND RESEARCH LIMITED Page 56
[Intentionally Blank]