A Review of Variable Generation Forecasting in the West · CAISO California Independent System...
53
NREL is a national laboratory of the U.S. Department of Energy Office of Energy Efficiency & Renewable Energy Operated by the Alliance for Sustainable Energy, LLC This report is available at no cost from the National Renewable Energy Laboratory (NREL) at www.nrel.gov/publications. Contract No. DE-AC36-08GO28308 A Review of Variable Generation Forecasting in the West July 2013 — March 2014 R. Widiss and K. Porter Exeter Associates, Inc. Columbia, Maryland NREL Technical Monitors: Dr. Debra Lew and Dr. David Hurlbut Subcontract Report NREL/SR-6A20-61035 March 2014
-
Upload
nguyencong -
Category
Documents
-
view
217 -
download
1
Transcript of A Review of Variable Generation Forecasting in the West · CAISO California Independent System...

NREL is a national laboratory of the U.S. Department of Energy Office of Energy Efficiency & Renewable Energy Operated by the Alliance for Sustainable Energy, LLC
This report is available at no cost from the National Renewable Energy Laboratory (NREL) at www.nrel.gov/publications.
Contract No. DE-AC36-08GO28308
A Review of Variable Generation Forecasting in the West July 2013 — March 2014 R. Widiss and K. Porter Exeter Associates, Inc. Columbia, Maryland
NREL Technical Monitors: Dr. Debra Lew and Dr. David Hurlbut
Subcontract Report NREL/SR-6A20-61035 March 2014

NREL is a national laboratory of the U.S. Department of Energy Office of Energy Efficiency & Renewable Energy Operated by the Alliance for Sustainable Energy, LLC
This report is available at no cost from the National Renewable Energy Laboratory (NREL) at www.nrel.gov/publications.
National Renewable Energy Laboratory 15013 Denver West Parkway Golden, CO 80401 303-275-3000 • www.nrel.gov
Contract No. DE-AC36-08GO28308
A Review of Variable Generation Forecasting in the West July 2013 — March 2014 R. Widiss and K. Porter Exeter Associates, Inc. Columbia, Maryland
NREL Technical Monitors: Dr. Debra Lew and Dr. David Hurlbut Prepared under Subcontract No. AGG-3-23466-01
Subcontract Report NREL/SR-6A20-61035 March 2014

NOTICE
This report was prepared as an account of work sponsored by an agency of the United States government. Neither the United States government nor any agency thereof, nor any of their employees, makes any warranty, express or implied, or assumes any legal liability or responsibility for the accuracy, completeness, or usefulness of any information, apparatus, product, or process disclosed, or represents that its use would not infringe privately owned rights. Reference herein to any specific commercial product, process, or service by trade name, trademark, manufacturer, or otherwise does not necessarily constitute or imply its endorsement, recommendation, or favoring by the United States government or any agency thereof. The views and opinions of authors expressed herein do not necessarily state or reflect those of the United States government or any agency thereof.
This report is available at no cost from the National Renewable Energy Laboratory (NREL) at www.nrel.gov/publications.
Available electronically at http://www.osti.gov/scitech
Available for a processing fee to U.S. Department of Energy and its contractors, in paper, from:
U.S. Department of Energy Office of Scientific and Technical Information P.O. Box 62 Oak Ridge, TN 37831-0062 phone: 865.576.8401 fax: 865.576.5728 email: mailto:[email protected]
Available for sale to the public, in paper, from:
U.S. Department of Commerce National Technical Information Service 5285 Port Royal Road Springfield, VA 22161 phone: 800.553.6847 fax: 703.605.6900 email: [email protected] online ordering: http://www.ntis.gov/help/ordermethods.aspx
Cover Photos: (left to right) photo by Pat Corkery, NREL 16416, photo from SunEdison, NREL 17423, photo by Pat Corkery, NREL 16560, photo by Dennis Schroeder, NREL 17613, photo by Dean Armstrong, NREL 17436, photo by Pat Corkery, NREL 17721.
Printed on paper containing at least 50% wastepaper, including 10% post consumer waste.

iii
This report is available at no cost from the National Renewable Energy Laboratory (NREL) at www.nrel.gov/publications.
Acknowledgments The authors wish to thank the U.S. Department of Energy (DOE) Office of Electricity Delivery and Energy Reliability for funding the research that went into this report. In addition, we thank David Hurlbut, who served as the technical monitor for this report, and Rebecca Johnson, who served as a liaison from the Western Interstate Energy Board. We thank the following experts for reviewing this report: Mark Ahlstrom of WindLogics; Brendan Kirby, a private consultant; Ron Lehr, an attorney and consultant; Larry Mansueti of DOE; Andrew Mills of Lawrence Berkeley National Laboratory (LBNL); and Charlie Smith of the Utility Variable Generation Integration Group. In addition, we thank Jim Blatchford of the California Independent System Operator; Blake Butler and Obdiah Bartholomy of the Sacramento Municipal Utility District; Jacques Duchesne of the Alberta Electric System Operator; Ron Flood of Arizona Public Service; Pat Holbrook of Idaho Power; John Ollis of Portland General Electric; Keith Parks of Xcel Energy; Jack Peterson of Southern California Edison; Matt Rarity of Puget Sound Electric; Dan Severson of Turlock Irrigation District; Alva Svoboda of Pacific Gas & Electric; Scott Winner of the Bonneville Power Administration; and Devon Yates of NaturEner USA for granting interviews and providing reviews of sections of the draft report. Finally, the authors thank Kendra Palmer of NREL for her editorial assistance.

iv
This report is available at no cost from the National Renewable Energy Laboratory (NREL) at www.nrel.gov/publications.
List of Acronyms AGC Automatic Generation Control AMI Advanced Metering Infrastructure BA Balancing Authority CAISO California Independent System Operator CI Confidence Interval CPUC California Public Utilities Commission CSI California Solar Initiative DDST Dispatch Decision Support Tool DG Distributed Generation DOE U.S. Department of Energy EIM Energy Imbalance Market EMS Energy Management System ERCOT Electric Reliability Council of Texas FERC Federal Energy Regulatory Commission kW Kilowatt kWh Kilowatt-hour LIDAR Light Detection and Ranging LMP Locational Marginal Pricing MAE Mean Absolute Error MAPE Mean Absolute Percentage Error MISO Midcontinent Independent System Operator MW Megawatt MWh Megawatt-hour NCAR National Center for Atmospheric Research NERC North American Reliability Corporation NOAA National Oceanic and Atmospheric Administration NREL National Renewable Energy Laboratory NWP Numerical Weather Prediction OE Operating Entity PIRP Participating Intermittent Resource Program PPA Power Purchase Agreement PSCo Public Service Company of Colorado PURPA Public Utility Regulatory Policies Act QF Qualifying Facility RMSE Root Mean Square Error RTO Regional Transmission Organization SCADA Supervisory Control and Data Acquisition SMUD Sacramento Municipal Utility District SODAR Sonic Detection and Ranging SPP Southwest Power Pool SPS Southwestern Public Service Company SPSC State-Provincial Steering Committee SUNY State University of New York VERBS Variable Energy Resource Balancing Service VG Variable Generation WECC Western Electricity Coordinating Council

v
This report is available at no cost from the National Renewable Energy Laboratory (NREL) at www.nrel.gov/publications.
Executive Summary This report is based on a series of interviews with 13 operating entities (OEs) in the Western Interconnection about their implementation of wind and solar forecasting, jointly referred to as variable generation (VG) forecasting. This piece updates a report issued by the National Renewable Energy Laboratory (NREL) in 2012; it also covers several additional topics including sub-hourly scheduling, grid operator training, and forecasting for distributed solar resources. As in the 2012 report, the OEs interviewed vary in size and character; the group includes independent system operators, balancing authorities, utilities, and other entities that rely on VG forecasting.
VG forecasting is widely considered to be a key means of integrating wind and solar power efficiently and reliably as these resources become increasingly common. Indeed, in a recent report, grid operators from 18 countries identified wind forecasting as “the most important prerequisite for successfully integrating wind energy into power systems” (Jones 2011, p. xxiv).
VG forecasting remains a relatively new phenomenon in the West. Ten of the 13 OEs interviewed for this year’s report began using VG forecasts in 2007 or later. Each currently uses a wind forecast. In anticipation of rapid growth in solar generation, five OEs have recently begun working on in-house solar forecasts and two are utilizing outside sources. This report serves as a means for these companies to compare VG forecasting practices, lessons learned, and priorities with one another, as well as to share their experiences with state and federal regulators, market participants, national laboratories, and non-governmental organizations.
Highlights Costs and Benefits – The costs of wind forecasts have dropped dramatically since the 2012 report. This decline coincides with a shift toward testing or utilizing multiple vendors. Many of the OEs interviewed no longer view VG forecasting in a cost-benefit framework, regarding it instead as a necessity for maintaining electric reliability and scheduling resources effectively. Cost Assignment – Only a few respondents partly or fully recover forecasting costs from variable generators. Many simply absorb the costs, possibly viewing them as relatively minor. However, the reportedly high cost of individual solar plant forecasts prompted at least one OE to turn to in-house forecasting. Forecast Accuracy – Wind forecasting accuracy continues to improve incrementally. Participating OEs credit these gains to improved forecasting techniques and models, seasoned vendors, and growing portfolio size, all of which smooth the variability in VG output. Solar forecasting is at an early stage in the West, but at least one company is beginning to track solar forecasting accuracy. Forecasting Uses – Nearly all interviewees use their wind forecasts for day-ahead unit commitment—a striking change since the 2012 report. This was consistent despite the entities’ diversity in size, proportion of renewables, and average monthly load. Intra-day unit commitment and reserves planning are the next most common uses, followed by a diverse array of uses often unique to a given entity.

vi
This report is available at no cost from the National Renewable Energy Laboratory (NREL) at www.nrel.gov/publications.
Data Collection – Participating OEs have made few expansions, if any, to the types of meteorological data (wind speed, direction, temperature, pressure, humidity) and turbine status data they require of wind generators. However, two OEs have recently taken steps to increase the speed of data transmission from their generators, and reported that this change has greatly enhanced the value of their wind forecasts. Because solar forecasting is at an early stage, only a small number of responding OEs have solar data requirements in place.
Curtailments and Outages – Most interviewees factor turbine availability and/or outages into their forecasts so that they represent what generators are capable of producing, even if VG output is curtailed. Less than half of the OEs describe using curtailment information after the fact for calibrating forecast models and calculating performance metrics.
Probabilistic Forecasting – Participants report that both ensemble forecasts and confidence intervals (CIs) are commonly used to address forecasting uncertainty. Yet many system operators reportedly ignore the CIs provided to them, choosing instead to use a single likeliest production value.
Distributed Solar Production – Distributed generation (DG) is commonly “invisible” to system operators, particularly for behind-the-meter resources connected at customer sites, which are netted out with the customer load. These resources cannot usually receive dispatch commands. Six of the OEs interviewed view the development of methods to forecast distributed solar production as an imminent need, and two see it as an eventual need. No consensus on how to forecast distributed solar generation has emerged.
Control Room Integration – Displays of VG forecasts in OE control rooms are nearly universal. Typically, these are automated feeds, sometimes provided by third-party forecasters. These displays are often accompanied by real-time weather or real-time generation data. Half the organizations interviewed are integrating forecast values directly into operations tools such as an Energy Management System (EMS).
Staff Familiarity – Though formal training is rare, staff members often coach their colleagues on an as-needed basis. System operators have developed a sense of familiarity with VG forecasts at most of the organizations interviewed. Four OEs also employ meteorologists to aid in interpreting VG forecasts.
Advice and Lessons Learned – Respondents’ advice for other utilities includes starting sooner rather than later as it can take time to plan, prepare, and train a forecast; setting realistic expectations; using multiple forecasts; and incorporating several performance metrics.
Potential Regional Initiatives - Several of the OEs interviewed are against the creation of formal standards or guidelines for forecasting, suggesting that these would stifle innovation and impose “one-size-fits-all” methods upon unique situations. Others suggested that guidelines for data collection or a guideline determining resource adequacy for reserves would be helpful. A small number of interviewees advocated for further research and development (R&D) investments in forecasting.
Forecast Sharing - OEs were also split on the idea of sharing forecasts with other OEs. Some suggest that sharing forecasts and data would help improve VG forecasting. Others contend that

vii
This report is available at no cost from the National Renewable Energy Laboratory (NREL) at www.nrel.gov/publications.
sharing forecasts will not have much value unless reserves can be traded through such mechanisms as Energy Imbalance Markets (EIMs). Still others view VG forecasts as a source of competitive advantage for recipients and would oppose sharing them.
Sub-Hourly Dispatch - The changes documented since the 2012 report have been remarkable. Yet, it is also worth noting one practice that has not changed. Outside of the West, regional transmission organizations (RTOs) are now dispatching wind in five-minute markets as opposed to hourly schedules in the West, except for the Alberta Electric System Operator and the California Independent System Operator. The RTOs outside the West use equally fast forecast updates, taking advantage of the fact that forecasts are more accurate in short-term increments. Industry initiatives such as the EIM encompassing the California Independent System Operator, Nevada Power and PacifiCorp, as well as regulatory initiatives such as Federal Energy Regulatory Commission Order No. 764, may accelerate the adoption of this practice in the West.

viii
This report is available at no cost from the National Renewable Energy Laboratory (NREL) at www.nrel.gov/publications.
Table of Contents 1. Introduction to Variable Generation Forecasting .............................................................................. 1 2. Project Background ............................................................................................................................. 6 3. Responses to Interview Questions ..................................................................................................... 9
3.1 Forecasting Uses and Practices ........................................................................................................ 9 3.1.1 Use of VG Forecasts ......................................................................................................... 9 3.1.2 Needs Assessments ......................................................................................................... 10 3.1.3 Timeframes for Forecasts ................................................................................................ 11 3.1.4 Scopes and Types of Forecasts ....................................................................................... 13 3.1.5 Forecast Sources: Third-Party, In-House, or Both .......................................................... 15 3.1.6 Use of Ensemble Forecasts and Confidence Intervals .................................................... 16 3.1.7 Forecasting Accuracy ...................................................................................................... 18
3.2 FERC Order No. 764 and Sub-Hourly Scheduling ........................................................................ 19 3.2.1 The Impact of FERC Order No. 764 on Forecasting ...................................................... 19 3.2.2 The Impact of Sub-hourly Scheduling or Dispatch on Forecasting ................................ 20 3.2.3 VG Forecasting in Control Rooms .................................................................................. 21
3.3 System Operator Training .............................................................................................................. 22 3.3.1 Training on VG Forecasting ........................................................................................... 22 3.3.2 Sense of Familiarity with VG Forecasting ...................................................................... 23
3.4 Costs and Benefits ......................................................................................................................... 24 3.4.1 Forecasting Costs ............................................................................................................ 24 3.4.2 Cost-Benefit Analysis ..................................................................................................... 24 3.4.3 Analyzing Potential Reductions in Flexible Operating Reserve Requirements .............. 25
3.5 Data Collection .............................................................................................................................. 25 3.5.1 Data Requirements for Wind .......................................................................................... 25 3.5.2 Data Requirements for Solar ........................................................................................... 27 3.5.3 Data Collection Challenges and Desires ......................................................................... 28 3.5.4 Incorporating Curtailments and Outages into Forecasts ................................................. 29
3.6 Solar Forecasting ........................................................................................................................... 30 3.6.1 Development of Solar Forecasts ..................................................................................... 30 3.6.2 The Need to Forecast Distributed Solar Production........................................................ 31 3.6.3 Estimating Production from “Behind-the-Meter” Solar Resources ................................ 32
4. Improving VG Forecasting in the West ............................................................................................ 33 4.1 Coordination between Operating Entities ...................................................................................... 33 4.2 Potential Regional Actions ............................................................................................................ 33 4.3 Summary ........................................................................................................................................ 34
Glossary ..................................................................................................................................................... 35 References ................................................................................................................................................. 38 Appendix .................................................................................................................................................... 39

ix
This report is available at no cost from the National Renewable Energy Laboratory (NREL) at www.nrel.gov/publications.
List of Figures Figure 1. Plot of system-wide wind forecast error versus forecast time horizon, with error expressed
as mean absolute error as a percentage of installed wind MW ........................................................ 4
List of Tables Table 1. Overview of Operating Entities Interviewed for this Report ................................................... 7 Table 2. Usage of VG Forecasts ............................................................................................................. 9 Table 3. Frequency of Needs Assessment ............................................................................................ 11 Table 4. Forecast Timeframes .............................................................................................................. 12 Table 5. Scope of VG Forecasts ........................................................................................................... 13 Table 6. Types of VG Forecasts Being Prepared ................................................................................. 14 Table 7. Sources of VG Forecasts ........................................................................................................ 15 Table 8. Use of Ensemble Forecasts and Confidence Intervals............................................................ 17 Table 9. Assessments of VG Forecasting Accuracya ........................................................................... 18 Table 10. General Approaches to Assessing Forecasting Accuracy .................................................... 19 Table 11. Initial Views on FERC Order No. 764’s Expected Impact on Forecasting .......................... 20 Table 12. Initial Views on the Impact of Sub-hourly Scheduling or Dispatch on Forecasting ............ 21 Table 13. Use of VG Forecasting in Control Rooms ........................................................................... 22 Table 14. Wind Data Required from Variable Energy Generators for Forecasts ................................. 26 Table 15. Requirements for Sources of Data for VG Forecasting ........................................................ 27 Table 16. Solar Data Required from Variable Energy Generators for Forecasts ................................. 28 Table 17. Incorporating Curtailments and Outages into Forecasts....................................................... 30

1
This report is available at no cost from the National Renewable Energy Laboratory (NREL) at www.nrel.gov/publications.
1. Introduction to Variable Generation Forecasting Electric utilities and transmission providers are faced with variability and uncertainty in their everyday operations, such as the variability of load or unexpected generation or transmission outages. Weather itself is a major driver of electric demand, and prolonged or extreme weather events, such as a heat wave or cold snap, can affect both electric demand and the operation of generation.
Variable energy generation (VG) introduces new sources of uncertainty and variability. Several recent studies suggest that wind and solar generation forecasts can reduce this uncertainty. Indeed, as wind and solar reach high penetration levels, many entities have come to regard VG forecasting as a vital component to operations. The North American Electric Reliability Corporation (NERC) has stated that “enhanced measurement and forecasting of VG output is needed to ensure bulk power system reliability” (NERC 2009, p. iii).
VG forecasting serves multiple purposes. It enables operating entities (OEs) to maintain fewer operating reserves—generation or demand that stands ready to handle unexpected events—than they would need without forecasting. It also helps grid operators monitor current conditions and prepare for extremes in wind and solar power production and rapid changes in this output (“ramps”) (NERC 2010). Perhaps most important, VG forecasting helps grid operators schedule and dispatch generating plants more efficiently, avoiding the many costs and negative impacts (e.g., reduced plant efficiency, increased fuel costs, increased operations and maintenance expenses, and higher emissions) associated with over- or under-committing plants (Bird et al. 2012). In the day-ahead timeframe, VG forecasts can inform choices related to hydro reservoirs, natural gas purchases, and transmission congestion (Bird et al. 2012).
This report focuses on OEs, but many other market participants purchase or create their own VG forecasts. Wind and solar companies use VG forecasts to provide insights into when to expect robust generation and, if production is likely to be low, when to plan maintenance. Energy traders and other wholesale market participants use VG forecasts to help anticipate day-ahead power market prices. Financial traders use VG forecasts to anticipate and capitalize on price differences between day-ahead and real-time markets. For proposed wind and solar projects, VG forecasts are also often required to attract project financing.
Chapter 1 consists of an introduction to VG forecasting and relies upon relevant content from several recent reports. It is intended for readers who are not yet familiar with the basics of VG forecasting, or who want to brush up on relevant terminology. Chapter 2 provides background on the project. Chapter 3 includes the responses to the interview questions, divided into forecasting uses and practices; FERC Order No. 764 and sub-hourly scheduling; system operator training; costs and benefits; data collection; and solar forecasting. Chapter 4 addresses suggested improvements and next steps for VG forecasting in the West, and provides a short summary of the report.
1.1 Common Types of Forecasts and Their Applications Many OEs rely on an array of VG forecasts suited to different purposes. Some of the most common types of VG forecasts are defined below:

2
This report is available at no cost from the National Renewable Energy Laboratory (NREL) at www.nrel.gov/publications.
• Weather Situational Awareness forecasts provide severe weather alerts. These are important because storms can lead to rapid changes in VG.
• Day-ahead forecasts provide hourly power values for the next few days and are generally updated every 6 to 8 hours. They are often used in the unit commitment process when system operators decide which generators will be used the next day. Starting thermal generators incurs costs and can require ample time; forecasts help avoid unnecessary starts and stops.
• Intra-day forecasts typically provide power values for the next few hours (usually 4 to 8 hours ahead). They are updated frequently—at least hourly, and often more regularly, such as every 10 minutes. Intra-day forecasting is an area of special focus in the industry, with emphasis not only on accuracy but also on anticipating VG ramps.
• Nodal forecasts aggregate VG forecasts (of the sort described above) for each node or transmission delivery point. Nodal forecasts can be helpful in transmission congestion planning (NERC 2010).
• Persistence forecasts simply assume that current output levels will remain unchanged in the very near future. Since wind plant output tends to change slowly, persistence forecasts are often quite accurate within the hour. They are, therefore, useful for very short-term decisions.
• Ensemble forecasts are an aggregation of output from two or more forecasts. Since no forecast of any type is perfect, many interviewees opt to rely on ensemble forecasts. A company can generate a suite of forecasts using a single forecasting system by varying input data or model parameters. Alternatively, two or more forecasts that have been generated by separate forecasting companies can be melded together as one. If experienced judgment is used in choosing which forecasts to rely upon and how much weight to give them, or if historical production and observation data are used to “train” the ensemble of forecasts, ensemble forecasting is especially useful (NERC 2010).
1.2 The Basic Steps to Creating a Wind or Solar Forecast Numerical weather prediction (NWP) models provide the foundation for VG forecasts. These large-scale models predict weather conditions for a wide variety of purposes including aviation, agriculture, and public safety. NWP models simulate atmospheric processes using complex physics equations and are typically run by public agencies such as the National Oceanic and Atmospheric Administration (NOAA). NWP models utilize weather data gathered and shared by organizations around the world.
Forecasting systems are only as accurate as the formulas they execute and the observational data they use. Many NWP models have limited spatial resolution. For instance, a typical NWP model might use a modeling grid that cannot capture terrain differences within 10-kilometer (km) grid blocks. In addition, most weather stations are located at or below 10 meters above ground level—heights relevant for agriculture, public safety, and plane departures/landings—yet wind turbines are typically 80 meters to 100 meters high. Also, vertical weather patterns, such as

3
This report is available at no cost from the National Renewable Energy Laboratory (NREL) at www.nrel.gov/publications.
diurnal wind patterns caused by temperature gradients, affect turbine performance (Bird et al. 2012).
Given these shortcomings, OEs and VG forecasters tend to supplement NWP models. They gather weather data locally, and they often develop statistical models to account for variations in VG output caused by local terrain. Rather than modeling physical interactions, these statistical models establish a direct relationship between input (the values from general weather models) and output (site-specific weather conditions, power output, etc.) based on historical data. The models can then use current NWP results, augmented with local data, to predict power output. However, since statistical models rely on historical data, they are best at predicting output under typical weather conditions—unless the models are specially designed and trained to anticipate anomalies (Bird et al. 2012).
Solar forecasting is at a much earlier stage of development than wind power forecasting, largely because solar power represents a much smaller, though rapidly growing, portion of the country’s energy mix. Clouds, water vapor, and aerosols all affect how much solar radiation reaches the earth’s surface, also known as solar insolation. Hour-ahead solar forecasts rely on statistical models that relate historical on-site insolation, off-site cloud and solar insolation data, and satellite images of relevant water vapor channels. Day-ahead solar forecasts use physics-based models instead, similar to the use of NWP models for wind forecasting described above (Bird et al. 2012). 1.3 Forecast Accuracy Accuracy is, of course, important for forecasts. By one estimate, a system operator might want to have a 97.5% confidence level that a given amount of wind will be available the next day before applying this amount to a reliability requirement (Ahlstrom et al. 2013). Yet forecasts can also be viewed as tools for recognizing periods when risk is heightened—especially since small forecasting errors can sometimes have greater impacts at times of stress on the grid, such as during periods of low electric demand (minimum load), than large errors at times of normal operating conditions (NERC 2010).
Since the initial version of this report was issued in 2012, most of the OEs interviewed have experienced improvements in the accuracy of their forecasts. Naturally, grid operators would like to see continuing improvements. With years of experience in forecasting load, day-ahead errors for these forecasts are now in the range of 1% to 3% (Bird et al. 2012). VG forecasts are not nearly this accurate; Figure 1 below illustrates errors experienced during a sample month by the Alberta Electric System Operator (AESO). As a result, some OEs in the West report that while VG forecasting is helpful, they interpret it with caution or even discount it altogether. This skepticism is stronger the longer the timeframe involved.

4
This report is available at no cost from the National Renewable Energy Laboratory (NREL) at www.nrel.gov/publications.
Figure 1. Plot of system-wide wind forecast error versus forecast time horizon,
with error expressed as mean absolute error as a percentage of installed wind MW
Source: Courtesy of Jacques Duchesne, AESO, and prepared by WEPROG (Ahlstrom et al. 2013)
More accurate NWP forecasting for the power sector will require data measurements from greater heights throughout the atmosphere and additional geographic diversity, as well as increased frequency of measurements and model runs. Such improvements, many of them dependent upon high performance computing, will require public-private collaboration and government financial support. For example, efforts are underway to facilitate two-way data sharing between third-party forecasters and government agencies—while protecting business-sensitive information (Bird et al. 2012).
There are also options outside of forecasting that would improve accuracy significantly. Using larger balancing areas with greater geographic diversity can smooth the variability of wind and solar output. In turn, this reduces net forecasting errors. Aggregating wind plants in this manner can generally reduce forecast errors by 30-50% (NERC 2010). So-called “virtual” balancing areas, such as those created by energy imbalance markets (EIMs), can provide similar benefits (Chase et al. 2011).
Shorter scheduling intervals and updating forecasts throughout a day improve forecasting accuracy because forecast errors decrease closer to the time at which generation is dispatched to meet load. This allows greater use of persistence forecasting which, as shown earlier in Figure 1, is quite accurate in very brief time intervals. For the next ten minutes or less, the error of a wind power persistence forecast is similar to load forecast error. Several RTOs in the Eastern Interconnection, the Midwest, and Texas are using this attribute of wind forecast error to incorporate wind into the five-minute dispatch process (NERC 2010).
AESO Short-term Forecast Mean Absolute Error August 2012

5
This report is available at no cost from the National Renewable Energy Laboratory (NREL) at www.nrel.gov/publications.
Forecasts only “work” if someone understands them and acts upon them. Many interviewees are taking steps to ensure staff members have easy access to VG forecasts and understand how to interpret them, including anticipating their limitations. Some OEs are working to integrate the results of their VG forecasts directly into the tools that their staff implement to manage scheduling, dispatching, and other functions.

6
This report is available at no cost from the National Renewable Energy Laboratory (NREL) at www.nrel.gov/publications.
2. Project Background In 2010, the U.S. Department of Energy (DOE) awarded a grant under the American Recovery and Reinvestment Act of 2009 to the Western Governors’ Association to enhance member states’ capacity to participate in interconnection-wide transmission planning, which at that time was being undertaken under a companion DOE grant to the Western Electricity Coordinating Council (WECC). These activities occurred under the State-Provincial Steering Committee (SPSC). One of the SPSC’s missions is to identify actions that lower the cost of integrating variable energy resources into the grid. VG forecasting was identified by the SPSC as a key factor in lowering costs. The SPSC requested assistance in 2011 from the DOE’s Office of Electricity Delivery and Energy Reliability to help document wind and solar forecasting practices in the Western Interconnection.1 NREL was asked by the DOE to provide technical assistance.
In 2013, following a similar request, NREL hired Exeter Associates, Inc. to update the results of its 2012 report by re-interviewing past participants when possible, and by including at least two additional OEs. In addition to the eight questions covered in the initial report, ten new questions were added. Both original and new topics are shown below:
ORIGINAL TOPICS:
• Whether the OE is engaged in VG forecasting
• How the forecast is used and whether or not this use has changed
• What data are collected
• Whether third-party vendors are engaged
• How far in advance the forecast is due
• What performance metrics are used to evaluate forecast error
• The amount of installed wind and solar capacity in the OE
• Current load in the OE.
NEW TOPICS:
• The initiation/evolution of forecasting
• How often forecasting needs are assessed
• Whether FERC Order No. 764 and/or sub-hourly scheduling will change forecasting practices
• The display of forecasts in the control room
• Training for grid operators and dispatchers
• How forecasts affect operating reserve requirements
• Whether and how forecasting for distributed solar generation is being implemented.
1 The survey resulted in a report available at http://www.nrel.gov/docs/fy12osti/54457.pdf.

7
This report is available at no cost from the National Renewable Energy Laboratory (NREL) at www.nrel.gov/publications.
This year’s report includes 11 of the 14 OEs interviewed for the 2012 report, as well as three new OEs.2
Table 1 provides an overview of VG resources and forecasting practices at the 14 OEs interviewed for this report. As in 2012, every OE interviewed uses a wind forecast, though Sacramento Municipal Utility District (SMUD) relies solely on the California Independent System Operator’s (CAISO’s) Participating Intermittent Resource Program (PIRP) for wind forecasting.3 Seven OEs are now experimenting with solar forecasting.4
Table 1. Overview of Operating Entities Interviewed for this Report
Operating Entity
Average Load (MW)
Wind Capacity
(MW)
Solar Capacity
(MW)
Year Forecasting
Began Wind
Forecast Solar
Forecast Alberta Electric System Operator (AESO) 8,604 1,088 0 2010 X
Arizona Public Service (APS) 4,500 290a 481 2008 X X Bonneville Power Administration (BPA) 6,000 4,516 6 2009 X
California Independent System Operator (CAISO)
21,579-35,781 5,660 3,263 2004 X X
Glacier Wind N/A 399 0 2009 X Idaho Power Co. (Idaho Power) 1,759 669 2-3 2011 X To come Pacific Gas & Electric (PG&E)b 18,707c d d Early 2000s X X Portland General Electric (PGE) 2,140 550 2 2007 X Puget Sound Electric (PSE) 4,328c 823 0.5 2007 X Sacramento Municipal Utility District (SMUD)b 1,200 0 150 2011 X
Southern California Edison (SCE)b 13,000 e e 1980s X X
Turlock Irrigation District (Turlock) 245-336 f 3 2009 X
Xcel Energy g 4,000 2,215 390+ 2008 X To come TOTAL 16,210 MW 4,297.5 MW 13 5 a 190 megawatts (MW) are dynamically transferred from the Public Service Company of New Mexico; another 15 MW is transferred out of APS to Salt River Project. b Also receives the PIRP forecast. c Highest monthly peak load for 2012, not average load. d Included in the CAISO’s totals. e Included in the CAISO’s totals. SCE has commitments for 2,770 MW of wind capacity and 1,400 MW of solar capacity. f Turlock’s 137 MW wind project is in BPA’s service area. g For this report on OEs in the West, “Xcel Energy” means Public Service Company of Colorado, Xcel’s operating company in Colorado.
2 San Diego Gas & Electric could not spare staff for the interview process during the fall fire season. Two other potential new participants, Public Service Company of New Mexico and PacifiCorp, responded to initial emails but not to subsequent requests to arrange phone interviews. Northwestern Energy declined to participate. 3 For participants in PIRP, hourly scheduling deviations are netted over the month and settled at the monthly weighted market-clearing price. 4 Pacific Gas and Electric (PG&E) has a small amount of “legacy solar forecasting” for facilities that pre-date the CAISO.

8
This report is available at no cost from the National Renewable Energy Laboratory (NREL) at www.nrel.gov/publications.
The OEs interviewed vary greatly in size and type of organization, as detailed below:
• Glacier Wind is a both a wind company and a balancing authority. Glacier Wind’s views and forecasting activities reflect both aspects of its business.
• The CAISO serves as a grid operator for 80% of California’s power grid, serving a load that is larger than any other interview participant’s load.
• PG&E and SCE belong to the CAISO, yet both still use forecasting to integrate wind and solar resources that were built before the CAISO’s establishment in 1998. A significant amount of PG&E’s and SCE’s renewable energy capacity, including wind and solar, was developed in the 1980s under the Public Utility Regulatory Policies Act of 1978 (PURPA) and under standard offer contracts authorized by the California Public Utilities Commission (CPUC) at that time. PG&E and SCE both act as scheduling coordinators for renewable energy and cogeneration facilities developed under PURPA.
• SMUD is also not a balancing authority; it belongs to the Balancing Area of Northern California.

9
This report is available at no cost from the National Renewable Energy Laboratory (NREL) at www.nrel.gov/publications.
3. Responses to Interview Questions The questions below cover several related topic areas: forecasting uses and practices, costs and metrics, lessons learned, and next steps. Throughout this section, readers may want to pay special attention to the entities with the largest amounts of VG (AESO, BPA, CAISO, Xcel Energy); they represent the most pressing and continuous need for VG forecasting.
3.1 Forecasting Uses and Practices 3.1.1 Use of VG Forecasts Table 2 shows how forecasts are used by the OEs interviewed. Six of the ten companies that participated in the 2012 report have expanded their use of forecasts. These additions span every use tracked by our questionnaire except transmission congestion management. The most striking change since 2012 relates to forward unit commitment, which is now the most common use of forecasting. The percentage of companies using forecasting for this purpose has more than doubled since 2012.
Table 2. Usage of VG Forecasts
Operating Entity
Forward Unit Commitment (Day-ahead,
week-ahead, etc.)
Intra-day Unit
Commitment
Transmission Congestion
Management Reserves
Management of Hydro or
Gas Storage
Generation or Transmission
Outage Planning
AESO X To come APS X X X X BPA X X X X CAISO X X Glacier Wind X X X X Idaho Power X X X Xa PG&Eb X X X To come To come PGE X X X PSE X To come X X X SMUDb,c X X X SCEb X X X Xd Turlock X Xcel Energy X X X X a Also uses forecast for coal storage. b Also receives the PIRP forecast. c Responses refer to solar forecasting only. d For hydro only, not natural gas. Every OE has unique circumstances, which leads each to utilize its forecasts for different purposes:
• Based on the success of a wind dispatch pilot, AESO is planning to allow wind to bid into the energy market in 2014 on a two-hour-ahead basis. Presently, AESO accepts wind generation on an as-available basis. Wind dispatch will be voluntary for wind generators initially, and AESO expects participation will increase in time. Newer wind generators have to communicate to AESO the availability of their asset and provide updates electronically via supervisory control and data acquisition (SCADA) systems every few seconds. This capability is included in AESO’s short-term forecast. A participating wind asset will consider its short-term forecast to put in bids and offers on a two-hour-ahead

10
This report is available at no cost from the National Renewable Energy Laboratory (NREL) at www.nrel.gov/publications.
basis. AESO is currently using the day-ahead and week-ahead forecasts to determine resource adequacy and the short-term forecast for real-time dispatch decisions. AESO is considering using the wind forecasts for day-ahead operating reserves.
• BPA has a new automated balancing reserves requirement tool called “R3T.” It uses wind and load forecasts to estimate balancing reserve needs up to seven days out. BPA is using a version of this tool sold by WEPROG and is developing an in-house version.
• The CAISO is closing its PIRP program to new participants and instituting a 15-minute, financially binding market based on sub-hourly forecasts.5
• Glacier Wind, which operates three wind projects in Montana and has no load, uses the wind forecast to schedule hourly energy sales; to ensure it has sufficient operating reserves on hour-ahead, day-ahead, and month-ahead bases; and to schedule planned generation outages for maintenance during forecasted periods of low wind.
• SCE states that VG forecasting affects how it uses its hydro plants. For instance, if wind generation is high but is expected to drop, SCE may use its hydro plants to provide ancillary services. SCE also uses its VG forecasting for short-term resource planning, bidding into markets, scheduling, and incorporating changes to those schedules.
• Because its wind project is outside of its service territory, Turlock uses its wind forecasts for trading, marketing, and optimizing schedules.
• Among other things, Xcel Energy relies on its wind forecasts as an input into decisions for day-ahead natural gas purchases. For example, the company will not buy as much natural gas if high wind is forecasted. If Xcel Energy buys too much natural gas and the company’s storage resources are full, it may have to burn natural gas to avoid penalties from the natural gas providers. Xcel Energy says this is infrequent, especially in the last two years as wind forecasts have improved.
3.1.2 Needs Assessments There is a strong split between respondents that evaluate their forecasting capabilities on a continual versus discrete basis, as shown in Table 3. Of the six OEs that evaluate their needs continually, three (BPA, CAISO, Xcel Energy) have relatively high levels of wind and/or solar capacity and have invested heavily in forecasting systems or services. Two more (Glacier Wind, SMUD) run forecasting trials with multiple forecast providers.
OEs consider cost, accuracy, and function when evaluating their current forecasting systems or services. Cost, however, is not always correlated with quality. For example, PGE has found that its two most valuable forecasts consist of its most expensive and least expensive forecast. OEs 5 The CAISO will schedule VG resources at their forecasted output in 15-minute intervals at 37.5 minutes before the start of each interval. Deviations from the 15-minute forecasts and 5-minute dispatch levels will be considered imbalance energy and settled at the 5-minute Locational Marginal Pricing (LMP). Older VG projects that are unable to curtail output due to technology or contractual constraints have a transition period of three years to make the necessary changes. For more information, see: “Some Wind Turbines ‘Safe’ from New CAISO Market Changes.” (2013). Connected, Utility Variable Generation Integration Group, 5.

11
This report is available at no cost from the National Renewable Energy Laboratory (NREL) at www.nrel.gov/publications.
that maintain an in-house forecasting system consider not only performance, but how a forecast could be improved by using better data sources or algorithms.
Table 3. Frequency of Needs Assessment6
Operating Entity Frequency Comments
AESO As needed Accuracy is expected to improve.
APS Continual Relies on longer-term forecasts to understand how renewable resources will affect transmission and distribution systems. In addition to accuracy, considers whether a forecast aids in planning reserves.
BPA Continual Has made new wind integration products available to customers over the past several rate periods (2-year cycle). These products have driven wind power forecasting innovation.
CAISO Continual Evaluates its models every week and its load model every day, using a back cast. Provides feedback on errors or bias to forecaster.
Glacier Wind Continual
Idaho Power As needed Has contracted with the University of Arizona to improve model performance.
PGE Tri-annually Conducted first assessment three years ago, and is about to do so again. PG&Ea Annual PSE Annual
SMUDa Continual Evaluates overall accuracy, the ability to use results under different weather regimes (e.g., clear or cloudy), performance during extreme events, and the improvement of accuracy over time.
SCEa Monthly Prefers to use a monthly after-the-fact analysis in comparing its purchased forecasts to PIRP.
Turlock Tri-annually Assessments coincide with a 3-year budget cycle, unless problems arise.
Xcel Energy Continual Tries to have ideas ready to take advantage of company R&D funding when available. For example, contacted icing experts a year before the opportunity arose to advocate for related research.
a Also receives the PIRP forecast.
3.1.3 Timeframes for Forecasts Table 4 provides an overview of each respondent’s forecasting practices, divided into short-term, medium-term, and long-term forecasts. For this report, short-term forecasting is roughly defined as hour-ahead; medium-term as day-ahead; and long-term as multiple-day-ahead, but the specifics were left to the interviewees. There is great diversity among companies as to how often forecasts are prepared and the frequency with which they are updated.
• Nearly all the OEs interviewed have hour-ahead forecasts. The frequency with which these are updated varies from every 10 minutes to hourly.
• Every respondent’s forecasts cover the day-ahead timeframe in some manner. Eight interviewees use a separate, additional day-ahead forecast.
• There seems to be a modest shift toward having longer forecast periods as part of short- and medium-term forecasts. Between the 2012 report and the current report, BPA’s hourly forecast expanded from covering three days to seven days; the CAISO’s day-
6 In this table, and all subsequent tables, only those OEs that provided comments are included.

12
This report is available at no cost from the National Renewable Energy Laboratory (NREL) at www.nrel.gov/publications.
ahead forecast expanded from covering one day to nine days; and Turlock’s day-ahead forecast expanded from covering five days to seven days.
• Interest in long-term forecasts remains moderate. Five companies (APS, Glacier Wind, SCE, Turlock, and Xcel Energy) have a long-term forecast, ranging from a week ahead to a year ahead. The frequency with which these forecasts are updated varies from every 15 minutes to daily.
Table 4. Forecast Timeframes
Operating Entity Short-Term Forecast Medium-Term Forecast Long-Term Forecast
AESO Hourly, updated every 10 minutes
Day-ahead, covers 7 days ahead, updated every 6 hours
APS Real-time and hourly, updated every 15 minutes
Day-ahead, covers 3 days ahead, updated every hour; solar day-ahead adjusted as needed
Week-ahead, updated daily; also monthly, quarterly, and annually for load and all generation
BPA Hourly, covers 7 days, updated hourly
CAISO
Hourly, covers next 7 hours, delivered 15 minutes after each hour and at least 1 hour and 45 minutes before real-time
Day-ahead, covers 9 days ahead, delivered by 5:30 a.m.
Glacier Wind
Short-term, updated as often as reasonable (10-minute average data); hour-ahead covers 86 hours ahead
Day-ahead Week-ahead
Idaho Power Hour-ahead, covers up to 6 hours ahead; updated hourly
Day-ahead Monday through Thursday, 3 days ahead for weekends; up to 5 days ahead if there is a holiday
PG&Ea See CAISO for wind See CAISO for wind; third-party day-ahead forecast under trial
Long-term forecast used internally
PGE Receives short-term forecast Receives medium-term forecast
PSE Hour-ahead, updated every 10 minutes
Day-ahead, extends out to 7 days
Monthly forecast used to plan outages
SMUDa Hour-ahead solar forecast covers 5 days, updated hourly; see CAISO for wind
SCEa
Hourly, covers 168 hours ahead, updated every 10 minutes; also participates in CAISO’s PIRP for wind
Day-ahead, provides hourly values up to 168 hours ahead, updated every 8 hours
Month-ahead, covers a rolling 30-day period, updated once daily
Turlock Hour-ahead, updated hourly Day-ahead, covers 7 days
Xcel Energy 3 hours ahead with 15-minute granularity, updated every 15 minutes
Week-ahead, updated every 15 minutes with hourly granularity
Note: In many cases, one type of forecast may cover all three timeframes. a Also receives the PIRP forecast.

13
This report is available at no cost from the National Renewable Energy Laboratory (NREL) at www.nrel.gov/publications.
3.1.4 Scopes and Types of Forecasts An OE’s characteristics determine the geographic scope that is most useful for its VG forecasts (see Table 5). Some focus narrowly on individual plants or commercial pricing nodes while others forecast multiple balancing areas. As companies’ VG portfolios have grown, so have their forecasting needs. In 2012, five respondents used solely individual plant forecasts because they owned or managed just one VG plant. Today, every respondent uses both individual plant forecasts and forecasts that cover their entire utility or balancing areas.7
CAISO, PGE, and SCE rely on regional forecasts, though each uses this term in a distinctive manner. CAISO forecasts for all its California units, in part to prepare for the EIM it is planning with PacifiCorp. (Nevada Power Company announced its interest in joining this EIM, pending regulatory approval.) PGE views the forecast it receives from BPA as a regional forecast. SCE is developing the ability to forecast by wind region (e.g., Tehachapi, San Gorgonio) and by solar region (i.e., a geographic area with significant solar generation, such as the L.A. Basin), and then use these forecasts as the basis for cost-effective, site-specific, and DG forecasts.
Forecasting for commercial pricing nodes is rare in the West. Xcel Energy’s operations (in Colorado, Minnesota, New Mexico, North Dakota, South Dakota, Texas, and Wisconsin) include operations in MISO and the Southwest Power Pool (SPP). It forecasts for commercial pricing nodes in MISO.
Table 5. Scope of VG Forecasts
Operating Entity
Individual Wind or Solar
Plant
Individual Utility or
Balancing Area
Commercial Pricing Node Region
AESO X X APS X X BPA X X X CAISO X X X Glacier Wind X X Idaho Power X X PG&Ea X X PGE X X X PSE X X SMUDa X X SCEa X X X Turlock X Xcel Energy X X X
a Also receives the PIRP forecast.
Table 6 shows the types of forecasts that each company uses.8 Nearly all of the OEs report using an NWP model, persistence, and statistical analysis in preparing their forecasts. Seven OEs rely on weather situational forecasts.
7 SMUD’s forecasts also come from 74 individual weather stations. 8 For OEs using third-party forecasters, interview results may underestimate which forecasts are being prepared because the interviewee may not be aware of every forecast available to his or her respective company.

14
This report is available at no cost from the National Renewable Energy Laboratory (NREL) at www.nrel.gov/publications.
Separate ramp forecasts may be falling out of favor. AESO cancelled its ramp forecast and two others (BPA, Idaho Power) stated that ramps can be anticipated using short-term forecasts. Indeed, Idaho Power states their forecast captures wind ramps fairly well, although the exact time of the ramps may be slightly off. As long as they know a ramp is coming, Idaho Power said it is not critical if the ramp is an hour early or an hour late.
In contrast, SCE is testing a ramp forecast and CAISO is continuing to work on a ramp forecast tool with funding from the California Energy Commission. The current forecasting capabilities (for VG as well as for load served by DG) are inadequate to allow wholesale market mechanisms to efficiently address flexibility needs throughout the operating day. To assist operators in making informed decisions to minimize potential reliability concerns that arise from the lack of renewable resources, the CAISO, in conjunction with the Pacific Northwest National Laboratory, developed a ramping tool. This ramping tool uses the most up-to-date load forecast, wind forecast, resources committed through the various market runs, generator-forced outage information, and related stochastic relationships between the input datasets. The ramping tool visually displays the ability of committed dispatchable resources to meet expected load and variable ramp requirements within a user-specified confidence band.
Xcel Energy is experimenting with technologies such as Doppler radar incorporation in order to better predict ramps. Xcel Energy also relies on extreme temperature notifications that would cause wind turbines to trip off-line. For example, wind turbines will trip off at temperatures of minus 20°F or lower, or 105°F and higher.
Table 6. Types of VG Forecasts Being Prepared
Operating Entity Persistence NWP Model Statistical Weather
Situational Rampa
AESO X X Discontinued APS X X X X X BPA X X X X CAISO X X X X To come Glacier Wind X X X X X Idaho Power X X X PG&Eb X X X PGE X X X PSE X X X X SMUDb X X X X SCEb X X X X In trial Turlock X X Xcel Energy X X X
a The definition of a VG ramp event can influence the number of VG ramps, particularly the time period for defining a ramp. The number of ramps will increase if the time period for a ramp is 60 minutes as compared to 30 minutes, for instance (Ahlstrom et al. 2011). b Also receives the PIRP forecast.
OEs report using persistence forecasts in particular for different applications. PGE uses a persistence-based forecast for the schedules it provides to BPA (which integrates PGE’s wind) every 30 minutes. Xcel Energy blends persistence into its short-term (under 3 hours) forecast from 15 minutes to 3 hours, relies on persistence for time horizons less than 15 minutes, and relies on NWP-based forecasts for time horizons 3 hours and beyond. PG&E also melds persistence with its NWP forecasts, though it uses persistence less with solar since cloud cover is
15
This report is available at no cost from the National Renewable Energy Laboratory (NREL) at www.nrel.gov/publications.
transient. Idaho Power uses persistence as part of its hourly wind forecast. CAISO uses persistence as part of an internally-created real-time VG forecast while SMUD uses persistence for its solar forecast. Five OEs (AESO, BPA, Glacier Wind, PSE, and SCE) also use persistence as a means of evaluating the performance of third-party forecasting companies.
Use of weather situational forecasts is similarly diverse. Glacier Wind examines radar, regional surface analysis maps, and other weather products to aid in preparing situational forecasts. PSE has a meteorologist on staff to help interpret its situational forecasts before they are integrated with other forecasts. CAISO assesses weather patterns that can help predict VG ramps.
PG&E is also exploring the use of neural networks—an advanced form of statistical modeling which involves computational learning systems (NERC 2010). PG&E says neural networks are common in load forecasting but so far, more “traditional” forecasting approaches have outperformed neural networks in VG forecasting, which tend to require large training sets to perform well even under the best conditions.
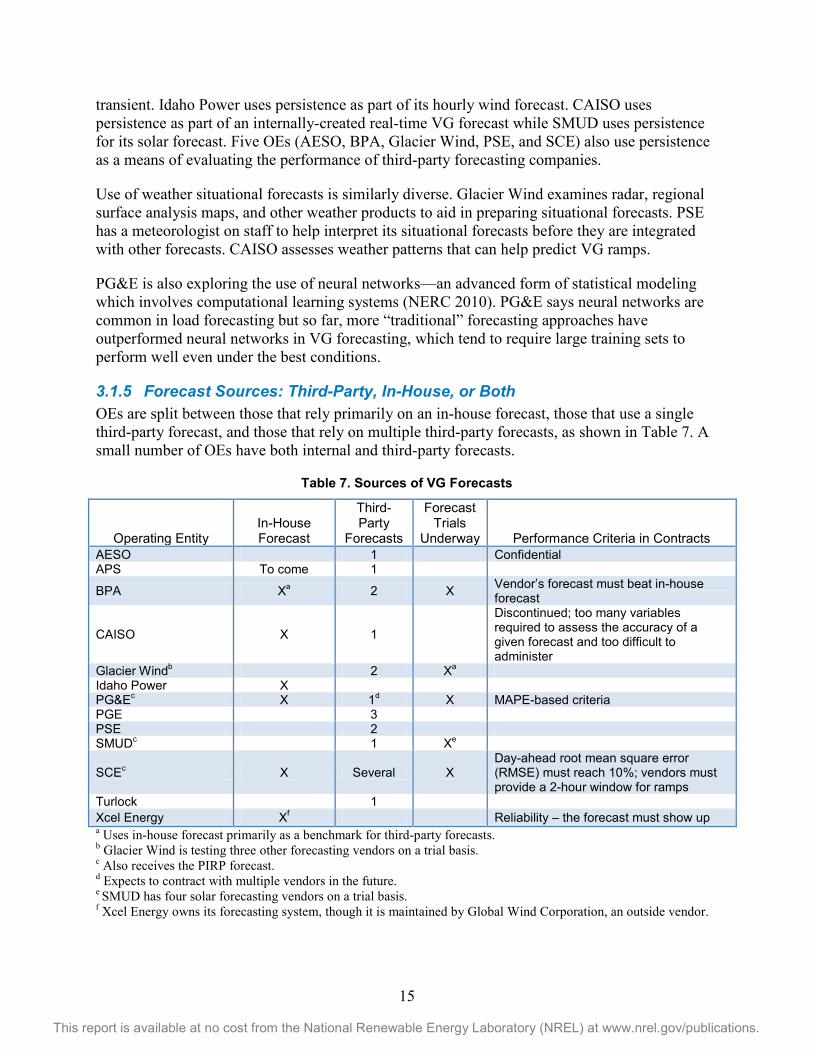
3.1.5 Forecast Sources: Third-Party, In-House, or Both OEs are split between those that rely primarily on an in-house forecast, those that use a single third-party forecast, and those that rely on multiple third-party forecasts, as shown in Table 7. A small number of OEs have both internal and third-party forecasts.
Table 7. Sources of VG Forecasts
Operating Entity In-House Forecast
Third-Party
Forecasts
Forecast Trials
Underway Performance Criteria in Contracts AESO 1 Confidential APS To come 1
BPA Xa 2 X Vendor’s forecast must beat in-house forecast
CAISO X 1
Discontinued; too many variables required to assess the accuracy of a given forecast and too difficult to administer
Glacier Windb 2 Xa Idaho Power X PG&Ec X 1d X MAPE-based criteria PGE 3 PSE 2 SMUDc 1 Xe
SCEc X Several X Day-ahead root mean square error (RMSE) must reach 10%; vendors must provide a 2-hour window for ramps
Turlock 1 Xcel Energy Xf Reliability – the forecast must show up a Uses in-house forecast primarily as a benchmark for third-party forecasts. b Glacier Wind is testing three other forecasting vendors on a trial basis. c Also receives the PIRP forecast. d Expects to contract with multiple vendors in the future. e SMUD has four solar forecasting vendors on a trial basis. f Xcel Energy owns its forecasting system, though it is maintained by Global Wind Corporation, an outside vendor.

16
This report is available at no cost from the National Renewable Energy Laboratory (NREL) at www.nrel.gov/publications.
As the costs of forecasts have fallen, OEs are increasingly conducting trials with vendors, adding new vendors to their roster, or switching vendors. Glacier Wind conducted trials with ten wind providers over the past five years. It currently has two vendors under an annual contract and three vendors under 3- to 6-month trials. BPA has utilized forecasts from five external vendors over the past four years. It uses short 1- or 2-year contract cycles because it assumes the industry is changing quickly. BPA gives vendors a standardized observation data page, which includes standardized units for data to which vendors must adhere. Vendors must deliver their forecasts (also in a standardized format) to a single point at BPA, which feeds into all other BPA systems.
SMUD has four solar forecasting trials underway and one contract in place. The trials are one year long and are available to SMUD at a discounted price. SMUD plans to use as many forecasts as it can on an ongoing basis. PG&E is moving in the direction of multiple vendors, probably as soon as 2014. It believes some vendors may be better suited for wind than solar, as well as possibly having complementary strengths with regard to short-term or long-term forecasting or different geographic features such as mountains, valleys, etc. APS is considering alternative wind forecast providers and evaluating the market for solar forecasts. In the meantime, it is developing an in-house solar forecast. (APS feels that the facility-based pricing structure for solar forecasts needs to be re-evaluated. Such a fee structure makes sense for 100-MW wind facilities, but it is not applicable for multiple 7- to 15-MW solar facilities.)
The internal costs associated with changing VG forecasters, however, can be significant. SCE is reluctant to break ties with vendors with whom it has developed and trained models.
3.1.6 Use of Ensemble Forecasts and Confidence Intervals Ensemble forecasts can refer to either a number of wind forecasts from multiple forecasting companies or multiple forecasts from the same model and the same vendor, with small perturbations in the initial conditions of the model.
A confidence interval (CI) provides a range of likely values for VG power output. For example, a 97.5% CI indicates that the actual value will fall within the interval 97.5% of the time. CIs are used to indicate the reliability of a given forecast.
Almost every interviewee views ensemble forecasts and CIs positively. Roughly half receive CIs with their forecasts, and the rest are planning to or considering doing so, as shown in Table 8.

17
This report is available at no cost from the National Renewable Energy Laboratory (NREL) at www.nrel.gov/publications.
Table 8. Use of Ensemble Forecasts and Confidence Intervals
Operating Entity
Use of Ensemble Forecasts
Use of Confidence
Intervals Confidence
Interval Range Forecast Details
AESO X X 10% and 90% Receives 13 forecasts, which can be grouped for short-term forecasting.
APS X
BPA Discontinued X Will soon receive forecasts with probability distributions, in addition to CIs.
CAISO X To come Considering 90%
Glacier Wind X X Uses multiple forecasting providers
who each use ensemble forecasts.
Idaho Power X To come
Conducts four model runs, spaced 6 hours apart, for both day-ahead and hour-ahead models. Weights each run equally.
PG&Ea To come X PGE X X 90% PSE To come X 80%
SMUDa In trial X 80%
Evaluating probabilistic forecasting. Very interested in getting 5-minute maximum and minimum values for each hour.
SCEa X X 10% increments
Combines forecasts from multiple vendors.
Turlock X X 80% Xcel Energy X 75% a Also receives the PIRP forecast.
OEs use various approaches for interpreting CIs. AESO’s dispatchers prefer to use the likeliest value rather than a CI. SMUD’s operators use a rule-of-thumb: if all three forecasts show consensus, trust them; if not, schedule the full amount of regulating reserves.
Ensemble forecasts can be challenging as well. PSE hopes to bridge the ensemble forecasts it receives from multiple vendors in order to better inform its reserve-related decisions. BPA, on the other hand, has developed an algorithm to choose a “winning” forecast for each hour, instead of using ensemble forecasts. This so-called “Super Forecast” methodology evaluates each of its vendor’s performances every hour at each of the 31 wind plants in BPA’s service area over the past seven days. Whichever vendor’s forecast has been most accurate during the Hour 1 time slot is chosen as BPA’s official forecast for the next day’s Hour 1, and so forth. This allows vendors to specialize in a time horizon, geographic location, or weather regime.
Xcel Energy has begun an R&D project focused on probabilistic forecasts. It is developing a new methodology to combine the uncertainty inherent in multiple forecasts and model runs into one global uncertainty value. If the R&D results are promising, Xcel Energy may create protocols that will specify percent exceedance values under different conditions. Xcel Energy cautions that they are at a very early stage with their research.

18
This report is available at no cost from the National Renewable Energy Laboratory (NREL) at www.nrel.gov/publications.
3.1.7 Forecasting Accuracy About half of the OEs interviewed track their performance and were willing to share information. The most common metric used remains mean absolute error (MAE), though a wide variety of other metrics and factors are of interest to companies, including: bias (Glacier Wind, PGE, PSE), ability to use a forecast during both clear and cloudy days (SMUD), and performance during extreme weather (BPA, Glacier Wind).
Some OEs (AESO, Glacier Wind, SCE, Turlock, and Xcel Energy) are experiencing improvements in forecasting accuracy over time. They credit these gains to a variety of factors, including: improved forecasting techniques and models; awareness of the need for forecasting (CAISO); seasoned vendors (SCE); and growing portfolio size (Xcel Energy), which acts to smooth variability in output from VG and makes forecasting easier.
Table 9 summarizes performance information for companies that shared specific values in this reporting cycle. Comparison values are included, when available. Caution should be used in interpreting and comparing the data in Table 9. Several companies interviewed (AESO, Glacier Wind, Idaho Power, SCE) stressed that wind power forecast performance varies significantly (5% or more of the installed capacity) because of location, season, and weather regime.
Table 9. Assessments of VG Forecasting Accuracya
Operating Entity 2011 Values (if available) 2013 Values
AESO Historical Average since January 2010: Day-ahead MAPE: 13%
Historical Average since January 2010: Day-ahead MAPE: 12.8% 2-hour ahead MAPE: 7%
CAISO Historical Average: Day-ahead MAE: <15% (wind)
Historical Average: Day-ahead MAE: <10% (wind)
Glacier Wind
Hour-ahead MAE: 10% better than persistence, at best
Hour-ahead MAE: 20-25% better than persistence Critical Success Indexb: high 40s
Idaho Power
April-August 2011: Day-ahead MAE: 12.2%
Day-ahead MAE: 13% Hour-ahead MAE: 6.5%
SCEc Two to Three Years Ago: Day-ahead RMSE: 13-20% Day-ahead RMSE: 8-13%
Xcel Energy MAE: ~9.8% a All values express a percentage of installed capacity. Time periods provided when available. b Critical Success Index is used to evaluate how well forecasts anticipate important threats, such as ramps. It is calculated as the ratio: (hits) / (hits + false alarms + misses). c Also receives the PIRP forecast.
Several OEs shared more general information about the types of metrics they use, goals they set, and progress they have seen to date, as shown in Table 10.

19
This report is available at no cost from the National Renewable Energy Laboratory (NREL) at www.nrel.gov/publications.
Table 10. General Approaches to Assessing Forecasting Accuracy
Operating Entity
Primary Accuracy Metrics Comments
BPA Actual hourly error
and monthly average plant error
Less interested in raw accuracy values than how wind affects balancing reserves and how these reserves, in turn, affect hydro supplies. Conducts case studies of extreme weather situations.
CAISO MAE Currently striving to push day-ahead MAE below 10% for wind. Establishing a baseline for solar accuracy in order to set goals in the future. Expects solar to be in the <8% MAE range.
Glacier Wind
MAE, bias, and Critical Success
Index
Evaluates if the MAE of vendor forecasts is better than persistence, if bias is less than 1-2% of capacity, and if the Critical Success Index is better than other vendors.
PG&Ea MAE, bias
Error matters more in one direction than another; if forecast is asymmetric in “wrong” direction, PG&E opts not to use it. PG&E is currently comparing the accuracy of its third-party day-ahead forecasts versus PIRP.
PSE MAE, RMSE Tracks turbine performance and forecast accuracy relative to persistence, in addition to MAE and RMSE.
SMUDa MAE, RMSE
Has found its day-ahead solar forecast is sometimes better than the 6-hour and 2-hour versions. Hour-ahead is the most accurate, probably due to blend of forecast and persistence. Wants to develop metrics that will help traders build trust in the forecast. May track: error versus capacity, error over a given timeframe, and error during cloudy periods. Nothing has been finalized.
a Also receives the PIRP forecast.
3.2 FERC Order No. 764 and Sub-Hourly Scheduling 3.2.1 The Impact of FERC Order No. 764 on Forecasting FERC Order No. 764, issued in June 2012, is intended to remove barriers to the integration of VG. It requires transmission providers to offer intra-hourly transmission scheduling as an option for their customers. It also requires new interconnection requests from customers with large variable generators to provide meteorological and forced outage data to their transmission utility, if the utility undertakes VG forecasting.
Order 764 compliance filings to FERC were made in November 2013. When OEs were asked (in September 2013) about Order 764’s impact on forecasting, most were just beginning to prepare their filings and could not share any details. A few OEs answered this question directly, while others shared thoughts on the expected impact of Order 764. In general, companies had either already undertaken some of the measures in Order 764 or tended to see Order 764 as having a relatively minor impact on their businesses, as shown in Table 11.

20
This report is available at no cost from the National Renewable Energy Laboratory (NREL) at www.nrel.gov/publications.
Table 11. Initial Views on FERC Order No. 764’s Expected Impact on Forecasting
Operating Entity
Type of Impact Comments
APS Forecasting
Currently negotiates for data through Power Purchase Agreements (PPAs). Will be able to require data from large VG generators during the interconnection process once Order 764 goes into effect. However, almost all VG generators are small.
BPA None Wind build-out, wind power forecasting efforts, and data requirements were already in place prior to Order 764.
CAISO Forecasting, Scheduling
Moving to 15-minute scheduling and a rolling, 5-minute persistence-based forecast by April 2014. Forecast will largely replace PIRP, which will only be available to current users.a Also working to establish CAISO-PacifiCorp EIM.
Glacier Wind Scheduling Stands to benefit significantly from sub-hourly scheduling, which will allow it to schedule more accurately and buy fewer reserves.
PG&Ea Forecasting, Scheduling
Expects that the CAISO’s 5-minute forecast will replace self-scheduling in both 5- and 15-minute markets.
PGE Forecasting Hopes more forecasters will provide sub-hourly, 15-minute forecasts.
SMUDa None Has no independent plans to change forecasting, but expects CAISO will change rules and practices that affect SMUD.
SCEb Scheduling
Cannot beat persistence over 15-minute timeframe. Anticipates more VG in the day-ahead market. (Currently, companies avoid imbalance or scheduling penalties by only scheduling a percentage of the wind or solar they could provide.)
Turlock N/A Will be unaffected because it sells its wind using long-term contracts. Xcel Energy None Already using 15-minute forecasts. a Also receives the PIRP forecast. 3.2.2 The Impact of Sub-hourly Scheduling or Dispatch on Forecasting There is a widespread view among responding OEs that nothing beats a persistence forecast in the 0-to-45-minute timeframe, thus sub-hourly scheduling or dispatch would have very little impact on OEs’ use of VG forecasting. A handful of OEs expressed views on the merits of sub-hourly markets or discussions in the West about EIMs, as shown in Table 12.

21
This report is available at no cost from the National Renewable Energy Laboratory (NREL) at www.nrel.gov/publications.
Table 12. Initial Views on the Impact of Sub-hourly Scheduling or Dispatch on Forecasting
Operating Entity
Interest Level Comments
APS Interest Evaluating the value of moving to a 15-minute market, as that would lower the amount of reserves that are needed. Also evaluating the benefits of a balancing market.
BPA Neutral Expects 15-minute scheduling will be addressed in BPA’s next rate case but not sure when it would be operational.
CAISO Neutral Anticipates the forecast/scheduling of VG to be much more accurate than the past forecast delivered 105 minutes before the operating hour.
Idaho Power Disinterest
Would need to revamp its forecast model, which assumes hourly scheduling. To accommodate 15-minute dispatch, for instance, the model would rely 90% on persistence. This would make the model less well-equipped to handle ramps.
PGE Neutral
Sub-hourly scheduling would help mitigate wind forecast errors and PGE would use 15-minute forecasts based on persistence. Participated in a BPA pilot program with 30-minute scheduling, but a lasting market failed to form. PGE said there was too much unknown risk in balancing plants during the final 30 minutes of each hour.
PSE Interest Believes sub-hourly scheduling will improve efficiency in several respects: following load and wind, reducing imbalance, and forecasting VG.
SMUDa Neutral Considering the impact of moving to a 15-minute market and of participating in the CAISO-PacifiCorp EIM. Could be supportive of an EIM if it does not layer on additional fees and costs.
SCEa Neutral Believes the CAISO will be the recipient of newer information across the span of an hour. Generators should be able to true-up more accurately and provide increased wind and solar output with faster scheduling.
Turlock Neutral Already using 30-minute scheduling with BPA, on occasion, to avoid penalties.
Xcel Energy Supportive Already uses 15-minute forecasting. a Also receives the PIRP forecast. 3.2.3 VG Forecasting in Control Rooms Table 13 provides an overview of how VG forecasts relate to control room systems and personnel.

22
This report is available at no cost from the National Renewable Energy Laboratory (NREL) at www.nrel.gov/publications.
Table 13. Use of VG Forecasting in Control Rooms
Operating Entity
Display of Forecast in
Control Room
Integration of Forecast into EMS Training for Grid Operators
Operator Familiarity
with Forecast
AESO X X None APS X Xa On-the-job, yearly, by external forecaster BPA X Situational awareness X CAISO X On-the-job and courses X Glacier Wind X X Idaho Power X X On-the-job X PG&Eb X On-the-job X PGE X To come To come X PSE X SMUDb Rules-of-thumb SCEb X X On-the-job and by external forecaster X Turlock None X Xcel Energy X At least once X a Has integrated wind but not solar, yet. b Also receives the PIRP forecast.
As shown in Table 13, almost every OE interviewed displays VG forecasts in their control rooms. Typically, these are automated feeds (Idaho Power, PGE, SCE, Xcel Energy), sometimes provided by third-party forecasters. These displays are often accompanied by real-time weather (APS, BPA, and CAISO) or real-time generation (PG&E). VG forecast updates can happen as frequently as every minute (PGE) with 10-minute updates mentioned by BPA.
The majority of respondents (9) have not integrated forecasts into EMS tools, often because it would have little relevance. Glacier Wind and Xcel Energy use their EMSs to monitor real-time generation. As long as SMUD continues to use hourly scheduling, its dispatchers make no real-time decisions on solar. PG&E is not currently acting as a balancing authority, thus it has no need for an EMS. BPA does not own any wind plants; instead, approximately 80% of the wind in BPA’s control area is exported in flat block schedules.
Four interviewees have integrated forecasts into their EMSs, and the trend may be toward doing so. AESO incorporates its short-term forecast (up to 12 hours ahead) into a Dispatch Decision Support Tool (DDST) which is connected to their EMS. APS ties its wind forecast into its EMS to determine current generation levels, and is working on integrating a solar forecast as well. Idaho Power incorporates its day-ahead forecast in its EMS. SCE believes its forecast is tied into its EMS to provide information on loads and weather situations. PGE is working on a program and a tool to integrate its forecast.
3.3 System Operator Training 3.3.1 Training on VG Forecasting Training for system operators varies from non-existent to annual, with a fairly strong split between those OEs that rely on on-the-job learning and those that schedule regular trainings. APS and SCE mentioned having taken advantage of orientations provided by third-party

23
This report is available at no cost from the National Renewable Energy Laboratory (NREL) at www.nrel.gov/publications.
forecasters. PGE said they plan to introduce forecasting training in the next year or so. Turlock trains its traders but not its dispatchers.
More often, staff members coach their colleagues on an as-needed basis. For example, SMUD’s energy traders teach its operators a rule-of-thumb: if the forecast is clear above a certain threshold, use the forecast; if it is cloudy, discard the forecast and schedule regulation to cover the entire solar capacity. BPA, Idaho Power, PG&E, and Xcel Energy describe fairly similar goals for peer coaching: ensure that operators understand the concept of a VG forecast and can read or interpret the ones to which they have access.
Only two OEs have regular training protocols for operators. APS runs summer prep sessions where staff members refresh their understanding of forecasting and learn about any updates to the company’s systems. The CAISO runs a course on the basics of forecasting every six months, and has recently expanded the course’s emphasis on solar forecasting. The CAISO also puts new operators through a 6-week orientation, which includes a wind ramping simulation.
Four OEs (CAISO, Idaho Power, PSE, and Xcel Energy) have a meteorologist aid in interpreting VG forecasts. Idaho Power stresses that this is especially important if a company hopes to create an in-house forecast.
3.3.2 Sense of Familiarity with VG Forecasting Seven of the eleven OEs interviewed for the 2012 report had initiated VG forecasting in the preceding four years, and were still learning how to use it. With the passage of time, most of the OEs interviewed for this report say their operators have developed a sense of familiarity with VG forecasts (APS, BPA, Glacier Wind, Idaho Power, PGE, PG&E, SCE, Turlock, and Xcel Energy). For Xcel Energy, familiarity involves understanding time shifts before and after a wind forecast. It has become rare, for example, to hear complaints from system operators that the wind was “supposed to be” 900 MW by a given time. Instead, operators now comment that wind production will reach 900 MW in the near future. Xcel Energy said there is still substantial uncertainty with scheduling wind in the near-term, especially if large changes in wind production are expected. For Glacier Wind, familiarity involves anticipating a drop in wind production when wind is at its peak—even if the forecast predicts otherwise. APS and Glacier Wind both caution that familiarity does not necessarily mean comfort.
AESO and SMUD indicate that their operators are still in the process of becoming more comfortable with their forecasting systems. At Turlock, familiarity is a function of turnover—a factor which may be at play throughout the industry. Turlock’s dispatchers work 12-hour shifts, thus many move on quickly to other roles within the company. This pattern contrasts with Turlock’s traders, who not only are familiar with VG forecasts, but are somewhat competitive about using them effectively. One trader looks at BPA, third-party, and persistence forecasts and weights them based on historical performance and weather conditions. Another trader has developed a matrix of projected wind power output at measured wind speeds from 1 to 22 meters per second. The matrix needs to be updated but is still in use.

24
This report is available at no cost from the National Renewable Energy Laboratory (NREL) at www.nrel.gov/publications.
3.4 Costs and Benefits 3.4.1 Forecasting Costs Without providing hard numbers, many of the companies interviewed say that forecasting costs have gone down dramatically since they were initially interviewed in 2012. For example, Turlock is paying less than it did in 2012 for forecasts that are far more accurate. Several OEs confirm that a “ballpark” cost of $300-400 per month per plant is the new norm for forecasting fees. Some OEs (including SMUD and Xcel Energy) are concerned that competition among third-party forecasters is so fierce that few are committing funds to R&D. If this is the case, it could impact the rates of improvement in forecasting accuracy noted earlier.
Solar forecasting may present a unique challenge because the smaller size of solar facilities, particularly for distributed solar, can make a per-facility charge untenable. APS thinks a regional forecasting model may work better. Solar generation affects load—which itself is aggregated in APS’s system—and system variability. In both cases, a regional forecast might be as useful as a site-specific one.
Only a small number of respondents are passing through some or all of their forecasting costs to generators. Since 2012, BPA has begun recovering its costs through the Variable Energy Resource Balancing Service (VERBS) charge. Idaho Power has begun charging generators for a portion of its in-house forecasting costs. The CAISO continues to charge the market via a Grid Management Charge of 10 cents per megawatt-hour (MWh). AESO also continues to pass through forecasting costs to generators. However, AESO socialized the cost of its new DDST, which it uses in conjunction with forecasts. Glacier Wind and Turlock own the wind facilities for which they need forecasts, making VG forecasting an internal cost of doing business. The remaining OEs may simply consider the cost of forecasts minor enough not to warrant pass-through charges.
3.4.2 Cost-Benefit Analysis In the past two years, there has been a striking shift away from viewing forecasting in a cost-benefit framework. Instead, many OEs (AESO, BPA, Idaho Power, PG&E, PGE, and SCE) simply view forecasts as a basic necessity—vital for meeting reliability requirements and scheduling resources efficiently. For instance, without a forecast, PGE used to assume no wind when performing intra-day scheduling. PGE says just one day without such hedging probably covers its yearly costs for forecasting. AESO views forecasting as a “no brainer;” wind is the most VG in AESO’s portfolio, and forecasting simply makes sense. APS notes that many benefits are not easily quantified, such as improving the ability of schedulers to reorient the schedules in real-time or to schedule outages. BPA continues to use forecasts to meet non-power objectives such as compliance with the Clean Water Act and the Endangered Species Act. Lastly, Idaho Power believes too many variables would be required to quantify forecasting’s impact on its use of hydro power.
At the same time, a number of OEs continue to conduct cost-benefit analyses or are planning to do so. Xcel Energy continues to track the value of a 1% reduction of MAE in its forecasts within each of its markets. In the Public Service Company of Colorado (PSCo) region, a 1% reduction is worth $1.3 million annually. In the Southwestern Public Service Company (SPS) region, the same 1% reduction is worth $250,000 annually. Xcel Energy anticipates the benefits of

25
This report is available at no cost from the National Renewable Energy Laboratory (NREL) at www.nrel.gov/publications.
forecasting in the SPS region will increase with the adoption of an LMP market in the Southwest Power Pool (SPP) in March 2014. SCE said costs are not substantial and that they have seen significant return on investment (ROI) from improved scheduling and market purchases or sales. PG&E intends to test new forecasting vendors and plans to prepare an internal report that will compare the monetary benefits of each forecaster’s day-ahead forecast. SMUD also hopes to perform a cost-benefit evaluation.
3.4.3 Analyzing Potential Reductions in Flexible Operating Reserve Requirements
Several OEs believe forecasting has led to lower flexible reserve requirements, but no one has performed formal calculations.9 AESO is buying the same amount of reserves (165 MW, on average) as it did five years ago while its wind portfolio has doubled in capacity. AESO is exploring how to use wind forecasting to optimize the amount of regulation it needs as wind capacity grows. BPA is now using VG forecasts as an input for determining how much additional balancing reserves it needs at certain times for full service customers. SMUD is working on a reliability-based integration study for wind. Its goal is to better understand what reserves and resources will be needed to meet NERC standards while reaching its renewables goal of 50% by 2030.
For two study participants, the question of operational reserve requirements has little relevance. PG&E belongs to CAISO and thus is not responsible for operating reserves. Similarly, Turlock’s wind plant is not in its service area, so it does not have to be concerned with providing operating reserves.
3.5 Data Collection 3.5.1 Data Requirements for Wind Table 14 shows the data OEs require of wind generators. Since 2012, companies have made small additions, at most, to the types of data they require and track. For example, Xcel Energy now receives temperature data, and the CAISO now uses wind data to derive wind turbine power curves. On a related note, AESO and BPA have made strides in gathering real-time, or close to real-time, information. AESO spent 18 months ensuring that wind data reporting is automated. BPA now receives plant capacity information every 10 minutes along with information on plant operating limits and high-speed cut-outs. In the past, BPA would assume nameplate plant capacity, an assumption that was their largest source of systemic error. Having information on outages and dynamic output has greatly improved BPA’s forecast.
9 Some OEs do estimate the reserves needed with and without VG forecasting, but this tends to be in the context of looking at future loads and resources.

26
This report is available at no cost from the National Renewable Energy Laboratory (NREL) at www.nrel.gov/publications.
Table 14. Wind Data Required from Variable Energy Generators for Forecasts
Required Data AESO
APS
BPA
CAI
SO
Gla
cier
Win
d
Idah
o P
ower
PG&
Ea
PGE
SMU
Da
SCEa
Turlo
ck
Xcel
Ene
rgy
Wind speed and direction X X X X X X X X X X X X Temperature X X X X X X X X X X X X Barometric pressure X X X X X X X X X X X Turbine location (latitude, longitude) X X X X X X X X X X X X Turbine power output X X X X X X X X X X X X Turbine availability X X b b X X X X b X X X Turbine outage X b b X X X X X X X Wind turbine power curve X X c X c X X X X b
a Also receives the PIRP forecast. b Receives information for wind plant in total, not from individual wind turbines. c Derives an empirical power curve from wind production.
As in 2012, most respondents see the merit in gathering data from both meteorological (met) towers and plant-mounted sensors. Table 15 shows the status of requirements at each operating entity. Eleven require data from met towers and eight require data from sensors. AESO now asks for two met towers per site to ensure data are still collected if one met tower goes down. SCE is now receiving information from wind turbine anemometers, which are useful for gauging wind direction and can serve as a backup for met tower data.

27
This report is available at no cost from the National Renewable Energy Laboratory (NREL) at www.nrel.gov/publications.
Table 15. Requirements for Sources of Data for VG Forecasting
Operating Entity Met Tower
Plant-Mounted Sensors Other Requirements Comments
AESO X
Minimum of two met towers, data to be provided every 10 minutes, must be at hub height for new wind projects
Requires data from met towers, as data from plant-mounted sensors can be affected by the wind turbine blades. Asks for two met towers to avoid problems when one is out of commission.
APS X X Uses data from either towers or sensors.
BPA X X
One met tower per wind plant and data from a sample of nacelles at 80-meters
Every 10 minutes, wind plants must send operating capacity plant operating limit for feathering or curtailment, and high speed cut-off point.
CAISO X X Minimum of two met towers and data from turbines
Uses algorithm to select turbines for collecting data.
Glacier Wind X X Prefers met data, but collects data from individual turbine sensors as well. Also has an off-site met tower.
Idaho Power X (for new
wind projects)
Is not strongly in favor of either source, sees error associated with both.
PG&Ea X
PGE X X Has both met towers and plant-mounted sensors. Met towers not at hub height, so some scaling is necessary.
SMUDa Put in a met tower to help with forecasting.
SCEa X X One met tower for every 50 MW, may decrease to 25 MW
Requires data sources to be calibrated for accuracy at least once per year.
Turlock X X Has two met towers at its wind project.
Xcel Energy X (for new large wind projects)
X
a Also receives the PIRP forecast.
3.5.2 Data Requirements for Solar Solar data collection is still in its infancy. Just a handful of OEs have solar data requirements in place, as shown in Table 16.

28
This report is available at no cost from the National Renewable Energy Laboratory (NREL) at www.nrel.gov/publications.
Table 16. Solar Data Required from Variable Energy Generators for Forecasts
Operating Entity
Solar Irradiance or
Insolation Other Requirements APS X Utility-scale facility derates and forced outages. CAISO X Same weather info as for wind plants, plant measured irradiance, and
back-panel temperatures for solar PV farms.
PGE X Monthly or daily solar insolation requirements. Solar forecast not required yet.
PG&Ea X
SMUDa Availability of inverters, system characteristics (number of modules, modules per string, modules per inverter), orientation, and whether the solar system tracks the sun’s movements or is fixed.
SCEa X Inverter availability, smart inverters (when possible) to provide curtailment signals, weather sensors connected to an array.
Xcel Energy X At least temperature, solar insolation, and power output. a Also receives the PIRP forecast.
3.5.3 Data Collection Challenges and Desires As in the 2012 report, most interviewees are receiving all the data they need from generators through contract-based requirements. Small or older wind and solar projects remain a minor challenge for some OEs, and distributed sources present a new one. With regard to national resources (NOAA, National Center for Atmospheric Research (NCAR)), interviewees are primarily interested in improved foundational weather forecasting. Further details are provided below:
• AESO’s primary challenge is the quality of its data. Environment Canada’s data feed is 6 hours behind real-time conditions, so it cannot be of use to short-term forecasts. Granularity is also an issue, since the resolution of Canada’s NWP model averages 40 km. AESO hopes that by increasing the availability of real-time data and possibly using tools such Light Detection and Ranging (LIDAR) and Sonic Detection and Ranging (SODAR), the MAE can be improved.
• BPA spent two years in a collaborative process to design its data set and is in the process of updating customer data. Only a few customers have not yet been updated.
• CAISO is working toward providing data to NOAA to help the agency create a boundary layer forecast. (NOAA lacks instrumentation at the 80-meter level, which is most pertinent to wind forecasting.) CAISO hopes that other companies will begin sharing their data with NOAA as well.
• Glacier Wind is concerned that plans to decommission weather satellites will create a gap in coverage, which could last as long as three years.
• Idaho Power hopes NOAA can improve its Global Forecast System model which provides forecast values used in the company’s in-house model. In the meantime, Idaho Power is working with a graduate student from the University of Arizona to create forecasts with greater geographic specificity. Idaho Power is also incorporating data

29
This report is available at no cost from the National Renewable Energy Laboratory (NREL) at www.nrel.gov/publications.
requirements with newer PPAs to address past issues with data collection when data requirements were not contractual.
• PG&E in interested in any improvements to weather forecasts, not only for VG forecasting, but to better forecast hydro power and customer demand. Mainly, PG&E is focused on utilizing all the data it currently receives.
• SMUD would like additional information on short-term variability, though it does not know if weather products can be of help in this regard.
• SCE’s main challenge is gathering behind-the-meter data, though it would also like to impose stiffer penalties on generators through PPAs or pass-through charges from the CAISO. SCE needs more timely data from NCAR and NOAA.
• In general, Xcel Energy would like to get better turbine availability data. Xcel Energy gets data from 92% of the wind generators in PSCo, 85% in MISO, and 50-60% in SPS.
3.5.4 Incorporating Curtailments and Outages into Forecasts Most of the OEs interviewed (10) factor turbine availability and/or outages into their forecasts (see Table 17); they want forecasts that project the full (potential) value of wind or solar plants, even if they are curtailed.
Five interviewees incorporate curtailment information when calculating forecast metrics and conducting statistical training of their forecasts. Idaho Power’s reasoning for not doing so is mainly pragmatic: since curtailments are rare, Idaho Power does not believe changing its model—which has ten sites and seven coefficients per site—is worth the effort.

30
This report is available at no cost from the National Renewable Energy Laboratory (NREL) at www.nrel.gov/publications.
Table 17. Incorporating Curtailments and Outages into Forecasts
Operating Entity Outages/
Availability Curtailments Notes on Data Incorporated Update
Frequency
AESO X Real-time limits, turbine availability by plant, total plant availability, and wind power management limits
Every 10 minutes
APS X Planned turbine outages plant-wide, forced outages, and utility-scale solar limitations
Weekly
CAISO X X Equipment and plant availability Automated
Glacier Wind Neither—forecast for 100% availability is adjusted by Glacier Wind.
Idaho Power X Maintenance plans PG&Ea To come To come Continuous PGE X X PSE X X
SMUDa,b X X Scheduled outages, availability, output, and CAISO-identified curtailments
SCEa X X Turbine outages, availability, and plant potential Automated
Turlock X Turbine outages and availability Xcel Energy X Turbine outages a Also receives the PIRP forecast. a,b Data provided to PIRP. Xcel Energy continues to incorporate forecasts without adjustments for curtailment into an economic dispatch model. If the model projects wind curtailments, Xcel Energy may re-run the model after decommitting thermal units, then compare which solution is most economic. Xcel Energy orders economic curtailments with increasing frequency. Curtailment data are excluded from the data set used to train its models.
3.6 Solar Forecasting 3.6.1 Development of Solar Forecasts For many OEs in the West, solar capacity is too small to have a significant impact on grid operations. Some OEs profiled in this report, however, are beginning to work with solar forecasts. PG&E currently relies on PIRP for its solar forecasts. And, as noted in Section 3.2.4, SMUD has a contract with one third-party solar forecaster and is testing out four additional vendors. Four other interviewees are beginning to design and implement solar forecasting. Below is a general description of their efforts.10
Until recently, APS requested solar forecasts from each solar plant, but the forecasts were not always provided consistently or in a timely manner. Consequently, APS is now developing an in-house model that will integrate with its wind and distributed solar forecasting (discussed in the next section). The new model uses a Weather Channel cloud forecast, which provides a number from 1 to 10 for cloud severity. Based on historical production, APS can estimate utility-scale solar production fairly well—especially on days that are entirely clear or entirely cloudy. APS has yet to master days with a mix of sun and clouds, but expects that it can be accomplished.
10 PG&E currently relies on PIRP for its solar forecasts. As noted in Section 3.2.4, SMUD has a contract with one third-party forecaster and is testing out four additional vendors.

31
This report is available at no cost from the National Renewable Energy Laboratory (NREL) at www.nrel.gov/publications.
Through a series of studies—including one currently underway with DOE as a partial partner—APS is investigating solar generation levels on its system, solar’s current and future impact on variability and voltage, and the costs of mitigation measures.11 APS is also working with a consortium on solar forecasting.
Idaho Power has partnered with the University of Arizona to begin developing a solar forecast using solar irradiance values generated by weather models. Idaho Power anticipates that clouds will pose a major challenge in creating a day-ahead solar forecast; clouds drive production up and down significantly, yet weather forecasts can only warn of clouds in the near-term.
For the past few months, CAISO has been developing an in-house solar forecast. It is building climatology into an older solar forecast based solely on sun patterns. The hour-ahead solar forecast is primarily a persistence forecast as there is not much solar irradiance data in CAISO’s model just yet. CAISO’s day-ahead solar forecast draws heavily on the irradiance forecast from its third-party vendor, AWS Truepower. For weather data, CAISO load forecast relies, in part, on temperature, humidity, and barometric pressure readings from 30 NOAA stations in California provided by three different vendors.
SCE expects forecasting solar will be much easier than wind, at least in California. It plans to combine forecasting for non-utility solar plants and rooftop solar systems using a regional forecast introduced earlier in this report. SCE is developing a network of instruments that can gather data not only for non-utility and rooftop solar resources but also for wind plants. SCE would like to establish a public-private initiative to gather data collectively.
3.6.2 The Need to Forecast Distributed Solar Production Distributed generation itself is commonly “invisible” to system operators in the United States. These resources go unseen by system operators and usually cannot receive dispatch commands. This is particularly true for behind-the-meter resources connected at customer sites, which are netted out with the customer load.
Distributed generation is projected to grow swiftly over the next ten years. In California, for example, Governor Jerry Brown has set a goal of installing 12,000 MW of DG capacity (including, but not limited to, solar) by 2020. The CAISO already has over 2,000 MW of behind-the-meter solar generation and expects this number to rise sharply. Distributed PV solar systems must comply with IEEE Standard 1547 that requires DG systems to trip off-line in case of changes in frequency or voltage. Because DG is geographically dispersed in California, the CAISO believes that it is unlikely that all DG capacity will trip off-line at the same time. However, the CAISO is concerned that if there is a significant transmission outage, then there could be a number of islands with large amounts of DG that could be difficult to synchronize and reconnect to the CAISO system (KEMA 2011). These developments are prompting OEs to begin planning for more distributed solar generation and to consider how best to prepare a solar forecast.
Six of the OEs interviewed view developing methods to forecast distributed solar production as an imminent need (APS, CAISO, Idaho Power, SMUD, Turlock), and two see it as an eventual need
11 See http://www.aps.com/en/ourcompany/aboutus/investmentinrenewableenergy/Pages/studies.aspx.

32
This report is available at no cost from the National Renewable Energy Laboratory (NREL) at www.nrel.gov/publications.
(PG&E, PGE). SMUD anticipates that continuing reductions in the cost of solar will cause a spike in the installation of distributed solar systems. In SMUD’s service area, only the federal income tax credit is needed to make distributed solar systems economic. Some large solar projects have been proposed in Turlock’s service area. With a load of only 600 MW, Turlock believes there could be significant impacts on its system if the solar plants are developed. These include effects on tie lines due to utility scale expansion in the OEs that Turlock is interconnected with.
Xcel Energy believes distributed solar will eventually be another input into load forecasting models if distributed solar development continues to accelerate. However, Xcel Energy also believes utility-scale solar may outpace distributed solar systems. Colorado Public Utilities Commission in December 2013 approved Xcel Energy’s request to add 450 MW of wind and 170 MW of solar, stating that utility-scale solar is economic when compared to new natural gas power plants.
3.6.3 Estimating Production from “Behind-the-Meter” Solar Resources If solar forecasting is in its infancy, distributed solar forecasting is at an even more rudimentary stage. OEs are puzzling through what data they can access and how they can use them.
APS is developing the ability to look at distributed solar production data through advanced metering infrastructure (AMI) meters. Its AMI program began in March 2013, and thousands of AMI meters will be installed on both solar projects and for individual loads. APS wonders what the effect of distributed solar will be on reducing load and on the accuracy of load forecasts. APS’s load forecast is aggregated across its service territory; therefore, it is difficult to determine region-specific or local impacts of distributed solar on load. APS said there are a few hundred MW of distributed solar now, and it has seen some increase in ramp rates but overall load variability is still within historical values.
CAISO is working with Clean Power Research and State University of New York (SUNY) Professor Richard Perez on forecasting distributed solar. Perez has developed approaches to utilize imagery from weather satellites to infer the amount of solar energy available at any point in time and space. Meanwhile, Clean Power Research, with funding provided by the California Energy Commission, is collecting latitude, longitude, size, and orientation data for all rooftop solar systems under CAISO’s purview. CAISO is combining these resources and looking for patterns that could be used to create solar production forecasts.
PG&E can roughly estimate the number of DG solar projects in its service territory using data from the California Solar Initiative. The company uses these data to create a forecast for distributed solar, which influences PG&E’s estimate for net load. PG&E does not yet see a need to estimate reserves for distributed solar. PG&E may need a distributed solar forecast in the future and is concerned whether they are modeling distributed solar correctly.
SMUD is working on both top-down and bottom-up approaches to distributed solar forecasts. The top-down approach involves correlating aggregate solar output—derived from the meters that accompany 80-90% of the solar DG systems in SMUD’s territory—with irradiance measurements. This correlation can then be used to project future solar output using irradiance predictions in weather forecasts. The bottom-up approach involves modeling each solar system.
Xcel Energy is exploring different ways of forecasting load to account for the variability solar will add.

33
This report is available at no cost from the National Renewable Energy Laboratory (NREL) at www.nrel.gov/publications.
4. Improving VG Forecasting in the West Respondents’ advice to utilities who are developing forecasting practices has not changed dramatically since 2012, which is to start sooner rather than later as it can take time to plan, prepare, and train a forecast. BPA and CAISO stress setting realistic expectations since VG forecasts will often be wrong but will still provide value in informing users of expected changes in VG production, even if the time they occur is different than forecasted. PG&E advises using multiple forecasters since the various algorithms have different strengths. Glacier Wind advises tracking several performance metrics. Idaho Power cautions utilities to build within their means—both with regard to funds and expertise. In particular, it only makes sense to create an in-house forecast if one has a meteorologist on staff.
4.1 Coordination between Operating Entities In the 2012 report, companies expressed support for the idea of sharing forecasts, yet skepticism that the practice would grow without prodding. Today, the CAISO has begun working with PacifiCorp on a regional forecast to support their planned EIM. Beyond this development, opinion appears to be mixed. SCE has shared data and experiences with RTOs and OEs, and continues to do so. As mentioned earlier, SCE is also interested in forming regional data networks for VG forecasting. Turlock believes sharing regional forecasts could help optimize transmission and generation resources. PGE is generally supportive of sharing information and forecasts across the region, although the information would have to be aggregated at some level to avoid compromising contracts or releasing confidential information.
However, BPA, Glacier Wind, SMUD, Turlock, and Xcel Energy point out that sharing forecasts will not have much value unless OEs can trade or bid in reserves through EIMs or other comparable mechanisms. BPA believes this would require shared standards for calculating reserves or determining resource adequacy. APS and Idaho Power caution that for-profit OEs and forecasters may not want to share forecasts for competitive reasons. APS also said that because forecasting companies use different methodologies, sharing forecasts or data may not be feasible. On a purely practical level, sharing forecasts would have little relevance to AESO, whose neighbors simply do not have much wind, and BPA, whose wind resources are in the heart of its balancing area. BPA stated that if its wind resources were closer to neighboring OEs, effectively meaning that BPA and the OEs are “sharing” the same wind, then sharing VG forecasts may be worthwhile.
4.2 Potential Regional Actions Very little support was expressed for the creation of formal standards or guidelines for forecasting. (APS, SMUD, Turlock, Xcel Energy opposed it; the CAISO favored it.) Opponents said guidelines or standards would stifle innovation and impose “one-size-fits-all” methods on unique situations. APS does, however, believe that a document outlining the basic features of a forecast could be helpful. The CAISO would welcome high-level guidelines for telemetry. In particular, the CAISO would like to see more data from sensors at hub height. It thinks FERC should take the lead in this matter. Xcel Energy also believes some consideration should be given to how to treat wind forecasts in determining reserve requirements.

34
This report is available at no cost from the National Renewable Energy Laboratory (NREL) at www.nrel.gov/publications.
Several OEs have ideas for how the West could spur improvements in forecasting by continuing to support research-related activities. AESO would welcome assistance in evaluating accuracy measurements across OEs. The challenge is not only compiling such data, but comparing different metrics (e.g., MAE vs. RMSE) and exploring the underlying causes for differences such as territory size or data quality. Idaho Power supports the creation of a wind forecasting consortium, which is under consideration with the University of Arizona. Such a consortium would aid in research, developing data, and improving models. SMUD suggests funding forecasting improvements or creating a forecasting investment road map. SMUD indicated that solar forecasters are hesitant to invest in R&D because they are unsure whether a market for their product will materialize. An investment road map would address this challenge by characterizing: the size of the market today, its growth potential, the barriers forecasters face, and the payback period for investments.
4.3 Summary Much has changed in the two years since the 2012 report. Costs of VG forecasts have dropped; OEs are becoming more confident in their VG forecasts; and nearly all the OEs interviewed are using wind forecasts for day-ahead unit commitment. The notable growth in installed solar capacity is prompting the OEs interviewed to start thinking about solar forecasting, with some of the OEs instituting solar forecasting.
Changes unrelated to VG forecasts can help improve forecast accuracy, namely the adoption of fast scheduling and dispatch. The accuracy of VG forecasting is notably more accurate in short time intervals, and as a result, RTOs outside of the West are dispatching wind in 5-minute intervals, with equally fast forecast updates. Continuing evolution of how OEs utilize VG forecasting, regulatory initiatives such as The Federal Energy Regulatory Commission’s Order No. 764, and industry initiatives such as formation of the energy imbalance market between the California Independent System Operator, PacifiCorp and Nevada Power, may accelerate the adoption of these practices in the West.

35
This report is available at no cost from the National Renewable Energy Laboratory (NREL) at www.nrel.gov/publications.
Glossary Availability Generation resources, especially variable generation, that are
in-service and capable of generating electricity, regardless of whether or not electricity is being produced.
Confidence interval The probability that a value will fall between an upper and lower bound of a probability distribution.
Curtailment Generation that could be on-line but is directed to run at a lower level or dispatched off-line to alleviate grid congestion or to maintain reliability.
Day-ahead forecast See “Next-day” forecast.
Down reserves Generation resources that are capable of being dispatched to a lower level (or load which can be increased) in response to a directive from a system operator.
Ensemble forecast A method of forecasting that uses multiple weather forecast models and/or a weather forecast model with a range of perturbed input conditions, based on the uncertainty range of the measurements.
Forecast bias The amount that a forecast is consistently skewed toward under- or over-forecasting.
Load The aggregate demand for electricity consumed by devices connected to the electric grid; sometimes also used to include the customers who own and operate those devices.
Long-term forecast While long-term forecast has different meanings to different companies, it generally refers to any forecast that runs out beyond week-ahead.
Mean absolute error (MAE)
Standard statistical analysis tool used to evaluate the success of wind forecasting systems in predicting actual wind power generation. MAE is the simple average of the absolute values of the individual wind forecast errors.
Medium-term forecast See “Next-day” forecast.
Next-day forecast Also referred to as day-ahead, or medium-term, forecast. The term “next-day forecast” (as contrasted with the term “short-term” or “next-hour” forecast) is traditionally used in the VG power forecasting sense to define a forecast that runs out over the coming days (such as for the next five days). This forecast may be presented with hourly time steps or can be shown with shorter time steps.

36
This report is available at no cost from the National Renewable Energy Laboratory (NREL) at www.nrel.gov/publications.
Numerical Weather Prediction (NWP)
A computer forecast or prediction based on equations governing the motions and forces affecting the atmosphere. The equations are initialized on specified weather or climate conditions at a certain place and time.
Outage A condition which occurs when a generation or transmission facility or element is out of service and not able to generate or transmit power.
Persistence forecast Forecast that assumes the current value will be the same at a future point in time (e.g., 15 minutes-ahead, hour-ahead, etc.).
Probabilistic forecast A forecast that shows not only the expected value, but also a measure of the probability distribution or confidence around the value. This distribution may be obtained from various indicators including the degree of agreement between multiple weather models (see ensemble forecast), historical performance under similar conditions, the location on the turbine power curve for the predicted wind speeds, and other such considerations.
Ramp forecasting A “wind ramp” is a sustained change in wind power output within a specified time period. The exact definition may vary based on the size, situation, and flexibility of the system. A “wind ramp forecasting system” is one that is tuned to identify the risk and potential ramp rate from such an event. Forecasting for ramp events could be implemented as part of a wind power forecasting system, as separate ramp forecasts that are distinct from the wind power forecasts, or various combinations thereof.
Root mean square error (RMSE)
Standard statistical analysis tool used to evaluate the success of wind forecasting systems in predicting actual wind power generation. RMSE involves obtaining the total square error first, then dividing by the total number of individual errors, and then finally taking the square root. RMSE is more sensitive than Mean Absolute Error (MAE) to outliers, giving a high weight to large errors since they are squared prior to being averaged. The RMSE will always be equal to or greater than the MAE. A large difference between them signals a high variance in the individual sample errors.
Short-term forecast While short-term forecasting means different things to different companies, when used in the wind power forecasting sense, the terms “hour-ahead” or “short-term” generally refer to forecasts for the time span from now through the coming 3 to 6 hours. This forecast is often updated frequently and presented with frequent time steps (such as every 10 minutes).

37
This report is available at no cost from the National Renewable Energy Laboratory (NREL) at www.nrel.gov/publications.
Solar insolation A measure of solar radiation energy received on a given surface area at a given time, generally expressed in Wh/m2 (watt-hours per square meter).
Supervisory control and data acquisition (SCADA)
Specialized computer systems that monitor and control industrial processes, including the operation of components of the electric grid, by gathering and analyzing sensor data in near real-time.
Up reserves Generation resources that are capable of being dispatched to a higher level (or load which can be decreased) in response to a directive from a system operator.
Weather situational awareness
Any of a large range of technologies intended to convey near-real-time weather information to an operator or user in an actionable form. For example, general weather information could be made more “actionable” for an operator by visually or numerically converting the information into warnings and alerts of impacts that are more directly useful to the operator or user.

38
This report is available at no cost from the National Renewable Energy Laboratory (NREL) at www.nrel.gov/publications.
References Ahlstrom, M.; Blatchford, J.; Davis, M.; Duchesne, J.; Edelson, D.; Focken, U.; Lew, D.; Loutan, C.; Maggio, D.; Marquis, M.; McMullen, M.; Parks, K.; Schuyler, K.; Sharp, J.; Souder, D. (2011). “Atmospheric Pressure: Weather, Wind Forecasting and Energy Market Operations.” IEEE Power and Energy Magazine. Accessed February 2014: http://www.uwig.org/ahlstrom.pdf.
Ahlstrom, M.; Bartlett, D.; Collier, C.; Duchesne, J.; Edelson, D.; Gesino, A.; Keyser, M.; Maggio, D.; Milligan, M.; Mohrlen, C.; O’Sullivan, J.; Sharp, J.; Storck, P.; De La Torre Rodriguez, M. (2013).“Knowledge is Power: Efficiently Integrating Wind Energy and Wind Forecasts.” IEEE Power & Energy Magazine 11(6); pp. 45-52. Accessed February 2014: http://ieeexplore.ieee.org/xpl/articleDetails.jsp?arnumber=6636012.
Bird, L.; Fink, S.; Hogan, M.; Lamont, D.; Kirby, B.; Mudd, C.; Porter, K.; Rogers, J.; Schwartz, L. (2012). Meeting Renewable Energy Targets in the West at Least Cost: The Integration Challenge. Western Governors’ Association, Denver, CO. Accessed February 2014: www.westgov.org/reports/cat.view/95-reports/263-2012.
Chase, L.; Larson, D.; Oxley, S.; Ravenscroft, V. (2011). “Energy Imbalance Market.” Presentation at State-provincial Steering Committee meeting, San Diego, CA. Accessed February 2014: http://www.westgov.org/EIMcr/documents/eim-spsc.pdf.
KEMA, Inc. (2011). European Renewable Distributed Generation Infrastructure Study – Lessons Learned from Electricity Markets in Germany and Spain. Accessed February 2014: http://www.energy.ca.gov/2011publications/CEC-400-2011-011/CEC-400-2011-011.pdf.
Jones, L.E. (2011). “Strategies and Decision Support Systems for Integrating Variable Energy Resources in Control Centers for Reliable Grid Operations.” U.S. Department of Energy and Alstom Grid, http://www1.eere.energy.gov/wind/pdfs/doe_wind_integration_report.pdf.
NERC. (2009). Accommodating High Levels of Variable Generation. Accessed February 2014: http://www.uwig.org/IVGTF_Report_041609.pdf.
NERC. (2010). Variable Generation Power Forecasting for Operations. Princeton, NJ.
Porter, K.; Rogers, J. (2012). Survey of Variable Generation Forecasting in the West: August 2011 - June 2012. 56 pp.; NREL Report No. SR-5500-54457. Accessed February 2014: http://www.nrel.gov/docs/fy12osti/54457.pdf.
Utility Variable Generation Integration Group (2013). “Some Wind Turbines ‘Safe’ from New CAISO Market Changes.” Connected, newsletter. Accessed March 2014: http://variablegen.org/wp-content/uploads/2013/11/ConnectedOctober2013.pdf

39
This report is available at no cost from the National Renewable Energy Laboratory (NREL) at www.nrel.gov/publications.
Appendix Wind and Solar Forecasting Questions Forecast Information 1. Please tell us about your VG forecasting system.
a. When did you start forecasting, and what were the reasons for doing so? Do you forecast for wind only, or for wind and solar?
b. For BAs included in previous report and BAs new for this report. Has your company’s use of VG forecasting changed or evolved over time? If so, please describe. What changes do you anticipate making to your VG forecasting system in the future, if any?
2. How often does your organization assess the need for new or modified VG forecasting
capabilities (i.e., annual planning process, ongoing, during IRP development)? What factors are considered during the needs analysis?
3. What changes, if any, do you think FERC 764 will make in your organization’s decisions regarding forecasting needs and/or processes?
4. In general, how would sub-hourly scheduling or dispatch change your organization’s
forecasting practices?
For the forecasting system(s) your company is currently using: 5. What time frames are covered by the forecast?
____ Short-term forecasts. How often are the forecasts prepared and updated? ____ Medium-term forecasts. How often are the forecasts prepared and updated? ____ Long-term forecasts. How often are the forecasts prepared and updated? ____ Ramp forecasts. If so, how often are the forecasts prepared and updated? If not,
do you expect to implement a ramp forecast in the future? ____ Other
6. What is the scope of the VG forecast?
____ Individual wind or solar plant ____ Individual utility ____ Balancing area ____ Commercial pricing node ____ Multiple utilities or balancing areas ____ Region ____ Other

40
This report is available at no cost from the National Renewable Energy Laboratory (NREL) at www.nrel.gov/publications.
7. What type of forecasts are you preparing or using?
___ Persistence (if so, please provide details on the timing of the look-ahead period) ___ Numerical Weather Prediction Model ___ Statistical ___ Weather Situational Forecasts ___ Ramp Forecasts ___ Other
8. Are electronic displays of VG forecasts available in the control room? If not, how do grid
operators or system dispatchers receive and process the VG forecast? Use of Forecasting 9. Please describe how you use your VG forecasts:
___ Unit commitment (Day-ahead, week-ahead, etc.) ___ Intra-day unit commitment (is this done regularly or is it ad hoc?) ___ Transmission congestion management ___ Planning reserves (if so, on what time frame? Day-ahead? Months or Years
ahead?) ___ Management of hydro or gas storage ___ Planning generation or transmission scheduled outages ___ Other
10. Is the VG forecast integrated into the EMS in the control room? If not, why? Do you
anticipate taking that step in the future?
System Operator Training in VG Forecasting
11. What training is offered to grid operators and dispatchers on VG forecasting? Has the training been revised over time? Are there plans to provide additional training?
12. If the operators have dealt with wind/solar forecasts for some time, have they developed a sense of “familiarity” with the forecasts that helps anticipate unforeseen circumstances?

41
This report is available at no cost from the National Renewable Energy Laboratory (NREL) at www.nrel.gov/publications.
Costs and Benefits of VG Forecasting 13. How much did your VG forecast system cost? Are variable generators responsible for some
or all of the costs of the VG forecasting system, and if so, how? What is the estimated ROI for your organization’s forecasting system?
14. Has your company estimated the costs and benefits of using VG forecasting? If yes, please
describe how the costs and benefits were determined, and were the estimates prepared before or after the company implemented VG forecasting? Please also provide a copy of the estimates, if they are available.
15. Has your company estimated a reduction in operating reserves requirements that may be supported by VG forecasting?
Future of VG Forecasting in the West 16. What are the strengths and weaknesses of the VG forecasting systems your organization is
currently using or has used in the past? What advice would you give other balancing areas that are thinking about implementing a VG forecasting system?
17. What should the West do regarding VG forecasting? Do you think guidelines or standards would be of value?
18. Do you see any benefit in coordinated VG forecasts with multiple balancing areas? Have you consider jointly doing VG forecasts with other balancing authorities, or participating in a sub-regional or regional VG forecast?

42
This report is available at no cost from the National Renewable Energy Laboratory (NREL) at www.nrel.gov/publications.
Data Collection 19. Do you require wind generators to provide data for your forecast? If so, what? See below
for examples.
___ Wind speed and direction ___ Temperature ___ Barometric pressure ___ Turbine location in latitude and longitude ___ Turbine power output ___ Turbine availability ___ Turbine outage ___ Wind turbine power curve ___ Other
20. If you require wind generators to provide data, are there requirements (or a preference) that it come from metrological towers as opposed to plant-mounted sensors? Are there other requirements on where the data is sourced from, such as coming from a minimum of metrological towers be used? For solar:
21. Do you require wholesale solar generators to provide data for your forecast? If so, what?
22. How does your company estimate production from distributed ‘behind the meter’ solar resources? (expect that most don’t)
23. Do you see a current or future need to be able to increase the ability to forecast distributed
solar production?
24. Are you getting the data you need from variable energy generators? Are there sanctions or penalties in place if the data is not provided? Is there data that would be useful to receive from national resources (NOAA, NCAR) that is not currently available?
Miscellaneous Questions
25. Do you contract with an outside company to provide the forecast or is it done in-house? If an
outside company is used, who is it? Is there a statement of work you can provide (without commercially sensitive information) that describes the responsibilities, expectations, and any performance metrics or targets of the VG forecasting vendor?

43
This report is available at no cost from the National Renewable Energy Laboratory (NREL) at www.nrel.gov/publications.
26. Do you or your forecasting vendor use a probabilistic approach to forecasting? Do you use a confidence interval with your VG forecast, and if so, what confidence interval do you use? Do you utilize ensemble VG forecasting with multiple vendors, or a vendor that prepares several different forecasts based on different model inputs, weather fronts, etc.?
27. Does your VG forecast factor in production curtailments or turbine outages? If so, please describe that process of incorporating production curtailments or turbine outages into the VG forecast.
28. How do you assess the accuracy of your VG forecast (i.e., through Mean Average Error,
Root Square Mean Error, etc.)? What error rates have been observed? Have these improved or worsened over time?