A review of research on the dry season mesoscale ...roger/Publications/SR... · A review of...
27
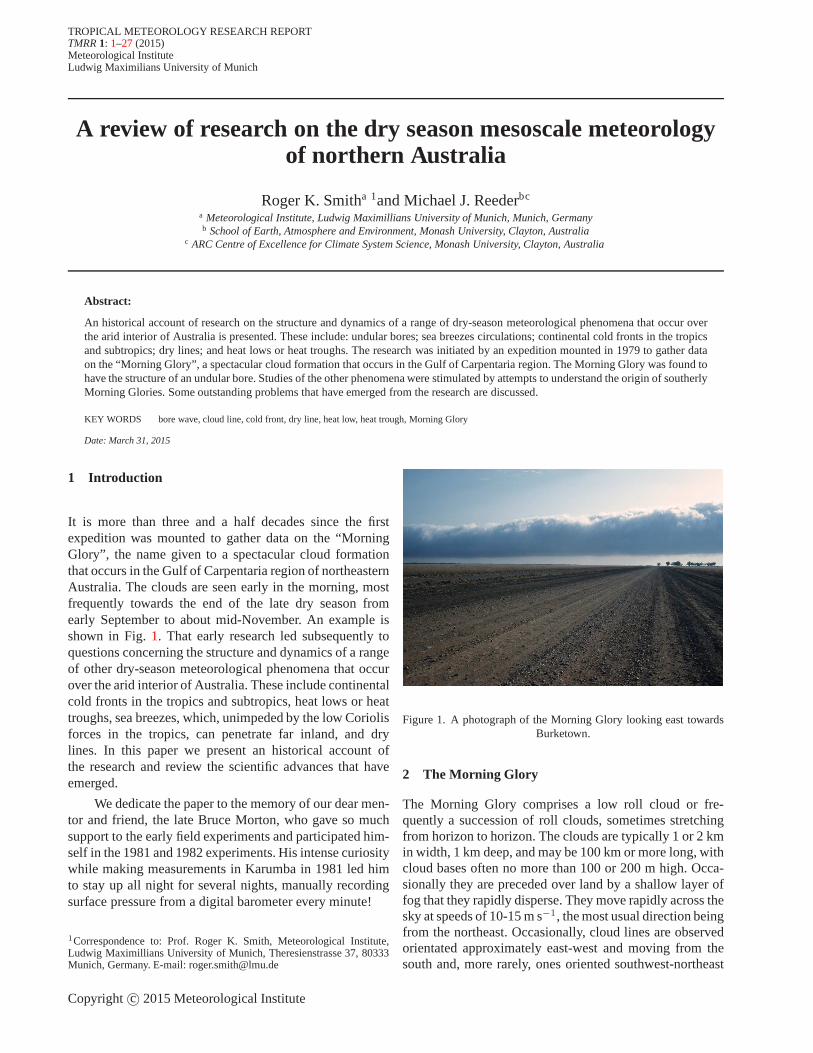
TROPICAL METEOROLOGY RESEARCH REPORT TMRR 1: 1–27 (2015) Meteorological Institute Ludwig Maximilians University of Munich A review of research on the dry season mesoscale meteorology of northern Australia Roger K. Smith a1 and Michael J. Reeder bc a Meteorological Institute, Ludwig Maximillians University of Munich, Munich, Germany b School of Earth, Atmosphere and Environment, Monash University, Clayton, Australia c ARC Centre of Excellence for Climate System Science, Monash University, Clayton, Australia Abstract: An historical account of research on the structure and dynamics of a range of dry-season meteorological phenomena that occur over the arid interior of Australia is presented. These include: undular bores; sea breezes circulations; continental cold fronts in the tropics and subtropics; dry lines; and heat lows or heat troughs. The research was initiated by an expedition mounted in 1979 to gather data on the “Morning Glory”, a spectacular cloud formation that occurs in the Gulf of Carpentaria region. The Morning Glory was found to have the structure of an undular bore. Studies of the other phenomena were stimulated by attempts to understand the origin of southerly Morning Glories. Some outstanding problems that have emerged from the research are discussed. KEY WORDS bore wave, cloud line, cold front, dry line, heat low, heat trough, Morning Glory Date: March 31, 2015 1 Introduction It is more than three and a half decades since the first expedition was mounted to gather data on the “Morning Glory”, the name given to a spectacular cloud formation that occurs in the Gulf of Carpentaria region of northeastern Australia. The clouds are seen early in the morning, most frequently towards the end of the late dry season from early September to about mid-November. An example is shown in Fig. 1. That early research led subsequently to questions concerning the structure and dynamics of a range of other dry-season meteorological phenomena that occur over the arid interior of Australia. These include continental cold fronts in the tropics and subtropics, heat lows or heat troughs, sea breezes, which, unimpeded by the low Coriolis forces in the tropics, can penetrate far inland, and dry lines. In this paper we present an historical account of the research and review the scientific advances that have emerged. We dedicate the paper to the memory of our dear men- tor and friend, the late Bruce Morton, who gave so much support to the early field experiments and participated him- self in the 1981 and 1982 experiments. His intense curiosity while making measurements in Karumba in 1981 led him to stay up all night for several nights, manually recording surface pressure from a digital barometer every minute! 1 Correspondence to: Prof. Roger K. Smith, Meteorological Institute, Ludwig Maximillians University of Munich, Theresienstrasse 37, 80333 Munich, Germany. E-mail: [email protected] Figure 1. A photograph of the Morning Glory looking east towards Burketown. 2 The Morning Glory The Morning Glory comprises a low roll cloud or fre- quently a succession of roll clouds, sometimes stretching from horizon to horizon. The clouds are typically 1 or 2 km in width, 1 km deep, and may be 100 km or more long, with cloud bases often no more than 100 or 200 m high. Occa- sionally they are preceded over land by a shallow layer of fog that they rapidly disperse. They move rapidly across the sky at speeds of 10-15 m s -1 , the most usual direction being from the northeast. Occasionally, cloud lines are observed orientated approximately east-west and moving from the south and, more rarely, ones oriented southwest-northeast Copyright c 2015 Meteorological Institute
Transcript of A review of research on the dry season mesoscale ...roger/Publications/SR... · A review of...
TROPICAL METEOROLOGY RESEARCH REPORTTMRR 1: 1–27 (2015)Meteorological InstituteLudwig Maximilians University of Munich
A review of research on the dry season mesoscale meteorologyof northern Australia
Roger K. Smitha 1and Michael J. Reederbc
a Meteorological Institute, Ludwig Maximillians University of Munich, Munich, Germanyb School of Earth, Atmosphere and Environment, Monash University, Clayton, Australia
c ARC Centre of Excellence for Climate System Science, Monash University, Clayton, Australia
Abstract:
An historical account of research on the structure and dynamics of a range of dry-season meteorological phenomena that occur overthe arid interior of Australia is presented. These include:undular bores; sea breezes circulations; continental coldfronts in the tropicsand subtropics; dry lines; and heat lows or heat troughs. Theresearch was initiated by an expedition mounted in 1979 to gather dataon the “Morning Glory”, a spectacular cloud formation that occurs in the Gulf of Carpentaria region. The Morning Glory was found tohave the structure of an undular bore. Studies of the other phenomena were stimulated by attempts to understand the origin of southerlyMorning Glories. Some outstanding problems that have emerged from the research are discussed.
KEY WORDS bore wave, cloud line, cold front, dry line, heat low, heat trough, Morning Glory
Date: March 31, 2015
1 Introduction
It is more than three and a half decades since the firstexpedition was mounted to gather data on the “MorningGlory”, the name given to a spectacular cloud formationthat occurs in the Gulf of Carpentaria region of northeasternAustralia. The clouds are seen early in the morning, mostfrequently towards the end of the late dry season fromearly September to about mid-November. An example isshown in Fig.1. That early research led subsequently toquestions concerning the structure and dynamics of a rangeof other dry-season meteorological phenomena that occurover the arid interior of Australia. These include continentalcold fronts in the tropics and subtropics, heat lows or heattroughs, sea breezes, which, unimpeded by the low Coriolisforces in the tropics, can penetrate far inland, and drylines. In this paper we present an historical account ofthe research and review the scientific advances that haveemerged.
We dedicate the paper to the memory of our dear men-tor and friend, the late Bruce Morton, who gave so muchsupport to the early field experiments and participated him-self in the 1981 and 1982 experiments. His intense curiositywhile making measurements in Karumba in 1981 led himto stay up all night for several nights, manually recordingsurface pressure from a digital barometer every minute!
1Correspondence to: Prof. Roger K. Smith, Meteorological Institute,Ludwig Maximillians University of Munich, Theresienstrasse 37, 80333Munich, Germany. E-mail: [email protected]
Figure 1. A photograph of the Morning Glory looking east towardsBurketown.
2 The Morning Glory
The Morning Glory comprises a low roll cloud or fre-quently a succession of roll clouds, sometimes stretchingfrom horizon to horizon. The clouds are typically 1 or 2 kmin width, 1 km deep, and may be 100 km or more long, withcloud bases often no more than 100 or 200 m high. Occa-sionally they are preceded over land by a shallow layer offog that they rapidly disperse. They move rapidly across thesky at speeds of 10-15 m s−1, the most usual direction beingfrom the northeast. Occasionally, cloud lines are observedorientated approximately east-west and moving from thesouth and, more rarely, ones oriented southwest-northeast
Copyright c© 2015 Meteorological Institute

2 R. K. SMITH AND M. J. REEDER
and moving from the southeast. We refer to these types asnortheasterly Morning Glories, southerly Morning Gloriesand southeasterly Morning Glories, respectively.
The passage of each cloud overhead is usually accom-panied by the onset of a sudden wind squall which,although normally of short duration (perhaps 5 to 10 min-utes), have wind speeds comparable to the speed of thecloud. The disturbance brings about also an abrupt rise insurface pressure (sometimes more than 1 mb in a few min-utes and often a reversal in surface wind direction. Thesurface pressure may oscillate following the rise, but theincreased mean pressure and change in wind direction fre-quently persist for at least several hours. A typical surfacepressure trace is shown in Fig.2.
Figure 2. A typical surface pressure trace accompanying thepassageof a Morning Glory taken on 2 September 2008 on MorningtonIsland. There is normally a sharp pressure jump followed by aseriesof oscillations, which are manifestations of the Morning Glory waves.Note that the mean pressure remains higher than that before thepassage of the disturbance (this feature remains true even when oneremoves the mean diurnal increase that normally occurs at this timeof the morning). The abscissa marks Eastern Standard Time (EST)
and the ordinate pressure in mb.
2.1 History
Anthropologist Margaret Moore told us that the name ofthe phenomenon in the language of the Garrawa Aboriginalpeople who live near the south coast of the Gulf is “kan-golgi” and it is credited with increasing the supply of birdlife. This may reflect the fact that the Morning Glory occursmost frequently in October, just prior to the “wet” season,which is a harbinger of bounty for the Aboriginal people.
The earliest published description of the MorningGlory of which we are aware is in the Royal AustralianAir Force (1942, Part 2, p. 25), where it is described as a“land breeze” coming out of the east about dawn with asqually onset and with one or several long straight linesof low cloud. Thirty years later, Clarke (1972) exploredthe possibility that the phenomenon could be interpretedas a propagating internal hydraulic jump, formed at adiscontinuity in the slope of the ground, on a katabatic flowdeveloping on Cape York Peninsula. Clarke’s theory wasinevitably tentative, since the only available data againstwhich it could be compared were a series of autographic
records of surface pressure, wind and temperature at the(now abandoned) weather station at Karumba. Moreover,the theory did not take account of the strong heatingcontrasts between sea and land in the Gulf region. In fact,there appeared to be the possibility that local sea breezecirculations might be a more important influence than thekatabatic flow.
A few years later, Neal et al. (1977) carried outa study of pressure jumps recorded on weekly Bureauof Meteorology barographs around the gulf at EdwardRiver, Kowanyana, Normanton, Burketown and Morning-ton Island. These data enable estimates to be made of thespeed and orientation of a number of pressure jump “lines”,presumably associated with Morning Glories. It was shownthat the majority of lines were roughly parallel with the eastcoast of the Peninsula (and also to the coastal ranges whichrise to a height of between 300 and 500 m in the DividingRange) and move with a speed of typically 10 m s−1.
A climatology of pressure jumps was presented also,showing frequencies of occurrence at the five stations interms of time of day and month, and mean sea level isobariccharts for pressure jump days and for days free of jumps.The latter were classified according to whether surfacewinds were southeasterly or northeasterly in the southeastgulf area.
In October 1978, Reg Clarke, a former long-timeresearch scientist with the then CSIRO Division of Atmos-pheric Physics, and his wife, Elsje, staged a small expe-dition to the gulf with a view to collecting more detailedsurface data on Morning Glories as well as photographs andtime-lapse movie film of the clouds. Ten days were spentin the field during which time four Morning Glories wereobserved, a frequency which, coincidentally, correspondedwith the average frequency of presumed Morning Glories atKarumba in October, based on nine years of data (Neal etal. 1977). Two of these four occurred before daybreak; onewas cloud-free; two had five parallel cloud bands and theother three. All had marked wind and pressure jumps. Onewas followed by car over 35 km and its speed measured at11 m s−1; another was photographed in time-lapse whichrevealed a rolling motion of the cloud band with upwardmotion at the leading edge and downward motion at therear. In each case, measurements of surface pressure, tem-perature, humidity and wind were made during the passageof the disturbance.
2.2 The first field experiment
Early in 1979, a more ambitious expedition was planned,led by Reg Clarke and the first author, with six other partic-ipants (Fig.3). It had two main objectives. The first was toobserve the structure of Morning Glories, both in the hori-zontal and vertical, as they passed Burketown, with a viewto identifying the mechanisms associated with its propaga-tion and maintenance. The second objective was to obtainsurface data on Cape York Peninsula in an attempt to iden-tify the region of origin and to determine the formation
Copyright c© 2015 Meteorological Institute TMRR 1: 1–27 (2015)

DRY SEASON METEOROLOGY OF NORTHERN AUSTRALIA 3
Figure 3. Participants of the 1979 Morning Glory expedition. Fromleft to right: standing: Reg. Clarke, Richard Hagger, Jonathan Good-field, Karen McAndrew, Roger Merridew (pilot), Roger Smith,kneel-
ing: Terry Long, Derek Reid, Peter Watterson, and Elsje Clarke.
mechanism of the phenomenon. To accomplish the firstof these tasks, the expedition was equipped with theodo-lites for making pilot balloon wind measurements and alight aircraft to make airborne measurements of tempera-ture and humidity. The expedition lasted two weeks fromlate September to early October during which time threeMorning Glories occurred at Burketown. An unprecedentedamount of data were collected on these events and thesubsequent analysis of the data, together with automaticweather station (AWS) data collected on the peninsula waspresented in a paper by Clarke et al. (1981). A brief descrip-tion of the experiment was given by Smith and Goodfield(1981). A disturbance was observed also on the morningwhen the expedition party was about to leave Burketown,but no data were obtained, except photographs. An intrigu-ing feature of this disturbance was that unlike the others, itwas moving from the south!
About the same time as the foregoing expeditionand unbeknown to its leaders until after the expedition,Christie et al. (1979) reported a study of intrusive-typeflows and solitary waves in the lower atmosphere observedin microbarograph records at the Warramunga SeismicStation at Tennant Creek, about 600 km west-southwestof Burketown. Based on the results of their analyses,Christie et al. (p4968) expressed the opinion that: “. . .it seems very likely that the Morning Glory phenomenonis in fact a manifestation of a fairly well-developed large-amplitude isolated solitary wave or group of solitary waves.In this interpretation the roll clouds are associated with theclosed circulation cells in the streamline pattern of large-amplitude deep-fluid internal solitary waves propagatingalong a marine inversion.” The data obtained during the1979 expedition broadly supported this view.
2.3 Structure and origin of the Morning Glory
Analysis of data from the 1979 expedition showed thatthe Morning Glory had the structure of an undular bore
Figure 4. Schematic of the vertical structure of a Morning Glory. Thebore is propagating from right to left. The airflow relative to the boreis from left to right. The Morning Glory clouds form as air ascendsahead of each wave and they evaporate as air descends behind eachwave. The continuous formation of cloud at the leading edge of thewave gives the appearance that the clouds are rotating and for this
reason, the clouds are often referred to as “roll clouds”.
propagating on a stable layer of air in the lowest half to-one kilometre of the atmosphere (Clarke et al. 1981). Thestructure is analogous to that of undular bores that formon tidal rivers. An undular bore is a weak hydraulic jumpwhich, loses energy through the downstream propagationof internal (possibly solitary) waves instead of dissipatingenergy through turbulence as in strong hydraulic jumps.The clouds are essentially wave-type clouds associatedwith the constituent bore waves (see Fig.4). As a wavecrest approaches, air parcels rise and cool and condensationoccurs leading to cloud. Then, as the wave crest passes,the air parcels descend and warm so that the cloud re-evaporates. Thus the clouds are not simply being carriedalong with the air flow: rather cloud is continuously beingformed at the leading edge of each wave and continuouslyeroded at the trailing edge.
Wave propagation, itself, requires a wave guide. Thedata from the 1979 expedition showed that the wave guidefor the Morning Glory is related to the particular thermalstructure of the lower atmosphere in the southern region ofthe gulf, which exhibits of a deep well mixed (neutrally-stable) layer overlying a shallow stable layer. The neutrallayer aloft is a result of the deep well-mixed layer formedover the land on the previous day and the stable layer isassociated with cooler air that exists over the sea. Fur-ther aspects of the Morning Glory waveguide including theeffects of the vertical wind profile are discussed in subsec-tion 8.
When the bore moves into drier air, as often happens asit moves inland after crossing the southern part of the Gulf,the clouds may dissipate while the bore waves remain. Forthis reason, Clarke et al. (1981) emphasize the squall-likenature of the disturbance rather than the cloud accompany-ing it, since disturbances unmarked by cloud are commoninland from the coastal region. Some authors (e.g. Clarke1983a,b, Smith and Morton 1984) have used the term “windsurge” to describe the overall disturbance. It may be notedthat because of strong (dry) convective overturning, the
Copyright c© 2015 Meteorological Institute TMRR 1: 1–27 (2015)

4 R. K. SMITH AND M. J. REEDER
low-level stable layer over the land rarely survives into mid-morning. However, there is evidence from surface micro-barograph data that disturbances continue to propagate insome form for a considerable distance inland during the day(Christie et al. 1978). The nature of the wave guide at thisstage of the disturbance remains to be determined.
Figure 5. Maps of the southeast portion of the Gulf of Carpentariaregion showing the location of some of the stations from which data
have been collected.
Analyses of AWS data (Clarke et al. 1981, Clarke,1983b) supported by numerical model simulations (see sec-tion 2.6) indicate that northeasterly Morning Glories origi-nate during the late evening over the western side of CapeYork Peninsula when, assisted by the prevailing wind, theeast coast sea breeze crosses the peninsula and encountersthe sea breeze from the west coast of the peninsula. How-ever, the collision, itself, has not been observed: the onlyinformation we have about the details of it has emergedfrom high resolution numerical model simulations and afew laboratory experiments (see subsection7). In fact, thisaspect of the problem is perhaps the least well understood.
The origin of Morning Glories from the south isnow reasonably well understood (section3) and it seemsthat most, if not all, are generated by shallow cold fronts(section9). It is known that southerly Morning Glorieshave the same bore-like structure of their northeasterlycounterparts (Smith et al. 1982). Perhaps remarkably, witha few exceptions, they tend to occur at Burketown (see Fig.5 for locations) at much the same time as northeasterlyones, typically between about 0500 and 0800 EST. (ESTrefers to eastern standard time = GMT+ 10 hours.)
Several more field experiments were organized in thedecade following the 1979 expedition and many moredisturbances were documented, including a few from thesouth (Smith et al. 1982, Smith and Morton 1984, Smithand Page 1986, Smith et al. 1986). Some more recent fieldexperiments are described in subsection3.
2.4 Favourable synoptic conditions
The occurrence of northeasterly Morning Glories appearsto be favoured by a synoptic-scale ridge of high pressurealong the east coast of Queensland with associated north-easterly geostrophic winds over Cape York Peninsula. Anexample is illustrated by the mean sea level pressure analy-ses at 1000 EST on 24 September 2006 shown in Fig.6. AMorning Glory was observed over the southern gulf earlyon the following morning.
Figure 6. Bureau of Meteorology mean sea level pressure analysisat 1000 EST on 24 September 2006 showing synoptic conditionsconducive to the formation of northeasterly Morning Glories. Aprominent feature is the ridge along the east coast of the Australiancontinent that directs a northeasterly component of flow across Cape
York Peninsula.
2.5 Climatology
Nudelman et al. (2010) presented a climatology of noctur-nal or late morning pressure jumps at stations around theGulf of Carpentaria and at one inland station south of theTop End. The climatology was based on one-minute aver-age data from Bureau of Meteorology’s AWSs. Of the 21bore-like disturbances that were recorded at three or morestations during the four-month period August-November2006, 16 were from the northeast sector and five had asignificant southerly component. One of the latter wasrecorded as far west as Daly Waters. Only one northeasterlydisturbance was identified at Groote Eylandt in the north-west of the Gulf.
Their study highlights the value of one-minute datain identifying the passage of all types of low-level distur-bances at surface stations. Such passages would be missedwith the conventional hourly or even three-hourly data rou-tinely available to forecasters. It was found that a pressurejump criterion of about 0.25 mb in three minutes is suitablefor detecting the majority of morning-glory-type distur-bances. Since their study was initiated, considerably moredata have become available and provide a rich source ofmaterial to extend this climatology in the future.
Copyright c© 2015 Meteorological Institute TMRR 1: 1–27 (2015)

DRY SEASON METEOROLOGY OF NORTHERN AUSTRALIA 5
Figure 7. Results of a numerical model simulation of sea breezes over Cape York Peninsula illustrating the formation of the east-coast sea-breeze front (the blue dashed curve) and its progressive collision with the west-coast sea breeze on the western side of the peninsula during
the evening. From Smith and Noonan (1987).
2.6 Numerical simulations
The data obtained from the various field experiments moti-vated attempts to simulate the Morning Glory using numer-ical models, or at least the sea-breeze circulations that werebelieved to lead to it. Two first attempts were those ofClarke (1984) and Noonan and Smith (1986), both usingtwo-dimensional models for the flow in a vertical cross-section across Cape York peninsula. Shortly after, Noonanand Smith (1987) carried out a three-dimensional simula-tion over a domain that included the peninsula. The resultssupported the presumed role of sea-breeze circulations overCape York Peninsula in the generation of the MorningGlory. The collision of the east- and west-coast sea breezesunder conditions of a moderate (5 m s−1) easterly synopticflow is manifest as a convergence line that extends progres-sively southwards with time along the entire length of thePeninsula near the west coast (see Fig.7). Collision of thesea breezes occurs in the late afternoon or early evening in
the north of the peninsula, where the peninsula is compar-atively narrow and progressively later in the south, wherethe peninsula is much broader.
The rapid development of computer power in the 90’sprovided the possibility of repeating the foregoing calcu-lations with higher spatial resolution and a over a largerdomain. A set of such calculations was reported by Smithand Noonan (1998). While these calculations examined arange of additional features of the precursors to MorningGlories, they confirmed also the results of earlier ones con-cerning the role of sea breezes. For example, calculationsfor a range of horizontally-uniform geostrophic flows overthe region, with directions typical of those that occur duringthe dry season, showed that the development of westward-moving lines of low-level convergence over the gulf is therule. This explains why travelling convective- and wave-cloud lines are commonly observed there. The convergencelines are associated with the leading edge of sea-breeze
Copyright c© 2015 Meteorological Institute TMRR 1: 1–27 (2015)

6 R. K. SMITH AND M. J. REEDER
circulations that develop over Cape York Peninsula andaround the gulf.
For easterly and northeasterly geostrophic flows, thecirculations that develop are broadly repeatable from dayto day, despite the relatively long inertial period (nearlytwo days) in the region. However, this is not the case fora southeasterly flow. Calculations with and without orog-raphy showed that the orography on Cape York Peninsulaenhances the low-level easterly flow over the eastern sideof the peninsula, but delays the formation of the MorningGlory convergence line on the western side. Although itaffects the detail, orography does not play a fundamentalrole in the generation of the Morning Glory.
Goler and Reeder (2004) used a high-resolution cloudmodel to explore in detail the generation of the MorningGlory. The model was two-dimensional and nonhydrostaticand simulated an east-west cross section of the southernpart of Cape York Peninsula with a horizontal grid spacingof 200 m. The calculations were initialized at sunrise witha 5 m s−1 easterly flow and a temperature and humiditysounding taken upstream from the peninsula. Figure8ashows the wind and potential temperature fields from themodel at 2210 LST, which is close to the time at whichthe sea breezes meet. For clarity, only a small part of themodel domain focussed on the point of collision is shown.As in earlier studies, the sea breezes that develop overthe peninsula are highly asymmetric with the east-coastsea breeze being both deeper and warmer than its westerncounterpart. The asymmetry is due to the ambient easterlyflow over the peninsula.
The east-coast sea breeze is warmed as it propagatesacross the heated land and when the sea breezes meet, itrides over the west coast sea breeze (as in the laboratoryexperiments of an intrusive gravity current described insection7). In the process it produces a series of wavesthat propagate on the on the pool of cold air laid downby the west coast sea breeze. The calculations showed thatwhen the phase speed of these waves matches the westwardpropagation speed of the east-coast sea breeze, the wavesgrow to large amplitude, thereby forming the MorningGlory. When the east-coast sea breeze propagates too fastrelative to the waves, the waves do not amplify.
Goler and Reeder concluded that the Morning Glory isgenerated by a resonant coupling between the east-coast seabreeze and the disturbances that propagate on the shallowstable layer produced by the west-coast sea breeze. Theleading Morning Glory wave generated by the model isshown in Fig.8b. The number of waves produced is foundto depend on the vertical stability of the west-coast seabreeze and the strength of the east-coast sea breeze. As inthe calculation by Smith and Noonan (1998), the inclusionof orography representative of Cape York Peninsula doesnot change the overall result with a Morning Glory formingin much the same way as in the case without orography. Themain difference is that the sea breezes meet earlier whenorography is included.
Figure 8. (a) East and west coast sea breezes at 2210 LST. Windvectors and potential temperature shaded in 1 K increments.(b) TheMorning Glory at 030 LST. Wind vectors and potential temperatureshaded in 1 K increments. For clarity, only a small part of themodel
domain is shown. Adapted from Goler and Reeder (2004).
3 Southerly Morning Glories
The observation at Burketown of a Morning Glory mov-ing from the south at the end of the 1979 field experi-ment was a total surprise, but the existence of such dis-turbances was reported in the same year based on datafrom arrays of microbarometers deployed in the region byDoug. Christie and colleagues from the Australian NationalUniversity (Christie et al. 1979). A year later, two moredisturbances were observed during a field campaign and itbecame apparent that such occurrences were not so uncom-mon (Smith et al. 1986). A feature of the synoptic meansea level pressure patterns conducive to the formation ofsoutherly disturbances over northern Australia was found tobe the extension of a ridge of high pressure across the con-tinent directing a southerly to southeasterly airstream overwestern Queensland. In some cases, strong ridging occursduring the 12- to 24-h period prior to the disturbance andis preceded by the movement of a frontal trough acrosscentral Queensland; in other cases, the ridge is quasi sta-tionary and the front (at least as commonly analyzed) isabsent. However, the inland heat trough is always a promi-nent feature along the leading edge of the ridge (see section10). It is well marked in model forecasts as a narrow lineof enhanced low-level cyclonic vorticity and, from avail-able observations, it appears to be coincident with the dryline (see section11). Figure9 below shows the mean sea
Copyright c© 2015 Meteorological Institute TMRR 1: 1–27 (2015)

DRY SEASON METEOROLOGY OF NORTHERN AUSTRALIA 7
level pressure analyses leading up to two well-documentedsoutherly Morning Glory events.
Figure 9. Bureau of Meteorology mean sea level pressure analysesat 1000 EST on 28 September and 1000 EST on 29 September2002 indicating conditions conducive to the formation of southerlyMorning Glories. The southerly Morning Glory was associated withthe trough line (marked by a dashed curve) as the line crossedover
the southern gulf.
The analyses of available data for the events describedby Smith et al. (1986) pointed to a possible connectionwith cold fronts crossing the continent to the south andalso with the inland heat trough. However, at the time, littlewas known about the structure of fronts that penetrated farnorthwards across the dry continent. Solving this mysterycalled for an observational programme to acquire the nec-essary data. To this end, a pilot experiment was organizedSeptember 1988 to document one or two cases (Smith andRidley 1990) and two subsequent experiments, more exten-sive in scope, were carried out in early and mid-90’s (seesection9 for further information on these experiments andthe accompanying research on subtropical continental coldfronts). During the first of these experiments in 1991, anunprecedented data set was obtained on a cold front thatcrossed the northern part of the continent and transformedover night into a southerly Morning Glory (Smith et al.1995).
The foregoing analyses stimulated also a program ofresearch to examine the dynamics of heat lows and heattroughs, the findings of which are summarized in section10. Two particularly interesting southerly Morning Glorieswere documented during the 2002 Gulf Line Experiment(GLEX, Goler et al. 2006; see also section4) and wediscuss these briefly in the next two subsections.
3.1 Event of 29 September 2002
One of the southerly Morning Glories reported by Smithet al. (2006) is discussed now. A special feature of thisevent was the clear double change structure at all automaticweather stations (AWSs) in the southeastern gulf regionwith an undular bore-like wave preceding and separatingfrom an air mass change in the form of a dry line. As inother major events previously documented, the disturbancewas accompanied by ridging over the northeastern partof the continent (Fig.9). In this case, the ridging wasstrong enough to push the trough a considerable distancenorthwards over the gulf and the peninsula. As a result,there was a significant air mass change across much of theAWS network with dry continental air extending well outover the gulf. At Karumba, there were strong southeasterlywinds with blowing dust following the change.
Figure10shows time series of various quantities fromtwo of the AWS stations: Augustus Downs (one of thesouthernmost stations) and Birri Beach on the northernside of Mornington Island in the gulf. At the southernmoststation, Augustus Downs, the bore wave is evident as asharp pressure jump at about 2115 EST, accompanied by asharp increase in wind speed and an abrupt change in winddirection from one slightly west of north to a southerly. Asecond wave of the bore with a further jump in pressureoccurred about 15 min later. The passage of the troughline (effectively a dry line) was marked by a sharp fall inthe dewpoint at around 2300 EST, accompanied by a slightincrease in temperature and a rapid freshening of the windfrom the southeast. The surface data from Birri Beach showa similar structure, with the bore wave onset at about 0150EST and the air mass change just after 0645 EST. Thus, thebore wave had separated farther from the air mass changeas the disturbance moved northwards.
There was not much of a temperature change recordedat the surface with the passage of the bore wave, althoughnumerical model-based mesoscale analyses of the event doindicate a relatively deep layer of cooler air following thechange. The analyses are not necessarily inconsistent withthe surface observations, which often show a rise in surfacetemperature accompanying the passage of acold front overcentral Australia. The jump in surface temperature is aconsequence of the nocturnal formation of a shallow layerof cool air adjacent to the surface, which is destroyed bythe downward turbulent mixing of warmer air from aloft atthe front.
Copyright c© 2015 Meteorological Institute TMRR 1: 1–27 (2015)

8 R. K. SMITH AND M. J. REEDER
Figure 10. Time series of temperature, dewpoint temperature (dashed), wind speed and direction, and pressure from two AWS stations at(left) Augustus Downs and (right) Birri Beach on MorningtonIsland during the passage of the southerly disturbance of 28-29 September
2002. Adapted from Smith et al. (2006).
3.2 Event of 9 October 2002
A second event from Smith et al. (2006) is discussed inthis subsection. On this day, three Morning Glories wereobserved, one moving from the southeast, one from thesouth and the other from the northeast. These disturbanceswere documented in unprecedented detail with airbornemeasurements as well as surface observations. (Only oncepreviously, on 10 October 1990, had Morning Gloriesbeen observed simultaneously propagating from all threepreferred directions; see Christie 1992, and Reeder andChristie 1998.) The synoptic situation was very similar tothat for the previous disturbance, namely a ridge of highpressure moving across the continent and the inland troughline on its northeastern side moving northeastwards towardsthe gulf (see Fig.11). Recognition of this favourablepattern, which emerged from the earlier studies of Smithet al. (1982, 1986), enabled us to forecast the event 8 daysahead on the basis of the Bureau of Meteorology’s globalnumerical prediction system. With this amount of leadtime it was possible to deploy the instrumented researchaircraft available to the experiment. Note that a feature ofthe synoptic situation favourable for the southerly MorningGlories shown in Figs.9 and 11) is the ridge along theeast coast of Australia, which is favourable also for thegeneration of northeasterly Morning Glories as well (seeFig. 6).
Sometime overnight on 8 October, southerly, south-easterly, and northeasterly Morning Glories developed. Themost prominent feature in the Geostationary Meteorologi-cal Satellite (GMS) visible image at 0832 EST 9 Octoberis the series of cloud lines in the southeastern corner of thegulf (Fig.12). The family of cloud lines oriented northeast-southwest is the southeasterly Morning Glory. There is acloud line oriented northwest-southeast also, marking the
northeasterly Morning Glory, and a group of cloud linesessentially oriented east-west marking the southerly Morn-ing Glory. The wave crests of each family are noticeablycurved in the region in which they intersect. A line of mod-erately shallow convective cloud, a so called North Aus-tralian Cloud Line (NACL), is visible also in the northeast-ern part of the gulf. The NACL will be discussed in section4.
The AWS trace at Augustus Downs (Fig.13) showsthe passage of a single southerly disturbance at 0400 ESTmarked by a sharp rise in the pressure, a slight decrease inthe temperature and dewpoint temperature, and an increasein the wind speed. Ahead of the disturbance the wind wassouthwesterly, but as the disturbance approached, the windbacked to become southerly. Our data are inadequate todetermine whether this disturbance was the southerly orsoutheasterly disturbance. The trace shows also the passageof the trough and dry line, which arrive at 0715 EST and aremarked by a pronounced decrease in dewpoint temperature,an increase in wind speed, and the onset of a strong south-southeasterly flow.
Based on the foregoing analyses as well as simulationsof the events using a mesoscale numerical model (Weinzierlet al. 2007), enabled us to construct a conceptual modelof a possible mechanism for the formation of southerlyMorning Glories south of the gulf. This model is shownin Fig. 14 Frontogenesis occurs to the south of the heattrough after sunset. The strengthening cold front movesequatorward and collides with the sea breeze to the northof the trough. The sea-breeze air provides a surface-basedstable layer and a deep layer of well-mixed air from thecontinent lies over the sea breeze. Together these form awave guide on which the bore waves can propagate towardsthe north.
Copyright c© 2015 Meteorological Institute TMRR 1: 1–27 (2015)

DRY SEASON METEOROLOGY OF NORTHERN AUSTRALIA 9
Figure 13. Time series of surface data at (left) Augustus Downs and (right) Sweers Island on 9 October 2002. Temperature (T, solid curvein top panels) and dewpoint temperature (Td, dashed curve intop panels), wind speed (V), direction (Dirn), and pressure(p). The southerly
Morning Glory arrived at Sweers Island at 0645 EST and the southeasterly arrived at 0740 EST. Adapted from Smith et al. (2006).
4 The North Australian Cloud Line
The Gulf of Carpentaria region is frequented not onlyby Morning Glory wave clouds, but also by a range ofconvective cloud lines, often referred to generically asNorth Australian Cloud Lines (NACLs) or simply gulflines. Such lines form in the early evening along thenorthern part of the west coast of Cape York Peninsula,where the peninsula is relatively narrow. Subsequently,they move westwards across the gulf during the night andfollowing day. Like the Morning Glory, they originate as aresult of the collision between the two sea breezes fromthe east and west coasts of the peninsula, which for atypical broadscale easterly flow occurs near the west coastof the peninsula in the late afternoon (see e.g. Goler et al.2006, Reeder et al. 2013). During the dry season the cloudlines are mostly composed of shallow cumulus or cumuluscongestus clouds, whose vertical development is hinderedby the trade wind inversion at about 3 km. However, duringthe moist season the cloud lines may develop as lines ofthunderstorms that pose a significant forecasting problemin the region (Drosdowsky and Holland, 1987, Drosdowskyet al. 1989, Goler et al. 2006). An example of a dry-seasoncase is shown in Fig.15.
In September 2002, a major field experiment (the GulfLines EXperiment, GLEX) was organized by the Bureauof Meteorology, Monash University and the University ofMunich to study the NACL (Goler et al. 2006). FollowingGLEX, two further experiments were organized to studycloud lines over the Gulf of Carpentaria region: GLEXII in 2005 and GLEX III in 2006. GLEX II was carriedout in December to investigate the initiation of the NACL,which was accomplished using a small autonomous aircraftand two Doppler sodars. GLEX III focused on Morning
Glories over the southern part of the gulf region. Thisexperiment involved Doppler sodar measurements as wellas high-temporal-resolution data from operational AWSs.The findings from GLEX II and III were reported by Reederet al. (2013).
4.1 Summary of observations
The observations at Weipa showed that the degree ofasymmetry between west-coast and east-coast sea breezes(as characterized by the wind field alone) depends on thestrength of the background easterlies. No NACL developedon any day for which the maximum easterly measured bythe sodar was less than 5 m s−1, whereas an NACL formedon every day on which the maximum easterly exceeded5 m s−1. At Normanton, the sodar winds showed thatamplitude-ordered solitary waves developed downstreamwhen the background easterlies were less than about 10 ms−1. In contrast, either no jump or a single bore-like jumpformed downstream when the background easterlies weregreater than 10 m s−1 below a height of 700 m (which is thedepth of the boundary layer covered by the sodars). Takentogether, the observations from the two field experiments,carried out at opposite ends of the Cape York Peninsula,suggested that strong easterlies favour the formation of theNACL in the northwestern part of the peninsula, whereasweak easterlies favour the formation of the Morning Gloryin the southwest. This point is expanded upon in section8.
4.2 Numerical simulations
Thomsen and Smith (2006) described high-resolutionnumerical model simulations of low-level convergencelines that were documented during the GLEX experiment.
Copyright c© 2015 Meteorological Institute TMRR 1: 1–27 (2015)

10 R. K. SMITH AND M. J. REEDER
Figure 11. Bureau of Meteorology mean sea level pressure analysesat 2200 EST on 8 October and 1000 EST on 9 October 2002,again indicating conditions conducive to the formation of southerlyMorning Glories. The southerly Morning Glory was associated withthe trough line (marked by a dashed curve) as the line crossedover
the southern gulf.
The calculations provided further insights into the dynam-ics of the convergence lines and the mechanisms involvedin their formation. Notably, they show two clearly distinctconvergence lines, one that corresponds to the MorningGlory and the one that corresponds to the NACL. The for-mer originates from the east-coast sea breeze over CapeYork Peninsula south of about 14oS, while the latter orig-inates from the east-coast sea breeze north of this latitude.The calculations support also the conceptual model for thegeneration of southerly Morning Glories shown in Fig.14.In particular, they show the separation of a bore-like dis-turbance following the collision of a nocturnal cold front tothe south of the inland trough with a sea-breeze front to thenorth of the trough. Moreover, they show the progressivetransition of the east-coast sea-breeze front and the inlandcold front from gravity-current-like flows to bore-like dis-turbances overnight to form north-easterly and southerlyMorning Glories, respectively.
Numerical simulations reported in Reeder et al. (2013)show that the structure of convergence line produceddepends on the strength of the collision between the sea
Figure 12. GMS satellite image of the gulf region at 0832 ESTon 9 October (2232 UTC 8 October). The four sets of cloud linesidentified are the north Australian cloud line (NACL), the southerlyMorning Glory (SMG), a southeasterly Morning Glory (SEMG),anda northeasterly Morning Glory (NEMG). From Smith et al. (2006).
Figure 14. Conceptual model for the inland trough and its tendencyto spawn southerly Morning Glory bore waves at night. A meridionalcross section of the isentropes (solid lines) is shown with the coldestpotential temperatures shaded and the component of low-level airflow
indicated by arrows. (From Weinzierl et al. 2007).
breezes from each side of the Cape York Peninsula, whichin turn depends on the strength of the background easter-lies. When the easterlies are weak (< 10 m s−1), the seabreezes have similar depths and strengths, and their colli-sion leads to a relatively violent disturbance, whereas whenthe background easterlies are strong (> 10 m s−1) the seabreezes have very different depths and strengths and thedisturbance resulting from their collision is comparativelybenign.
The foregoing results are consistent with the observa-tional and numerical modelling work from GLEX I. Goleret al. (2006) found that the NACL develops at the leadingedge of a weak gravity current, referred to as a land breezeby these authors, which moves westwards from Cape York
Copyright c© 2015 Meteorological Institute TMRR 1: 1–27 (2015)

DRY SEASON METEOROLOGY OF NORTHERN AUSTRALIA 11
Figure 15. Aerial view of a North Australian Cloud Line over theGulf of Carpentaria.
Peninsula as the west-coast sea breeze decays. Strong east-erly flow was found behind the NACL with much weakereasterlies ahead of it. In numerical simulations, Goleret al.found that this land breeze was accompanied by conver-gence and upward motion at the leading edge of the weaklow-level cold pool, leading to the development of cloud.Presumably, NACLs require relatively strong backgroundeasterlies because such a flow produces stronger low-levelcold advection and, hence, stronger temperature gradientsat the leading edge of the land breeze. The numerical simu-lations reported in Reeder et al. (2013) is consistent alsowith the calculations of Goler and Reeder (2004), whofound that Morning Glories did not develop when the back-ground easterly flow exceeded 10 m s−1.
Calculations by Thomsen and Smith (2008) showedthe importance of the boundary layer parameterization inthe numerical prediction of low-level convergence linesduring the GLEX experiment. Calculations using five dif-ferent parameterizations were compared with the observa-tions to determine the optimum scheme for capturing theselines. The schemes that give the best agreement with theobservations are the three that include a representation ofcounter-gradient fluxes and a surface layer scheme based onMonin-Obukhov theory. One of these, the Medium-RangeForecast scheme, is slightly better than the other two, basedon its ability to predict the surface pressure distribution.The findings are important for the design of mesoscaleforecasting systems for the arid regions of Australia andelsewhere.
5 Forecasting possibilities
Following a preliminary study by Jackson et al. (2002),Weinzierl et al. (2007) examined the possibility of pre-dicting low-level convergence lines over northeastern Aus-tralia such as those which give rise to the Morning Glory.They used a mesoscale version of the Australian Bureau ofMeteorology’s operational Limited Area Prediction System
(MesoLAPS) and examined also aspects of the dynamics ofsuch cloud line disturbances. The predictions were madeduring the GLEX Experiment and were compared withdata collected during the experiment. An analysis of theentire 44-day period between 11 September and 24 Octobershowed that with appropriate interpretation, MesoLAPShad significant skill in forecasting the lines, but it did notcapture all of them. About 85% of forecasts of northeast-erly Morning Glories and southerly Morning Glories, or oftheir nonoccurrence, were correct, while the correspondingpercentage for the NACL was about 65%. However, about15% of northeasterly Morning Glories and about 35% ofNACL events that occurred were not forecast by the model.Only 6 out of 11 southerly Morning Glories were forecast.
The predicted orientation of the Morning Glories wasacceptable with a standard deviation error of 6o. In about50% of the cases, the times of passage were within an hourof those observed and there was a marked tendency forthe predicted lines to be late. MesoLAPS usually showslight winds at low levels ahead of the convergence lineswith a sharp increase in wind speed behind the lines as isobserved.
In the case of the two southerly Morning Gloriesdiscussed in subsections3.1 and3.2, the model was ableto capture the separation of a bore-like disturbance fromthe air mass change, although the model does not have theresolution to capture the wave-like structures that developat the leading edge of the bore waves. A detailed analysisof the MesoLAPS calculations indicated that the broad-scale generation mechanisms of northeasterly and southerlyMorning Glories are similar and it enabled the constructionof a conceptual model for the generation of southerlyMorning Glories shown in Fig.14.
6 Morning Glories in other parts of Australia
Although most research has focused on Morning Gloriesin north-eastern Australia, and especially on north-easterlydisturbances, similar disturbances have been reported else-where in Australia; e.g. the Australian National Univer-sity Warramunga Research Station near Tennant Creek(Christie et al. 1978, 1979, 1981); central Australian drysalt lakes (Physick and Tapper 1990); Sydney Airport(Manasseh and Middleton 1995); and central New SouthWales (Drake 1985). Those reported over southern Aus-tralia appear to have been associated with cold fronts asthey propagate into stable marine layers or thunderstormoutflows; e.g. the Spencer Gulf South Australia (Robin1978, Drake 1984); various locations over southern Aus-tralia (Clarke 1986); the Great Australian Bight (Schmidtand Goler 2010); Melbourne’s Port Phillip Bay (Physick1986); in advance of the Black Saturday cold front (Engelet al. 2013).
Another region of Australia where Morning Glory-like cloud lines are observed regularly is off northwestAustralia over the Indian Ocean. The first documentationof cloud lines in the region are due to Neal and Butterworth
Copyright c© 2015 Meteorological Institute TMRR 1: 1–27 (2015)

12 R. K. SMITH AND M. J. REEDER
(1973) and Smith (1986). Using visible satellite imagery,Birch and Reeder (2013) produced a climatology of wave-clouds in the region and found that two main types ofcloud lines form over northwestern Australia. The first typeoccur (at least) 2-3 times per month throughout the entireyear and are very similar in appearance to the MorningGlory of northeast Australia. Using the Met Office UnifiedModel, Birch and Reeder simulated the generation of anexample of this first type of wave cloud. The MorningGlory-like waves developed in synoptic-scale, low-levelsoutheasterly flow with a heat low along the northwestcoast of Australia. At night, the offshore southeasterliesaccelerate into the heat low and collide with the onshore seabreeze. The southeasterlies override the sea breeze, muchlike an intrusive gravity current, and the wave-cloud linesform at the leading edge of this front. (See section7.)
The second type of could lines are convectively-generated; they are more circular in shape and appear tooriginate from convective storms and occur (at least) onceper month during the wet season. The wave-cloud dis-cussed by Smith (1986) appears to have been of this sec-ond type. He reported that the cloud lines appeared to havebeen generated by the interaction between the onshore seabreeze and a northward-propagating gust front producedby the convective storms north of Port Hedland during theafternoon. Radiosonde observations from Port Hedland thatmorning showed a surface-based stable layer, formed bythe previous day’s sea breeze and nocturnal radiative cool-ing. Above this lay a near-neutral layer, produced by strongdiurnal heating on the previous day. This configuration pre-sumably provided an effective waveguide for the propaga-tion of disturbances produced by the collision of the twoflows. (See section8.) Using the Met Office Unified Model,Birch and Reeder found that that vertical wavelength wasthe depth of the troposphere. Such convectively generatedwave modes can produce lifting in the low part of the tropo-sphere, thereby increasing the Convective Available Poten-tial Energy (e.g. see Lane and Reeder 2001).
7 Laboratory experiments with colliding gravity cur-rents
The collision of two sea breezes can be illustrated ina relatively simple laboratory experiment. The apparatusconsists of a 2.5 m long plexiglass tank filled with water(Fig. 16). At each end of the tank are regions which can beisolated by two vertical plates. Salt and coloured dye areadded in these regions to increase the density of the waterby different amounts. The water on the left (coloured blue)has more salt added per unit volume than the water on theright (coloured red) and is therefore heavier than the redcoloured water.
At the start of the experiment, both retaining platesare removed and the heavier water on the left and rightflows towards the lighter uncoloured water as a pair ofgravity currents. The blue-coloured water flows to the right(Fig. 17a) and the red coloured water to the left (Fig.17b).
Figure 16. A simple laboratory experiment to demonstrate the inter-action of two sea breezes of different densities. See text for a descrip-
tion of the experiment.
Ultimately the two gravity currents collide and the lighterof the two, coloured red, ascends above the heavier bluecoloured current (Fig.17c). Following the collision, a waveis generated on the heavier (blue) water and this wave runsto the left, ahead of the red water. It is followed by an“intrusion” of the red water as a sort of tongue betweenthe blue and uncoloured water. The point at which the twogravity currents collide is chaotic and very turbulent. Onemay think of the blue coloured water as the west-coast seabreeze over Cape York Peninsula, the red coloured water asthe warmer east coast sea breeze, and the wave moving tothe left on the blue water as the Morning Glory.
8 Theoretical aspects
Weakly nonlinear wave theory is the foundation of much ofthe early theoretical description of the Morning Glory. Foran erudite review see Christie (1992). Before discussing itsapplication to the Morning Glory, a brief summary of themain points of the weakly nonlinear wave theory is useful.There are two versions of this theory. The first deals withlong waves on a single, homogenous fluid layer and may beapplicable to waves spanning the depth of the troposphere.In this version the governing equation is the Korteweg-deVries (KdV) equation. The second version of the theorydeals with long internal gravity waves propagating on ashallow stable fluid layer with a deep layer of neutrally-stable fluid above. In this version the governing equationis the Benjamin-Davis-Ono (BDO) equation (Benjamin1967, Davis and Acrivos 1967, Ono 1975). Both the KdVand BDO equations admit steady, propagating solutions,which include solitary and cnoidal (periodic) waves. Ageneral initial disturbance will evolve into a discrete setof amplitude ordered, steadily propagating solitary waves,along with an independent dispersive wave train. Thesolitary waves are ordered by amplitude as the larger wavespropagate faster.
Copyright c© 2015 Meteorological Institute TMRR 1: 1–27 (2015)

DRY SEASON METEOROLOGY OF NORTHERN AUSTRALIA 13
Figure 17. Colliding gravity currents with different densities illustrating the collision of two sea breezes with different temperatures behindthem. See text for a description of the experiment.
Christie et al. (1979) and Clarke et al. (1981) con-cluded that the Morning Glory could be described as aninternal undular bore similar to that described by Ben-jamin (1967). Using observed environmental profiles, Noo-nan and Smith (1985) found that weakly nonlinear the-ory was in reasonable agreement with the observed prop-agation speeds, although the theory gave horizontal wave-lengths that were too large by a factor of two. Timedependent integrations of the BDO equation by Christie(1989) and Christie and Muirhead (1983a, 1983b) illus-trated the asymptotic development of amplitude-orderedsolitary wave families from smooth initial conditions.Detailed reviews of weakly nonlinear theories applied as tothe Morning Glory can be found in two articles by Christie(1989, 1992). Egger (1985) investigated also the evolutionof an initial disturbance into a solitary wave train, but in thecontext of the KdV equation.
Consider now the effect of the background easterlieson the medium through which the Morning Glory propa-gates. Although Morning Glory waves have large ampli-tude, linear theory has been used to describe, at least quali-tatively, the structure of the wave guide on which they prop-agate (e.g. Crook 1986, Menhoferet al. 1997b). Accordingto the linear theory for a two-dimensional sinusoidal wavepropagating in a non-rotating, stably-stratified, Boussinesqatmosphere, the vertical wavenumberm is related to theenvironmental conditions through the expression
m(z)2 = l(z)2 − k2
where
l(z)2 =N(z)2
(U(z)− c)2−
Uzz
(U(z)− c)
is the Scorer Parameter,k is the horizontal wavenumber,z is the geometrical height,N is the Brunt-Vaisala fre-quency,U(z) is the component of the environmental flownormal to the wave andc is the horizontal phase speed.Small-amplitude gravity waves propagate vertically whenm is real, but are evanescent whenm is imaginary. Con-sequently, waves may be ducted when the environmentalconditions, characterized by the vertical structure of the
Scorer Parameter, restrict their propagation to a layer. Onesuch configuration, thought to be important for the Morn-ing Glory, is a stable surface-based layer permitting verti-cal propagation beneath a deep layer in which the wavesare evanescent, preventing the loss of wave energy fromthe lower layer through upward propagation. NortheasterlyMorning Glories propagate towards the southwest againstan opposing low-level westerly and, hence,U(z)− c >0. Crook (1988) investigated the conditions under whichMorning Glory waves will be long-lived. They are whenN(z)2 decreases with height, whenU(z) increases withheight, or whenUzz changes sign from negative in thestable surface layer to positive aloft. The last mechanismappears to be the one of most relevance to the MorningGlory. Menhofer et al. (1997a) calculated the distributionof the Scorer parameter from radiosonde soundings taken atBurketown on days on which Morning Glories were knownto have been generated over the Cape York Peninsula, butfailed to reach Burketown, and days on which MorningGlory were observed there. They showed that, althoughUzz/(U(z)− c) is mostly negative above the lowest fewhundred metres, it is not uniformly so. Consequently, theyconcluded that the waves must be continuously forced,otherwise the waves would quickly attenuate as energy islost through upward propagation. This finding is consistentwith the recent numerical modelling study by Smith andNoonan (1989) who concluded that energy losses associ-ated with the leakiness of the wave- guide in morning-glorywave disturbances may be at least partially offset by energygains associated with the evolving mesoscale patterns gen-erated by sea-breeze circulations.
The assumption of weak nonlinearity can be circum-vented by solving the equations of motion numerically. Cal-culations of this kind include those of Clarke (1984), Crookand Miller (1985), Haase and Smith (1989), and Goler andReeder (2004), all of which investigated the generation andpropagation of undular bores and solitary waves as a grav-ity current or sea breeze moves into a surface-based stablelayer. The key nondimensional parameter controlling thebehaviour of the flow isM = c0/cgr. Herec0 = 2Nh/π is
Copyright c© 2015 Meteorological Institute TMRR 1: 1–27 (2015)

14 R. K. SMITH AND M. J. REEDER
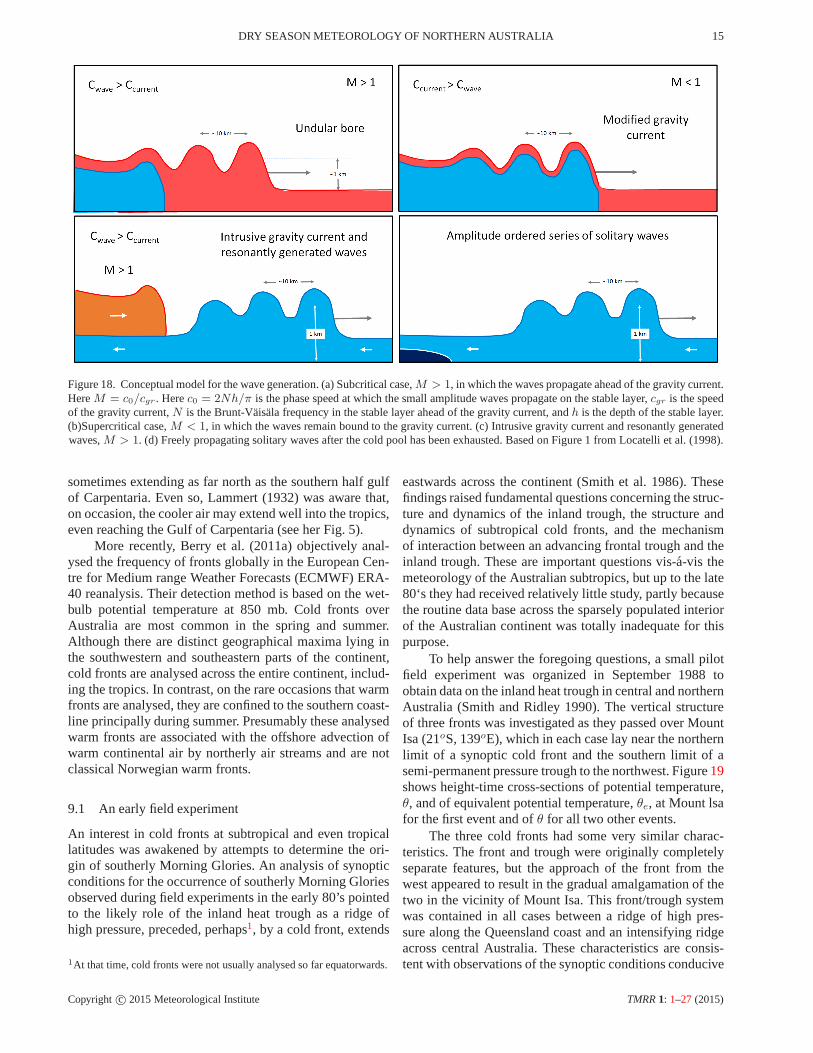
the phase speed at which the small amplitude waves prop-agate on the stable layer,cgr is the speed of the gravitycurrent,N is the Brunt-Vaisala frequency in the stable layerahead of the gravity current, andh is the depth of the sta-ble layer. For example, Goler and Reeder (2004) show thatwhen the phase speed of these waves matches the westwardpropagation speed of an intrusive gravity current (the east-coast sea breeze), waves grow to large amplitude. This sit-uation is shown schematically in Fig.18a. When the intru-sive gravity current (the east-coast sea breeze) propagatestoo fast relative to the waves, the waves do not amplify. Forthis perspective, solitary waves can be generated by a res-onant coupling between the east-coast sea breeze and thedisturbances that propagate on the shallow stable layer pro-duced by the west-coast sea breeze.
Haase and Smith (1989) investigated the collisionbetween a gravity current and a stable layer. They foundthat if the stable layer is sufficiently deep and/or strong sothat the phase speed of waves on the layer is sufficientlylarge compared to the speed of the gravity current, a non-linear wave disturbance forms and propagates ahead of thegravity current. This configuration is shown schematicallyin Fig. 18a. If the stable layer is too weak and/or shallowfor this to be the case, the stable layer profoundly affectsthe gravity current head, which develops one or more large-amplitude waves enveloping the colder air (Fig.18b). Inthis case the large-amplitude waves advect isolated regionsof intruding cold air ahead of the main body of the gravitycurrent. The first case (Fig.18a) is said to besubcriticaland the second casesupercritical (Fig. 18b).
Haase and Smithop. cit. found that the transition fromsubcritical to subcritical flow occurred at a value ofMaround 0.7. The transition point is less than one because,according to weakly nonlinear theory, the phase speed ofthe waves which propagate on the stable layer increaseswith increasing amplitude. The number of waves is relatedto the relative depth of the stable layer. As the stablelayer depth increases, the number of waves increases also,although their amplitudes decrease. Finally, as the cold poolhas finite volume, the solitary waves may run ahead of it asdepth of the cold air, and hence its speed, decreases withtime (Fig.18d).
Numerical simulations reported by Reeder et al.(2013) showed that the structure of the morning-glory dis-turbance produced depends on the strength of the colli-sion between the asymmetric sea breezes, which in turndepends on the strength of the background easterlies. Whenthe easterlies are comparatively weak, the sea breezes arerelatively symmetric and their collision relatively violent.These results suggest that this case is subcritical in thesense that the stable layer provided by the west-coast seabreeze is sufficiently deep and strong to enable waves topropagate faster than the speed of the the east-coast seabreeze. The disturbance subsequently evolves into a seriesof amplitude-ordered solitary waves that runs ahead of theeast-coast sea breeze as sketched in Fig.18c.
In contrast, when the background easterlies arestronger, the sea breezes are asymmetric. In this case, thecollision is comparatively gentle, with the east-coast seabreeze simply surmounting the west-coast sea breeze andrunning across the top of the cold air. These results suggestthat this case is supercritical in the sense that the speed ofsmall-amplitude waves supported on the layer of cold airadvected onshore by the west-coast sea breeze is smallerthan the typical wind speed behind the east-coast sea breeze(the configuration sketched in Fig.18b.) These conclusionsare supported by observation of Morning Glories at Morn-ington Island, far downstream from their point of origin.
9 Continental cold fronts in the Australian subtropicsand tropics
The classical models for cold and warm fronts developedin the 1920’s by the Bergen School of meteorologistshave survived as important components of a model forthe evolution of synoptic-scale low pressure systems inthe middle latitudes. However, the reluctance of Australianmeteorologists to analyze warm fronts over the Australiancontinent and unusual features of summertime cold frontsin southeastern Australia (some of them can be virtuallycloud free) cast doubt on the utility of the Norwegianmodel for extratropical cyclones over Australian. Indeed,Lammert (1932) noted that cold fronts there tended tohave much larger temperature contrasts to those in Europe,especially in summertime, and attributed this feature to thelarge temperature contrast between the hot continent andthe maritime environment to the south that was dominatedby the presence of Antarctica.
Recognition of the deficiency of the classical modelof cold fronts in the region led to the establishment of aCold Fronts Research Programme in Australia in the late70’s and early 80’s (Smith et al. 1982b). A special focuswas on the summertime “cool change”, a kind of cold frontthat that brings relief to communities in the southern partof the continent after sometimes many days of scorchinghot northerly winds from the continent. Three field exper-iments were organized as part of the research programmeand these together with theoretical and numerical studiesthat the programme led to a new conceptual model of thecool change which differed considerably in detail from theclassical Norwegian model. Unlike the classical cold front,many summertime cool changes were shallow and com-pletely dry and it was evident that deep turbulent mixingover the strongly heated continent had an important role inthe structure of these fronts. A review of the summertimecool change and a comprehensive list of references thereonis given by Reeder and Smith (1992).
Despite the progress in understanding the structure ofthe summertime cold front, which may be connected to aparent low over the Southern Ocean, there was still a reluc-tance by forecasters to analyse cold fronts very far into theinterior of the continent. Rather, the equatorwards portionof the surface front was analysed as an inland trough line,
Copyright c© 2015 Meteorological Institute TMRR 1: 1–27 (2015)
DRY SEASON METEOROLOGY OF NORTHERN AUSTRALIA 15
Figure 18. Conceptual model for the wave generation. (a) Subcritical case,M > 1, in which the waves propagate ahead of the gravity current.HereM = c0/cgr . Herec0 = 2Nh/π is the phase speed at which the small amplitude waves propagate on the stable layer,cgr is the speedof the gravity current,N is the Brunt-Vaisala frequency in the stable layer ahead of the gravity current, andh is the depth of the stable layer.(b)Supercritical case,M < 1, in which the waves remain bound to the gravity current. (c) Intrusive gravity current and resonantly generatedwaves,M > 1. (d) Freely propagating solitary waves after the cold pool has been exhausted. Based on Figure 1 from Locatelli et al. (1998).
sometimes extending as far north as the southern half gulfof Carpentaria. Even so, Lammert (1932) was aware that,on occasion, the cooler air may extend well into the tropics,even reaching the Gulf of Carpentaria (see her Fig. 5).
More recently, Berry et al. (2011a) objectively anal-ysed the frequency of fronts globally in the European Cen-tre for Medium range Weather Forecasts (ECMWF) ERA-40 reanalysis. Their detection method is based on the wet-bulb potential temperature at 850 mb. Cold fronts overAustralia are most common in the spring and summer.Although there are distinct geographical maxima lying inthe southwestern and southeastern parts of the continent,cold fronts are analysed across the entire continent, includ-ing the tropics. In contrast, on the rare occasions that warmfronts are analysed, they are confined to the southern coast-line principally during summer. Presumably these analysedwarm fronts are associated with the offshore advection ofwarm continental air by northerly air streams and are notclassical Norwegian warm fronts.
9.1 An early field experiment
An interest in cold fronts at subtropical and even tropicallatitudes was awakened by attempts to determine the ori-gin of southerly Morning Glories. An analysis of synopticconditions for the occurrence of southerly Morning Gloriesobserved during field experiments in the early 80’s pointedto the likely role of the inland heat trough as a ridge ofhigh pressure, preceded, perhaps1, by a cold front, extends
1At that time, cold fronts were not usually analysed so far equatorwards.
eastwards across the continent (Smith et al. 1986). Thesefindings raised fundamental questions concerning the struc-ture and dynamics of the inland trough, the structure anddynamics of subtropical cold fronts, and the mechanismof interaction between an advancing frontal trough and theinland trough. These are important questions vis-a-vis themeteorology of the Australian subtropics, but up to the late80‘s they had received relatively little study, partly becausethe routine data base across the sparsely populated interiorof the Australian continent was totally inadequate for thispurpose.
To help answer the foregoing questions, a small pilotfield experiment was organized in September 1988 toobtain data on the inland heat trough in central and northernAustralia (Smith and Ridley 1990). The vertical structureof three fronts was investigated as they passed over MountIsa (21oS, 139oE), which in each case lay near the northernlimit of a synoptic cold front and the southern limit of asemi-permanent pressure trough to the northwest. Figure19shows height-time cross-sections of potential temperature,θ, and of equivalent potential temperature,θe, at Mount lsafor the first event and ofθ for all two other events.
The three cold fronts had some very similar charac-teristics. The front and trough were originally completelyseparate features, but the approach of the front from thewest appeared to result in the gradual amalgamation of thetwo in the vicinity of Mount Isa. This front/trough systemwas contained in all cases between a ridge of high pres-sure along the Queensland coast and an intensifying ridgeacross central Australia. These characteristics are consis-tent with observations of the synoptic conditions conducive
Copyright c© 2015 Meteorological Institute TMRR 1: 1–27 (2015)

16 R. K. SMITH AND M. J. REEDER
Figure 19. Height-time cross-sections of (a) potential temperatureθ and (b) equivalent potential temperatureθe at Mount lsa for Event 1 andof θ for (c) Event 2 and (d) Event 3. Heights are above ground leveland isopleths are labelled in deg. C.
to the formation of southerly Morning Glories in the gulfarea (see section3 above).
9.2 The Central Australian Fronts Experiment 1991
The Central Australian Fronts Experiment (CAFE) wasorganized to provide a more comprehensive data set onsubtropical cold fronts that could be used to answer someof the basic questions about frontal structure and behaviourand to help confirm or reject predictions obtained frommodel simulations. The experiment ran from 7 Septemberuntil 4 October 1991 and documented three cold frontsover central and northeastern Australia in unprecedenteddetail, with data obtained from a greatly enhanced surfaceobserving network, a boundary-layer wind profiler as wellas serial upper-air soundings (a map of the observationalnetwork is shown in Fig.20). Data on the surface energybalance were obtained also. The findings of the experimentare reported by Smith et al. (1995), Reeder et al. (1995),and Deslandes et al. (1999).
9.3 The structure of dry subtropical cold fronts
A common feature of all six fronts documented duringCAFE and of the pilot experiment (pre-CAFE) was that
they were dry, shallow (around 1 km deep), and moved intoa deep (around 4 km) convectively-well-mixed boundarylayer. During the night, the well-mixed layer was termi-nated below by a strong, but shallow radiation inversion.One of the fronts initiated major dust storms across centralAustralia.
The synoptic environment of these fronts was similarto that of the summertime “cool-change” of southeasternAustralia with frontogenesis occurring in the col regionbetween the two subtropical anticyclones, relatively farfrom the centre of the parent cyclone (Reeder and Smith1992, Fig. 21). A unique feature of the region is thepresence of a heat trough over northeastern Queenslandwith which the frontal trough eventually merges. Generally,the frontal passage is followed by strong ridging from thewest.
The data obtained during the CAFE experiment high-lighted the large diurnal variation of frontal structure asso-ciated with diabatic processes. The fronts were difficult tolocate during the late morning and afternoon when dry con-vective mixing was at its peak, but developed strong surfacesignatures in the evening as the convection subsided anda surface-based radiation inversion developed. Moreover,there appeared to be a ubiquitous tendency in the early
Copyright c© 2015 Meteorological Institute TMRR 1: 1–27 (2015)

DRY SEASON METEOROLOGY OF NORTHERN AUSTRALIA 17
Figure 20. Map of the observational network for the 1991 CAFEexperiment. From Smith et al. (1995).
Figure 21. A typical mean sea level chart with a trough line (indicatedin the analysis by a dashed line) extending from a heat low overWestern Australia around the northern perimeter of an anticyclonethat is crossing the continent to a cold front that is crossing thesoutheastern part of Australia. Although not analysed as such, the
trough line is essentially a shallow cold front.
morning for the formation of non-linear wave-like or bore-like structure at the leading edge of the frontal zone asthe inversion strengthened. In each case, as the wave/boredeveloped, it was observed to propagate ahead of the airmass change on the pre-existing inversion. Such behaviourwas exemplified by the data for the first two events duringCAFE. In the latter case, the data are unique in provid-ing the first clear evidence of the formation of a southerlyMorning Glory bore-wave in the Gulf of Carpentaria regionfrom a cold front in the south. The passage of a bore brings
Figure 23. (a) Vertical profiles of potential temperature and virtualpotential temperature,θ(z) and θv(z), in the prefrontal and post-frontal air mass at Alice Springs for the first event during CAFE. Thefrontal passage at Alice Springs occurred at 0355 EST 9 September.(b) Vertical profiles of potential temperatureθv(z) in the prefrontaland postfrontal air masses at Mount lsa for the first event duringCAFE, which arrived at Mount Isa at 0940 EST I 0 September. Thesoundings at 2100 EST 9 September and at 0600 and 0900 EST 10September are therefore about 13, 3, and I h before the frontal pas-sage, respectively. The soundings at 1200 and 1500 EST are about 2and 5 h after the frontal passage. Adapted from Smith et al. (1995).
a strong, but temporary wind surge at the surface accom-panied by a sharp pressure jump. These are followed bya series of wind and pressure oscillations with a period of10-15 min, before the steadier post-frontal airflow is estab-lished. There is no air mass change with the passage of thebore, but the vigorous turbulence that accompanies it maylead to a breakdown of any shallow radiation inversion thatexists, leading to an actualrise in surface temperature.
9.4 The Central Australian Fronts Experiment 1996
The Central Australian Fronts Experiment 1996 (CAFE96)was the third in a series of field experiments designedto document the behaviour of subtropical continental coldfronts during the late dry season. Its central aim was toinvestigate the structure and dynamics of subtropical coldfronts that affect central Australia and prior to their evo-lution into bore-like disturbances as they approached theGulf of Carpentaria region. The experiment was carriedout in the region between Giles in Western Australia andBurketown in northwestern Queensland from the end ofAugust until early October 1996. A special network of sur-face measuring stations was installed in the normally datavoid region between Yulara and Mount Isa and betweenMount Isa and Burketown. These included fourteen AWSsthat were deployed along a southwest/northeast orientedline between Giles and the lower Cape York Peninsula.
Seven fronts were documented in detail duringCAFE96 and, by and large, they confirmed the conclusionsfrom CAFE91. The results of the experiment are presentedin Reeder et al. (2000), which focused principally on threefrontal systems: Events 3, 4 and 6. Events 4 and 6 were
Copyright c© 2015 Meteorological Institute TMRR 1: 1–27 (2015)

18 R. K. SMITH AND M. J. REEDER
Figure 22. Surface data from Tarlton Downs and Urandangi (for location see Fig. 2) for the first frontal passage during theCAFE experiment.The panels show from top to bottom: the temperature in deg. C,the water vapour mixing ratio in gm/kg, the wind speed in m/sec, the winddirection, and the pressure in mb (the dew point temperaturewas unavailable at Tarlton Downs). Note the undular bore-like disturbance thatoccurs about 0700 Eastern Australian Time (EST). Its passage is marked by sharp jumps in pressure and temperature, a sharp change in winddirection from WNW to SW and a marked freshening of the wind. The temperature rise is a result of the destruction of the shallow nocturnalradiation inversion as the wind freshens. The passage is followed by regular fluctuations in pressure and in wind speed and direction for threequarters of an hour. The passage of the cold front, itself, isindicated by the sharp increase in wind speed and a further backing of the windabout 0815 EST. Following this, the temperature begins to decline steadily, the pressure begins a steady rise and the mixing ratio falls sharply.
Adapted from Smith et al. (1995).
emphasized because aspects of their structure and evolu-tion were a little different from the previously reportedparadigm. For example, of the 14 fronts documented indetail during CAFE96, CAFE91 and pre-CAFE, only theseevents were detected during the late morning or afternoon.Moreover, Event 6 decayed over central Australia, only tore-intensify two days later over the northeastern part of thecontinent. Unlike most of the 14 fronts studied, Events 4and 6 were accompanied by severe weather over easternAustralia. Event 4 re-intensified during late afternoon andsubsequently crossed the eastern half of the network. Thefront continued to intensify overnight, generating a spectac-ular family of southerly bore waves (or southerly MorningGlories). By the end of the event, a zone of strong equiv-alent potential temperature gradient stretched across thewhole of northern Australia.
Event 6 developed in a broad, slow-moving, extra-tropical cyclone that advanced across southern Australia.The system had the structure of classical mature extra-tropical cyclone and was accompanied by a cold front andstrong warm front. Recent research (Berry et al. 2011a,see Fig. 3) suggests that warm fronts are uncommon inthe region, but Event 6 is an example of one. Warm frontsgenerally lie poleward of the low and hence south of theSouthern Ocean storm track. The cold front, itself, strength-ened and moved northeastwards across central Australia inthe early hours of 28 September 1996, arriving at Santa
Teresa at 0730 CST and at Alice Springs at 1010 EST (0940CST). However, as the daytime turbulent mixing increased,the front stalled and retreated back through Alice Springsat 1125 CST, bringing with it northwesterlies and blowingdust. The front retreated through Santa Teresa about 1330CST. It subsequently weakened and there is little clear evi-dence that it crossed the network again. While it is probablyquite common for the position of subtropical cold fronts tooscillate back and forth in response to the daytime turbulentmixing, Event 6 is the only documented example of whichwe are aware.
It must be emphasized that we do not consider theleading edge of the front to be a material surface beingadvected back and forth across the centre of the continent.Rather, the leading edge of the front is generally much shal-lower than the depth of the daytime mixed layer and weenvisage that the nose of the front is eroded by turbulentmixing in the vertical, leaving a broadscale horizontal tem-perature gradient. At night, once the (buoyantly-generated)turbulent mixing subsides, the large-scale pattern of defor-mation acts to re-establish a strong cross-frontal tempera-ture gradient. The dynamics of fronts like Event 6 is largelyunknown and is a topic for further research. As the ridgebuilt across the continent, strong frontogenesis developedover northeastern Australia on 30 September 1996. Thesurface pressure pattern implied very strong geostrophicdeformation over central and northern Queensland with the
Copyright c© 2015 Meteorological Institute TMRR 1: 1–27 (2015)

DRY SEASON METEOROLOGY OF NORTHERN AUSTRALIA 19
Figure 24. Time-height cross sections of potential temperature atMount lsa for (a) CAFE Event I and (b) CAFE Event 2. Adapted
from Smith et al. (1995).
dilatation axis along the trough axis. Event 6 re-formedlocally and crossed the northeastern part of the observa-tional network during the late morning of 30 September.
The structure and evolution of Event 3 was typical ofthose subtropical fronts reported previously. It strengthenedand accelerated during the evening of 11 September 1996,and crossed the observational network during the nightand early morning hours. Strong near-surface warmingfollowed the passage of the front. This warming wasdetected in the enhanced satellite imagery and confirmedby surface measurements.
The study Reeder et al. (2000) emphasized the utilityof low-level cyclonic relative vorticity in analyzing frontsover continental Australia. Although not commonly usedin frontal analysis, low-level cyclonic relative vorticity hasproved to be reliable indicator of frontal position even whenthe front is affected by strong spatial and temporal changesin sensible heating. While the fronts in the Australiansubtropics often show little continuity in most fields (suchas temperature), they can be traced continuously in thefields of vorticity and equivalent potential temperature.
Figure 25. (a) Surface pressure signatures recorded at microbaro-graph stations at and to the south of Burke and Wills Roadhouseduring the first CAFE event. The signatures are arranged sequentiallywith the southwesternmost station (Jervois) at the top and northeast-ernmost (Burke and Wills) at the bottom. Note the development ofa wavelike signature as the disturbance moves northeastward, priorto its demise northeast of Camooweal. (b) Surface pressure signa-tures recorded at microbarograph stations at and to the northeast ofCamooweal during the second CAFE event. As in Fig. 11, the sig-natures are arranged sequentially. Again, note the development of anundular-bore-like signature as the disturbance moves northeastward
during the night and early morning. From Smith et al. (1995).
In general, the results of CAFE96 confirmed the con-clusions drawn from the two previous experiments, butthey raise a number of theoretical questions concerning theeffect of turbulent mixing on the evolution and progres-sion of subtropical cold fronts. Idealised modelling of coldfronts with turbulent boundary layers has shown that thenet of effect of the boundary layer is to weaken the frontrelative to a front without a boundary layer. Moreover, thecross-front ageostrophic wind increased and the pre-frontalupdraught strengthened (Reeder and Smith 1986, Tory andReeder 2005, Muir and Reeder 2010). The results are qual-itatively similar to the effect of adding an Ekman boundarylayer.
When surface sensible heating and cooling is includedin these idealised calculations (Reeder and Tory 2005, Muirand a Reeder 2010), the fronts weaken during the day and
Copyright c© 2015 Meteorological Institute TMRR 1: 1–27 (2015)
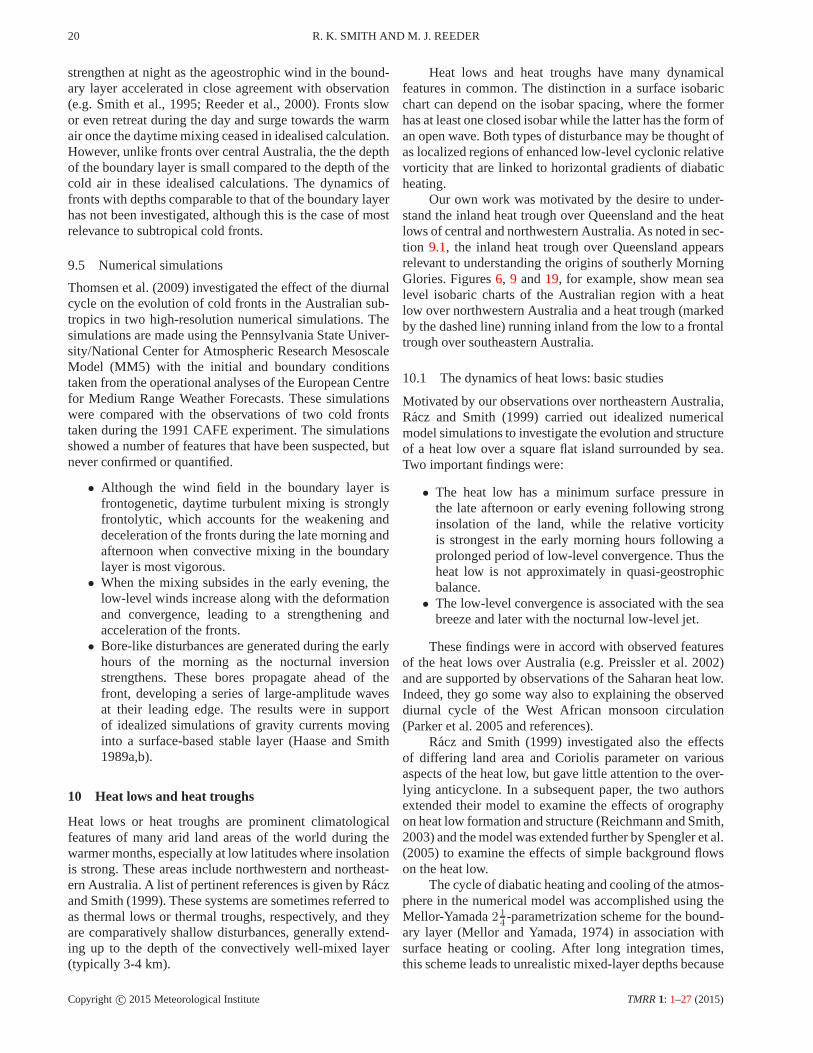
20 R. K. SMITH AND M. J. REEDER
strengthen at night as the ageostrophic wind in the bound-ary layer accelerated in close agreement with observation(e.g. Smith et al., 1995; Reeder et al., 2000). Fronts slowor even retreat during the day and surge towards the warmair once the daytime mixing ceased in idealised calculation.However, unlike fronts over central Australia, the the depthof the boundary layer is small compared to the depth of thecold air in these idealised calculations. The dynamics offronts with depths comparable to that of the boundary layerhas not been investigated, although this is the case of mostrelevance to subtropical cold fronts.
9.5 Numerical simulations
Thomsen et al. (2009) investigated the effect of the diurnalcycle on the evolution of cold fronts in the Australian sub-tropics in two high-resolution numerical simulations. Thesimulations are made using the Pennsylvania State Univer-sity/National Center for Atmospheric Research MesoscaleModel (MM5) with the initial and boundary conditionstaken from the operational analyses of the European Centrefor Medium Range Weather Forecasts. These simulationswere compared with the observations of two cold frontstaken during the 1991 CAFE experiment. The simulationsshowed a number of features that have been suspected, butnever confirmed or quantified.
• Although the wind field in the boundary layer isfrontogenetic, daytime turbulent mixing is stronglyfrontolytic, which accounts for the weakening anddeceleration of the fronts during the late morning andafternoon when convective mixing in the boundarylayer is most vigorous.
• When the mixing subsides in the early evening, thelow-level winds increase along with the deformationand convergence, leading to a strengthening andacceleration of the fronts.
• Bore-like disturbances are generated during the earlyhours of the morning as the nocturnal inversionstrengthens. These bores propagate ahead of thefront, developing a series of large-amplitude wavesat their leading edge. The results were in supportof idealized simulations of gravity currents movinginto a surface-based stable layer (Haase and Smith1989a,b).
10 Heat lows and heat troughs
Heat lows or heat troughs are prominent climatologicalfeatures of many arid land areas of the world during thewarmer months, especially at low latitudes where insolationis strong. These areas include northwestern and northeast-ern Australia. A list of pertinent references is given by Raczand Smith (1999). These systems are sometimes referred toas thermal lows or thermal troughs, respectively, and theyare comparatively shallow disturbances, generally extend-ing up to the depth of the convectively well-mixed layer(typically 3-4 km).
Heat lows and heat troughs have many dynamicalfeatures in common. The distinction in a surface isobaricchart can depend on the isobar spacing, where the formerhas at least one closed isobar while the latter has the form ofan open wave. Both types of disturbance may be thought ofas localized regions of enhanced low-level cyclonic relativevorticity that are linked to horizontal gradients of diabaticheating.
Our own work was motivated by the desire to under-stand the inland heat trough over Queensland and the heatlows of central and northwestern Australia. As noted in sec-tion 9.1, the inland heat trough over Queensland appearsrelevant to understanding the origins of southerly MorningGlories. Figures6, 9 and19, for example, show mean sealevel isobaric charts of the Australian region with a heatlow over northwestern Australia and a heat trough (markedby the dashed line) running inland from the low to a frontaltrough over southeastern Australia.
10.1 The dynamics of heat lows: basic studies
Motivated by our observations over northeastern Australia,Racz and Smith (1999) carried out idealized numericalmodel simulations to investigate the evolution and structureof a heat low over a square flat island surrounded by sea.Two important findings were:
• The heat low has a minimum surface pressure inthe late afternoon or early evening following stronginsolation of the land, while the relative vorticityis strongest in the early morning hours following aprolonged period of low-level convergence. Thus theheat low is not approximately in quasi-geostrophicbalance.
• The low-level convergence is associated with the seabreeze and later with the nocturnal low-level jet.
These findings were in accord with observed featuresof the heat lows over Australia (e.g. Preissler et al. 2002)and are supported by observations of the Saharan heat low.Indeed, they go some way also to explaining the observeddiurnal cycle of the West African monsoon circulation(Parker et al. 2005 and references).
Racz and Smith (1999) investigated also the effectsof differing land area and Coriolis parameter on variousaspects of the heat low, but gave little attention to the over-lying anticyclone. In a subsequent paper, the two authorsextended their model to examine the effects of orographyon heat low formation and structure (Reichmann and Smith,2003) and the model was extended further by Spengler et al.(2005) to examine the effects of simple background flowson the heat low.
The cycle of diabatic heating and cooling of the atmos-phere in the numerical model was accomplished using theMellor-Yamada2 1
4-parametrization scheme for the bound-
ary layer (Mellor and Yamada, 1974) in association withsurface heating or cooling. After long integration times,this scheme leads to unrealistic mixed-layer depths because
Copyright c© 2015 Meteorological Institute TMRR 1: 1–27 (2015)

DRY SEASON METEOROLOGY OF NORTHERN AUSTRALIA 21
the only mechanism for cooling to oppose the et heatingof the atmosphere is that which occurs in a shallow layeradjacent to the surface. In an effort to remove this limita-tion, in their study of orographic effects, Reichmann andSmith (2003) incorporated the radiation scheme proposedby Raymond (1994) into the model. This scheme is basedon a grey atmosphere approximation and allows the atmos-phere to cool, thereby preventing the long-term growth ofthe mixed layer.
10.2 Effects of a simple background flow
Calculations for a heat low in simple background flowswere carried out by Spengler et al. (2005). Like the casewithout a background flow, the flow shows a significantdiurnal variation in which the sea-breeze circulations arethe prominent feature during the daytime and the nocturnallow-level jet is the prominent feature at night. If the landarea is large enough so that the sea breezes do not coverit entirely during the diurnal cycle, strong convergenceassociated with the low-level jet leads to the formation ofintense, but shallow, cold fronts along the inland boundariesof sea-breeze air. These fronts decay rapidly after sunrisewhen surface heating leads to renewed vertical mixing,which destroys the low-level stable layer.
The presence of a uniform easterly flow leads to theformation of a west-coast trough, similar to the situationcommonly observed over Western Australia. The troughbroadens during the day due to the heating of the land,while at night it sharpens and again frontogenesis occursat low levels near the leading edge of the sea breezesto form shallow cold fronts. In this case here is an east-west asymmetry in the sea-breeze circulations: the coolair behind the west-coast sea breeze is shallower than thatbehind the east-coast sea breeze, but the vertical circulationassociated with the west-coast sea breeze is deeper. Theeast-coast sea-breeze front penetrates further inland, butis more diffuse and is recognizable more by its signaturein the relative vorticity than by that in the horizontaltemperature gradient.
The presence of a horizontal shear-flow leads to thedeformation of the heat trough, a process that appears toplay an important role in the formation of cold fronts overcentral Australia. Again the calculations show the forma-tion of shallow fronts over the land during the night, whichfrontolyse rapidly after sunrise. Despite the idealized natureof the calculations, the associated patterns of low-levelvorticity, divergence and horizontal temperature gradientthat develop overnight show remarkable similarity to thoseobserved over central Australia.
10.3 An improved numerical model
During the course of the foregoing study, Thomas Spenglerdiscovered some errors in the model initialization and inthe numerical implementation of the radiation scheme byReichmann and Smith (2003) and also errors in Raymond’s
(1994) paper. The errors in the initialization were found tohave a negligible effect on the results presented by Reich-mann and Smith and those made in the implementation ofthe radiation scheme had only a small impact. However,their existence motivated the development of a new ideal-ized model with an improved radiation scheme (Spenglerand Smith 2008). This new model was run with a higherhorizontal resolution than the original version and usedto investigate additional dynamical aspects of the struc-ture and evolution of a heat low over a subcontinental- orcontinental-scale circular island. These aspects included:
• the development of an upper-level anticyclone, and• the degree to which the cyclonic and anticyclonic
circulations are in gradient wind balance.
Figure26shows height-radius cross sections of poten-tial temperature and tangential wind speed in the late after-noon (1700 h) on day 11 in the calculations for a circularisland of radius 800 km. At this time, the effects of insola-tion are near a maximum. The potential temperature fieldshows a mixed layer (characterized by the depth of theregion of uniform potential temperature at the centre of thedomain of just over 4 km, a value that is typical of inlandsoundings across central Australia. The low-level windsare cyclonic and relatively light at this time, not exceed-ing 4 m s−1. The most striking feature of the azimuthalwind field at 1700 h is the anticyclone, which has a max-imum wind speed of over 12 m s−1 at heights betweenabout 2 and 3 km. Interestingly, this anticyclone extendsthroughout much of the troposphere, although it decreasesin strength with height in the upper troposphere. This decayis consistent with slightly cooler air overlying the heat low,assuming thermal wind balance.
In a mean sense one can distinguish between distinctpatterns of the tangential flow component in the heat low:
• between midnight and noon, when the low-levelcyclone is strongest, and
• between noon and midnight when it is much weaker.
These differences reflect the strong turbulent mixingof momentum in the mixed layer over land during theafternoon, which leads to a significant weakening of thecyclone, and the formation of a strong low-level jet at night,which re-amplifies the cyclone circulation.
The calculations showed that the upper-level anticy-clone extends through much of the troposphere, but hasits maximum strength in the lower troposphere, just off-shore. It exhibits relatively little diurnal variation when theheat low reaches its mature stage; much less so than thelow-level cyclone. The anticyclone develops steadily overa period of a few days and is associated with the return(offshore) branch of the sea-breeze circulation in the lowertroposphere and a slow diurnal-mean outflow in the mid-dle and upper troposphere. The outflow at upper levelsmay be interpreted as a mean drift induced by upward-propagating inertia-gravity waves that are initiated by the
Copyright c© 2015 Meteorological Institute TMRR 1: 1–27 (2015)

22 R. K. SMITH AND M. J. REEDER
(a) (b) (c)
(d) (e) (f)
Figure 26. Height-radius cross sections of potential temperature (left panels), tangential wind component (middle panels), and radial windcomponent (right panels) at selected times (upper panels 1700 h, lower panels 0500 h) during the mature stage of the calculation (day 11).Contour interval for potential temperature 2 K; for tangential wind 2 m s−1, solid lines indicate cyclonic and dashed lines anticycloniccirculation; and radial wind speed 1 m s−1; solid lines indicate outward and dashed lines inward flow. Only half of the domain is shown in
the case of the wind fields. The thick black line along the abscissa shows the region of land. (From Spengler and Smith 2008).
inland-penetrating sea-breeze front during the afternoonand evening.
Spengler and Smith showed that there is a strong anal-ogy between the dynamics of heat lows and to certainaspects of the dynamics of tropical cyclones, which havea warm core, a shallow unbalanced boundary layer, andwhich are surmounted also by an anticyclone. Principlesgoverning the absolute angular momentum budget are thesame as those relating to the tropical cyclones (Smithet al.2014) and to the zonal-mean flow over Antarctica (Egger1985). Implications of these principles for obtaining a real-istic steady state in long-term integrations of axisymmetricmodels were discussed.
10.4 The effects of orography
In a subsequent paper, Smith and Spengler (2010) inves-tigated orographic effects on the dynamics of heat lows,again in in an idealized flow configuration. The behaviourof the heat low that forms over a plateau-like orography ona circular island is compared with that when the island isflat, and that when the plateau is surrounded by land insteadof sea. In all cases, a broad-scale, negative radial gradi-ent of potential temperature forms in the daytime mixedlayer over land. The presence of orography enhances thebroad-scale baroclinicity over the orographic slope due tothe identical heating of a column of air with a reduced mass,
i.e. lower surface pressure. In the absence of sea, the baro-clinicity is solely confined to the slope of the orography.
The broadscale potential temperature gradient resultsin an overturning circulation in the lowest few kilometres,which is separate from the shallower and more intensesea breeze circulation in the island cases. The presenceof orography leads to a stronger overturning circulationvia enhanced baroclinicity. In the case without sea, boththe overturning circulation and tangential circulation areclosely tied to the orography. The overturning circulationadvects absolute angular momentum surfaces inwards tospin up the low-level circulation, despite some frictionalloss of angular momentum enroute. During the night,radiative cooling over the land leads to a strong nocturnallow-level jet that amplifies the spin-up process. During thedaytime, the cyclone weakens as the angular momentum isconvectively mixed through a deep layer.
11 Dry lines
Perhaps the most striking feature of the low-level seasonalclimatologies of the Australian region the diurnally-varyingairmass boundaries in the northern part of the continent(Arnup and Reeder 2007). As an example, Fig.27(a,b)shows the seasonal average mixing ratio gradient and
Copyright c© 2015 Meteorological Institute TMRR 1: 1–27 (2015)

DRY SEASON METEOROLOGY OF NORTHERN AUSTRALIA 23
potential temperature at 925 mb for September-October-November (SON) at 1600 EST and 0400 EST. This clima-tology is based on climatologies of 3 hour forecasts fromthe high-resolution Australian Bureau of Meteorology’sLimited Area Prediction Scheme (LAPS) from 2000 to2003. The largest moisture gradients lie on the boundarybetween the moist tropical and dry continental air masses.Although the coastal gradient is relatively weak comparedto the strong gradient that marks the dry line, the coastalgradient occurs every day in the same geographical loca-tion, and consequently masks the signal of the dry line,which is less frequent, more intense, and more variablein its location. For this reason, the points where the mix-ing ratio gradient is less than 5.0× 10⁻⁵ g kg−1 m−1 areexcluded from the calculation of the average. This condi-tional average effectively filters the coastal gradient fromthe averaged fields. During the day the sea breeze advectstropical maritime air inland, producing a diffuse strip ofmoist air around the coastline. Subsequently the dry linedevelops overnight from the weak boundary between thetropical and continental air masses. Like the sea breeze cir-culation, the dry line is strongest in spring and summer.
In contrast to the dry line of the Great Plains in theUnited States, the Australian dry line strengthens overnight.(For a comparison of the Australian and Great Plainsdry lines, see Arnup and Reeder 2009). This nocturnalstrengthening is part of the dramatic diurnal rearrangementof the low-level flow discussed in section10. For example,Fig. 27(c,d) shows the average ageostrophic wind anddivergence at 925 mb and MSLP for SON at 1600 ESTand 0400 EST. During the day, surface heating leads tothe formation of an extensive heat trough across northernAustralia. The trough is centred to the northwest of thecontinent and extends eastwards, poleward of the Gulf ofCarpentaria to the base of Cape York Peninsula. Althoughnot shown here, the location of the trough shifts from 20oSin summer, to well equatorward of Australia in winter, asthe latitude of maximum of solar insolation moves withthe seasons (Arnup and Reeder 2009). At night, radiativecooling leads to the development of a stable layer in whichthe surface friction is reduced. As surface winds readjustto a new balance of forces, air accelerated toward lowpressure, increasing the low-level convergence in the heattrough. Convergence acts to strengthen the backgroundmoisture gradient in the region of the heat trough.
The development of the dry line poleward of the Gulfof Carpentaria and the southerly Morning Glory are closelyrelated. Both form overnight when the inland airmass accel-erates down the pressure gradient over northern Australiaand meets the sea breeze propagating inland from the Gulfof Carpentaria. The southerly Morning Glory occurs whenthe pressure gradient is sufficiently strong to force theinland airmass to either collide with or ride over the seabreeze (e.g. Thomsen et al. 2009). Presumably the range ofpossibilities sketched in Fig.18 are applicable to the inter-action of the subtropical cold front and stable layer asso-ciated with the sea breeze from the gulf. When the speed
of the surging inland airmass matches the phase speed ofwaves developing along the sea breeze, an undular bore-like wave propagates ahead of the dry line into the Gulfof Carpentaria. It is principally strong ridging over cen-tral Australia that produces the strong meridional temper-ature and pressure gradients required for the formation ofthe southerly Morning Glory, however these gradients areenhanced by the heat trough. It follows that the southerlyMorning Glory and the dry line frequently form in the samelocation.
12 Outstanding questions
Although it is more than three and a half decades since thefirst Morning Glory expedition, and much has been learnt,the difficulty in taking observations in the northern Aus-tralia means that there are still aspects of the Morning Gloryabout that remain uncertain. These include the following.
• The nature of the wave guide as dry, daytime con-vection over land resumes remains to be determined.Presumably, as the inversion is eroded from below,the wave guide becomes progressively thinner andmore elevated. Such a structure may be very simi-lar to the wave guide over the ocean off northwesternAustralia (e.g. Birch and Reeder 2013).
• The details of the collision of the sea breezes areperhaps the least well understood aspects of Morn-ing Glories. Although there are no observations ofthe birth of a Morning Glory, numerical modellingsuggests that the strength of the background easter-lies controls the type of disturbances produced in thegulf region in two ways. First, the strength of thebackground easterlies affects the force of collisionbetween the east-coast and west-coast sea breezesfrom which Morning Glories evolve. Are MorningGlories generated resonantly when the east coast seabreeze is much deeper and warmer than the westcoast sea breeze? Conversely, when the sea breezesare more equal in depth and temperature, is thecollision violent and does the disturbance producedevolve into a series of amplitude ordered-solitarywaves? Second, the strength of the easterlies affectthe structure of the medium through which the dis-turbance subsequently propagates and the speed atwhich the disturbance propagates and evolves down-stream.
• Although southeasterly Morning Glories have beenobserved in satellite imagery, their dynamical originsare unknown.
Further outstanding questions concern the degree towhich the dry season phenomena described here initiate orfocus convection during in the wet season, and the degreeto which these phenomena are themselves modified byconvection.
Copyright c© 2015 Meteorological Institute TMRR 1: 1–27 (2015)

24 R. K. SMITH AND M. J. REEDER
Figure 27. Average mixing ratio gradient and potential temperatureat 925 mb for SON 200003 at (a) 1600 and (b) 0400 EST. Thecalculation of the average mixing ratio gradient excludes all modelpoints in the LAPS 3-h forecasts where the mixing ratio gradient isless than 5.0× 10⁻⁵ g kg−1 m−1 and is averaged over the number ofdays per seasonal average. Light shading indicates gradients greaterthan 0.2× 10⁻⁵ g kg−1 m−1; dark shading indicates gradientsgreater than 0.4× 10−55 g kg−1 m−1. The temperature contourinterval is 1 K. Average ageostrophic wind and divergence at925mb and MSLP for SON 2000-2003 at (c) 1600 EST and (d) 0400EST. The wind reference vector is located to the bottom left of eachpanel. Light shading indicates divergence greater than 1× 10⁻⁵ s−1;dark shading indicates convergence greater than 1× 10⁻⁵ s−1. TheMSLP contour interval is 1 mb. The ordinate is longitude in degrees;the abscissa is latitude in degrees. The blank areas enclosed with asolid dark line indicate topography above 500 m. (From Arnupand
Reeder 2007.)
• As discussed, the low-level convergence line thatdevelops during the late afternoon/early evening on
the western side of Cape York Peninsula is oneof the most pronounced features of the Australiantropics. Sea-breeze circulations generate these linesalmost daily when easterly winds prevail at low levelsacross the Peninsula. The relationship between theseconvergence lines and the initiation and organizationof deep convection during the wet season is stillunclear.
• At times cold fronts propagate equatorward as theanticyclone to their southwest expands across thecontinent. The reasons why cold fronts sometimepropagate equatorward rather than eastward is yetto be determined. Moreover, recent work suggeststhat surges in the Australian monsoon may be closelyrelated to equatorward propagating fronts (Berry andReeder, 2015).
• Over the past half a century, the annually aver-aged, Australia-wide temperature, rainfall, and cloudcover have all increased, while the diurnal range hasdecreased. The increase in the Australia-wide sum-mertime rainfall is largest over northwestern Aus-tralia where the trend may be as much as 60 mmper decade in some places. Significantly, this regionof increased rainfall coincides with that of the north-western Australian heat low. Although there has beenrecent work on the problem (Berry et al. 2011b, Ack-erley et al. 2014, 2015), the relationship between theheat low, dry line and increased rainfall in the regionremains to be determined.
13 Acknowledgements
Our thanks go to the very many colleagues and stu-dents who have contributed to the numerous field experi-ments described herein, or have contributed to the researchreviewed in other ways. We thank in particular our latefriend and colleague, Bruce Morton for his unflinching sup-port during the early years of this research and his contin-ued interest in the research, itself. Thanks go also to RobertGoler who set up the laboratory experiments describedin section7 while at the LMU in Munich. We gratefullyacknowledge also generous financial support over the yearsby our funding agencies, principally the German ResearchCouncil (Deutscheforschungsgemeinschaft) and the Aus-tralian Research Council. Last, but not least, we are gratefulto support in many forms from The Australian Bureau ofMeteorology.
14 References
Ackerley, D., G. J. Berry, C. Jakob, M. J. Reeder, and J.Schwendike. 2015. Summertime precipitation over northernAus-tralia in an ensemble of AMIP simulations from CMIP5. Quart.J.Roy. Meteor. Soc., doi:10.1002/qj.2476, (in press)
Ackerley, D., G. J. Berry, C. Jakob, M. J. Reeder. 2014. Theprocesses that lead to summertime rainfall in northwest Australiain the ACCESS1.3 GCM. Quart. J. Roy. Meteor. Soc., 140, 25152526, doi:10.1002/qj.2316.
Copyright c© 2015 Meteorological Institute TMRR 1: 1–27 (2015)

DRY SEASON METEOROLOGY OF NORTHERN AUSTRALIA 25
Arnup, S. J., and M. J. Reeder, 2009: The structure andevolution of the northern Australian dryline. Aust. Meteor. Ocean.J., 58, 215-231.
Arnup, S. J., and M. J. Reeder, 2007: The diurnal andseasonal variation of airmass boundaries in the Australianregion.Mon. Wea. Rev., 135, 2995-3008.
Berry, G., M. J. Reeder, and C. Jakob, 2011a: A climatologyof atmospheric fronts: A global overview. Geophys. Res. Lett. 38,L04809, doi:10.1029/2010GL046451.
Berry, G., M. J. Reeder, and C. Jakob. 2011b. The physicalmechanisms regulating summertime precipitation over north-western Australia. J. Clim., 24, 3705 - 3717.
Berry, G. J., M. J. Reeder. 2015. The dynamics of burst inthe Australian monsoon. J. Atmos. Sci., (submitted)
Birch, C. E., and M. J. Reeder, 2013: Wave-cloud lines overnorthwest Australia. Quart. J. Roy. Meteor. Soc., 139, 1311-1326.
Benjamin, T.B., 1967: Internal waves of permanent form influids of great depth. J. Fluid Mech., 29, 559-592.
Christie, D.R., and K.J. Muirhead, 1983a: Solitary waves: ahazard to aircraft operating at low altitudes. Aust. Meteor. Mag.,31, 97-109.
Christie, D.R., and K.J. Muirhead, 1983b: Solitary waves: alow-level wind shear hazard to aviation. Int. J. Aviation Safety, 1,169-190.
Christie, D. R., K. J. Muirhead and A. L. Hales, 1978: Onsolitary waves in the atmosphere. J. Atmos. Sci., 35, 805-825.
Christie, D. R., K. J. Muirhead and A. L. Hales, 1979:Intrusive density flows in the lower troposphere: a source ofatmospheric solitons. J. Geophys. Res., 84, 4959-4970.
Christie, D. R., K. J. Muirhead and R. H. Clarke, 1981:Solitary waves in the lower atmosphere. Nature, 293, 46-49.
Christie, D.R., 1989: Long nonlinear waves in the loweratmosphere. J. Atmos. Sci., 46, 1462-1491.
Christie, D. R., 1992: The Morning Glory of the Gulfof Carpentaria: a paradigm for nonlinear waves in the loweratmosphere. Aust. Meteor. Mag., 41, 21-60.
Clarke, R. H., 1965: Horizontal mesoscale vortices in theatmosphere. Aust. Meteor. Mag., 50, 1-25.
Clarke, R. H., 1972: The Morning Glory: an atmospherichydraulic jump. J. Appl. Meteor., 11, 304-311.
Clarke, R.H., 1989b: On the mortality of Morning Glories.Aust. Meteor. Mag., 37, 167-72.
Clarke, R. H., R. K. Smith and D. G. Reid, 1981: The Morn-ing Glory of the Gulf of Carpentaria: an atmospheric undularbore. Mon. Wea. Rev., 109,1726-1750.
Clarke, R. H., 1983a: Fair weather nocturnal wind surgesand atmospheric bores. Part I: Nocturnal wind surges. Aust.Meteor. Mag., 31, 133-145.
Clarke, R. H., 1983b: Fair weather nocturnal wind surgesand atmospheric bores. Part II: Internal atmospheric boresinnorthern Australia. Aust. Meteorol. Mag., 31, 147-160.
Clarke, R. H., 1984: Colliding sea-breezes and the creationof internal atmospheric bore waves: two dimensional numericalstudies. Aust. Meteorol. Mag., 32, 207-226.
Crook, N.A., and M.J. Miller. 1985: A numerical and ana-lytical study of atmospheric undular bores. Quart. J. Roy. Meteor.Soc., 111, 225-242.
Crook, N.A., 1986: The effect of ambient stratification andmoisture on the motion of atmospheric undular bores. J. Atmos.Sci., 43, 171-181.
Crook, N.A., 1988: Trapping of low-level internal gravitywaves. J. Atmos. Sci., 45, 1533-1541.
Clarke, R.H., 1986: Several atmospheric bores and a coldfront over southern Australia. Aust. Meteor. Mag., 34, 65-76.
Davis, R.E., and A. Acrivos, 1967: Solitary internal wavesin deep water. J. Fluid Mech., 29, 593-607.
Deslandes, R., M. J. Reeder, and G. Mills, 1999: Synopticanalyses of a subtropical cold front observed during the 1991
Central Australian Fronts Experiment. Aust. Meteor. Mag.,48,87-110.
Drosdowsky, W., and G. J. Holland, 1987: North Australiancloud lines. Mon. Wea. Rev., 115, 2645-2659.
Drosdowsky, W., G. J. Holland and R. K. Smith, 1989:Structure and evolution of North Australian cloud lines duringAMEX Phase I. Mon. Wea. Rev., 117, 1181-1192.
Drake, V.A. 1984: A solitary wave disturbance of the marineboundary layer over Spencer Gulf revealed by radar observationsof migrating insects. Aust. Meteor. Mag., 32, 131-135.
Drake, V.A., 1985: Solitary wave disturbances of the noc-turnal boundary layer revealed by radar observations of migratinginsects. Bound. Lay. Meteor., 31, 269-286.
Egger, J., 1984: On the theory of the Morning Glory. Beitr.Phys. Atmos., 57, 123-134.
Egger J., 1985: Slope winds and the axisymmetric circula-tion over Antarctica. J. Atmos. Sci., 42, 1859-1866.
Engel, C. B., T. P. Lane, M. J. Reeder, and M. Rezney, 2013:The meteorology of Black Saturday. Quart. J. Roy. Meteor. Soc.,139, 585-599.
Goler, R. A., and M. J. Reeder. 2004: The generation of theMorning Glory. J. Atmos. Sci., 61, 1360-1376.
Goler, R., M. J. Reeder, R. K. Smith, H. Richter, S. Arnup,T. Keenan, P. May, and J. Hacker, 2006: Low-level convergencelines over northeastern Australia. I. The North AustralianCloudLine. Mon. Wea. Rev., 134, 3092-3108.
Haase, S. P., and R. K. Smith, 1989a: The numerical sim-ulation of atmospheric gravity currents. Part I. Neutrally-stableenvironments. Geo. Astro. Fluid Dyn., 46, 1-33.
Haase, S. P., and R. K. Smith, 1989b: The numerical simu-lation of atmospheric gravity currents. Part II. Environments withstable layers. Geo. Astro. Fluid Dyn., 46, 35-51.
Haase, S., and R. K. Smith, 1984: “Morning glory” waveclouds in Oklahoma: a case study. Mon. Wea. Rev., 112, 2078-2089.
Hoinka, K. P. and R. K. Smith, 1988: A dry cold front insouthern Bavaria. Weather, 43, 255-260.
Holland, G. J., J. L. McBride, R. K. Smith, D. Jasper andT. Keenan, 1986: The BMRC Australian Monsoon Experiment:AMEX. Bull. Amer. Met. Soc., 67, 1466-1472.
Hoskins, B. J., M. E. Mcintyre, and A. W. Robertson, 1985:On the use and significance of potential vorticity maps. Quart. J.Roy. Meteor. Soc., 111, 877-946.
Jackson, G. E., R. K. Smith and T. Spengler, 2002: Theprediction of low-level mesoscale convergence lines over north-eastern Australia. Aust. Meteor. Mag., 51, 13-23.
Lammert, L., 1932: Frontologische Untersuchungen in Aus-tralien. Beitr. Physik der freien Atmos., 19, 203-219.
Lane, T. P., and M. J. Reeder, 2001: Convectively-generatedgravity waves and their effect on the cloud environment. J. Atmos.Sci., 58, 2427-2440.
Locatelli, J. D., M. T. Stoelinga, P. V. Hobbs, and J. Johnson,1998: Structure and evolution of an undular bore on the highplains and its effects on migrating birds. Bull. Amer. Meteor. Soc.,79, 1043-1060.
Manasseh, R., and J.H. Middleton, 1995: Boundary layeroscillations from thunderstorms at Sydney Airport. Mon. Wea.Rev., 123, 1166-1177.
Mellor G, Yamada T. 1974:. Hierarchy of turbulent closuremodels for planetary boundary layers. J. Atmos. Sci., 31, 1791-1806.
Menhofer, A., R. K. Smith, M. J. Reeder and D. R. Christie,1997: “Morning Glory” disturbances and the environment inwhich they propagate. J. Atmos. Sci., 54 , 1712-1725.
Menhofer, A., R. K. Smith, M. J. Reeder and D. R. Christie,1997: The bore-like character of three Morning Glories observedduring the Central Australian Fronts Experiment. Aust. Met.Mag., 46, 277-285.
Copyright c© 2015 Meteorological Institute TMRR 1: 1–27 (2015)

26 R. K. SMITH AND M. J. REEDER
Muir, L. C., and M. J. Reeder, 2010: Idealised modellingof landfalling cold fronts. Quart. J. Roy. Meteor. Soc., 136,21472161.
Neal, A. B., and I. J. Butterworth 1973: The recurring cloudline in the Gulf of Carpentaria, Working Paper 163, Bureau ofMeteorology, Australia.
Neal, A. B., I. J. Butterworth and K. M. Murphy, 1977: TheMorning Glory. Weather, 32, 176-183.
Nudelman, I., R. K. Smith, and M. J. Reeder, 2010: Aclimatology of pressure jumps around the Gulf of Carpentaria.Aust. Meteor. and Ocean. Journl., 60, 91-101.
Noonan, J. A., and R. K. Smith, 1985: Linear and weaklynonlinear internal wave theories applied to “Morning Glory”waves. Geo. Astro. Fluid Dyn., 29, 123-143.
Noonan, J. A., and R. K. Smith, 1986: Sea breeze circula-tions over Cape York Peninsula and the generation of Gulf ofCarpentaria cloud line disturbances. J. Atmos. Sci., 43, 1679-1693.
Noonan, J. A., and R. K. Smith, 1987: The Generation ofthe North Australian Cloud Line and the “Morning Glory”. Aust.Met. Mag., 35, 31-45.
Ono, H., 1975: Algebraic solitary waves in stratified fluids.J. Phys. Soc. Japan, 39, 1082-1091.
Parker, D. J., R. R. Burton, A. Diongue-Niang, R. J. Ellis,M. Felton, C. M. Taylor, C. D. Thorncroft, P. Bessemoulin, A.M.Tomkins. 2005: The diurnal cycle of the West African Monsooncirculation. Q. J. R. Meteorol. Soc. 131, 2839-2860.
Physick, W. L., 1986: Observations of a solitary wave trainin Melbourne, Australia. Aust. Met. Mag., 34, 163-72.
Physick, W.L., and N.J. Tapper, 1990: A numerical studyof circulations induced by a dry salt lake. Mon. Wea. Rev., 118,1029-1042.
Preissler, M., M. J. Reeder and R. K. Smith, 2002: A casestudy of a heat low over central Australia. Aust. Meteor. Mag.,51, 155-163.
Racz, Zs., and R. K. Smith, 1999: The dynamics of heatlows. Quart. J. Roy. Met. Soc., 125, 225-252.
Raymond D. J., 1994: Convective processes and tropicalatmospheric circulations. Quart. J. Roy. Met. Soc., 120, 1431-1455.
Reeder, M. J., 1986: The interaction of a surface cold frontwith a prefrontal thermodynamically well-mixed boundary layer.Aust. Meteor. Mag., 34, 137-148.
Reeder, M. J., and D. R. Christie, 1998. Four nonlinear wavedisturbances observed simultaneously over northern Queensland,Australia. Weather, 53, 134-140.
Reeder, M. J., and R. K. Smith, 1986: A comparisonbetween frontogenesis in the two-dimensional Eady model ofbaroclinic instability and summertime fronts in the Australianregion. Quart. J. Roy. Meteor. Soc., 112, 293-313.
Reeder, M. J., and R. K. Smith, 1992: Australian spring andsummer cold fronts. Aust. Met. Mag., 41, 101-124.
Reeder, M. J. and R. K. Smith, 1998: Mesoscale meteor-ology in the Southern Hemisphere. Chapter 5 of Meteorology ofthe Southern Hemisphere. Ed. D. J. Karoly and D. Vincent. Amer-ican Meteorological Society Monograph, No. 49, 201-241.
Reeder, M. J, and K. J. Tory, 2005: The effect of the con-tinental boundary layer on the dynamics of fronts in a two-dimensional model of baroclinic instability. Part II. Surface heat-ing and cooling. Quart. J. Roy. Meteor. Soc., 131, 2409-2429.
Reeder, M. J., D. R. Christie, R. K. Smith and R. Grimshaw,1995: Nonlinear waves and bores over northern Australia. Bull.Amer. Meteor. Soc., 76, 1165-1171.
Reeder, M. J., R. K. Smith, R. Deslandes, N. J. Tapper andG. A. Mills, 2000: Subtropical fronts observed during the 1996Central Australian Fronts Experiment. Aust. Meteor. Mag.,49,181-200.
Reeder, M. J., R. K. Smith, D. J. Low, J. Taylor, S. J. Arnup,L. Muir, and G. Thomsen. 2013: Diurnal-forced convergence linesin the Australian Tropics. Quart. J. Roy Met. Soc., 139, 1283-1297.
Reichmann, Zs., and R. K. Smith, 2003: Terrain influenceson the dynamics of heat lows. Quart. J. Roy Met. Soc., 129, 1179-1194.
Robin, A. G, 1978: Roll cloud over Spencer Gulf. Aust.Meteor. Mag., 26, 125.
Royal Australian Air Force, 1942: Weather on the AustraliaStation. R.A.A.F. Publ. No. 252, 2, part 2, 25-26.
Schmidt, C. W., and R. A. Goler, 2010: Nonlinear wavesahead of fronts in the Great Australian Bight. Mon. Wea. Rev.,138, 3474 - 3496.
Smith, R. K., 1986: “Evening Glory” wave-cloud lines innorthwestern Australia. Aust. Met. Mag., 34, 27-33.
Smith, R. K., 1988: Waves and bores in the lower atmos-phere: the “Morning Glory” and related phenomena. Invitedreview paper. Earth Sci. Rev., 25, 267-290.
Smith, R. K., and J. Goodfield, 1981: The Morning GloryExpedition. Weather, 36, 130-136.
Smith, R. K., and B. R. Morton, 1984: An observationalstudy of northeasterly “Morning glory” wind surges. Aust. Met.Mag., 32, 155-175.
Smith, R. K., and M. A. Page, 1985: “Morning glory” windsurges and the Gulf of Carpentaria cloud line of 25-26 October1984. Aust. Met. Mag., 33, 185-194.
Smith, R. K., and R. N. Ridley, 1990: Subtropical continen-tal cold fronts. Aust. Met. Mag., 38, 191-200.
Smith, R. K., and J. A. Noonan, 1998: On the generationof low-level mesoscale convergence lines over northeastern Aus-tralia. Mon. Wea. Rev. 126, 167-185.
Smith, R. K., and T. Spengler, 2011: The dynamics of heatlows over elevated terrain. Quart. J. Roy. Met. Soc., 137, 250-263.
Smith, R. K., N. Crook and G. Roff, 1982a: Morning Glory:an extraordinary atmospheric undular bore. Quart. J. Roy. Met.Soc., 198, 937-956.
Smith, R. K., B. F. Ryan, A. J. Troup, and K. H. Wilson,1982b: Cold Fronts Research: The Australian summertime coolchange. Bull. Amer. Met. Soc., 63, 1028-1934.
Smith, R. K., M. J. Coughlan and J. Evans-Lopez, 1986:Southerly nocturnal wind surges and bores in northeastern Aus-tralia. Mon. Wea. Rev., 114, 1501-1518.
Smith, R. K., M. J. Reeder, N. J. Tapper and D. R. Christie,1995: Central Australian cold fronts. Mon. Wea. Rev., 123, 16-38.
Smith, R. K., M. J. Reeder, H. Richter, and P. May,2006: Low-level convergence lines over northeastern Australia.I. Southerly disturbances. Mon. Wea. Rev., 134, 3109-3124.
Smith, R. K., M. T. Montgomery, and J. Persing, 2014: Onsteady state tropical cyclones. Quart. J. Roy. Met. Soc., 140, 2638-2146.
Spengler, T., and R. K. Smith, 2008: The dynamics of heatlows over flat terrain. Quart. J. Roy. Met. Soc., 134, 2157-2172.
Spengler, T., M. J. Reeder and R. K. Smith, 2005: Thedynamics of heat lows in simple background flows. Quart. J. Roy.Met. Soc., 131, 3147-3165.
Thomsen, G., and R. K. Smith, 2006: Simulations of low-level convergence lines over northeastern Australia. Quart. J. Roy.Met. Soc., 132, 691-707.
Thomsen, G. L., and R. K. Smith, 2008: The importance ofthe boundary layer parameterization in the prediction of low-levelconvergence lines. Mon. Wea. Rev. 136, 2173-2185.
Thomsen, G. L., M. J. Reeder, and R. K. Smith, 2009:The diurnal evolution of cold fronts in the Australian subtropics.Quart. J. Roy. Met. Soc., 135, 395-411.
Copyright c© 2015 Meteorological Institute TMRR 1: 1–27 (2015)

DRY SEASON METEOROLOGY OF NORTHERN AUSTRALIA 27
Tory, K. J., and M. J. Reeder, 2005: The effect of thecontinental boundary layer on the dynamics of fronts in a two-dimensional model of baroclinic instability. Part I. An insulatedlower surface. Quart. J. Roy. Meteor. Soc., 131, 2389-2408.
Weinzierl, B., R. K. Smith, M. J. Reeder, and G. Jackson,2007: MesoLAPS predictions of low-level convergence linesovernortheastern Australia. Wea. Forecasting, 22, 910-927.
Copyright c© 2015 Meteorological Institute TMRR 1: 1–27 (2015)