Agroclimatic and dry-season maps of south, southeast, and east ...
25
. AGROCLIMATIC AND DRY-SEASON MAPS OF SOUTH, SOUTHEAST, AND EAST ASIA ROBERT E. HUKE 1982 INTERNATIONAL RICE RESEARCH INSTITUTE Los Baños, Laguna, Philippines P.O. Box 933, Manila, Philippines
Transcript of Agroclimatic and dry-season maps of south, southeast, and east ...

.
AGROCLIMATICAND
DRY-SEASON MAPSOF
SOUTH, SOUTHEAST,AND
EAST ASIA
ROBERT E. HUKE
1982 INTERNATIONAL RICE RESEARCH INSTITUTELos Baños, Laguna, Philippines P.O. Box 933, Manila, Philippines

The International Rice Research Institute (IRRI) receivessupport from a number of donors, including the AsianDevelopment Bank, the European Economic Community, theFord Foundation, the International Fund for AgriculturalDevelopment, the OPEC Special Fund, the RockefellerFoundation, the United Nations Development Programme, andthe international aid agencies of the following governments:Australia, Belgium, Canada, Denmark, Federal Republic ofGermany, Japan, Mexico, Netherlands, New Zealand,Philippines, Spain, Sweden, Switzerland, United Kingdom,United States.
The responsibility for this publication rests with the InternationalRice Research Institute.
Research to increase food production requires detailed knowledge of the characteristics ofthe climate within which the farmer must work. Recognizing the importance of climate, anIRRI-sponsored team of meteorologists developed and published An agroclimatic classi-fication for evaluating cropping systems potentials in Southeast Asian rice-growingregions in 1974. Agroclimatic maps have since been published for the Philippines, Bangladesh, andportions of Indonesia. Agroclimatic and dry-season maps of South, Southeast, and EastAsia goes further; the series of three dry-season maps portray the length, time, andintensity of the water-deficit period for the rice-producing area from Pakistan throughKorea. Each map set presents a climate-based regional division of the area producing the vastmajority of the world’s rice. The regions are generic to enable ready identification of areasof similar climatic regime. The maps were developed by Dr. Robert E. Huke, visiting scientist from the Depart-ment of Geography, Dartmouth College, Hanover, New Hampshire, USA; the carto-graphy was done by Ms. Eleanor Huke, cartographic technician, Cold Regions Researchand Engineering Laboratory, Hanover. Earlier work by E. Manalo of IRRI’s Multiple Cropping Department was foundvaluable and was relied upon extensively for the Philippine portions of the agroclimaticmaps. The IRRI Multiple Cropping Department and Dartmouth College allowed the authoruse of computer facilities to process data from about 3,000 stations to develop thedry-season maps. The text was edited by Dr. Thomas R. Hargrove and Ms. Corazon Mendoza of IRRI’sInformation Services Department.
Marcos R. VegaActing Director General
FOREWORD

.

This study was initiated to provide intermediate-scale mapsillustrating two views of the climate over a broad arc ofrice-producing regions, from Pakistan to Japan, includingoffshore archipelagos of Indonesia and the Philippines andmost of China. In climatic characteristics, the agroclimaticmap set is conventional and the dry-season set, nonconven-tional. The agroclimatic maps portray the relative lengths ofthe wet and dry periods in the tradition of the useful mapsdeveloped and presented by Oldeman (1975,1977, 1979) andManalo (1977a,1977b). The dry-season maps portray thelength, intensity, and timing of the dry season. Most climate classifications originated as teaching toolshave been helpful in developing a general understanding ofenvironmental differences over broad areas. The classifica-tion schemes have provided a shorthand system for express-ing information about the amount and temporal distributionof rainfall, with some consideration for both the meanmonthly and the annual march of temperature. Systems ofthis type provide a base for understanding regional patterns ofatmospheric circulation and may even help explain the spatialpattern of cropping systems or of natural vegetation. Oftenthe regions produced by such systems are named correspond-ing to the dominant natural vegetative cover of the area, i.e.,tropical rain forest, and taiga. The original training as plantgeographers of several authors of climate classification sys-tems may partly account for the apparent coincidence ofvegetative and climatic boundaries. Thus climates are classi-fied largely on the basis of vegetative limits, as observed andmapped in nature. The widely used and well-known Koppen system (Miller1964, Rumney 1968, Critchfield 1960) is probably the out-standing example of this tradition. Perhaps the use of naturalvegetation to indicate climatic boundaries was widely ac-cepted because the pattern of natural vegetation is often anexcellent expression of the interaction of a wide range of
environmental phenomena, including climate, soil, and slopecharacteristics on a continental scale Soon after the turn of the century, when Herbertson’s(Miller 1964, Rumney 1968, Critchfield 1960)climate classifi-cation was developed, the aim was to produce a uniquesystem of broadly delimiting climatic regions. In the 1930s,when the Koppen system was proposed, the aim was to have ageneric system that would identify similar climates across theworld. In the early systems, providing a tool to help inagricultural planning was not an objective partly because atthe time there was little pressure on available food supplies.Production could be increased by cultivating new land. Theemphasis turned toward intensification of production on theexisting farm base after World War II. The early classification systems provided fine descriptivematerials but were insufficiently detailed to serve the needs ofagricultural scientists. Agronomists, multiple cropping spe-cialists, and plant breeders needed an analytic classification tohelp them best use the environmental resources tq producethe volume and range of crops needed by a rapidly growingpopulation. In the late 1970s, researchers focused on thecharacteristics of transition periods such as the variability intime and intensity of the rains at the beginning and end of thedry season. The focus of studies in agricultural meteorologyshifted from general aspects of climate to timing and severityof potential plant stresses.
COVERAGEThe maps cover less than 15% of the world’s land surface.This area, however, is crowded by 50% of the world’s popula-tion. The population density is roughly six times that of therest of the world, and the population of South and East Asiais predominantly agricultural. The 2 billion 100 million per-sons who lived in the mapped area in 1979 each had anaverage of less than 0.2 ha of cultivable land from which to
AGROCLIMATIC AND DRY-SEASON MAPS OF SOUTH, SOUTHEAST, AND EAST ASIA 3
AGROCLIMATICAND
DRY-SEASON MAPSOF
SOUTH, SOUTHEAST,AND
EAST ASIA

produce not only their food but also a surplus to sell. In contrast, the per capita farm land in the remainder of theworld is 2.5 times that of South and East Asia. The pressureon the land is greater and the need to increase productivityclearly more urgent than in any other major portion of theearth.
PREVIOUS STUDIESMany climatologists have studied the area between Pakistanand Japan. The studies have ranged in scale from the micro-climate of a Singapore garden to the date of onset of themonsoon rains over the entire Indian subcontinent. Results ofsome studies are presented in atlas form; others as descriptiveor analytic essays. A variety of classification schemes has beenproposed and probability estimates for precipitation, byweek, have been published. Most of the available studies focus on rainfall or a specialaspect of the rainy season. A comprehensive knowledge of thewet portion of the year has already been developed for muchof the agricultural portion of South and East Asia. As weenter the 1980s, the attention of agricultura! scientists appearsdirected toward an understanding of the prerainy, the post-rainy, and the dry season. Hopefully a better understandingof these critical periods will help in the successful intensifica-tion of cropping patterns. Interest in the length and intensity of the dry season as itvaries over time and space is considerable. There is concernwith residual soil moisture and its possible use by a second orthird crop. The question of how to improve the productivityof dryland rice focuses on the same problem as do a series ofquestions concerning the expansion and improvement ofirrigation facilities. The current inadequacy of knowledge of weather andclimate hampers the portrayal of the conditions under whichAsia’s small farmers must operate. In part this is because“Rainfall in the monsoon regions more often than not ischaracterized by a high spatial and temporal variability lead-ing to atmospheric and s0il drought conditions affecting cropgrowth and development” (Sastry 1977).The onset ofdrought may not be noticed at first, but its progress is expo-nential and its impact on the farmer is devastating.
THE SYSTEMS USEDThe agroclimatic maps in this series are modeled directly afterthose of Oldeman and Manalo. The classification system wasfirst developed in November 1973, when a working group ofspecialists, including meteorologists and hydrometeorologistsrepresenting a wide range of assistance programs, met at theInternational Rice Research Institute (IRRI) to establish testsites for Southeast Asian cropping systems. The group’s firsttask was to identify and characterize the various climaticzones of Southeast Asia. It was assumed that although manymacroclimatic parameters were important, the data on thecharacter of the rainy season were most readily available andwould ultimately determine the success or failure of innova-
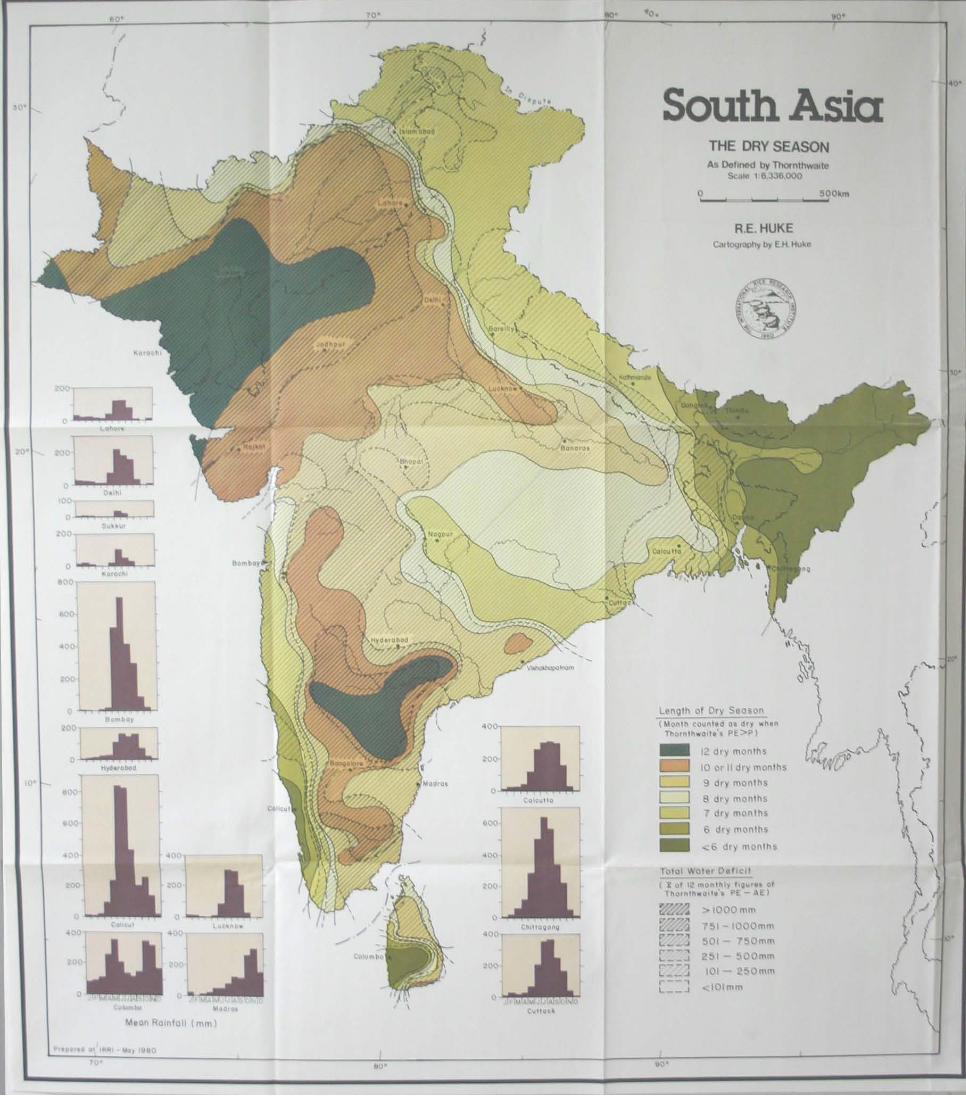
tive multiple-cropping systems. Thus, monthly rainfall wasthe first criterion used in delimiting major climatic zones. An arbitrary boundary was set at 200 mm, based on twoassumptions: 1) Losses due to evapotranspiration, althoughvariable over the year, generally amount to around100 mm/month; and 2) Losses due to percolation and seep-age, although variable, depending on soil characteristics aregenerally set at around 100 mm/month (IRRI 1974). The second criterion was the number of months with200 mm or more rainfall. An arbitrary boundary was set at5-9 consecutive wet months. If there are less than 5 consecu-tive wet months, the possibilities of growing 2 crops arelimited. If there are more than 9 consecutive wet months, theSoutheast Asian farmer is most likely to grow 2 crops ofpuddled rice. Using this system, the IRRI group categorized major por-tions of Southeast Asia and adjoining territories into 8 rainfallor agroclimatic zones ranging from areas with more than 9consecutive wet months to areas with less than 2. That report,with its accompanying maps, appears to have laid thegroundwork for later work by Oldeman (1975, 1977, 1979)and by Manalo (1977a, 1977b). Those authors each deve-loped agroclimatic maps based on a classification scheme thatgave equal emphasis to wet months > 200 mm of precipita-tion and to dry months <100 mm in the delimitation ofregions. Thus, Manalo’s agroclimatic map of the Philippinesdelimits 13 generic regions ranging from the humid extremeof< 2 dry months and > 9 wet months to the arid extreme of> 6 dry and < 3 wet months. Each author indicates areas ofexceptionally heavy precipitation in addition to a series ofgeneric regions. The agroclimatic maps of South and Southeast Asia useManalo’s system, retaining limits of 200 mm and 100 mm forwet and dry months, respectively. The limit for exceptionallyheavy precipitation remains at least I month with> 500 ram.But in East Asia, the mean latitude is considerably higherthan in South or Southeast Asia and the climate ranges fromsubtropical to continental. In most of China, Japan, andKorea, moisture losses in the winter are so low that the 100-and 200-mm limits have no significance. As monthly meantemperatures approach the freezing point, potential evapo-transpiration (PE) approaches zero. Under these conditions,precipitation of much lower than 200 mm results in a pro-nounced surplus of moisture. Because the definitions used forwet and dry months in tropical areas clearly do not apply inEast Asia, no agroclimatic maps were prepared. The Thornthwaite (1948) formulas, however, take intoaccount the annual march of temperature and the greatlyvarying length of daylight hours. Thus, use of this system formidlatitude locations produces a map consistent with farmers’experience. A dry-season map has been developed for EastAsia. The dry-season set of accompanying maps shows the char-acter of that season, where it exists. The length of the dryseason is the primary mapping determinant; drought severity
4 AGROCLIMATIC AND DRY-SEASON MAPS OF SOUTH, SOUTHEAST, AND EAST ASIA

is the secondary parameter. Rainfall bar graphs indicate thetiming of the dry period for a range of representativelocations. On these maps a dry month refers to a month during whichthe PE exceeds the actual evapotranspiration (AE). Themonths qualifying as dry under this definition are often fewerthan the months in which PE exceeds precipitation, becausewhen soil moisture storage is very close to the soil’s storagecapacity, the plant roots can continue to withdraw soil mois-ture at a rate almost equal to that under saturation. As soilwithin the root range of the plant cover becomes drier, how-ever, it becomes progressively more difficult for the plant tofully satisfy its moisture needs. Actual evapotranspirationdrops below the PE and water stress manifests itself in someway. As the World Meteorological Organization (WMO)suggests, “Drought in the agricultural sense does not beginwith the cessation of rain but rather when available storedwater will support actual evapotranspiration at only a smallfraction of the potential evapotranspiration rate” (Hounam1975).
SOIL MOISTUREThe plant initiates what O’Toole and Chang (1977) termdrought avoidance mechanism as the soil begins to dry andthe moisture availability within the main root zone of the cropdrops below field capacity. Such mechanisms often include adownward and horizontal extension of the root system toreach new water sources (Fig.1).Such adaptations mayenable the plant to maintain modest transpiration, but almostalways at an ever-decreasing rate. When the soil moisturecontent drops to roughly 15 bars (soil moisture tension of 15atm.), the plant has removed essentially all the soil moisture itcan and reaches the permanent wilting point. As soil moisture content falls, an increase in the PE oftenaggravates drought conditions. This is due to a radiationincrease related to a decrease in cloud cover. Drought severityincreases during such periods of higher than normal tempera-ture and lower than normal humidity.
The character of the soil, especially its moisture-holdingcapacity, greatly influences the success of agriculture in dryperiods. In this mapping program, soil moisture capacity wasincluded in the estimation of water balance. It was determinedby identifying data for the field capacity of the -specific soilfound at each location for use in the formula. Soil moisturecapacity fell into one of three levels, as defined by the FAO-UNESCO Soil Map of the World. Syarifuddin (1979) suggests that soil moisture may be lostmore rapidly from puddled soils with no cover of standingwater than from nonpuddled soils under similar climatic andenvironmental conditions. That suggests that even smallexcesses of PE over AE during short time periods may causewater stress. Therefore this mapping program defines as dryany month during which the AE falls below the PE,
LONG-TERM PRECIPITATION MEANSNormal precipitation for a specific date, week, month, or yearis determined by summing the observations recorded over theavailable record and dividing by the number of observations.The size of any individual record entering the tabulation ofthe normal or mean has virtually no upper limit but clearly itcannot fall below zero. A single very high figure can easilydistort the meaning of normal precipitation. Individual read-ings below the mean will always outnumber those above itbecause the distribution of precipitation data for any periodshows a moderate positive skewness. The shorter the period,the more pronounced the trend; thus monthly rainfall recordsare likely to be more skewed than yearly records. An example of this tendency may be seen in the 94 years ofrainfall history for Cuttack, Orissa, India. Here the clino or94-year mean precipitation is 1,545 turn. The 94 years com-prise 54 years with totals below the clino and 40 years withhigher readings. For January the clino of 10 mm includes only25 (of 94) years with readings higher than the mean, 2 yearswith readings equal to it, and 67 years with less than 10 mm(Table 1). Even for the wettest month, August, 60 of 94 yearsshow precipitation below the mean. Temperature data, on the other hand, show no such biasalthough they may be characterized .by small long-termChanges. Temperature readings below the mean are as com-mon as figures above it. In this situation using normal figures to map the length andintensity 0fa dry period clearly causes a tendency to under-state the case. Dry periods will be somewhat more frequentwith greater impact on the farmer than the mean data indi-cate. Mapping only deficits of greater than, say, 10 mm wouldfurther the distortion. The relative wetness or dryness of the climate in a locationis determined by the relationship between moisture gain andmoisture loss. On a regional basis, moisture gain is by precipi-tation alone while moisture loss results from both evapora-tion and transpiration. In periods of excess precipitation,moisture is also lost through surface runoff and loss to theground water table after soil moisture has reached capacity.
AGROCLIMATIC AND DRY-SEASON MAPS OF SOUTH, SOUTHEAST, AND EAST ASIA 5

Table 1. Rainfall by month — 94 years, Cuttack, Orissa, India. Precipitation (mm)Year
Jan Feb Mar Apr May Jun Jul Aug Sep Oct Nov Dec Total
1867 0 38 20 60 55 197 275 242 257 137 9 0 12901868 3 1 3 36 82 435 257 227 249 50 0 0 13431869 10 35 44 42 22 171 382 146 234 136 0 0 12221870 27 0 23 31 47 188 186 254 224 219 69 0 1268 Mean - - - - - - - - - - - - -
1871 0 14 11 147 107 189 389 151 246 23 0 4 12811872 0 16 0 17 60 450 323 242 223 410 61 5 18071873 0 0 69 42 28 76 268 256 159 65 9 9 9811874 46 57 17 0 88 430 410 518 308 272 56 1 22031875 26 0 2 65 84 506 691 212 489 260 0 0 2335
1876 0 0 1 5 85 142 249 192 250 124 0 0 10481877 15 31 22 98 145 150 234 114 159 77 0 0 10451878 3 4 25 19 145 225 300 296 163 125 72 10 13871879 0 2 29 0 216 91 311 482 240 124 6 39 15401880 1 53 0 34 170 203 278 538 261 131 35 0 1704 Mean 9.1 17.7 17.6 42.7 112.8 246.2 345.3 300.1 249.8 161.1 23.9 6.8 1533.1
1881 0 0 56 15 31 430 356 255 286 59 13 5 15061882 2 14 1 34 143 172 624 374 301 194 70 0 19291883 0 5 32 2 126 586 364 219 328 14 8 24 17081884 1 18 53 89 50 453 251 300 220 61 0 11 15071885 0 86 27 49 146 78 296 175 212 66 37 41 1213
1886 9 9 144 0 158 509 280 219 355 299 51 12 20251887 15 0 46 23 111 387 297 268 181 25 6 0 13591888 21 16 54 0 79 26 226 645 255 36 72 0 14301889 0 8 1 21 84 472 323 371 142 225 293 0 19401890 0 0 61 0 97 311 537 356 534 217 49 0 2162 Mean 4.8 15.6 47.5 23.3 100.5 342.4 355.4 318.2 281.4 119.6 59.9 9.3 1677.9
1891 0 15 143 0 136 54 267 508 786 46 124 0 20791892 0 0 0 4 44 299 316 162 234 317 9 0 13851893 48 58 81 15 483 161 165 419 380 139 0 0 19491894 0 1 4 17 4 494 264 166 130 135 67 0 12821895 0 0 2 36 46 587 292 481 173 74 42 1 17341896 0 0 13 0 87 466 303 353 2O9 0 2 0 14331897 0 14 137 40 3 218 260 337 180 153 53 5 14001898 0 3 0 50 85 192 151 386 159 206 0 0 12121899 0 5 1 126 149 291 268 167 153 300 0 1 14611900 0 1 21 37 80 101 209 551 535 221 0 0 1756 Mean 4.8 9.7 40.2 32.5 109.7 286.3 249.5 353.0 293.9 159.1 29.7 0.7 1569.1
1901 31 66 0 23 77 102 324 189 145 97 100 0 11541902 18 0 3 100 69 197 643 377 147 36 0 60 16501903 9 44 4 1 113 164 358 332 358 311 14 1 17091904 0 5 6 0 135 268 137 335 243 55 0 5 11891905 8 14 63 9 128 68 219 169 182 42 0 0 9021906 9 70 3 2 138 195 259 155 195 146 23 1 11961907 0 11 47 146 81 202 156 902 209 14 1 18 17871908 24 0 16 0 47 439 243 668 255 41 0 0 17231909 0 32 0 141 58 208 443 326 297 31 0 62 15981910 20 0 0 26 59 277 360 412 334 250 0 0 1738 Mean 11.9 24.2 14.2 44.8 90.5 212.0 314.2 385.5 236.5 102.3 13.8 14.7 1464.6
1911 0 3 127 44 55 381 100 257 324 97 0 0 13881912 0 39 7 19 30 198 259 347 203 167 101 0 13701913 0 39 23 14 163 153 542 195 181 133 19 2 14641914 0 60 1 22 160 252 455 214 343 0 0 8 15151915 4 25 42 34 184 225 172 377 252 218 250 0 1783
1916 0 0 0 34 65 509 99 391 125 289 87 0 16021917 0 133 25 36 89 309 281 413 198 417 10 0 19111918 0 0 25 37 98 318 147 289 53 3 0 1 9711919 81 17 0 27 69 263 369 472 156 134 132 0 17201920 0 16 103 1 56 160 608 185 169 40 0 0 1338 Mean 8.5 33.2 35.3 26.8 97.2 276.8 303.2 314.0 200.4 149.8 59.9 1.1 1506.2
6 AGROCLIMATIC AND DRY-SEASON MAPS OF SOUTH, SOUTHEAST, AND EAST ASIA

Table 1 continued
Precipitation (mm)Year
Jan Feb Mar Apr May Jun Jul Aug Sep Oct Nov Dec Total
1921 75 1 1 8 18 241 248 184 244 38 0 0 10581922 10 8 1 0 21 311 586 191 330 67 21 0 15461923 0 108 1 9 59 117 299 283 197 216 197 8 14941924 32 10 0 0 161 47 217 297 288 76 235 0 13631925 0 0 0 34 60 582 512 187 325 295 2 20 2017
1926 5 6 137 45 61 142 372 669 299 164 0 0 19001927 0 1 0 0 42 128 366 351 265 93 6 0 12521928 0 0 0 108 115 292 418 281 168 320 5 0 17071929 1 32 0 0 38 143 302 436 259 249 0 51 15111930 0 12 6 25 72 233 315 313 201 52 215 0 1444 Mean 12.3 17.8 14.6 22.9 64.7 223.6 363.5 319.2 257.6 157.0 68.1 7.9 1529
1931 4 6 10 0 63 146 252 474 248 294 29 5 15311932 0 15 93 9 105 67 569 164 200 40 177 0 14391933 33 4 1 26 179 328 427 823 330 126 4 0 22811934 0 11 2 0 19 263 260 537 323 138 3 0 15561935 1 9 18 51 3 153 567 158 221 5 0 0 1186
1936 6 54 4 0 230 517 374 533 218 352 17 1 23061937 0 91 7 84 86 241 355 230 336 50 0 0 14801938 9 5 1 0 103 211 250 288 141 172 3 0 11831939 14 2 18 6 36 123 390 209 247 277 6 2 13301940 0 27 100 30 148 337 644 311 209 85 2 2 1895 Mean 6.7 22.4 25.4 20.6 97.2 238.6 408.8 372.7 247.3 153.9 24.1 1.0 1618.7
1941 34 0 3 7 36 245 542 173 302 197 29 0 15681942 1 16 0 31 12 114 267 440 240 55 179 0 13551943 31 0 8 35 29 195 680 366 202 43 9 0 15981944 30 188 49 61 12 201 460 328 174 178 2 0 16831945 7 0 0 33 46 85 419 312 194 354 0 15 1465
1946 0 0 23 152 155 355 369 511 220 184 84 0 20531947 34 71 6 32 46 310 347 526 137 56 0 96 16611948 24 111 13 18 38 171 288 488 327 73 64 0 16151949 0 8 0 21 70 142 166 229 202 259 0 0 10971950 0 9 87 1 59 216 210 398 404 54 233 0 1671 Mean 16.1 40.3 18.9 39.1 50.3 203.4 374.8 377.1 240.2 145.3 60.0 11.1 1576.6
1951 0 0 71 40 81 173 453 325 213 111 57 0 15241952 1 - - - - - 201 261 218 228 0 0 -1953 32 0 0 0 58 159 245 417 148 77 91 0 12271954 0 34 0 13 50 266 178 320 390 223 0 10 14841955 0 0 17 14 117 147 148 376 455 494 135 0 1903
1956 0 59 3 1 157 465 345 521 445 349 27 0 23721957 12 20 8 1 3 101 246 337 146 10 0 0 8841958 29 67 3 10 101 260 297 293 206 93 0 -1959 11 16 1 81 102 95 255 326 164 244 0 5 13001960 0 0 21 9 35 298 487 258 215 95 0 4 1422 Mean 8.5 21.8 13.8 19.9 68.1 200.6 281.8 343.8 268.7 203.7 40.3 1.9 1472.9
Clino 10 27 19 26 70 207 355 365 252 168 41 5 1545
EVAPOTRANSPIRATIONEvaporation is by far the major component of evapotranspi-ration during the plant’s early growth stages when the canopycovers only a small portion of the soil surface. Evaporationfrom the sahded soil surface decreases sharply and the role oftranspiration increases at the approach of active tillering, andalso at flowering (Fig. 2). Tomar and O’Toole (1978) sug-gested that the evaportranspiration in wetland rice for a rangeof Asian countries reaches an early peak just before themaximum-tillering stage, then reaches an even higher peak at
flowering (Fig. 3). The variability in evapotranspiration rateunder constant solar radiation rages from about 15% below,to 15% above the crop mean. The Thornthwaite system doesnot model this variability within the growth period of anindividual crop but portrays conditions in a soil covered by avigorously growing and healthy crop. The system is designedto show similarities and differences in the quality of theclimate for agricultural purposes from place to place. Themethod defines and describes a region, a spatial unit which inthe real world would surely include subregions covered by
AGROCLIMATIC AND DRY-SEASON MAPS OF SOUTH, SOUTHEAST, AND EAST ASIA 7

crops in various development stages. Rather than assumingconstant solar radiation, Thonnhwaite varies the radiationcomponent month by month according to latitude, andattempts to present an evapotranspiration rate close to themean for the crop growth period. In limited areas such as the equatorial regions and thewindward slopes of coastal highlands in the miflatitudes,monthly moisture - exceed year-round evapoution andthe climate is classed as humid or perhumid. In other areas thepotential evaporation exceeds the available moisture supplyevery month and the climate is classed as arid. But through-out most of the world, the relationship betiwan moisturegains and potential losses is such that certain periods of theyear are marked by surplus while other periods are character-ized by moisture deficit, with accommnying stress on plantlit and possible yield losses. The attached maps an con-cerned with such moisture-deficit periods.
THE THORNTHWAITE CLASSIFICATIONThe concept of PE and the climate water balance were firstdeveloped and presented by Thornthwaite (1948) and wefundamental to the logic of his Rational Cassificatio ofClimate. Though a pioneer who, became perhaps the mostwidely known worker in the field, Thorntkwaite by no meansworked alone. J. Papadakis (1% 1) published a thoughtful monograph onhis modification of the Thornthwaite system. Papadakis sug-gested that the Thornthwaite method of computing evapo-transpiration gave results that we too low for the dry seasonin the tropics and suggested the avoidance of this allegedshortcoming by basing the computation on the average dailymaximum temperatures and by considering the water vaporpressure. He presented impressive evidence to show his classi-fication’s superiority over that of Thornthwaite when appliedto data from the high Andes Peru and Bolivia. But underconditions closer to Asian rice environments, Peruel (1976)
8 AGROCLIMATIC AND DRY-SEASON MAPS OF SOUTH, SOUTHEAST, AND EAST ASIA

graphed the measured pan evapotation over a 4-year periodagainst the computed evapotranspiration figures, using boththe Papadakis and the Thornthwaite fonnulas. Peruel con-cluded that for Los Baños data am! for both the wet and thedry season, “Thornthwaite’s formula [has shown a] signifi-cant relationship with pan evaporation.” In contrast, thePapadakis formula produced significantly lower results thandid the measured data for all sworn. Almost simultaneously with the Thornthwaite publication,Penman (1948) introduced a formula for the estimation ofPE, which he described as the amount of water transpired in aunit of time by a short green crop, completely shading theground, of uniform height and never short of water. Penmanargued that a location’s PE varies only slightly from year toyear, because incoming solar radiation, which is constantfrom year to year, is the main controlling factor. In contrast,the Thornthwaite formula shows considerable yearly variabil-ity for any station because it is strongly influenced by annualtemperature range - the individual monthly temperaturemeans. The Penman formula appears to give slightly lower read-ings in the high-sun period (the local summer or period oflonger daylight) and slightly higher readings in the low sunperiod than the Thomnthwaite formula. In this respect it isresponsive to the criticism of Thornthwaite by Papadakis andby Rao et al (1976). Some authors prefer the Penman for-mula, arguing that it is based on sound physical and mathem-atical theories while Thornthwaite is more empirical. Thornth-waite has been morn widely used in the literature and has theadvantage of being based on the station’s precipitation andtemperature data in combination with its latitude (and thus itspotential solar radiation). Penman requires additional data(for example cloudiness expressed as a decimal fraction) thatthe Thornthwaite system does not call for and that are notavailable for moet of the world’s reporting weather stations. Using data from agricultural experiment stations acrossCanada, Baier and Robertson (1965) developed a series ofregression equations to estimate latent evaporation usingwhat they called simple weather observations. The funda-mental formula required both maximum and minimumtemperature; the inclusios of data for vapor pressure deficitand wind markedly improved the accuracy of the estimate.Unfortunately, most reporting location seldom publish evensuch basic information. Linacre (1977) worked dowly with the Penman formula todevelop a methodology to estimate evsgxntion (not evapo-transpiration) rates umw temperature data alone. The for-mula appears to provide realistic results over a wide image ofclimates but, unfortunately, it too requires infrequentlyreported data on daily temperature rapp. Tamisin et al (1979) thoroughly analyzed potential evapo-transpiration for 35 Philippine stations using a modifiedPenman equation. Results were excellent but the techniquerequires wind speed cloudiness data not normally avail-able for a wide range of stations on a continental scale. In
addition, the Tamisin analysis used eight udiation equationsto represent conditions in a range of contrasting region in thePhilippines. The combination of complexity of calculationand inadequacy of data prevented this technique’s use on acontinental scale. There is no method by which evapotranspiration over awide range of evironments can be predicted predsely on thebasis of simple, avuibbie wcadw element data, although re-search suggests that Thornthwaite’s empirically based systemhas consistently produced the most accurate results. Such asystem clearly has no value in explaining environmentalprocesses (for which Thonthwaite never intended it). InThornthwaite’s day (as today) the system was useful onlybecause it provided answers where no better ones wereavailable.
TEMPORAL VARIABILITYAny map based on the use of long-term means of climaticelements has the disadvantage of masking variability. Rain-fall records for individual station are not normally distri-buted, but are poatively skewed. To illustrate the degree ofvariability and conditions that all climate classifications maskto some degree, many years of data for Cuttack, Orissa, Indiawere analyzed. Cuttack was chosen because of its locationin the heart of a major Indian rice region when food short-ages have often been serious. The city lies at the head of theMahanadi River Delta, in a district where about half of therice area is nowrngated. The record for both tempestuifladrainfall is continuous from 1878; only rainfall data an availa-ble for 1867-1877. The data for each of the 83 years (1878-1960) were pro-cessed by a computer program based on Thornthwaite(Thornthwaite and Mather 1955) formulas for PE, soil mois-ture storage, AZ and water deficit. The program for the years1867-1877 was run using the pre-1930 temperature mean andthe rainfall rwords for the individual years. The normal data for Cuttack indicate that the meanmonthly precipitation for the 5-montt period from Junethrough October ciweeds the PE in every month (Table 2),that soil moisture is at full capacity for the entire period, andthat some runoff takes place each month. The normal dataindicate no water deficit from June through October - fineconditions for rainfed rice production. Unfortunately for the farmer, there is seldom a year inwhich actual field conditions parallel normal conditions. TheCuttack data were processed emphasizing June throughOctober - the 5 months critical to wetland rice. Table 2indicates the years when actual rainfall for each of thosemonths was less than the PE for theacus nwntk For each ofthose years there was an important deviation in the weatherfrom normal - a condition masked by the analysis of meandata. Over the 94-year period, PE exceeded actual precipitationin only 10, 9, and 12 years during July, August, and September, respectively. These months are the least drought
AGROCLIMATIC AND DRY-SEASON MAPS OF SOUTH, SOUTHEAST, AND EAST ASIA 9

Table 2. Years in which precipitation was less than potential evaporation (PE) in the wet season, by month. a Cuttack, Orissa, India._
Month Year when precipitation was < PE
June 1869, 1870, 1871, 1873, 1876, 1877, 1879, 1828, 1885, 1888, 1891, 37 207 187 201893, 1898, 1900, 1901, 1905, 1913, 1920, 1923, 1924, 1926, 1927,1929, 1931, 1932, 1935, 1939, 1942, 1945, 1948, 1949, 1951, 1953,1955, 1957, 1958, 1959,
July 1893, 1898, 1904, 1907, 1911, 1915, 1916, 1918, 1949, 1955, 10 355 168 187
August 1869, 1871, 1877, 1892, 1894, 1899, 1905, 1932, 1935, 9 365 174 191
September 1889, 1894, 1899, 1901, 1902, 1916, 1918, 1919, 1938, 1947, 1953, 12 252 165 871957,
October 1867, 1868, 1869, 1871, 1873, 1876, 1877, 1878, 1879, 1880, 1881, 54 168 147 211883, 1884, 1885, 1887, 1888, 1891, 1893, 1894, 1895, 1896, 1901,1902, 1904, 1905, 1906, 1907, 1908, 1909, 1911, 1914, 1918, 1919,1920, 1921, 1922, 1924, 1927, 1930, 1932, 1933, 1934, 1935, 1937,1940, 1942, 1943, 1947, 1948, 1950, 1951, 1953, 1957, 1960
aLength of record, 94 years, 1867 through 1960.
Occurrence (total no.)
_______Mean (mm)___________Precipitation PE Surplus
prone at Cuttack. Interestingly, in 4 of the 12 years whenSeptember was dry, either July or August was also dry. In1894 and 1899 both August and September were dry and amodest famine prevailed in Orisa. In 1916, July and Sep-tember combined had 383 mm less than normal minfall thatdrought year was cloudy follond by 1918 when the wAterdeficit in the same 2 months slightly exceeded 400mm and the2-month total rainfall was the lowest in 94 years of rainfallrecord. This dlsastmua mason - one of the most serious ofthe famine years in Orissts history -ended with only 3 mmof precipitation for October tather than the normal 168 mm. The data suggest that a dry month early in the core of therainy season is often followed by another dry month later thesame year - a potential disaster for the farmer on nonirri-gated land. This phenomenon should be investigated furtherso that cropping systems that minimize such loses can bedesigned. Table 2 indicate that June and October have almost iden-tical mean surpluses of precipitation over PE. Under theseconditions one might reasonably suspect that frequencies ofdrought in these months will be rbughly equal. But dnrsostshows that June suffered from dibaght 37 times whileOctober was hit 54 times. That evidence strongly suggest thattemporal variability is far greater during the period of theretreat than during the onset of the rainy season, and empha-sizes the pitfalls of any classification scheme based on long-term means. At Cuttack, the mean data shows a 5-month wetseason but that wet period ittluded 122 montlw of droughtover 94 years. In 1956 Cuttack had the highest rainfall ever; in 1957, it hadthe lowest. During the 20-month dry period beginning withthe record low rains of the 1957 monsoon season, the Palmer(1965) drought index reached a record low of 490, andGeorge et al (1973) reported the drought as extreme during 10of the 20 months. Table 3 shows water balance data for theextreme years l956 and 1957, as well as for 1880,a year quiteclose to normal.
Table 3. Examples of Thorthwaite data on water balance for Cut-tack, Orissa, India.
Potenetial Soil Water Actual evaporation storage deficit evaporation (mm) (mm) (mm) (mm)
1880a, a tyical year1 67 15 52 15
53 98 10 39 580 161 2 153 8
34 183 0 148 36170 191 0 21 170203 181 23 0 181278 179 100 0 179538 174 100 0 174261 150 100 0 150131 147 85 1 146
35 86 52 17 690 57 29 35 22
1956b, wettest year recorded0 78 18 62 16
59 83 11 21 623 167 2 155 111 186 0 184 3
157 197 0 40 157465 164 100 0 164345 168 100 0 168521 174 100 0 174445 159 100 0 159349 138 100 0 138
27 85 56 14 710 66 29 39 27
1957c, driest year recorded12 84 2 70 1420 96 1 75 218 151 0 143 91 183 0 182 13 208 0 205 3
101 198 0 97 101246 179 67 0 179337 174 100 0 174146 159 88 1 158
10 156 20 79 770 99 8 86 130 74 4 70 4
aTotal water deficit (TWD) = 464. Btwd = 515, Ctwd = 1006.
Precipitation (mm)
10 AGROCLIMATIC AND DRY-SEASON MAPS OF SOUTH, SOUTHEAST, AND EAST ASIA

SPATIAL VARIABILITYMaps by nature portray a static condition. A line separatingregions on a climatic map suggests a permanence sekiomfound in nature. As at Cuttack, the data, and possibly, theclassification, for any station changes considerably from yearto year. A perturbation in the data for one station is oftenmimicked by data from nearby stations. Thus, over time,entire regions can be shifted from one, side of a boundary toanother. The map indicates the mean position of a boundaryin which spatial range maybe considerabIe. The map of Central Burma (Fig. 4) shows an example ofthis mobility. Here Thornthwaite's humiderid (C1/D) bound-ary was plotted using daily data from 83 Central Burmesestations. The dMde was plotted in position for each of the 11consecutive years (1950-1960) for which data were available.The map shows the mean position of the divide as determinedfrom the normal data for the 83 stations. The map alsooutlines all areas that were included within the boundary for
at least 1 year when mapping was based on data for individualyears, and shows the core area classified as arid for the entirespan of 11 years. The core area includes only 650 km2; itsmaximum extent is almost 45,000 km2. Thus the core areaincludes only 15% of the outer limits of coverage. Suchspatial variability, inherent in all climatic boundaries, shouldbe considered when using the accompanying maps.
WET-DRY TRANSITIONThe Cuttack data suggest that the end of the dry season comesmore abruptly, with less variability over time, than its onset This observation appears to agree with that of Morris andZanditra (1978) in their study of probabilities for certainweekly rainfall totals at the onset and at the termination ottherainy season at Iloio and Pangasinan, Philippines. At thosetwo sites, the date beyond which a given precipitation levelcould be expected at the end of the wet period varied over 20days - but the expected date of a given level at the start of therains varied by only 14 days. To further check this pattern, the likelihood of wet and ofdry days was studied at 3 stations in Burma using dailyrainfall records for a 29-year period. Each date was classifiedas rainy (>= 0.01 in., or 0.025 cm of precipitation) or dry(<0.01 in., or 0.025 cm). Anydatethathadarecordof 15 ormore occurrences of rainfall over the 29-year period wasclassed as rainy; any date having l4 or less was classed as dryThe results were plotted from 1 January through 31 Decemberwith dry days represented along the Y axis and wet days onthe X. Graphs 1, 2, and 3 in Figure 5 show the daily rainfallexpectations at Rangoon in the Irrawaddy Delta, at Taunggyiin the Shan Plateau, andat Myitkyina in the far north. Theabrupt transition from vertical (dry) to horizontal (wet)occurs in May at 11 three nations. The transition from wet todry occurs in September-October and fluctuates considerablymore than the May transition; The Burmese dry season atleast appears to start slowly but ends abruptly. The transitionin September-October is much longer tbao that in May. This same pattern of a dry seasoMbat cats morn abruptlythan it begins was found in three spatially diverse Asianlocations north of the equator knd markedly contradicts aconclusion reached in an IRRI (1974) study. The earlier workobserved that: "While the onset of the rainy season is gradual,the retreat of the equatorial low pressure belt and the coolingof land masses at the same time causes a very abrupt end ofthe rainy season, followed by a niarled dry season." The dry season appears less understood than the wet sea-son and has seldom been the focus of either weather andclimate studies or of classification schemes. Much of the hopefor increasing food production in Asia depends upon increas-ing the cropping intensity of current agicultini lands. Suc-cess will largely depend on more effective use of transitionperiods and of the dry season. The dry-season maps areintended to increase our understanding of that season. Thefoci of interest are the length, dining, and intensity of the dryportion of the year.
AGROCLIMATIC AND DRY-SEASON MAPS OF SOUTH, SOUTHEAST, AND EAST ASIA 11

5. Three Burmese stations. Mean expectation of dry conditions (vertical) or wet conditions (horizontal) by date. Note sharp tnnsition at Rangoon and moregradual transition at Myitkyina.
DATA USEDData from about 3,000 stations (see bibliography for a noteon sources) were used to preparc the accompanying apo-climatic maps. For some aim such as Java, data are avail-able for many mom stations thus could be used at the scale ofthis study. The grid of weather stations is sparse for otherareas such as interior China and Indonesia's West Irian. Indeveloping the agroclimatic maps, the work of Manalo forthe Philippines and Bangladesh was consulted, and the mapsof Oldeman were used to supplement areas of Java, Sumatzu,and Sulawesi, Indonesia, where data were less than optimal. The dry-season maps were based on the same 3,000 sta-tions, using the following criteria. number of months during which a water deficit occurs in a normal year (water deficit is defined as the condition in which actual evapotranspiration is less than potential evapotranspiration) and the total water deficit for the year (the sum of 12 monthly deficit figures).
For these maps it was necaury to process the data tocalculate the climatic water budget for each station accordingto the Thomthwuite cippirically lamed sytent A simple pro-gram us written in BASIC to simplify the tedious prove ofhand calculation. The algorithm requires - of monthlytemperature and rainfall data - wells the station's latitudeto the closest degree and the soil moisture storage capacity inmillimeter (default when data not available am 100mm). Theprogram prints five annual index figures as well as monthlytotals for; 1) potential evapotranspiration, 2)soil storage, 3)water deficit, and 4) actual evapotranspiration. The processed data points were plotted and the isolineswere drawn with comideration of topography and otherclimate controls for cacti map set. All of the maps are on thesame scale. One map act emphasizes the wet months; theother, the dry season. Analysis of tin two acts together maylead to a clearer understanding of the annual march ofseasons and thus help improve the agriwitural use of avail-able moisture.
12 AGROCLIMATIC AND DRY-SEASON MAPS OF SOUTH, SOUTHEAST, AND EAST ASIA
NOTE: Items marked with an asterisk (*) were found to be ofspecial interest because they contained raw data on rainfall ortemperature, or both, that we used in the development ofthe maps. The asteriskediten contain data for about 8,000stations, most of which are dupliwed in at least one othersource. The most vnluabe data source was Thornthwa-ite Associates (1963) it contained data for mm than 1,400stations wos the mapped arm.
Angus, J. F. 1979. The uses of water belancs and their limitations for land classification. Paper presented at the IRRI-CSEAS Workshop on Land Evaluation for Rice-based Cropping Systems.*Arakawa, H., ed. 1969. Climates of northern and eastern Asia World Survey of Climatology. Vol. 8. Elsevier, Amsterdam.Baier, W., and G. W. Robertson. 1965. Eatimation of latent evaporation from simple wither observations. Can. J. Plant Sci. 45:276-284.Baier, W., and G. W. Robertson., 1966. A new versatile soil moisture budget. Can. J. Plant Sci. 46:299-3 15.Barker, R.,and R. W. Herdt. 1979. Rainfed lowland rice as a research priority - an economist's view. IRRI Res. Pap. Ser. 26. 50 p.*Berlage H. P., Jr. 1960. Rainfall in Indonesia. Pertjetakan Negara, Djakarta.*Burma Meteorotogical Department. (published yearly). Statement showing the monthly and annual rainfall at rain-recording stations in Burma for the year. Govern- ment Printing Office, Rangoon.*Committee for Coordination of Investigations of the Lower Mekong Basin. 1975. Summary of monthly and yearly hydrometeorological data in the Thai part of the low Mekong basin. Mekong Secretariat, Bangkok.Critchfield, H. J. 1960. General Climatolog. Prentice. Hall, Engeiwood Cliffs, N. J., U.S.A.Decker, W. L. 1974. Unsettled and variable climate -- uncertain food supply! Ind. Res. l6:5l-56Denmead, O. T., and R. H. Shaw. 1962. Availability of soil water to plants as affected by soil moiture content and meteorological conditions. Agrom. J. 45:385-390.*Ekanayake, L. A. D. I. 1972. Report on the Colombo observatory for 1967: with maps and statistics. Dept of Gov. Printing. Sri Lanka.*George, C. J., K, S. Ramasastri, and G. S. Rentala. 1973. Incidencej of droughts in India. Meteorol. Monogr. Agrimet 5. India Meteorological Department, Poona.*George, C. J., P. E Moray, and V. P. Abhyankar. 1974. Rainfall pattern of rice-growing areas prone to drought in India. Meteorol. Monogr. Agrimet 6. India Meteoro- logical Department, Poona.
Hadikoemoro, S., and U. M. Hasan. 1961. Climatic classifi- cation of Java and Madura according to Thornthwaite System 1948. Soil Research Institute, Bogor. (mimeo.)Hounam, C. E., J. J. Burgos, M. S. Kalik, W. C. Palmer, and J. Rodda. 1975. Drought and agriculture. Report of the CAgM Working Group on the Assessment of Drought. World Meteorological Organization Tech. Note 138. Geneva, Switzerland.India Meteorological Department 1962. Weather and the Indian farmer. 2nd ed. Met Dep., Poona.*India Meteorological Department 1974. Climate of Maha- rashtra State. Controller of Publication Delhi.*India Meteorological Department 1976. Climate of Andhra Pradesh. Controller of Publications, Delhi.*India, Orissa, Agricultnl Information Section Directorate of Agriculture and Food Production. 1980. Agricultu- ral guidebook 1979-80. Agricultural Information Press, Bhubaneswar, Orissa.Indonesia Meteorological and Geophysical Service. 1971. Climatological data of Indonesia. VoL 29. Meteorologi- cal and Geophysical Service, Djakarta.IRRI (International Rice Research Institute). 1974. An agro- climatic classification for evaluating cropping systems potentials in Southeast Asian rice growing regions. Los Baños, Philippines. 10 p. + maps.Kuelemans, N. C., M. Fathan, and Suparto. 1976. An analy- sis of agrometeorological data - Darmaga - West Java, 1969 and 1970. Institute for Meteorology and Geophys- ics, Djakarta.*Kyuma, K. 1971. Climate of south apcr southeast Asia according to Thornthwaite’s classification scheme. Tonan Ajia Kenkyu 9136.158.Kyuma, K. 1972. Numerical classification of the climate of south and southeast Asia. Tonan. Ajia Kenkyu. 9:502- 521.Linacre, E. T. 1977. A simple formula for estimating evapora- tion rates in various climates, using temperature data alone. Agric. Meteorol. 18:409-424.Manalo, E. B. 1977a. Agro-climatic survey of Bangladesh Bangladesh Rice Research histitute and International Rice Research Institute, Decca, Bangladesh and Los Baños, Philippines.Manalo, E. B. 1977b. Agroclimatic map of the Pbilippines. International Rice Research Institute, Los Baños,
*Meteorological Office. 1958. Table otapmratme, relative humility and precipitation for the world. Part V -Asia. Her Majesty's Stationery Office, London.Miller, H. A. 1964. Climatology. Barns and Noble, N. Y., USA.*Ministry of Agriculture and Rural Development. 1974.
AGROCLIMATIC AND DRY-SEASON MAPS OF SOUTH, SOUTHEAST, AND EAST ASIA 13
BIBLIOGRAPHY OF SOURCES CONSULTED

Rainfall records for peninsular Malaysia. 1965-1970. Drainage and Irrigation Division, Kuala Lumpur.Morris, R. A., and H. G. Zandatra. 1978. Soil and climatic determinants in relation to cropping patterns. Interna- tional Rice Research Conference, 17-21 April. Interna- tional Rice Research Institute, Los Baños, Philippines.*Nuttonson, M. Y. 1947. Ecological crop geography of China and its agro-climatic analogues in North Amer- ica, American Institute of Crop Ecology, Washington, D.C.*Nuttonson, M. Y. 1958. The physical environment, land use, farm crops and agricultural pratices of central and south China, Hongkong, and Taiwan (Formosa) with some climatically analogous areas in Southeast Asia. American Institute of Crop Ecology, Washington, D. C. 436 p.*Nuttonson, M. Y. 1963a. The physical environment and agriculture of Vietnam, Laos, and Cambodia. Ameri- can Institute of Crop Ecology, Washington, D.. C.*Nuttonson, M. Y. 1963b. Climatological data of Vietnam, Laos, and Cambodia. American Institute of Crop Ecology, Washington, D. C.*Nuttonson, M. Y. 1963c. Agro-climnatic analogues of South- ern China in Southeast Asia. American Institute of Crop Ecology, Washington, D. C.*Nuttonson, M. Y. 1963d. The physical environment and agriculture of Burma. American Institute of Crop Ecol- ogy, Washington, D. C.Ohman, H. L. 1965. Climatic atlas of Southeast Asia. U. S. Army Natick Laboratories, Natick, Massachusetts. 92 p.Oldeman, L. K 1975. An agro-climatic map of Java, Contrib. Cent. Rn. Inst. Agric. Bogor, 17.22 p. + map.Oldeman, L. R, and D. Syarifuddin. 1977. An agro-climatic map of Sulawesi Contrib. Cent Res. Inst. Agric. Bogor, 33. 30p. + map.Oldeman, L. R., I Las, and S. N. Darwis. 1979. An agro- climatic map of Sumatra. Contrib. Cent. Res. Inst. Agric. Bogor, 52. 36p. + maps.O’Toole, J. C. and T. T. Chang. 1977. Drought and rice improvement in perspective. IRRI Res. Pap. Ser. 14. 27p.Palmer, W. C. 1965. Meteorological drought. Res. Pap. 45, U. S. Dep. of Commerce, Weather Bureau.Papadakis, J. 1961. Climatic tables for the world. Cordoba 4564, Buenos Aires.Penman, H. L 1948. Natural evaporation from open water, bare soil and grass. Proc. R. Soc. London, Ser. A 193.Peruel, E. 1976. A study of climatology in agriculture. Department of Agronomy, International Rice Research Institute, Los Baños Philippines.Rainbird, A. F. 1970. Methods of estimating anal average precipiwtiosL WMO/ IHD Proj. Rep. 3, Geneva, Switzer- land.
Ramamurthy, K. 1972. A study of rainfall regimes in India. Madras Univ. Geogr. Ser. 1,. University of Madras.*Rao, K. N., C. E. J. DanieJ, and V. K. Bhargava. 1975. Rainfall of India - rainy days of 1 cent (0.3 mm) or more, Mem. India Meteorol Dep. 32(4).*Rao, K. N., C. J. George, and K. S. Ramasastri. 1976. The climatic water balance of India. Controller of Publica- tions, Delhi Mem. India Meteorol. Dep. 32(3). 36 p. + figs.Rumney, G. R. 1968. Climatology and the world’s climates. MacMillan and Co. London, England.Sastry, P. S. N. 1977. Evaporation and water balance in a semi-arid monsoonal climate under advective condi- tions. Proceedings, Symposium on improving crop productivity by nuclear and allied techniques. New Delhi.Schneider, S. H. 1975. Is there really a a food-climate crisis? Pages 106-143 in R. J. Kopec, ed. Atmospheric quality and climatic change. University of North Carolina at Chapel Hill.Subrahmanyam, U. P. 1956. Water balance of India socord- ing to Thornthwaite’s concept of potential evapotrans- piration. Ann. Assoc. Am. Geogr 46:3.Syarifuddin. 1979. Establishment and performance of rainfed corn (Zea mays L.) and soybean (Glycine max [L.] Merril) in the dry season after puddled flooded rice. Ph D thesis, University of the Philippine at Los Baños, Philippines. 354. p.Tamisin, M. M., D. T Franco, E. B. Manalo, and H. G. Zandatra. 1979. Modelling of potential evapotranspira- tion and solar radiation for different regions of the Philippines. Paper pnsented at a Saturday seminar, 13 October 1979. International Rice Research Institute, Los Baños, Philippines.*Thornthwaite Associates. 1963. Average climatic bal- ance of the continent part II, Asia. Publication in Climatology, Centerton, New Jersey.Thornthwaite, C. W. 1948. An approach toward a rational classification of climate. Geogr. Rev. 38:55-94.Thornthwaite, C. W., and J. R. Mater. 1955. The water balance. Publicatior. in Climatology. Centerton, New Jersey.Tomar, V. S., and J. C. O’Toole. 1978. Evapotranspiration from rice fields. Paper presented at a Saturday seminar, 12 August, 1978, Interrnational Rice Reserch Institute, Los Baños, Philippines.*U. S. Air Force 20lh Weather Squadron. 1965. Climate of Malaysia. Clearing house for Federal Scientific and Technical Information, Springfield, Va.*U. S. Enviromental Science Services Administration. 1967. World weather records 1951-60. Vol. 4, Asia. U. S. Department of Commerce, Washington, D. C.*Watta, I. E. M. 1967. Climatology of China and Korea. Government Press, Hongkong.
14 AGROCLIMATIC AND DRY-SEASON MAPS OF SOUTH, SOUTHEAST, AND EAST ASIA

Willmott, C. J. 1977. Watbug a fortran IV algorithm for calculating the dimatic water budget Publ. Climat. 30(2). Laboratoiy of Climatology Elmer, N. J.Yoshida, S. 1978. Tropical climate and its influcire on rice. IRRI Res. Pap. Ser. 20.25 p.*Yoshino, M. M.,ed. 1971. Water balance of monsoon Asia. University of Hawaii Press, Honolulu. 308 p.
AGROCLIMATIC AND DRY-SEASON MAPS OF SOUTH, SOUTHEAST, AND EAST ASIA 15

.

.

.

.