A Review of Desalination Trends in the Gulf Cooperation Council Countries · A Review of...
25
International Interdisciplinary Journal of Scientific Research ISSN: 2200-9833 www.iijsr.org 72 A Review of Desalination Trends in the Gulf Cooperation Council Countries R. Al Hashemi, S. Zarreen, A. Al Raisi, F.A. Al Marzooqi, S.W. Hasan * Institute Center for Water and Environment (iWATER), Department of Chemical and Environmental Engineering, Masdar Institute of Science and Technology, P.O. Box 54224, Abu Dhabi, United Arab Emirates Email: [email protected] *Corresponding Author Abstract The Gulf Cooperation Council (GCC) is a sub-region of the Economic and Social Commission for Western Asia economic realm that is located in the Middle-East, and consisting of six members that include Qatar, the Kingdom of Saudi Arabia (KSA), Bahrain, Oman, Kuwait and the United Arabs Emirates. This region is located in an arid ecosystem and one plight that is common to the entire members is the scarcity of renewable water resources. As a result, they have resorted to investing in desalination technologies to suffice the demand of the ever increasing population. Nonetheless, this journey has never been that rosy since there are a number of challenges that have come in their way. Among these challenges is the unit cost of desalination, environmental pollution, and also the number of contracted capacity. However, it is upon the management to frame reliable policies so as to overcome these challenges lest the problems persist. For instance, in Abu Dhabi, in order to realize the 2030 vision, then there is need to recycle wastewater for use in agricultural production instead of using desalinated water that comes directly from the plants. This review paper highlights the desalination trends in the GCC countires. Keywords: Desalination, Gulf Cooperation Council Countries, Analysis 1. Introduction The GCC is an economic region consisting of six Middle-East economies including Qatar, KSA, Bahrain, Oman, Kuwait and the United Arab Emirates (UAE). These countries are grouped together since they have a lot in common. Ideally, these nations have comparable socio-economic situation and oil exploration forms the backbone of their economies, spanning four decades back. Importantly, merchandise
Transcript of A Review of Desalination Trends in the Gulf Cooperation Council Countries · A Review of...
International Interdisciplinary Journal of Scientific Research ISSN: 2200-9833 www.iijsr.org
72
A Review of Desalination Trends in the Gulf Cooperation
Council Countries
R. Al Hashemi, S. Zarreen, A. Al Raisi, F.A. Al Marzooqi, S.W. Hasan*
Institute Center for Water and Environment (iWATER),
Department of Chemical and Environmental Engineering,
Masdar Institute of Science and Technology, P.O. Box 54224,
Abu Dhabi, United Arab Emirates
Email: [email protected]
*Corresponding Author
Abstract
The Gulf Cooperation Council (GCC) is a sub-region of the Economic and Social Commission for
Western Asia economic realm that is located in the Middle-East, and consisting of six members that include
Qatar, the Kingdom of Saudi Arabia (KSA), Bahrain, Oman, Kuwait and the United Arabs Emirates. This
region is located in an arid ecosystem and one plight that is common to the entire members is the scarcity of
renewable water resources. As a result, they have resorted to investing in desalination technologies to
suffice the demand of the ever increasing population. Nonetheless, this journey has never been that rosy
since there are a number of challenges that have come in their way. Among these challenges is the unit cost
of desalination, environmental pollution, and also the number of contracted capacity. However, it is upon
the management to frame reliable policies so as to overcome these challenges lest the problems persist. For
instance, in Abu Dhabi, in order to realize the 2030 vision, then there is need to recycle wastewater for use
in agricultural production instead of using desalinated water that comes directly from the plants. This
review paper highlights the desalination trends in the GCC countires.
Keywords: Desalination, Gulf Cooperation Council Countries, Analysis
1. Introduction
The GCC is an economic region consisting of six Middle-East economies including Qatar, KSA,
Bahrain, Oman, Kuwait and the United Arab Emirates (UAE). These countries are grouped together since
they have a lot in common. Ideally, these nations have comparable socio-economic situation and oil
exploration forms the backbone of their economies, spanning four decades back. Importantly, merchandise
International Interdisciplinary Journal of Scientific Research Vol. 1 No. 2 November, 2014
73
in oil-related products dominates their export markets, accounting for more than 90% of their total exports.
One major resource that has been impeding the faster development of this region has been the scarcity in
natural water resources at the backdrop of increasing demand(Al-Rashidi et al., 2009). The increasing
demand is a consequence of population growth, and as such, the surface water resources are now exhausted.
In some countries, the aquifers are already drained. To this end, to supplement the declining fresh water
resources, the GCC countries have resorted to investing, massively, in desalination plants much to their
success. The desalination plants invested in the GCC countries typify a successful project that has lived up to
its expectation of serving its population with continuous supply akin to economies that are sufficiently
endowed with natural and renewable water resources(Hanbury, 2010).
According to the research conducted by the World Health Organization (WHO), this region, located
within an arid ecosystem, has already hit the water scarcity line of less than 1000 m3 per year per capita. In
area, this region covers a space of approximately 2.55 million km2 and it has a common climate with a few
surface water resources. The available surface water resources are localized along the coasts of both KSA
and Oman but to the south. In a synopsis, this realm represents the harshest of the entire realms making up
the world. This region is endowed with the least fresh water resources around the world, accounting for less
than 370 cubic meters. With a growing population, it is projected that these resources will decrease to less
than half the current capacity by the year 2030 when the population will be standing at 56 million people.
With these facts, it goes without saying that the GCC countries have an uphill task of efficiently managing
the limited water resources. This is why they have taken to desalination plants to meet the demand(Mezher
et al., 2011).
Desalination plants have been part and parcel of the economies forming up the GCC, supplying both
municipalities and industries for the past two to three decades. Overreliance to the same is projected to
increase as the population swells. Among the common desalination processes employed include Multi-
Stage-Flash (MSF), Multiple-effect Distillation (MED) and Reverse Osmosis (RO). Of the three, the later
technology is becoming common to the region owing to the fact that it is cost-efficient and more reliable.
While the amount of desalinated water consumed the world over is immaterial, this region accounts for
almost 100% of their total needs. According to Global Water Intelligence (GWI) report, “the cumulative
capacity of the entire desalination plants contracted in the GCC countries since the year 1994 was 24 million
cubic meters per day by 2010”(Al Zawad and Aksakal, 2010).
The energy requirement of any given technology is vital in determining the process economies since any
slight variation in the oil prices has a greater effect on the production cost. Moreover, the more intensive a
process is in terms of energy requirements the more are the emissions (CO2 gas) released to the environment.
Importantly, the cost of desalinated water is dependent on a myriad of factors that can be grouped as either
capital related (CAPEX) or operation related (OPEX).
In the face of all these challenges comes another factor that is the competing demand from various
sectors of the economy. For ages, the GCC countries have successfully managed to balance their limited
water resources among domestic, animal and agricultural sectors. Nonetheless, in the past 50 years,
urbanization, industrialization and population growth have entered the fray. Today, these economies grapple
with the rising competing demands, for instance, “urban versus rural and human versus industrial among
others”(Hoepner and Lattemann, 2003).

International Interdisciplinary Journal of Scientific Research ISSN: 2200-9833 www.iijsr.org
74
With the background information on the water resource situation of this region, we can objectively
analyze the desalination plants in the GCC countries. As such, the rest of the literature in this paper will
focus on; the cumulative contracted capacity, number of contracted plants, proportions of different
technologies, daily water production volumes, the cost per unit and the future projections in terms of
demand/supply. Moreover, this paper will suggest policy initiatives for Abu Dhabi 2030 vision.
2. Cumulative online and contracted desalination plants and capacities
The history of desalination technology stretches way back in history. However, in the modern history,
Bahrain and Kuwait represent the first members of the GCC countries to have enjoyed desalination
technology in the name of multi-effect distiller (MED). Kuwait is, too, the first member of the GCC
countries to launch the MSF in the mid twentieth century. Currently, the number of plants installed in the
MENA (Middle East and North Africa) region is a manifestation of the increasing demand of freshwater in
this water-scarcity region. The most striking feature, however, is the increasing number of the contracted
firms in this region. When you look at the numbers of the contracted firms in the MENA region in Fig.1
below, it goes without saying that this number is relatively high in the GCC countries. Among the first six
nations of the MENA region with high numbers of contracted capacity, four hail from the GCC sub-region
with the Kingdom of Saudi Arabia leading the pack.
Fig.1: Total cumulative contracted capacity of desalination plants from 1944 to 2010
(Global Water Intelligence, 2010)
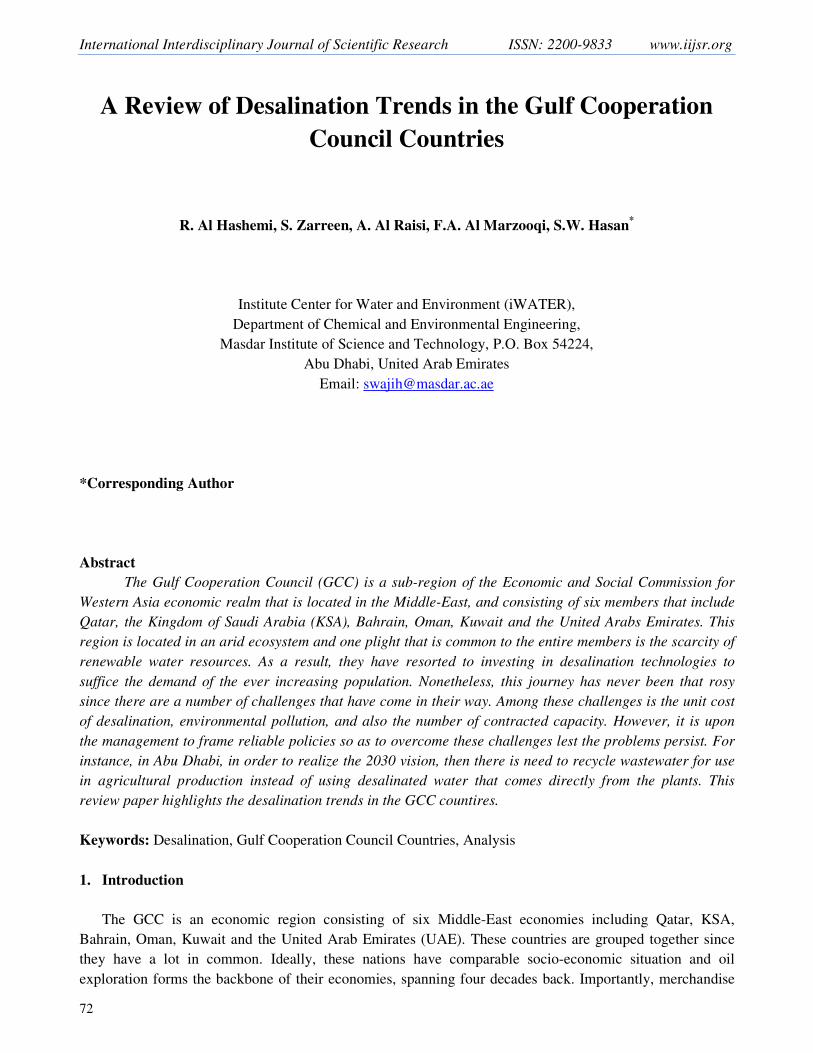
As manifested in Fig.2 below, the number of contracted firms in this region is projected to increase
in the subsequent decade. This large expansion “requires a review of the present policies and practices
including how to increase local capacity, knowledge, and added value to the local economies”(Al-Rashed
and Sherif, 2000).
International Interdisciplinary Journal of Scientific Research Vol. 1 No. 2 November, 2014
75
Fig.2: Accumulated (2010) and near term contracted capacities
(Global Water Intelligence, 2010)
The local capacity in this realm is biased on only operations and maintenance, assuming
manufacturing and design yet this is a region that is highly dependent on the desalination technology to
provide freshwater for both domestic and industrial use. Even though there are exceptional local-based
engineers in this region, they are not adequate to meet the ever soaring needs of the region. Not unless the
governments forming up the GCC region do something to support the local talent, the situation is likely to
remain delicate like in other technology-based industries which are dependent on imported talent.
Among the policies proposed by IWRM (Integrated Water Resource Management) to curb this trend
is to seal all the water leakages present in the current facilities before engaging in a white elephant project of
contracting more capacity. To this end, IWRM explains that sealing the leakages is relatively cheaper, and it
will give a true picture of the actual capacity that is required for addition.
Out of approximately 17,346 contracted and online desalination plants across the globe, the GCC
countries hold 7,499 which is 43% of the share. In-terms of capacity, the total global contracted and online
capacity as of 2013 is approximately 94,500,000 m3/d, from which 62,340,000 m3/d comes from the GCC
countries with a share of almost 70%(Table 1). Amongst all GCC countries KSA has the largest number of
plants and total capacity followed by the UAE. This trend can be directly correlated to the populations of
these two countries, being the top two in terms of population. On the other hand the country with the lowest
population (Bahrain) has the lowest desalination capacity, although it has more desalination plants that
Kuwait and Qatar. This highlights the fact that the number of plants is not a good indicator to the
desalination activities when compared to capacities. This arises from the wide range of plant capacities
present. Plant sizes as small as 1 m3/d are recorded with plants planned for 880,000 m3/d capacity. This short
analysis of the GCC countries as a whole shows how important the GCC region is in the global desalination
market. Of course, population growth is not the only driver for the desalination capacity growth. In-fact the
rapid industrial growth in the GCC countries especially in the last two decades made this region a hub to
many global industrial markets and in particular the energy market.

International Interdisciplinary Journal of Scientific Research ISSN: 2200-9833 www.iijsr.org
76
Table 1: Most recent figures of online and contracted plants and capacities of the GCC countries(DesalData,
2013; World Bank Group, 2013)
Online plants Contracted
plants
Online
capacity
(m3/d)
Contracted
capacity
(m3/d)
Population
UAE 492 497 9,358,492 10,109,057 9,205,651
KSA 2,664 2,688 13,080,497 14,791,660 28,290,000
Qatar 139 141 1,832,762 1,997,218 2,035,106
Oman 184 187 1,094,740 1,350,832 3,869,873
Kuwait 88 89 3,023,369 3,477,969 3,250,500
Bahrain 165 165 1,113,001 1,113,001 1,318,000
Total 3,732 3,767 29,502,861 32,839,737 47,969,130
Analysingthe various trends in Fig.3 to8 (and 30 to 35 in supplementary data), to start with, we
observe the general growth of number of desalination plants and capacities of countries with the population
growth. In particular, one of the steepest and most rapid growth is taking place in the UAE where within a
period of 10 years (2003 to 2013) the population literally tripled (+300%). Consequently, we observe an
almost 220% increase in desalination capacity within the same period. This effect demonstrates how
population growth and industrial growth are interlinked. If we consider the typical water consumption per
capita per day in the UAE, 0.35 m3/d, and calculate the required demand within the years 2003 and 2013
based on the given population growth. The additional demand solely by the population would be
approximately 2,050,000 m3/d, while we observe that the additional capacity added in this period to date is
approximately 5,800,000 m3/d (i.e. more than double). This observation is obvious due to the requirements
which come naturally with population growth, such as amenities, hospitals, job market etc.
The number of desalination plants and capacity figures are much related and show almost exact
trends with population. In general, we observe that the start of the rapid growth of desalination in the GCC
countries was mostly in the 1970s except for Kuwait which began its desalination take-off during late 1950s.
In particular Kuwait suffered the Iraqi invasion in 1990 which severely affected the desalination activity. In
fact, it can be observed that during the years preceding the war Kuwait lost almost 23% of its desalination
capacity.
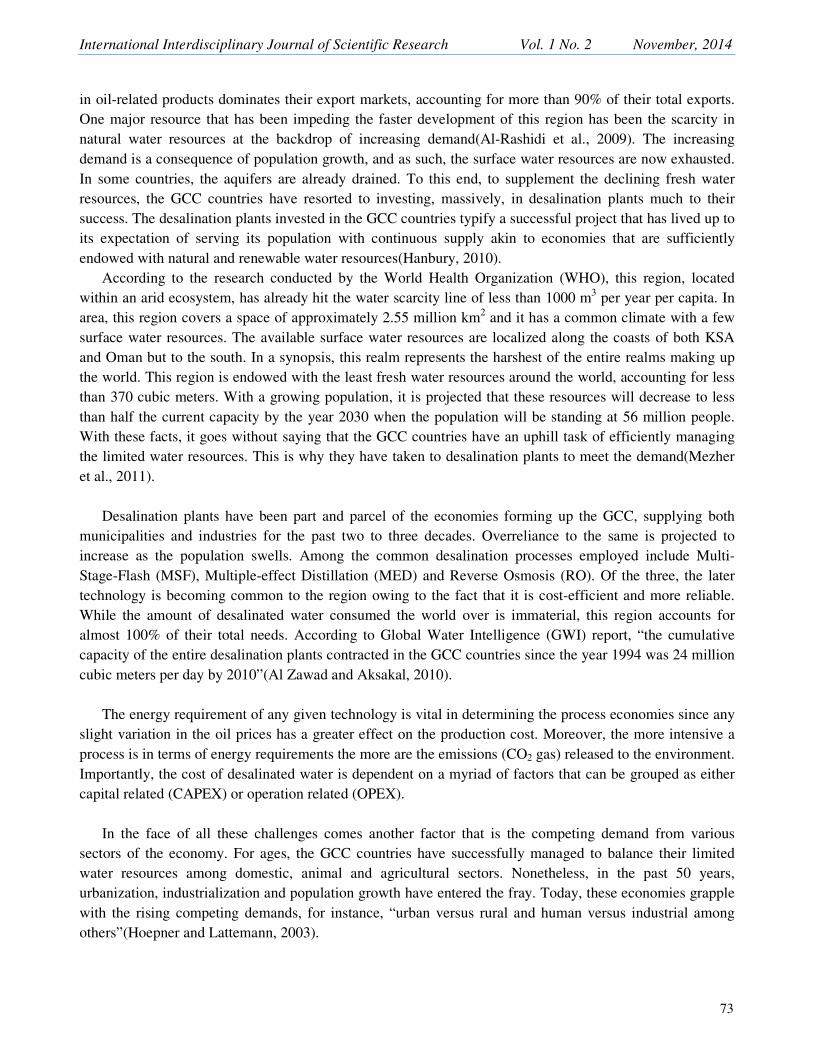
In the UAE, the rapid growth of desalination started with the merge of the union of the seven
emirates and the birth of the UAE as a country in the early 1970’s. At its early stages the desalination
capacity was around 29,000 m3/d (Fig. 3) and today it’s almost 9,400,000 m3/d. Within a period of 40 years,
the UAE became a producer of 10% of the global desalination capacity. It can be seen from Fig.3 and Fig.17
that the year 2003 was the start of a steep rise in both population and desalination in the UAE. Even with the
recession in 2009, both trends continued to rise. Fig.17 shows the predict increase in the UAE population up
to 2050, and we notice a reduction in the slope in comparison to the period before 2012.
International Interdisciplinary Journal of Scientific Research Vol. 1 No. 2 November, 2014
77
Fig.3:Contracted and online capacities with the population trend in UAE
(DesalData, 2013; World Bank Group, 2013)
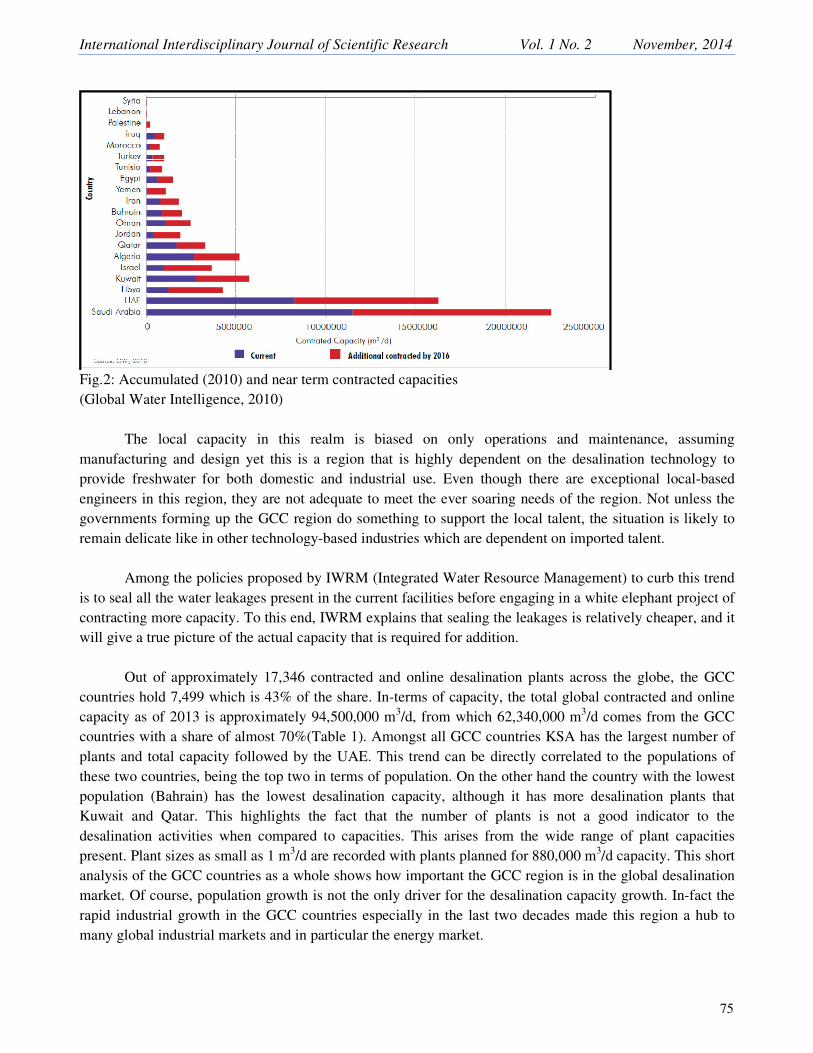
The desalination and population profile of KSA shows a rather consistent growth in both. Similar to
the UAE, in the early 1970s the desalination capacity of KSA started to increase at an accelerated rate. This
was a parallel consequence of the industrial and population growth which happened during the same time.
Similarly within 40 years, KSA became a very important player in the global desalination market with an
almost 14% share in the global desalination capacity.
Fig.4: Contracted and online capacities with the population trend in KSA
(DesalData, 2013; World Bank Group, 2013)
As one of the smaller GCC countries in terms of population and desalination capacity, Qatar saw the
rise in its desalination profile during mid-1970. The growth of desalination and population entered a sharp
increasing slope around 2004, with an increase of almost 1,100,000 m3/d in capacity since 2004.Oman
experienced a relatively consistent increase in desalination since the 1970. This growth level-off during late
1980s and then went into another period of relatively rapid increase in desalination capacity. Currently
International Interdisciplinary Journal of Scientific Research ISSN: 2200-9833 www.iijsr.org
78
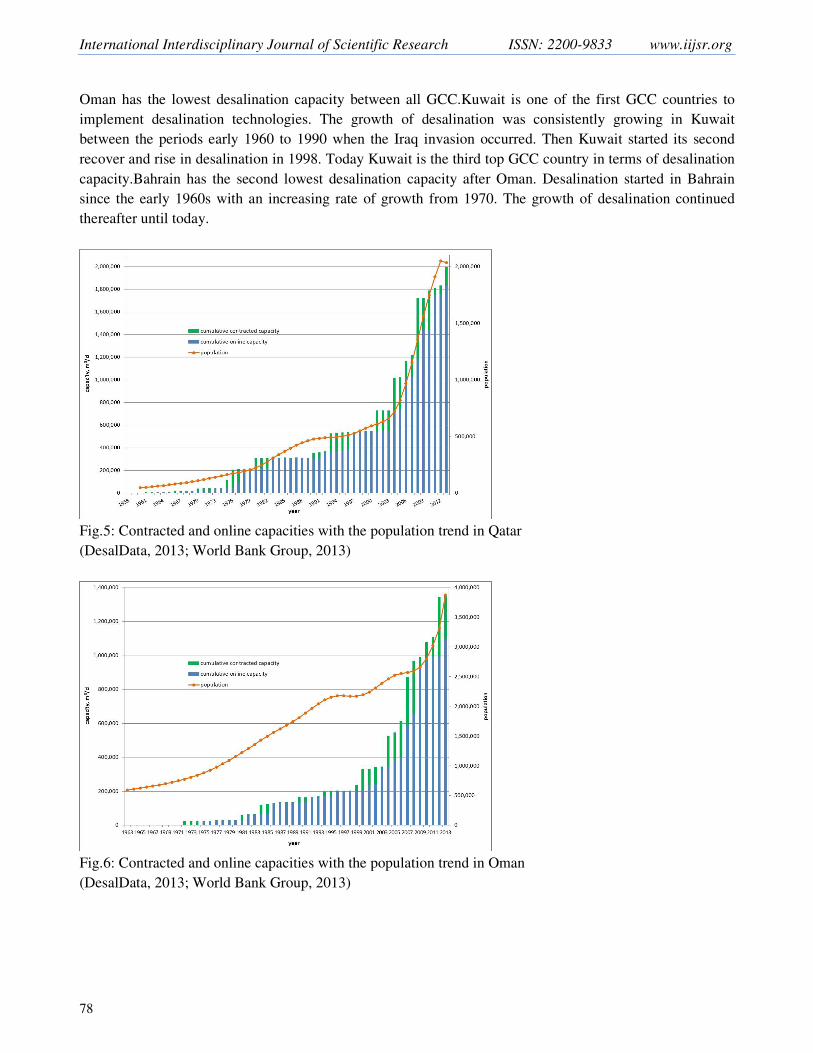
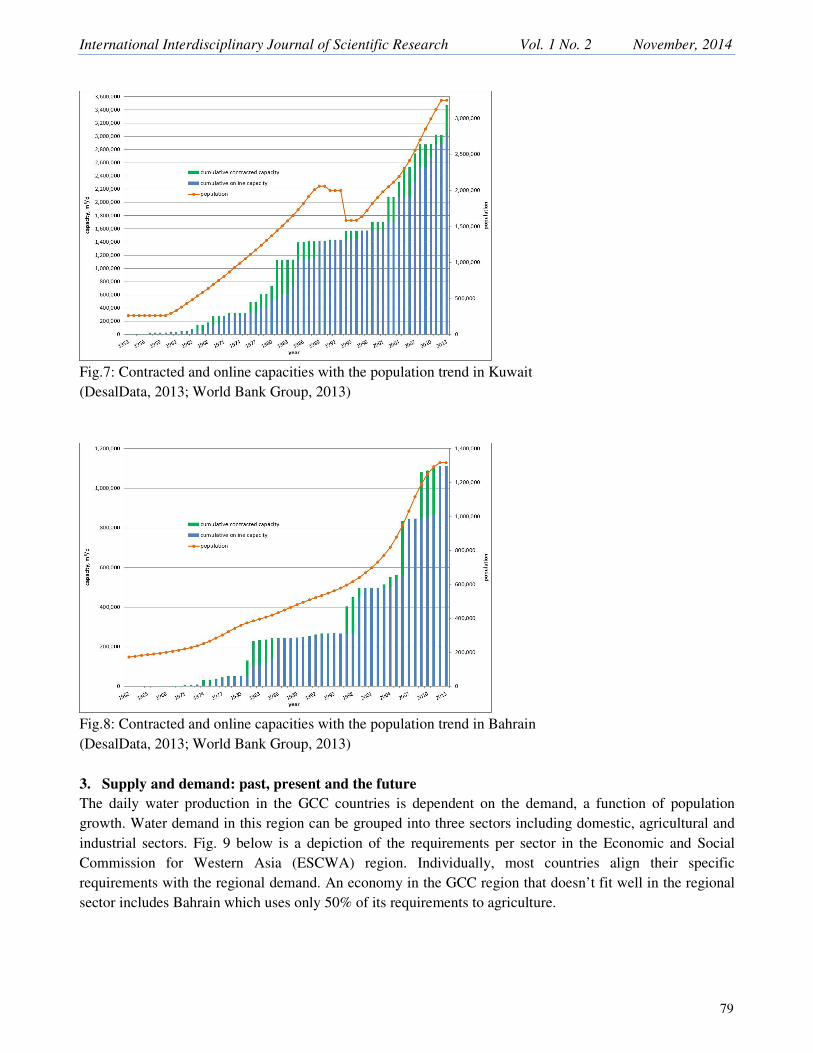
Oman has the lowest desalination capacity between all GCC.Kuwait is one of the first GCC countries to
implement desalination technologies. The growth of desalination was consistently growing in Kuwait
between the periods early 1960 to 1990 when the Iraq invasion occurred. Then Kuwait started its second
recover and rise in desalination in 1998. Today Kuwait is the third top GCC country in terms of desalination
capacity.Bahrain has the second lowest desalination capacity after Oman. Desalination started in Bahrain
since the early 1960s with an increasing rate of growth from 1970. The growth of desalination continued
thereafter until today.
Fig.5: Contracted and online capacities with the population trend in Qatar
(DesalData, 2013; World Bank Group, 2013)
Fig.6: Contracted and online capacities with the population trend in Oman
(DesalData, 2013; World Bank Group, 2013)
International Interdisciplinary Journal of Scientific Research Vol. 1 No. 2 November, 2014
79
Fig.7: Contracted and online capacities with the population trend in Kuwait
(DesalData, 2013; World Bank Group, 2013)
Fig.8: Contracted and online capacities with the population trend in Bahrain
(DesalData, 2013; World Bank Group, 2013)
3. Supply and demand: past, present and the future
The daily water production in the GCC countries is dependent on the demand, a function of population
growth. Water demand in this region can be grouped into three sectors including domestic, agricultural and
industrial sectors. Fig. 9 below is a depiction of the requirements per sector in the Economic and Social
Commission for Western Asia (ESCWA) region. Individually, most countries align their specific
requirements with the regional demand. An economy in the GCC region that doesn’t fit well in the regional
sector includes Bahrain which uses only 50% of its requirements to agriculture.

International Interdisciplinary Journal of Scientific Research ISSN: 2200-9833 www.iijsr.org
80
Fig.9: Water demand by sector in ESCWA(ESCWA, 2013)
With sufficient oil resources, the GCC countries have largely invested in desalination plants to meet
the increasing demand from various sectors. These sectors include municipality, industrial power, tourist,
military, demonstration and irrigation. Of these sectors, demand in municipality dominates in the GCC
region (Fig. 10) while demonstration records the least demanded water. The dominance of municipality
demand has been replicated in the GCC nations with exception of two states- Bahrain and Qatar (Fig. 2).
These two states’ consumption is biased towards industrial use. Just like in the entire region, the least
demanded water for use per nation is demonstration. The most dominant sectors which consume a lot of
water per nation are municipal and industry. However, the demand of water from other sectors (power,
tourist, military, demonstration and irrigation) in KSA dwarfs the dominant sectors (municipal and industry)
of most nations of the GCC. For instance, military consumption in KSA is more than what is demanded in
Qatar, Bahrain, Oman, and Kuwait. This can be attributed to the fact that KSA is large and as such dwarfs
the others in population/demand.
Fig.10: Demand by sector in the GCC (DesalData, 2013)
Industry, 7%Domestic,
7%
Agriculture,
86%
International Interdisciplinary Journal of Scientific Research Vol. 1 No. 2 November, 2014
81
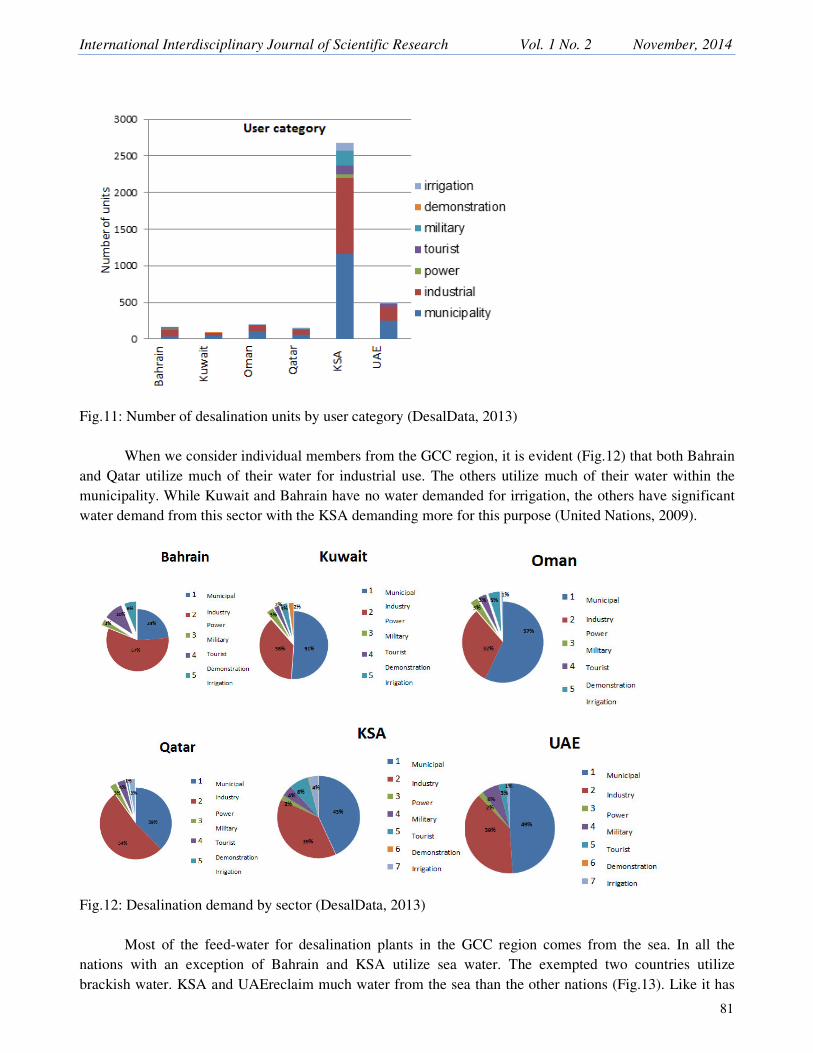
Fig.11: Number of desalination units by user category (DesalData, 2013)
When we consider individual members from the GCC region, it is evident (Fig.12) that both Bahrain
and Qatar utilize much of their water for industrial use. The others utilize much of their water within the
municipality. While Kuwait and Bahrain have no water demanded for irrigation, the others have significant
water demand from this sector with the KSA demanding more for this purpose (United Nations, 2009).
Fig.12: Desalination demand by sector (DesalData, 2013)
Most of the feed-water for desalination plants in the GCC region comes from the sea. In all the
nations with an exception of Bahrain and KSA utilize sea water. The exempted two countries utilize
brackish water. KSA and UAEreclaim much water from the sea than the other nations (Fig.13). Like it has
International Interdisciplinary Journal of Scientific Research ISSN: 2200-9833 www.iijsr.org
82
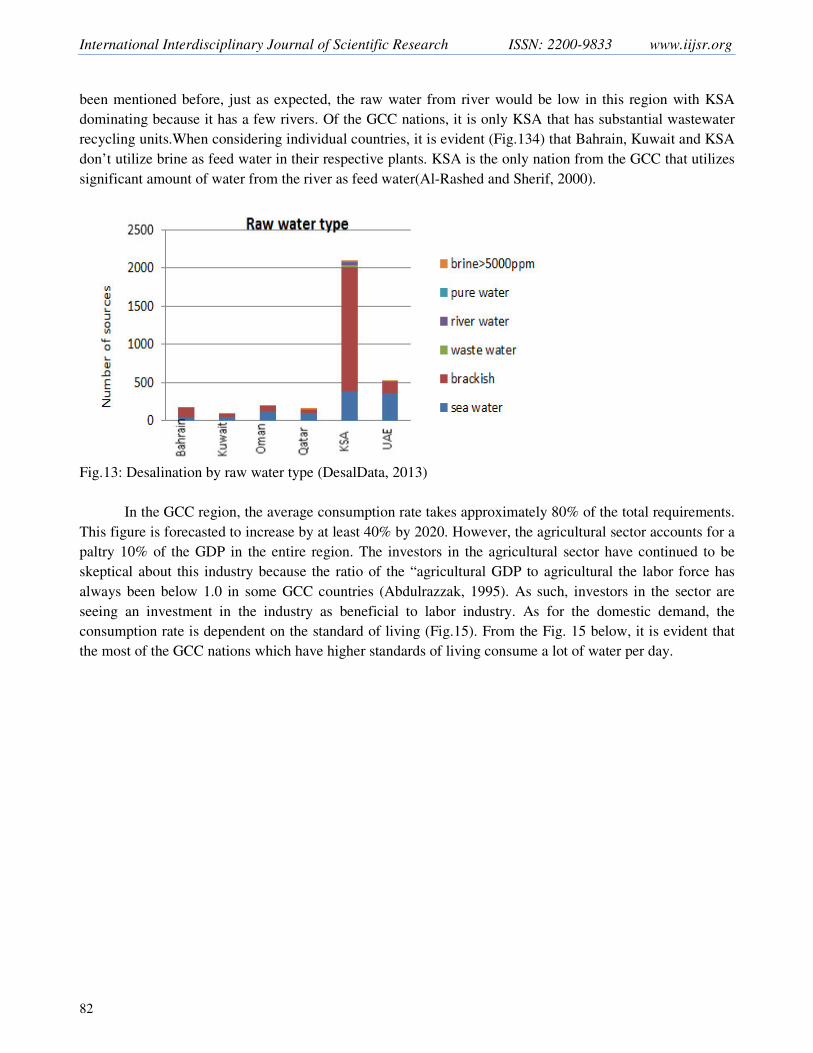
been mentioned before, just as expected, the raw water from river would be low in this region with KSA
dominating because it has a few rivers. Of the GCC nations, it is only KSA that has substantial wastewater
recycling units.When considering individual countries, it is evident (Fig.134) that Bahrain, Kuwait and KSA
don’t utilize brine as feed water in their respective plants. KSA is the only nation from the GCC that utilizes
significant amount of water from the river as feed water(Al-Rashed and Sherif, 2000).
Fig.13: Desalination by raw water type (DesalData, 2013)
In the GCC region, the average consumption rate takes approximately 80% of the total requirements.
This figure is forecasted to increase by at least 40% by 2020. However, the agricultural sector accounts for a
paltry 10% of the GDP in the entire region. The investors in the agricultural sector have continued to be
skeptical about this industry because the ratio of the “agricultural GDP to agricultural the labor force has
always been below 1.0 in some GCC countries (Abdulrazzak, 1995). As such, investors in the sector are
seeing an investment in the industry as beneficial to labor industry. As for the domestic demand, the
consumption rate is dependent on the standard of living (Fig.15). From the Fig. 15 below, it is evident that
the most of the GCC nations which have higher standards of living consume a lot of water per day.

International Interdisciplinary Journal of Scientific Research Vol. 1 No. 2 November, 2014
83
Fig.14: Feed water type for each GCC country (DesalData, 2013)
Fig.15: Domestic water consumption vs GDP per capita (Abdulrazzak, 1995)
Bahrain
1
2
3
4
Kuwait
1
2
3
4
5
6
Oman
1
2
3
4
5
6
Qatar
1
2
3
4
5
6
Saudi Arabia
1
2
3
4
5
6
UAE
1
2
3
4
5
6
Brackish
Waste water
River water
Pure water
Brine
Sea water
29%
68%
1%
1%
1%
58%
35%
3%
1%
3%
66%
30%
2%
0.5%
65%
1%
31%
1% 1%
1% 1%
18%
78%
1%
2%
0.5%
70%
27%
1%
1%
1%
International Interdisciplinary Journal of Scientific Research ISSN: 2200-9833 www.iijsr.org
84
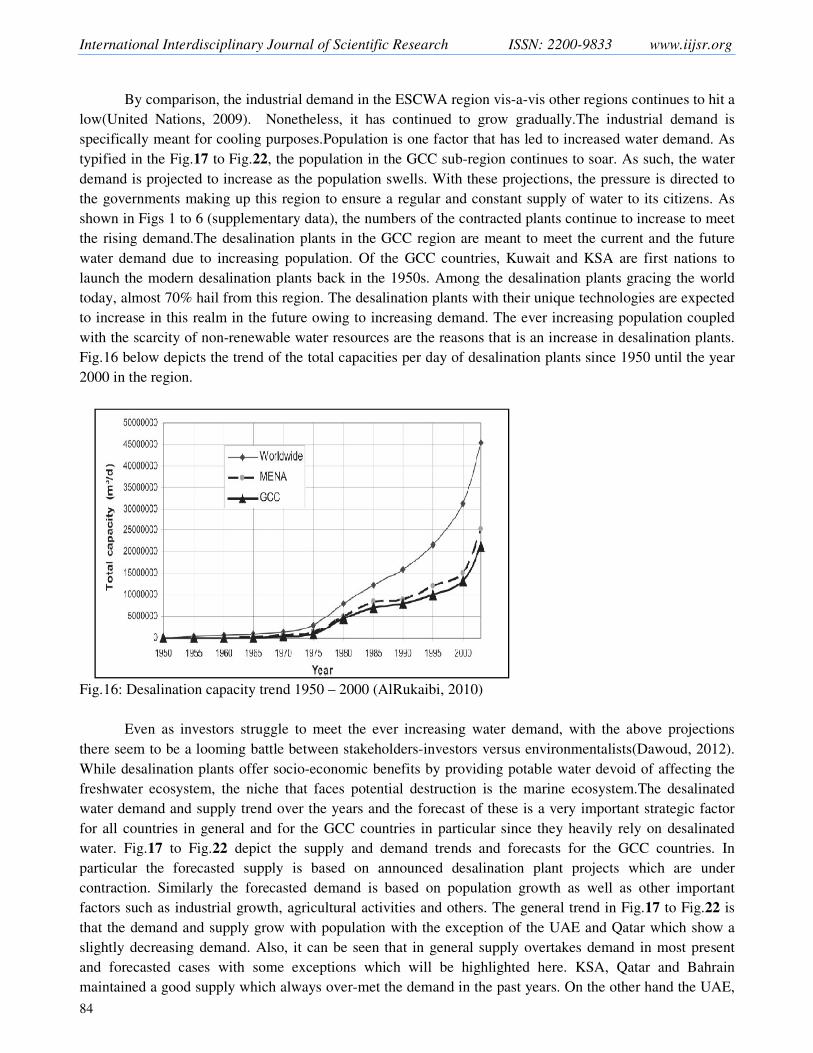
By comparison, the industrial demand in the ESCWA region vis-a-vis other regions continues to hit a
low(United Nations, 2009). Nonetheless, it has continued to grow gradually.The industrial demand is
specifically meant for cooling purposes.Population is one factor that has led to increased water demand. As
typified in the Fig.17 to Fig.22, the population in the GCC sub-region continues to soar. As such, the water
demand is projected to increase as the population swells. With these projections, the pressure is directed to
the governments making up this region to ensure a regular and constant supply of water to its citizens. As
shown in Figs 1 to 6 (supplementary data), the numbers of the contracted plants continue to increase to meet
the rising demand.The desalination plants in the GCC region are meant to meet the current and the future
water demand due to increasing population. Of the GCC countries, Kuwait and KSA are first nations to
launch the modern desalination plants back in the 1950s. Among the desalination plants gracing the world
today, almost 70% hail from this region. The desalination plants with their unique technologies are expected
to increase in this realm in the future owing to increasing demand. The ever increasing population coupled
with the scarcity of non-renewable water resources are the reasons that is an increase in desalination plants.
Fig.16 below depicts the trend of the total capacities per day of desalination plants since 1950 until the year
2000 in the region.
Fig.16: Desalination capacity trend 1950 – 2000 (AlRukaibi, 2010)
Even as investors struggle to meet the ever increasing water demand, with the above projections
there seem to be a looming battle between stakeholders-investors versus environmentalists(Dawoud, 2012).
While desalination plants offer socio-economic benefits by providing potable water devoid of affecting the
freshwater ecosystem, the niche that faces potential destruction is the marine ecosystem.The desalinated
water demand and supply trend over the years and the forecast of these is a very important strategic factor
for all countries in general and for the GCC countries in particular since they heavily rely on desalinated
water. Fig.17 to Fig.22 depict the supply and demand trends and forecasts for the GCC countries. In
particular the forecasted supply is based on announced desalination plant projects which are under
contraction. Similarly the forecasted demand is based on population growth as well as other important
factors such as industrial growth, agricultural activities and others. The general trend in Fig.17 to Fig.22 is
that the demand and supply grow with population with the exception of the UAE and Qatar which show a
slightly decreasing demand. Also, it can be seen that in general supply overtakes demand in most present
and forecasted cases with some exceptions which will be highlighted here. KSA, Qatar and Bahrain
maintained a good supply which always over-met the demand in the past years. On the other hand the UAE,
International Interdisciplinary Journal of Scientific Research Vol. 1 No. 2 November, 2014
85
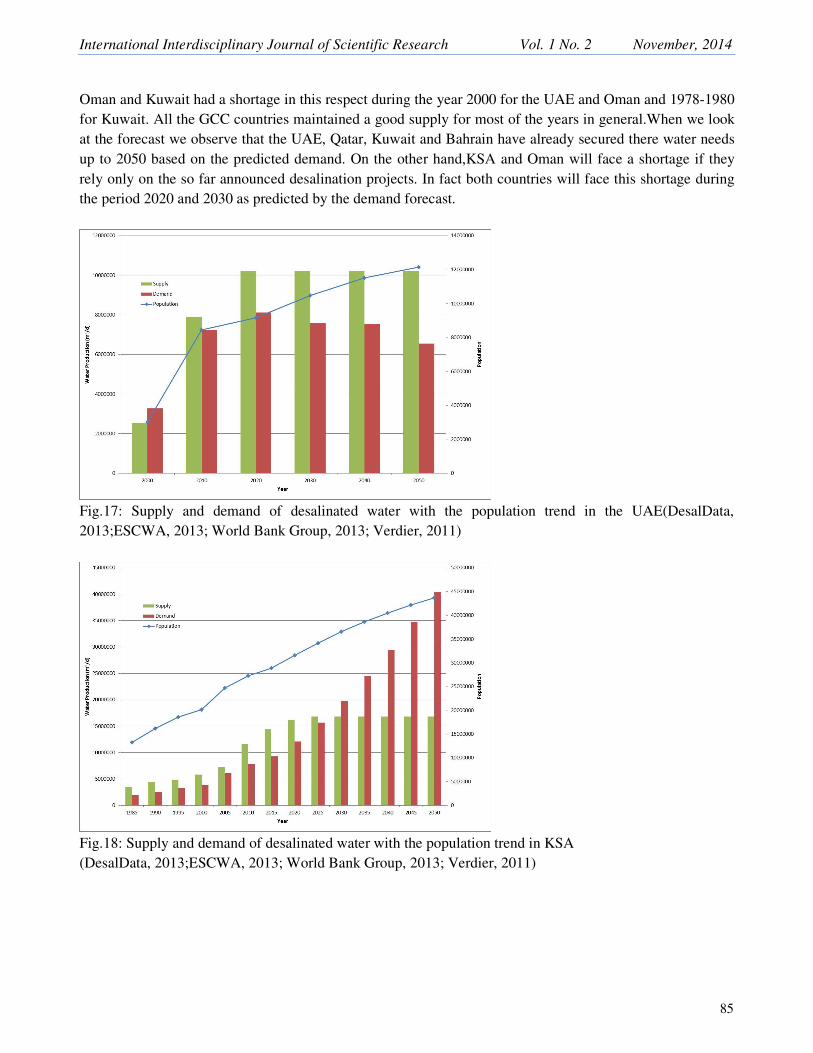
Oman and Kuwait had a shortage in this respect during the year 2000 for the UAE and Oman and 1978-1980
for Kuwait. All the GCC countries maintained a good supply for most of the years in general.When we look
at the forecast we observe that the UAE, Qatar, Kuwait and Bahrain have already secured there water needs
up to 2050 based on the predicted demand. On the other hand,KSA and Oman will face a shortage if they
rely only on the so far announced desalination projects. In fact both countries will face this shortage during
the period 2020 and 2030 as predicted by the demand forecast.
Fig.17: Supply and demand of desalinated water with the population trend in the UAE(DesalData,
2013;ESCWA, 2013; World Bank Group, 2013; Verdier, 2011)
Fig.18: Supply and demand of desalinated water with the population trend in KSA
(DesalData, 2013;ESCWA, 2013; World Bank Group, 2013; Verdier, 2011)
International Interdisciplinary Journal of Scientific Research ISSN: 2200-9833 www.iijsr.org
86
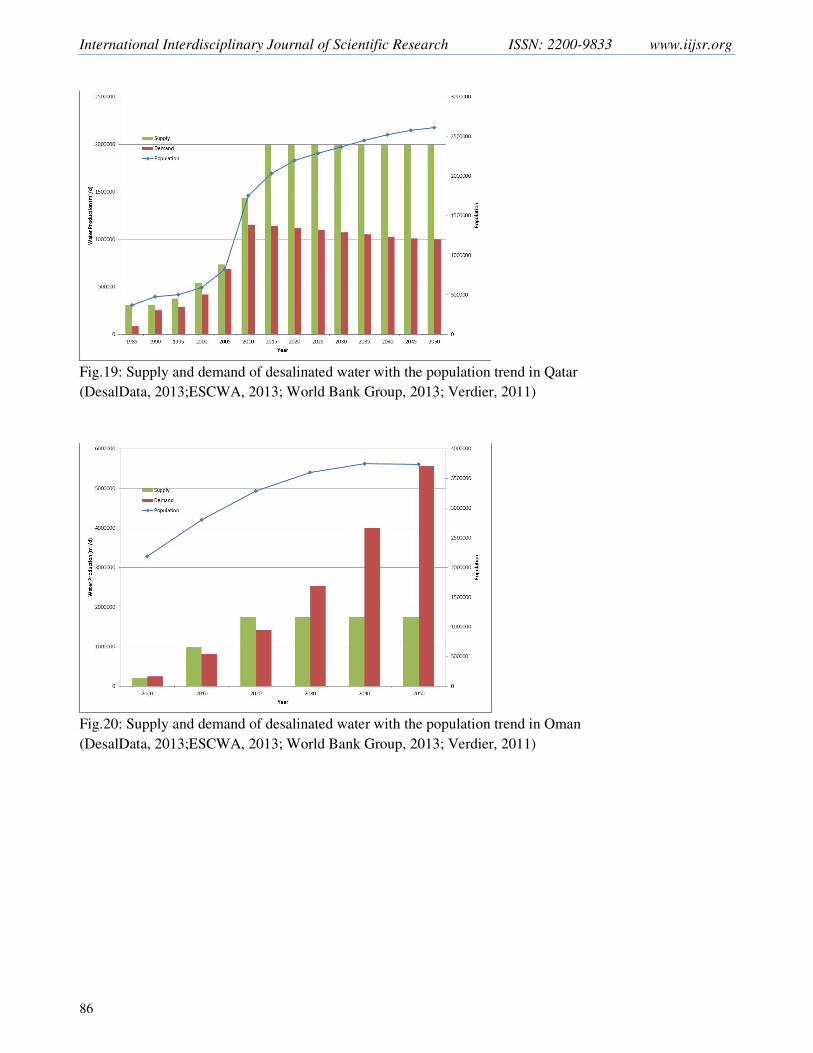
Fig.19: Supply and demand of desalinated water with the population trend in Qatar
(DesalData, 2013;ESCWA, 2013; World Bank Group, 2013; Verdier, 2011)
Fig.20: Supply and demand of desalinated water with the population trend in Oman
(DesalData, 2013;ESCWA, 2013; World Bank Group, 2013; Verdier, 2011)

International Interdisciplinary Journal of Scientific Research Vol. 1 No. 2 November, 2014
87
Fig.21: Supply and demand of desalinated water with the population trend in Kuwait (DesalData,
2013;ESCWA, 2013; World Bank Group, 2013; Verdier, 2011)
Fig.22: Supply and demand of desalinated water with the population trend in Bahrain (DesalData,
2013;ESCWA, 2013; World Bank Group, 2013; Verdier, 2011)
4. Technologies implemented in the GCC countries
Reverse Osmosis, a membrane technology, has dominated the world desalination industry over the past three
decades as manifested inFig.23. Nonetheless, in the ESCWA region, and more so in the GCC economies,
thermal technologies are dominant. This is exhibited in the Fig.23 below (Sommariva, 2010).

International Interdisciplinary Journal of Scientific Research ISSN: 2200-9833 www.iijsr.org
88
Fig.23: Global and ESCWA desalination capacity by process (Sommariva, 2010)
Thermal technologies are a common place in the GCC region owing to the fact that many of the
firms in this region optimize on the fuel to co-generate both water and electricity. However, in the regions
where electricity is available and the feed water is brackish, membrane technology comes in handy. Ideally,
contemporary commercial technologies in place today can be classed as either thermal or membrane
technologies. The thermal technologies include MSF, MED and VC (Vapor Compression). On the other
hand, the membrane technologies include SWRO (Seawater Reverse Osmosis), BWRO (Brackish Water
Reverse Osmosis), ED (Electro-dialysis) and NF (Nano-Filtration). The membrane technology to be adopted
is dependent on the degree of salinity in the brackish water. While ED is more efficient for low salinity
brackish water, RO is more efficient for higher salt concentration feed-water. In the MENA region, the MSF
technology is the dominant technology.Fig.24shows proportions of a diversity of technologies applied in this
region but cumulatively since the year 1965. However, over the years, RO has been slowly gaining
dominance.
Fig.24: Global contracted capacity by technology in 2010(Global Water Intelligence, 2010)
RO is slowly gaining dominance owing to the fact that it is cost-efficient, and of late, there has been
an improvement in the membrane technology to enhance its efficiency. Contemporary applications adopt
hybrid technologies which combine both thermal and membrane technologies to achieve efficiency, low-cost
operations and to co-generate electricity. Some of the hybrid combinations include MED/RO and MSF/RO.
Other,
9%
RO, 28%
MSF, 54%
MED,
9%
ESCWA
ED, 3%
Other,
11% MED, 8%
MSF, 25%
RO, 53%
Global
International Interdisciplinary Journal of Scientific Research Vol. 1 No. 2 November, 2014
89
In the meantime, there is a pilot project to determine the competitiveness of NF/MSF/MED/RO combination
which is set to revolutionize the desalination technology. The world over, there are a number of novel
desalination technologies that are slowly being developed. These technologies include “membrane
distillation, carbon nanotube membranes, aquaporin (biomimetic) membrane, forward osmosis, and electro-
dialysis/deionization”. Nonetheless, skeptics doubt whether these technologies would have a significant
effect in the desalination industry.
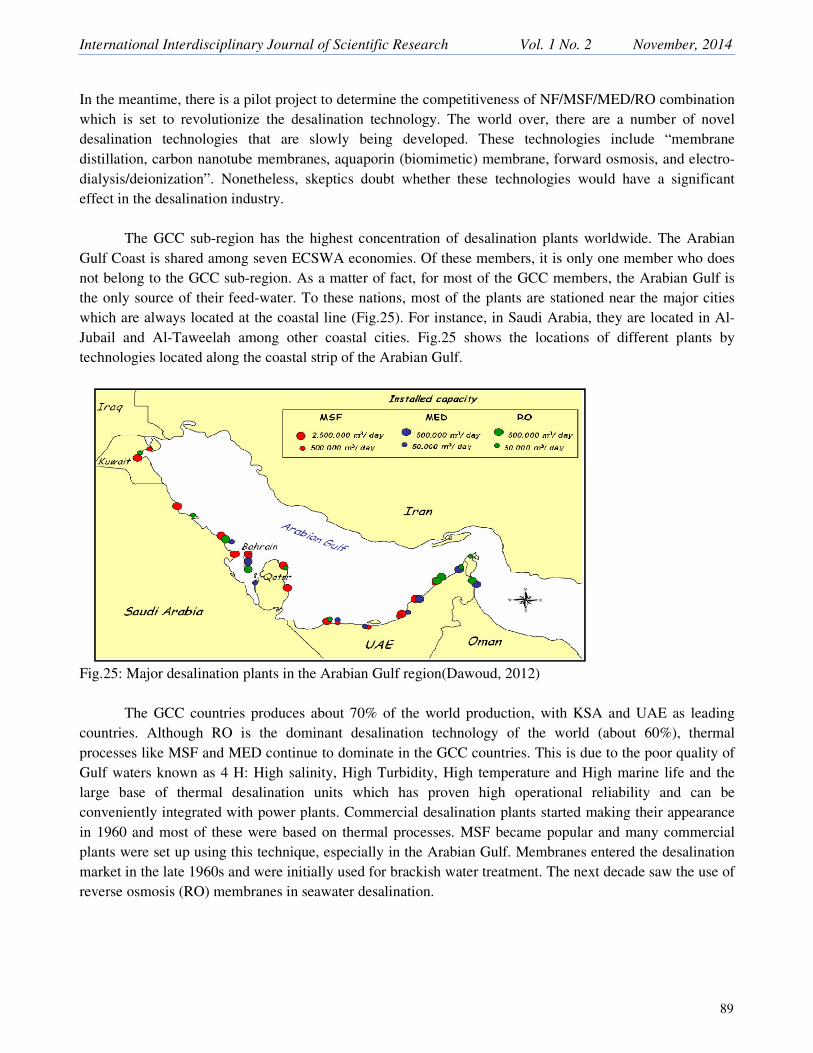
The GCC sub-region has the highest concentration of desalination plants worldwide. The Arabian
Gulf Coast is shared among seven ECSWA economies. Of these members, it is only one member who does
not belong to the GCC sub-region. As a matter of fact, for most of the GCC members, the Arabian Gulf is
the only source of their feed-water. To these nations, most of the plants are stationed near the major cities
which are always located at the coastal line (Fig.25). For instance, in Saudi Arabia, they are located in Al-
Jubail and Al-Taweelah among other coastal cities. Fig.25 shows the locations of different plants by
technologies located along the coastal strip of the Arabian Gulf.
Fig.25: Major desalination plants in the Arabian Gulf region(Dawoud, 2012)
The GCC countries produces about 70% of the world production, with KSA and UAE as leading
countries. Although RO is the dominant desalination technology of the world (about 60%), thermal
processes like MSF and MED continue to dominate in the GCC countries. This is due to the poor quality of
Gulf waters known as 4 H: High salinity, High Turbidity, High temperature and High marine life and the
large base of thermal desalination units which has proven high operational reliability and can be
conveniently integrated with power plants. Commercial desalination plants started making their appearance
in 1960 and most of these were based on thermal processes. MSF became popular and many commercial
plants were set up using this technique, especially in the Arabian Gulf. Membranes entered the desalination
market in the late 1960s and were initially used for brackish water treatment. The next decade saw the use of
reverse osmosis (RO) membranes in seawater desalination.

International Interdisciplinary Journal of Scientific Research ISSN: 2200-9833 www.iijsr.org
90
Fig.26: Desalination capacity by technology in the GCC countries (DesalData, 2013)
The charts in Fig.27 show that thermal technologies are the leading conventional technology in UAE,
Kuwait and Qatar. However, in the last few years, RO shows a significant increase in KSA and Oman (as the
waters of the Red sea and Indian Ocean are more suitable as feed water to RO than the Gulf sea water due to
low salinity and clarity).
Fig.27: Desalination capacity by technology (DesalData, 2013)
5. Cost of desalination
Desalination industry is a capital intensive project that requires optimization of factors to limit on the cost of
the product. Those technologies with lower operation cost (OPEX) options always tend to be responsive to
both the operating skills and the quality of the raw material (feed water). The CAPEX is a function of the
quality of the raw material, “production capacity, required infrastructure, plant efficiency, material selection
and other location factors”(Dawoud et al., 2006). For majority plants, the CAPEX always ranges between
$1000 and $2000 per cubic meters. Both the CAPEX and OPEX are vital in determining the final cost of
water. Also, as typified in the Fig.28 below, the unit cost is dependent on the technology which is
proportional to the cost of oil.
MSF, 59%MED,
12%
RO, 29%
GCC

International Interdisciplinary Journal of Scientific Research Vol. 1 No. 2 November, 2014
91
Fig.28: The energy cost of desalination in relation to the cost of oil(Dawoud et al., 2006)
Also, as typified in Fig.29, OPEX is a function of the technology. To this end, the RO technology
attracts the least operation cost.
Fig.29: Relative operating costs of desalination processes in cogeneration plants
(Global Water Intelligence, 2010)
As outlined above, cost management is very sensitive in determining the final cost of the product. A
“different policy discourse can have a massive effect on the unit cost”(Global Water Intelligence, 2010). For
instance, government agencies need to shift focus to being purchasers of the product (water) rather than
procurers of plants. This will enhance the establishment of most efficient technologies. Furthermore, this
would shift the government roles from being an operator to a regulator.
Since MSF is an energy-intensive process, integrating it with power generation helps to reduce the
cost. RO processes have also been integrated with MSF/power cogeneration systems. When RO and MSF
are in parallel operation, capital savings result from the use of common intake–outfall facilities. This kind of
a plant is in operation at Fujairah, UAE and is one of the largest desalination plants in the world. It has a

International Interdisciplinary Journal of Scientific Research ISSN: 2200-9833 www.iijsr.org
92
production capacity of 500MW of electricity and 54,200m3/d of water. A solar–MED plant built in Umm Al
Nar, Abu Dhabi has a desalination capacity of 120m3/d. The Layyah plant in Sharjah integrates RO with
MSF and MED thermal systems. Using nuclear power for desalination is a challenging option to reduce the
cost of desalinated water for GCC countries. Wind or solar energy could be used to power the desalination
plants but these sources are subject to variable intensities while desalination processes are designed for
continuous operation. To reduce environmental impacts and enhance sustainability, there is ongoing research
to integrate membrane processes like RO, NF with crystallization methods to achieve zero liquid discharge.
Table 2: Desalination costs and revenue(Akber, Kuwait Institute for Scientific Research Water Resources
Center)
Country Cost (US$/m3)
Bahrain 0.65
Kuwait 1.98
Oman 1.34
Qatar 1.31
KSA 1.35
UAE 1.16
6. Policy initiatives for Abu Dhabi Vision 2030
In order for Abu Dhabi to realize Vision 2030 of establishing a sustainable economy, then availability of
water, a sector vital to its economy need to be effectively managed. Since the dominant technology in this
region is thermal-related, there is need to limit on the over-reliance on fossil fuel (a non-renewable energy).
This can be minimized through recycling of wastewater. The product (water) can be useful for both
agriculture and landscaping. Also, this vision can be realized when initiatives are in place to minimize losses
emanating from leakages and wasteful usage. Control of wasteful usage of water can be realized through
public awareness. Finally, the government ought to encourage potential investors to employ renewable
energy-based technologies in desalination plants, an environmentally sound technology(Dawoud et al.,
2006).The initiatives towards a more sustainable water economy in Abu Dhabi by 2030, can be summarized
under five categories:
6.1. Water demand reduction
To have a sustainable economy, demand management should be prioritized over supply enhancement
strategies to be able to balance between the current/futuristic increase in the demand of water and the limited
resources for supply. Managing the demand is not only influenced by the behavior of consumers, but
technical efficiency also affects the input/output ratio of the system. Some recommended policies to
decrease the water demand are:
1. Creating a holistic water management strategy through Integrated Water Resource Management
(IWRM) approach. This could be developed by research and building national master water plans to
assess the current state of water, identify its inefficiencies, optimize through initiatives and adopting
new policies that should be then circulated among organizations for implementation. Singapore is an
exemplary example of a country that developed a successful IWRM system(Onn, 2005). Singapore
have figured out their main five challenges and faced them; they have protected their water resources
through turning half of its limited land area into water catchments, reclaimed water called

International Interdisciplinary Journal of Scientific Research Vol. 1 No. 2 November, 2014
93
“NEWater” became a source of safe drinking water in a cost effect manner, they also minimized
wastage in water supply system by implementing leakage control and accurate metering policy, a
community driven program called Water Efficient Homes was implemented to conserve water by
fitting water saving devices into taps, and finally closing the water loop through their NEWater
initiative.
2. Increasing public awareness through campaigns that are led by relevant governmental authorities.
3. Variation of water tariffs depending on the level of consumption can influence the demand. The
implementation should start on industries and agriculture, as they will respond swiftly to small price
changes due to them being the highest consumers in UAE. Bahrain is one of the GCC countries that
already executed this policy where the tariff increases when the consumption is more than 450
m3/day.
4. Technical efficiency improvement through installation of accurate meters for water, replacement of
old piping to avoid leakages, and encouragement to use new efficient technologies through
regulations or incentives(Saif, 2012).
5. Efficient water consumption in the agricultural sector is vital due to the arid climate of the UAE.
Therefore, planting crops with the least water demand is favorable method to reduce irrigation,
banning irrigation during the afternoon period due to the high evaporation rate, and adopting new
technologies that would serve longer water retention in soil.
6.2. Energy supply from clean/renewable energy sources
As Abu-Dhabi vision 2030 includes the goal of diversifying the sources of energy instead of the domination
of fossil fuels and natural gas, the leadership of Abu-Dhabi has committed to secure 7% of its total energy
needs from renewable sources by 2020. Due to the importance of the desalination industry in the region,
renewable energy can be integrated into the desalination plants energy supply system. But such transition
requires a renewable energy road map at the emirate and national based level. Additionally, there will be the
need to decouple the water and energy production, as co-generation plants are the main method used
nowadays. There will also be a need for many policy changes to create this transition because the current
prices of fossil fuels are cheaper than some renewable energy sources (ex. solar and wind energy), such
polices could be: 1) phasing out fossil fuel subsidies, 2) promotion of small and medium scale developments
(ex. rooftop PV panels), and 3) tax incentives to businesses and rebate program for consumers. However,
nuclear might have a high chance of dominating the industry in the future (Saif, 2012).
6.3. Water supply augmentation
Enhancing the water supply system sustainably is very essential for the country to be able to meet the future
demand of the exponentially increasing population. This could be achieved through the following policies:
1. Increasing the rate of reclaimed water utilization through treating the wastewater at high levels
depending on the intended end-use of the treated water. The country can start with using reclaimed
water for irrigation, landscape decorations (ex. fountains), and gradually improve the level of
treatments to be used domestically. Singapore produced the first drinkable reclaimed water in 2010
after their research since 1974. From advanced dual membrane to ultraviolet technologies are used to
produce NEWater and it is projected to meet 50% of Singapore’s future water demand in 2060.
2. Increasing desalination capacity comes as an option after demand management and reclaimed
measures exhaustion. Additionally, relevant authorities should set rules mandated to regularly refer
International Interdisciplinary Journal of Scientific Research ISSN: 2200-9833 www.iijsr.org
94
to their country’s IWRM strategy before asking for tenders on any new desalination project (Saif,
2012).
3. Increasing system capacity by reservoir investments and conservation on existing groundwater. Abu-
Dhabi is currently implementing the aquifer storage and recharge (ASR) technology; EAD in
collaboration with ADEWA have conducted a feasibility study in 2002 and started a pilot study in
2003 on Artificial Recharge for Aquifer Storage and Recovery to save the surplus desalinated water
production for future water needs in case of high seasonal demands and emergencies(Dawoud,
2012). The completion of this project in 2014 will also increase the storage water capacity from 2
days in the time being to 90 days continuous supply to Abu-Dhabi’s population.
6.4. Increase environmental management
All of the previous points mentioned above decreases the environmental impacts of desalination whether
directly or indirectly. However, there are certain mechanisms, specifically related to desalination process,
that directly influences the environment and setting mitigation measures can hugely reduce the impacts.
1. After selecting the site of the desalination plant, the most suitable intake pipes should be chosen to
reduce impingement and entrainment level of marine organisms at intake pipes. This could be
accomplished through installation of subsurface intake pipes such as vertical wells, horizontal
collector wells, slant wells and engineered infiltration gallery (Reynolds and Maley, 2008). On the
other hand, open water intake could be utilized with velocity caps to reduce impingement and
travelling water screens to reduce entrainment when coupled with velocity caps (Reynolds and
Maley, 2008).
2. Saving the seawater’s ecosystem through controlling the brine discharge by desalination plants. In
the current situation, the country may implement a better way of discharging which is brine dilution
and dispersion through discharge diffuser away from the coast to reduce the thermal pollution. A
regulation should be enforced for the brine temperature to be maximum 3 degrees higher than the
intake water.
3. Setting a regulating for the concentration of greenhouse gases produced, which is hugely dependent
on the source of energy used.
6.5. Institutional
Enhancing the opportunities for research and development by integrating research into private sector jobs as
well and governmental. Declaring the need for more research in the areas of new desalination technologies,
membranes, hybrid systems there is a need for water demand management and it should become a driving
force in all the GCC countries. The GCC countries are the world’s leaders in desalination technology but
they should also thrive to be the leaders in demand management too. There should be policy initiatives based
on ingenuity and creativity to curb the ever rising demand for water, creating site-specific studies for
choosing the water intake pipes, and encouraging and supporting the population to work on that (Saif, 2012).
7. Conclusions
The GCC countries are the world’s leaders in desalination technology but they should also thrive to be the
leaders in demand management too. With the rapid increase in population and standard of living, the
demands for water is rising at an alarming rate. If this demand is not controlled, it might lead to a substantial
investment to augment the desalination capacity. There is an urgent need to implement a new set of
legislation targeting the rationalization of water use, and increase the level of public awareness of water
International Interdisciplinary Journal of Scientific Research Vol. 1 No. 2 November, 2014
95
scarcity and the need for the downscaling water demand to yield positive results. Installation of water-saving
equipment within residential homes, public utility buildings, and commercial centers, introduction of drip
irrigation and sprinklers for irrigation of private and public gardens, and limiting the timings of irrigation
should save a large volume of water. Implementation of measures to protect the available water resources
from environmental degradation both from natural and man-made causes and overuse will maximize the
utility of the available water resources. With very vulnerable groundwater resources and delicate marine
environment, the GCC countries should adopt a friendly-ecosystem approach in integrated water resources
management. Groundwater should be adequately protected by using the best of practices, examples and
experiences. Environmental education should be given due prominence in school curricula.
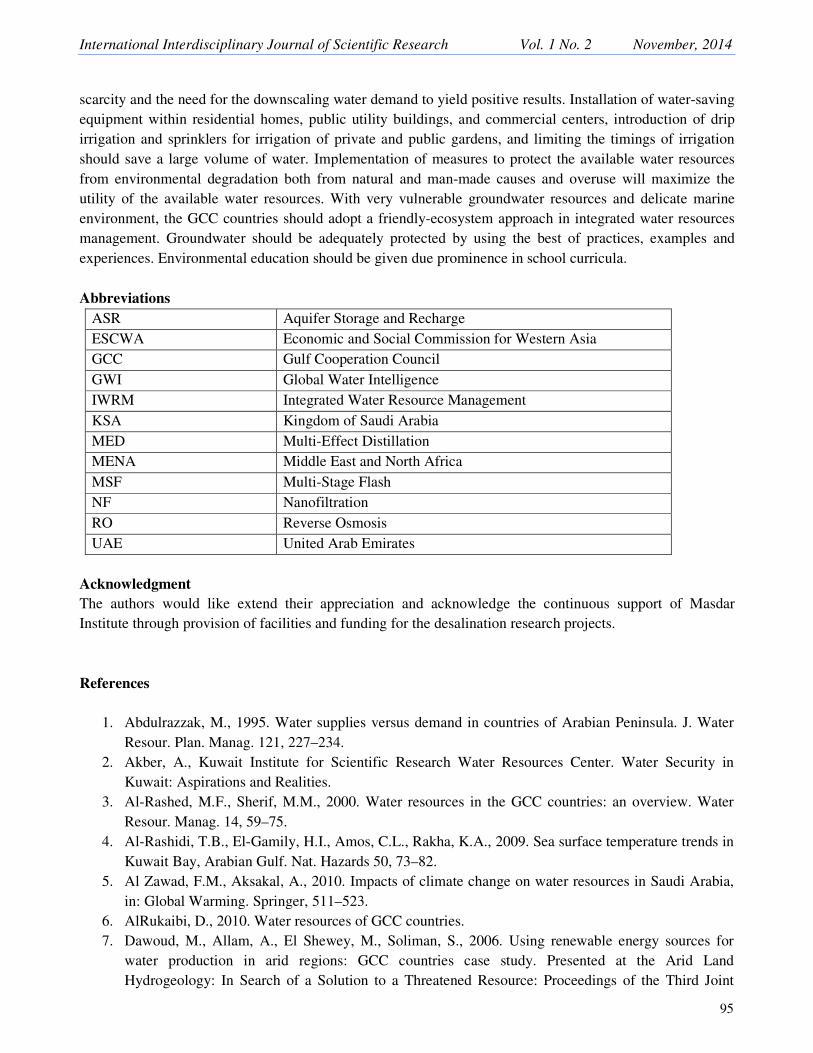
Abbreviations
ASR Aquifer Storage and Recharge
ESCWA Economic and Social Commission for Western Asia
GCC Gulf Cooperation Council
GWI Global Water Intelligence
IWRM Integrated Water Resource Management
KSA Kingdom of Saudi Arabia
MED Multi-Effect Distillation
MENA Middle East and North Africa
MSF Multi-Stage Flash
NF Nanofiltration
RO Reverse Osmosis
UAE United Arab Emirates
Acknowledgment
The authors would like extend their appreciation and acknowledge the continuous support of Masdar
Institute through provision of facilities and funding for the desalination research projects.
References
1. Abdulrazzak, M., 1995. Water supplies versus demand in countries of Arabian Peninsula. J. Water
Resour. Plan. Manag. 121, 227–234.
2. Akber, A., Kuwait Institute for Scientific Research Water Resources Center. Water Security in
Kuwait: Aspirations and Realities.
3. Al-Rashed, M.F., Sherif, M.M., 2000. Water resources in the GCC countries: an overview. Water
Resour. Manag. 14, 59–75.
4. Al-Rashidi, T.B., El-Gamily, H.I., Amos, C.L., Rakha, K.A., 2009. Sea surface temperature trends in
Kuwait Bay, Arabian Gulf. Nat. Hazards 50, 73–82.
5. Al Zawad, F.M., Aksakal, A., 2010. Impacts of climate change on water resources in Saudi Arabia,
in: Global Warming. Springer, 511–523.
6. AlRukaibi, D., 2010. Water resources of GCC countries.
7. Dawoud, M., Allam, A., El Shewey, M., Soliman, S., 2006. Using renewable energy sources for
water production in arid regions: GCC countries case study. Presented at the Arid Land
Hydrogeology: In Search of a Solution to a Threatened Resource: Proceedings of the Third Joint

International Interdisciplinary Journal of Scientific Research ISSN: 2200-9833 www.iijsr.org
96
UAE-Japan Symposium on Sustainable GCC Environment and Water Resources (EWR2006), 28-30
January 2006, Abu Dhabi, UAE (Volume IV in DARE series), CRC Press, p. 117.
8. Dawoud, M.A., 2012. Environmental impacts of seawater desalination: Arabian Gulf case study. Int.
J. Environ. Sustain. IJES 1.
9. DesalData [WWW Document], 2013. URL http://desaldata.com/ (accessed 6.14.13).
10. ESCWA [WWW Document], 2013. URL http://www.escwa.un.org/ (accessed 6.14.13).
11. Global Water Intelligence, 2010. Water Market Middle East 2010. Media Analytics Ltd (6.3.09).
12. Hanbury, W., 2010. Personal communication with William Hanbury, Acwa-Power Chair of Water
and Power Research, King Saud University.
13. Hoepner, T., Lattemann, S., 2003. Chemical impacts from seawater desalination plants—a case study
of the northern Red Sea. Desalination 152, 133–140.
14. Mezher, T., Fath, H., Abbas, Z., Khaled, A., 2011. Techno-economic assessment and environmental
impacts of desalination technologies. Desalination 266, 263–273.
15. Onn, L.P., 2005. Water management issues in Singapore. Water Mainl. Southeast Asia 29.
16. Reynolds, T., Maley, M., 2008. Desalination intake approaches: open ocean intake vs. subsurface.
Reg. Seawater Desalination Program Website.
17. Saif, O., 2012. The future outlook of desalination in the Gulf.
18. Sommariva, C., 2010. Efficiency improvements in power desalination for better environmental
impact.
19. United Nations, 2009. ESCWA water development: Role of desalination in addressing water scarcity
(No. 3). United Nations Publication.
20. Verdier, F., 2011. MENA regional water outlook: Desalination using renewable energy (No. 2).
21. World Bank Group [WWW Document], 2013. World Bank Group. URL http://www.worldbank.org/
(accessed 6.14.13).