
A Response Spectrum Analysis of Wind Deflection in Railway ...
12
Delft University of Technology A Response Spectrum Analysis of Wind Deflection in Railway Overhead Contact Lines Using Pseudo-Excitation Method Song, Yang; Zhang, Mingjie; Wang, Hongrui DOI 10.1109/TVT.2021.3054459 Publication date 2021 Document Version Final published version Published in IEEE Transactions on Vehicular Technology Citation (APA) Song, Y., Zhang, M., & Wang, H. (2021). A Response Spectrum Analysis of Wind Deflection in Railway Overhead Contact Lines Using Pseudo-Excitation Method. IEEE Transactions on Vehicular Technology, 70(2), 1169 - 1178. [9340013]. https://doi.org/10.1109/TVT.2021.3054459 Important note To cite this publication, please use the final published version (if applicable). Please check the document version above. Copyright Other than for strictly personal use, it is not permitted to download, forward or distribute the text or part of it, without the consent of the author(s) and/or copyright holder(s), unless the work is under an open content license such as Creative Commons. Takedown policy Please contact us and provide details if you believe this document breaches copyrights. We will remove access to the work immediately and investigate your claim. This work is downloaded from Delft University of Technology. For technical reasons the number of authors shown on this cover page is limited to a maximum of 10.
Transcript of A Response Spectrum Analysis of Wind Deflection in Railway ...
Delft University of Technology
A Response Spectrum Analysis of Wind Deflection in Railway Overhead Contact LinesUsing Pseudo-Excitation Method
Song, Yang; Zhang, Mingjie; Wang, Hongrui
DOI10.1109/TVT.2021.3054459Publication date2021Document VersionFinal published versionPublished inIEEE Transactions on Vehicular Technology
Citation (APA)Song, Y., Zhang, M., & Wang, H. (2021). A Response Spectrum Analysis of Wind Deflection in RailwayOverhead Contact Lines Using Pseudo-Excitation Method. IEEE Transactions on Vehicular Technology,70(2), 1169 - 1178. [9340013]. https://doi.org/10.1109/TVT.2021.3054459
Important noteTo cite this publication, please use the final published version (if applicable).Please check the document version above.
CopyrightOther than for strictly personal use, it is not permitted to download, forward or distribute the text or part of it, without the consentof the author(s) and/or copyright holder(s), unless the work is under an open content license such as Creative Commons.
Takedown policyPlease contact us and provide details if you believe this document breaches copyrights.We will remove access to the work immediately and investigate your claim.
This work is downloaded from Delft University of Technology.For technical reasons the number of authors shown on this cover page is limited to a maximum of 10.

Green Open Access added to TU Delft Institutional Repository
'You share, we take care!' - Taverne project
https://www.openaccess.nl/en/you-share-we-take-care
Otherwise as indicated in the copyright section: the publisher is the copyright holder of this work and the author uses the Dutch legislation to make this work public.
IEEE TRANSACTIONS ON VEHICULAR TECHNOLOGY, VOL. 70, NO. 2, FEBRUARY 2021 1169
A Response Spectrum Analysis of Wind Deflection inRailway Overhead Contact Lines Using
Pseudo-Excitation MethodYang Song , Member, IEEE, Mingjie Zhang, and Hongrui Wang , Member, IEEE
Abstract—The wind deflection of overhead contact lines (OCLs)challenges the stable and safe operation of electrified railways. Thesteady wind causes the static deflection of the contact line, while thefluctuating wind leads to the OCL buffeting. This paper performsa response spectrum analysis of the wind deflection caused bythe combined effects of steady and fluctuating winds. Consideringthe initial configuration of OCL, an absolute nodal coordinateformulation method is employed to model the OCL. A spatialwind field including the fluctuating wind in three directions isconstructed and the aerodynamic forces on the OCL are derived. Anonlinear solution procedure is proposed to include the geometricalnonlinearity and dropper slackness in the evaluation of static winddeflection. The pseudo-excitation method is utilised to evaluatethe buffeting response of the OCL with stochastic wind load. Theanalysis results indicate that the dropper slackness has a significanteffect on the vertical static deflection. Under an extreme wind speedof 40 m/s, the contact line is always within the safe working rangeof pantograph head when only the steady wind load is considered.However, the stochastic wind load causes non-negligible fluctuationof OCL, and the contact line may be outside of the pantographworking range under the same wind speed. Sensitivity analyses onthe effects of some key parameters to the OCL buffeting suggestthat the increases of damping ratio and the tension class are effec-tive measures to improve the wind-resistance capability of OCL.
Index Terms—Electrified railway, overhead contact line,pantograph working length, wind deflection, pseudo-excitationmethod, buffeting.
I. INTRODUCTION
OVERHEAD Contact Line (OCL) constructed along theelectrified railway is the only source of power for the
electric train. The electric current is normally collected by thelocomotive via a pantograph installed on the carbody roof. Asshown in Fig. 1, an OCL is comprised of several tensioned cablesincluding the messenger line, contact line and droppers. Due toits long span and large flexibility, the OCL is very sensitive to the
Manuscript received November 15, 2020; revised December 28, 2020; ac-cepted January 20, 2021. Date of publication January 28, 2021; date of currentversion March 10, 2021. This work was supported in part by the NationalNatural Science Foundation of China under Grant U1734202 and in part bythe Funding of Chengdu Guojia Electrical Engineering Co. Ltd under GrantsNEEC-2018-A02, NEEC-2019-B09. The review of this article was coordinatedby Dr. Z. Liu. (Corresponding author: Mingjie Zhang.)
Yang Song and Mingjie Zhang are with the Department of Structural Engi-neering, Norwegian University of Science and Technology, Trondheim 7491,Norway (e-mail: [email protected]; [email protected]).
Hongrui Wang is with the Section of Railway Engineering, Delft University ofTechnology, 2628CN Deft, The Netherlands (e-mail: [email protected]).
Digital Object Identifier 10.1109/TVT.2021.3054459
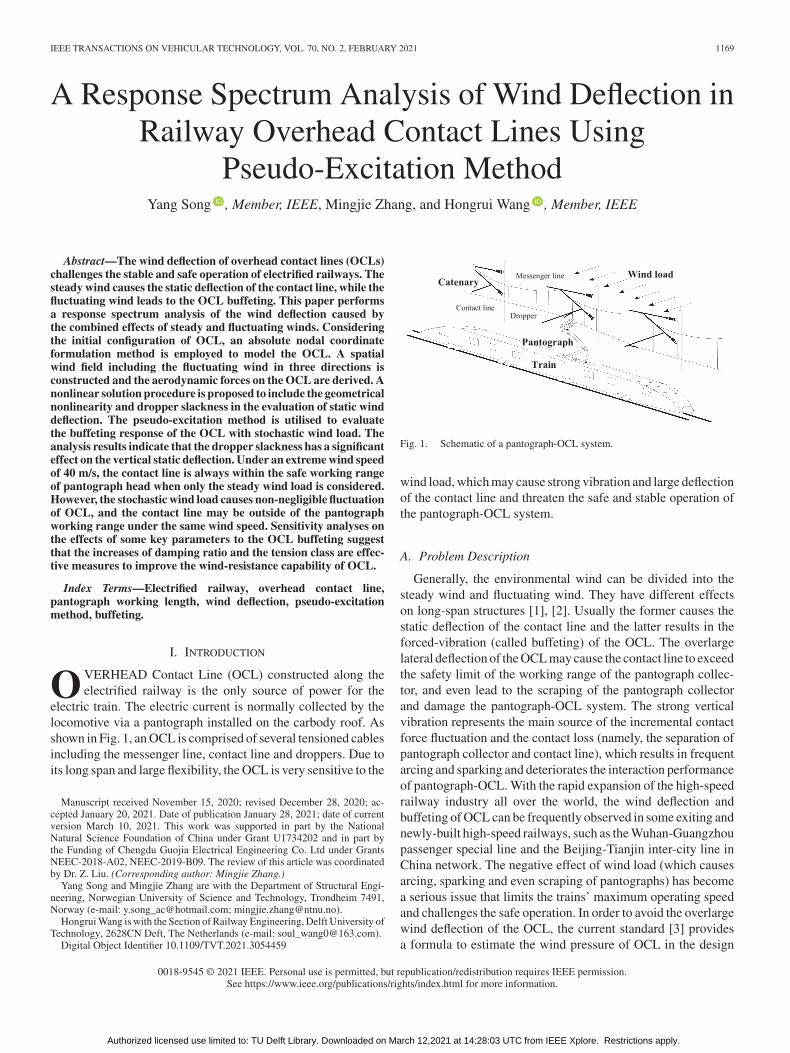
Fig. 1. Schematic of a pantograph-OCL system.
wind load, which may cause strong vibration and large deflectionof the contact line and threaten the safe and stable operation ofthe pantograph-OCL system.
A. Problem Description
Generally, the environmental wind can be divided into thesteady wind and fluctuating wind. They have different effectson long-span structures [1], [2]. Usually the former causes thestatic deflection of the contact line and the latter results in theforced-vibration (called buffeting) of the OCL. The overlargelateral deflection of the OCL may cause the contact line to exceedthe safety limit of the working range of the pantograph collec-tor, and even lead to the scraping of the pantograph collectorand damage the pantograph-OCL system. The strong verticalvibration represents the main source of the incremental contactforce fluctuation and the contact loss (namely, the separation ofpantograph collector and contact line), which results in frequentarcing and sparking and deteriorates the interaction performanceof pantograph-OCL. With the rapid expansion of the high-speedrailway industry all over the world, the wind deflection andbuffeting of OCL can be frequently observed in some exiting andnewly-built high-speed railways, such as the Wuhan-Guangzhoupassenger special line and the Beijing-Tianjin inter-city line inChina network. The negative effect of wind load (which causesarcing, sparking and even scraping of pantographs) has becomea serious issue that limits the trains’ maximum operating speedand challenges the safe operation. In order to avoid the overlargewind deflection of the OCL, the current standard [3] providesa formula to estimate the wind pressure of OCL in the design
0018-9545 © 2021 IEEE. Personal use is permitted, but republication/redistribution requires IEEE permission.See https://www.ieee.org/publications/rights/index.html for more information.
Authorized licensed use limited to: TU Delft Library. Downloaded on March 12,2021 at 14:28:03 UTC from IEEE Xplore. Restrictions apply.
1170 IEEE TRANSACTIONS ON VEHICULAR TECHNOLOGY, VOL. 70, NO. 2, FEBRUARY 2021
phase as follows:
qK =12GqGtρV
2R (1)
in which, Gq is the gust response factor. Gt is the terrain factortaking into account the protection of lines, e.g., in cuts, citiesor forest. ρ is the linear density. VR is the reference windvelocity at a height of 10 m above ground. It is obvious thatmost coefficients in this formula is selected by experience. Thedrag and lift coefficients which are essential to determine theaerodynamics of the conductor are not involved in the formula.The OCL normally has a certain lateral displacement (calledstagger) to reduce the wear on the pantograph strip. The complexstructure of the OCL is not considered in the evaluation of winddeflection in the standard. In addition, the empirical formuladoes not take the stochastic components of the wind into account,which definitely leads to overly conservative results. As shownin [4], the buffeting of OCL has a significant contribution to thewind deflection, which should not be neglected when evaluatingthe dynamic performance of OCL.
B. Literature Review
In most of the previous studies, a numerical model of OCLis usually used to check the acceptance of the design strategy[5]. In combination with the pantographs’ model, various nu-merical tools have been developed to evaluate the performanceof pantograph-OCL interaction system [6]. The contact forcebetween the contact line of the OCL and the registration stripof the pantograph is desired to be stable to ensure a goodcontact quality [7]. Inadequate contact forces may lead to thecontact loss and increase the occurrence of arcing, sparkingand contact loss [8], while excessive contact forces cause extrawear of the strip [9] and the contact line [10]. Apart fromthe contact force, the vibration of OCL is strictly regulated toavoid extra stress and interference with other infrastructures[11], which may cause the failure of OCL components [12].The accuracy of numerical simulations can be improved byupdating the model with field test data [13] and laboratory testdata [14]. The previous view of the academic community isthat the undesired performance is mainly caused by the unevendistribution of contact line elasticity when the train operates atthe conventional speed [15]. However, with the increase of trainspeed, the wave propagation in the OCL plays an ever-increasingrole in affecting the contact quality [16]. The best approach toimprove the wave propagation speed is to increase the tension inthe OCL. But this is normally restricted by the material limitation[17], [18]. In order to improve the wave propagation property,some parameter optimization methods for OCLs [19], [20] aredeveloped. Some common disturbances such as the locomotiveexcitations [21] and OCL anomalies [22], [23] are included inthe numerical model of OCL to evaluate its contact performancewith a pantograph under complex working conditions.
For the study of OCL wind deflection, while galloping may oc-cur under some extreme working conditions [24], [25], buffetingis the most common wind-induced vibration in daily operations.The Buffeting of OCL is analysed in [26]. The time-historiesof fluctuating wind velocity in the longitudinal, vertical and
lateral directions are generated using empirical spectrums. Thestochastic wind loads are exerted on the OCL to evaluate its winddeflection and the wind-induced effects on the pantograph-OCLinteraction through a time-domain simulation. However, thiswork generate a single sequence of the stochastic wind velocityto simulate the wind deflection, which fail to fully representthe stochastic nature of the wind loads. To fully characterize thebuffeting response of the OCL under stochastic winds, the MonteCarlos method can be utilised, which is however extremely time-consuming [27]. Meanwhile, the frequency-domain responsespectrum method is preferred in buffeting analysis due to itsimproved computational efficiency [28]. Among various re-sponse spectrum methods, the most popular one is the completequadratic combination (CQC) method [29]. But a significantshortfall of this method is the considerable computational cost.To cope with this issue, the Pseudo-Excitation Method (PEM) istherefore developed in [30] and has been widely used in variousindustrial backgrounds. This method is adopted in this paper toanalyse the OCL buffeting.
C. Contribution of This Paper
The main aim of this paper is to evaluate the wind deflectionof OCL caused by both of the steady and stochastic winds. Awell-recognised OCL model is constructed using a nonlinearfinite element method. A shape-finding method is utilised toaccurately describe the initial configuration of the OCL. Thewind deflection of the OCL is divided in two components. Oneis the static deflection caused by the steady wind, and the otheris the buffeting caused by the fluctuating wind. In this way, thewind deflections of the OCL caused by these two componentsare evaluated separately. The nonlinearity of the OCL is takeninto account to calculate the static deflection induced by thesteady wind load. The PEM-based response spectrum analysisis performed to evaluate the displacement standard deviation ofthe OCL due to the fluctuating wind. The effect of dampingratio and some key structural parameters on the wind deflectionis investigated based on a parametric sensitivity analysis.
D. Organisation
The introduction of the background and the literature review ispresented in Section I. The finite element formulations of OCLare described in Section II. The aerodynamic force model ofOCL is derived in Section III. The evaluation method of winddeflection is described in Section IV. The computational resultsare presented and analysed in Section V. The effects of somekey parameters on the buffeting response are analysed in VI.The conclusions are drawn in Section VII.
II. FINITE ELEMENT MODELLING OF OCL
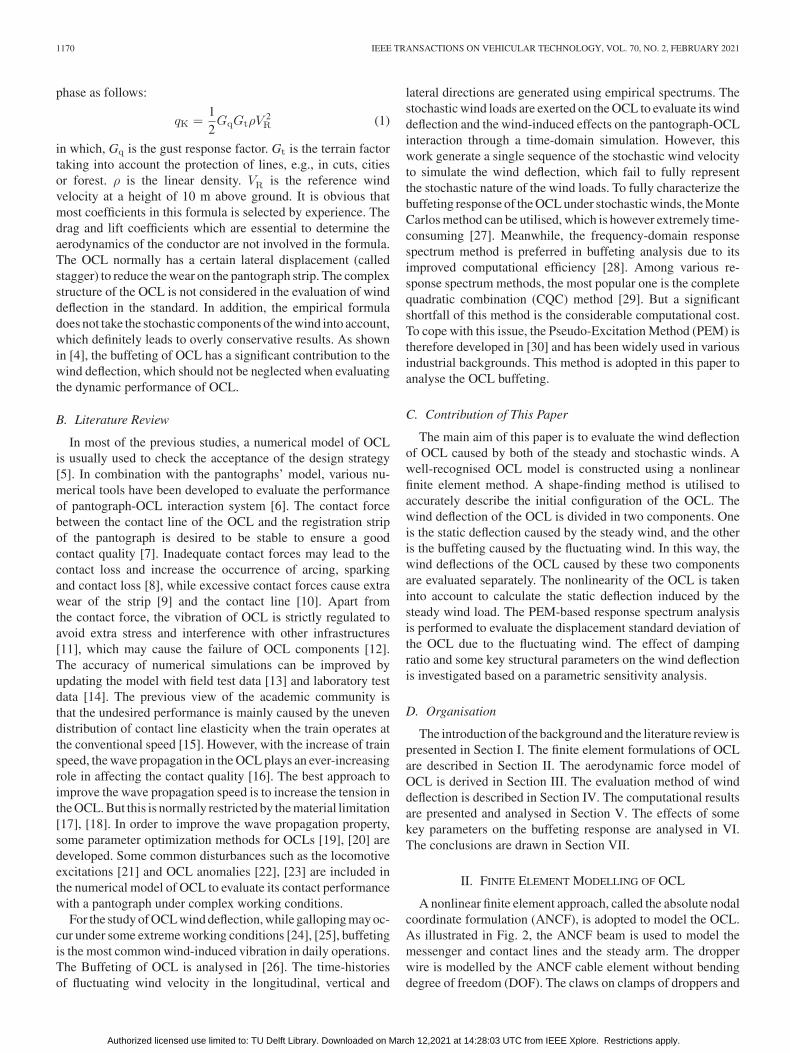
A nonlinear finite element approach, called the absolute nodalcoordinate formulation (ANCF), is adopted to model the OCL.As illustrated in Fig. 2, the ANCF beam is used to model themessenger and contact lines and the steady arm. The dropperwire is modelled by the ANCF cable element without bendingdegree of freedom (DOF). The claws on clamps of droppers and
Authorized licensed use limited to: TU Delft Library. Downloaded on March 12,2021 at 14:28:03 UTC from IEEE Xplore. Restrictions apply.
SONG et al.: RESPONSE SPECTRUM ANALYSIS OF WIND DEFLECTION IN RAILWAY OVERHEAD CONTACT LINES 1171
Fig. 2. OCL model based on ANCF beam and cable elements.
steady arms are assumed as lumped masses. Here the derivationof the stiffness matrix of ANCF beam element is given asfollows. The DOF vector that contains the displacements andthe gradients for a beam element is defined by
e =[xi yi zi
∂xi
∂χ∂yi
∂χ∂zi∂χ xj yj zj
∂xj
∂χ∂yj
∂χ∂zj∂χ
]T(2)
where,χ is the local coordinate in the undeformed configurationranging from 0 to the element length L0. The position vectorin the deformed configuration r is interpolated by the shapefunction matrix S as
r = Se (3)
in which, S can be expressed by
S =
⎡⎣S1 S2 S3 S4
S1 S2 S3 S4
S1 S2 S3 S4
⎤⎦
S1 (ξ) = 1 − 3ξ2 + 2ξ3
S2 (ξ) = l0(ξ + ξ3 − 2ξ2
)S3 (ξ) = 3ξ2 − 2ξ3
S4 (ξ) = l0(ξ3 − ξ2
)(4)
The strain energy U obtained from the contribution of axialand bending deformation can be expressed by
U =12
∫ L0
0(EAε2
l + EIκ2)dχ (5)
in which, E is Young’s modulus, A is the section area, I is themoment inertial of the wire, εl is the longitudinal strain and κ isthe curvature. The generalised elastic forces are calculated by
Q =
(∂U
∂e
)T
= Kee (6)
Through (6), the element stiffness matrix Ke can be obtained.In the shape-finding procedure, the tangent stiffness matrix istypically used to calculate the incremental nodal DOF vectorΔeand the incremental unstrained length ΔL0. The corresponding
Fig. 3. OCL model based on ANCF beam and cable elements.
tangent stiffness matrices KT and KL with respect to Δe andΔL0 are derived as follows:
ΔF =∂Q
∂eΔe+
∂Q
∂L0ΔL0 = KTΔe+KLΔL0 (7)
Similarly, the tangent stiffness matrices of the ANCF cableelement can also be obtained without bending DOFs. It is notedthat the ANCF cable element used to model dropper can onlywithstand tension but not compression. Assembling the elementmatrices yields the global incremental equilibrium equation forthe whole OCL as follows:
ΔFG = KGTΔUC +KG
LΔL0 (8)
where ΔFG is the global unbalanced force vector. KGT and
KGL are the global stiffness matrices related to the incremental
nodal displacement vector ΔUC and the incremental unstrainedlength vector ΔL0 , respectively. However, [KG
T KGL ] is not a
square matrix. The number of unknowns exceeds the number ofequations, which leads to indeterministic solutions. Therefore,additional constraint conditions are provided to restrict unde-sired movements, according to the design specifications of theOCL.� The vertical DOFs of dropper points in the contact line are
restricted to describe the pre-sag.� The longitudinal direction of each node is restricted to
suppress the undesired movement.� The tensions are applied to the endpoints of messenger and
contact lines.Introducing the above three types of constraints in (8), the
strained and unstrained lengths of all the elements can be calcu-lated.
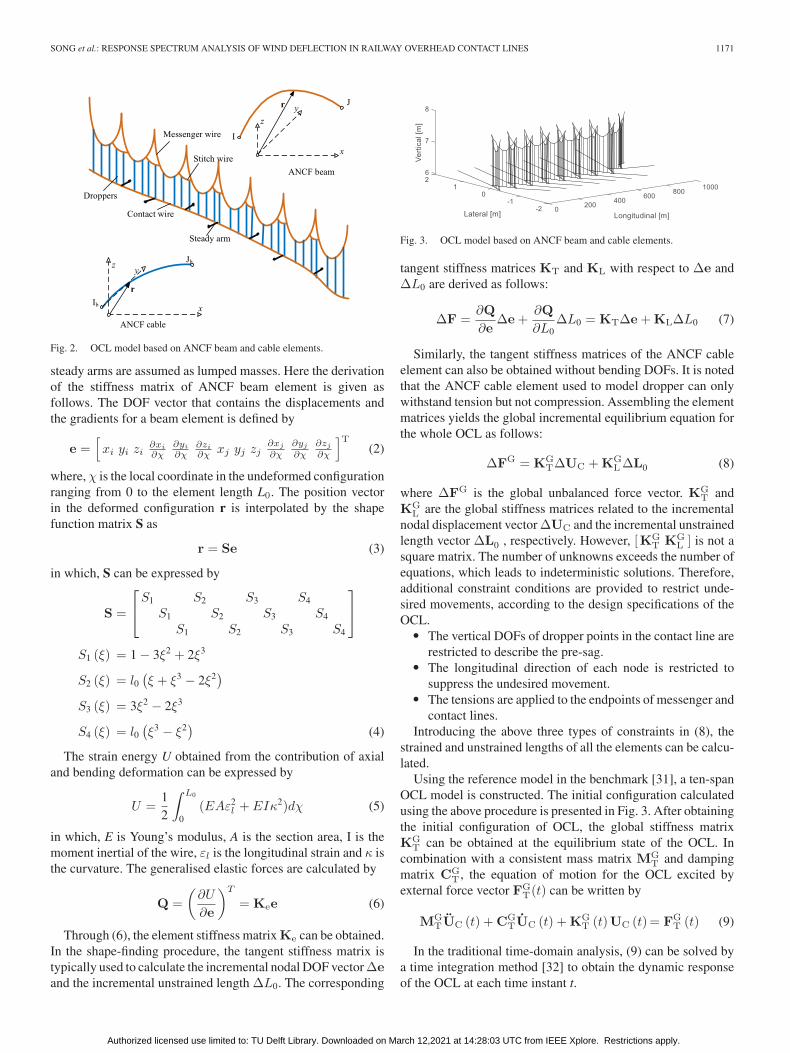
Using the reference model in the benchmark [31], a ten-spanOCL model is constructed. The initial configuration calculatedusing the above procedure is presented in Fig. 3. After obtainingthe initial configuration of OCL, the global stiffness matrixKG
T can be obtained at the equilibrium state of the OCL. Incombination with a consistent mass matrix MG
T and dampingmatrix CG
T , the equation of motion for the OCL excited byexternal force vector FG
T(t) can be written by
MGTUC (t) +CG
TUC (t) +KGT (t)UC (t)= FG
T (t) (9)
In the traditional time-domain analysis, (9) can be solved bya time integration method [32] to obtain the dynamic responseof the OCL at each time instant t.
Authorized licensed use limited to: TU Delft Library. Downloaded on March 12,2021 at 14:28:03 UTC from IEEE Xplore. Restrictions apply.
1172 IEEE TRANSACTIONS ON VEHICULAR TECHNOLOGY, VOL. 70, NO. 2, FEBRUARY 2021
TABLE IEXPRESSIONS OF EMPIRICAL SPECTRUM IN THREE DIRECTIONS
III. AERODYNAMIC FORCES AND SPECTRA
Assuming that the OCL is only subjected to the wind load, theexternal force vector FG
T(t) contains all the aerodynamic forceson each node. Applying Fourier transform to (9) yields[−ω2MG
T + iωCGT +KG
T (ω)]UC (ω) = FG
T (ω) (10)
in which,ω is the angular frequency.UC(ω)is the OCL responseunder the stochastic wind load. In this section, the aerodynamicforce vector FG
T(ω) on the right hand is constructed based onthe idea of PEM.
A. Stochastic Wind Spectrums
The stochastic wind is normally decomposed in three compo-nents in along-wind, cross-wind and vertical-wind directions. Inthis section, the Kaimal [33], Panofsky [34] and Tieleman [35]spectrums are adopted to describe the stochastics of fluctuatingwind speed in three directions, as shown in Table I. vs is thesteady wind speed. z is the vertical coordinate. n is the frequency.u∗ is the friction speed and can be evaluated by
u∗ = κvs/ ln
(z
z0
)(11)
where the Kármán constant κ can be considered to be universalκ = 0.4. z0 is the roughness length dependant on the roughnessof the terrain surface. Mostly the railway is constructed in openareas and a very small value of z0 = 10−4 m is adopted in thisanalysis [36].
As the OCL is a long-span structure, the wind speeds atdifferent spatial positions are different. The spatial correlationshould be taken into account to generate a spatial wind field.Assuming that the OCL is discretized in N segments, the spectraldensity function matrix of the fluctuating wind speed in eachdirection is expressed as follow:
Sτ (n) =
⎡⎢⎢⎢⎢⎣
Sτ1,1(n) · · · Sτ
1,l(n) · · · Sτ1,N (n)
Sτk,1(n) · · · Sτ
k,2(n) · · · Sτk,N (n)
SτN,1(n) · · · Sτ
N,2(n) · · · SτN,N (n)
⎤⎥⎥⎥⎥⎦ (12)
in which, k = 12 …, N; l = 12, …, N; τ can be u, w and v todenotes three stochastic wind directions; When k = l, Sτ
k,l(n)
is the auto-spectrum and Su,v,wk,l (n) = Su,v,w(n). When k � l,
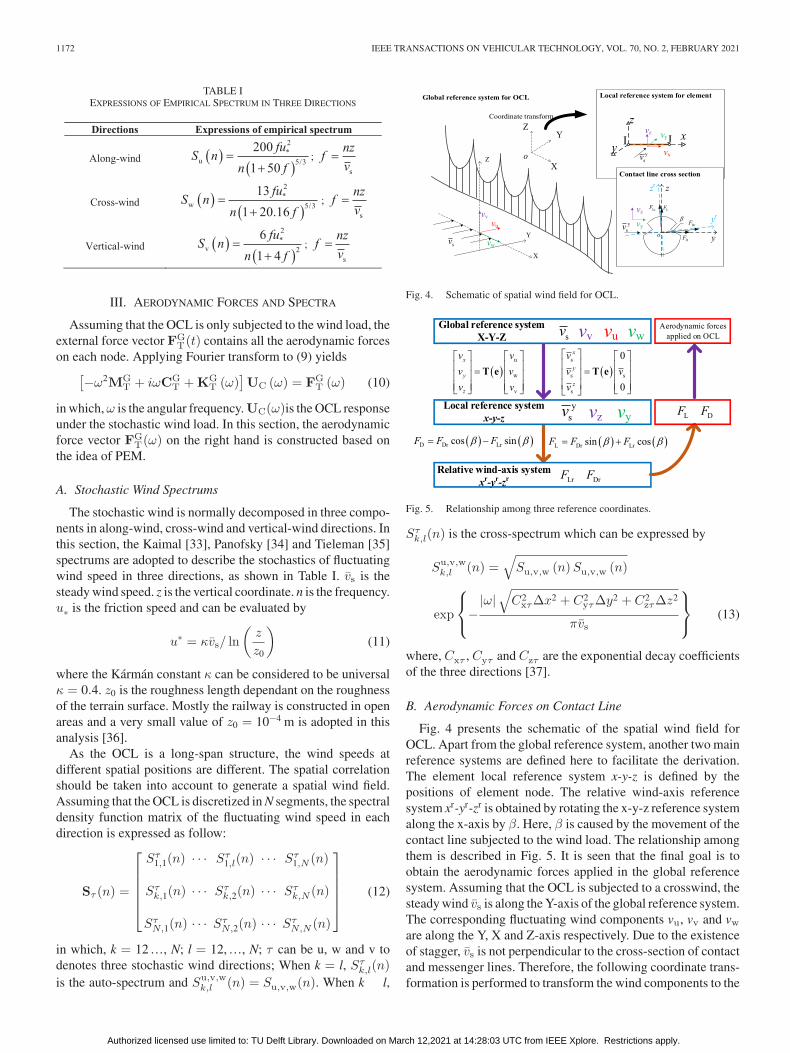
Fig. 4. Schematic of spatial wind field for OCL.
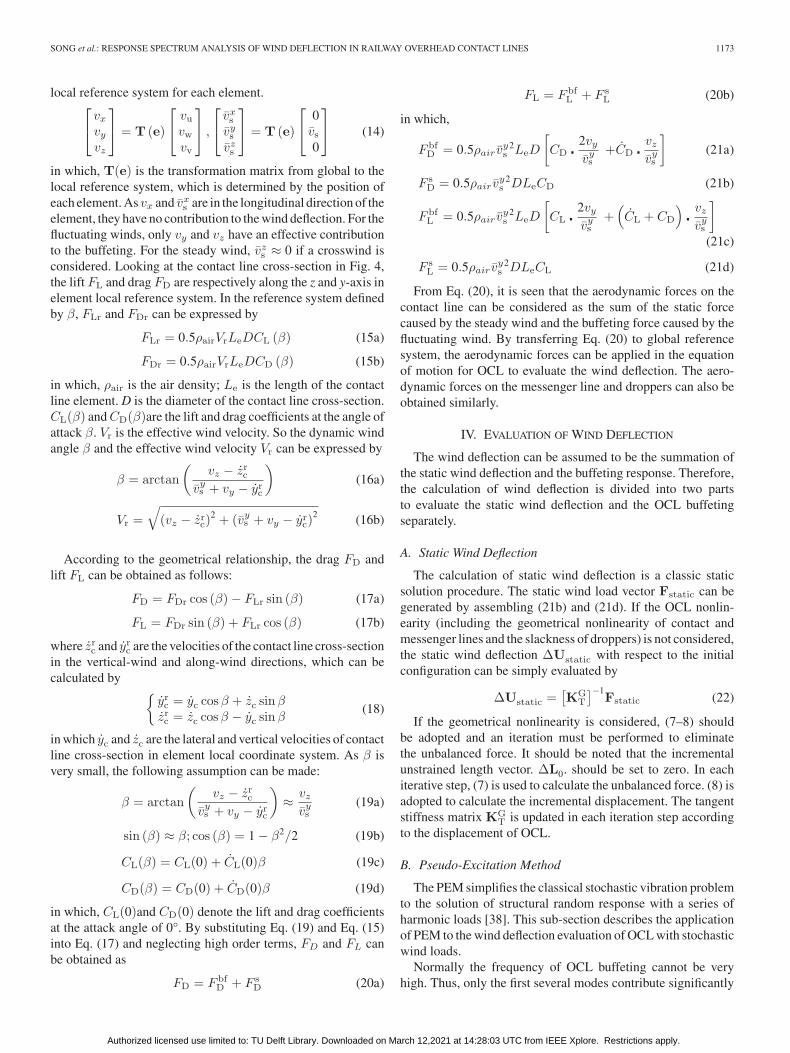
Fig. 5. Relationship among three reference coordinates.
Sτk,l(n) is the cross-spectrum which can be expressed by
Su,v,wk,l (n) =
√Su,v,w (n)Su,v,w (n)
exp
⎧⎨⎩−
|ω|√
C2xτΔx2 + C2
yτΔy2 + C2zτΔz2
πvs
⎫⎬⎭ (13)
where, Cxτ , Cyτ and Czτ are the exponential decay coefficientsof the three directions [37].
B. Aerodynamic Forces on Contact Line
Fig. 4 presents the schematic of the spatial wind field forOCL. Apart from the global reference system, another two mainreference systems are defined here to facilitate the derivation.The element local reference system x-y-z is defined by thepositions of element node. The relative wind-axis referencesystem xr-yr-zr is obtained by rotating the x-y-z reference systemalong the x-axis by β. Here, β is caused by the movement of thecontact line subjected to the wind load. The relationship amongthem is described in Fig. 5. It is seen that the final goal is toobtain the aerodynamic forces applied in the global referencesystem. Assuming that the OCL is subjected to a crosswind, thesteady wind vs is along the Y-axis of the global reference system.The corresponding fluctuating wind components vu, vv and vware along the Y, X and Z-axis respectively. Due to the existenceof stagger, vs is not perpendicular to the cross-section of contactand messenger lines. Therefore, the following coordinate trans-formation is performed to transform the wind components to the
Authorized licensed use limited to: TU Delft Library. Downloaded on March 12,2021 at 14:28:03 UTC from IEEE Xplore. Restrictions apply.
SONG et al.: RESPONSE SPECTRUM ANALYSIS OF WIND DEFLECTION IN RAILWAY OVERHEAD CONTACT LINES 1173
local reference system for each element.⎡⎣ vxvyvz
⎤⎦ = T (e)
⎡⎣ vuvwvv
⎤⎦ ,
⎡⎣ vxsvysvzs
⎤⎦ = T (e)
⎡⎣ 0vs0
⎤⎦ (14)
in which, T(e) is the transformation matrix from global to thelocal reference system, which is determined by the position ofeach element. Asvx and vxs are in the longitudinal direction of theelement, they have no contribution to the wind deflection. For thefluctuating winds, only vy and vz have an effective contributionto the buffeting. For the steady wind, vzs ≈ 0 if a crosswind isconsidered. Looking at the contact line cross-section in Fig. 4,the lift FL and drag FD are respectively along the z and y-axis inelement local reference system. In the reference system definedby β, FLr and FDr can be expressed by
FLr = 0.5ρairVrLeDCL (β) (15a)
FDr = 0.5ρairVrLeDCD (β) (15b)
in which, ρair is the air density; Le is the length of the contactline element. D is the diameter of the contact line cross-section.CL(β) andCD(β)are the lift and drag coefficients at the angle ofattack β. Vr is the effective wind velocity. So the dynamic windangle β and the effective wind velocity Vr can be expressed by
β = arctan
(vz − zrc
vys + vy − yrc
)(16a)
Vr =
√(vz − zrc)
2 + (vys + vy − yrc)2 (16b)
According to the geometrical relationship, the drag FD andlift FL can be obtained as follows:
FD = FDr cos (β)− FLr sin (β) (17a)
FL = FDr sin (β) + FLr cos (β) (17b)
where zrc and yrc are the velocities of the contact line cross-sectionin the vertical-wind and along-wind directions, which can becalculated by {
yrc = yc cosβ + zc sinβzrc = zc cosβ − yc sinβ
(18)
in which yc and zc are the lateral and vertical velocities of contactline cross-section in element local coordinate system. As β isvery small, the following assumption can be made:
β = arctan
(vz − zrc
vys + vy − yrc
)≈ vz
vys(19a)
sin (β) ≈ β; cos (β) = 1 − β2/2 (19b)
CL(β) = CL(0) + CL(0)β (19c)
CD(β) = CD(0) + CD(0)β (19d)
in which, CL(0)and CD(0) denote the lift and drag coefficientsat the attack angle of 0°. By substituting Eq. (19) and Eq. (15)into Eq. (17) and neglecting high order terms, FD and FL canbe obtained as
FD = F bfD + F s
D (20a)
FL = F bfL + F s
L (20b)
in which,
F bfD = 0.5ρair v
ys
2LeD
[CD � 2vy
vys+CD � vz
vys
](21a)
F sD = 0.5ρair v
ys
2DLeCD (21b)
F bfL = 0.5ρair v
ys
2LeD
[CL � 2vy
vys+(CL + CD
)� vzvys
]
(21c)
F sL = 0.5ρair v
ys
2DLeCL (21d)
From Eq. (20), it is seen that the aerodynamic forces on thecontact line can be considered as the sum of the static forcecaused by the steady wind and the buffeting force caused by thefluctuating wind. By transferring Eq. (20) to global referencesystem, the aerodynamic forces can be applied in the equationof motion for OCL to evaluate the wind deflection. The aero-dynamic forces on the messenger line and droppers can also beobtained similarly.
IV. EVALUATION OF WIND DEFLECTION
The wind deflection can be assumed to be the summation ofthe static wind deflection and the buffeting response. Therefore,the calculation of wind deflection is divided into two partsto evaluate the static wind deflection and the OCL buffetingseparately.
A. Static Wind Deflection
The calculation of static wind deflection is a classic staticsolution procedure. The static wind load vector Fstatic can begenerated by assembling (21b) and (21d). If the OCL nonlin-earity (including the geometrical nonlinearity of contact andmessenger lines and the slackness of droppers) is not considered,the static wind deflection ΔUstatic with respect to the initialconfiguration can be simply evaluated by
ΔUstatic =[KG
T
]−1Fstatic (22)
If the geometrical nonlinearity is considered, (7–8) shouldbe adopted and an iteration must be performed to eliminatethe unbalanced force. It should be noted that the incrementalunstrained length vector. ΔL0. should be set to zero. In eachiterative step, (7) is used to calculate the unbalanced force. (8) isadopted to calculate the incremental displacement. The tangentstiffness matrix KG
T is updated in each iteration step accordingto the displacement of OCL.
B. Pseudo-Excitation Method
The PEM simplifies the classical stochastic vibration problemto the solution of structural random response with a series ofharmonic loads [38]. This sub-section describes the applicationof PEM to the wind deflection evaluation of OCL with stochasticwind loads.
Normally the frequency of OCL buffeting cannot be veryhigh. Thus, only the first several modes contribute significantly
Authorized licensed use limited to: TU Delft Library. Downloaded on March 12,2021 at 14:28:03 UTC from IEEE Xplore. Restrictions apply.
1174 IEEE TRANSACTIONS ON VEHICULAR TECHNOLOGY, VOL. 70, NO. 2, FEBRUARY 2021
to the buffeting response. Based on this idea, the mode anal-ysis is performed to (9) to obtain the first q mode shapesand natural frequencies. Therefore the mode function matrixΦ = [φ1, φ2, . . . φq] and the natural frequency matrix Ω2 =diag[ω2
1 , ω22 , . . . , ω
2q] are obtained.
KGTΦ = MG
TΦΩ2 (23)
in which, φj and ωj are the jth mode and natural frequency ofthe OCL, respectively. (9) can be rewritten as[
−ω2MGT + iωCG
T + KGT
]UC (ω)= F
G
T (ω) (24)
in which,
MGT = ΦTMG
TΦ, CGT = ΦTCG
TΦ
KGT = ΦTKG
TΦ, UC (ω) = ΦTUC (ω)
FGT (ω) = ΦTFG
T (ω)
(25)
In (24), MGT , CG
T and KGT are all diagonal matrices. So the
equation can be decomposed into q independent equations andsolved separately.
The aerodynamic excitation on the right hand of (10) can begenerated by
FGT (ω) = Rp (ω) (26)
in which p(ω) is the random excitation vector in the frequencydomain.R is the matrix describing the distribution of excitation.For the buffeting problem, the spectral excitation matrixSFF(ω)of p(ω) can be derived by
SFF (ω) = QSu,v,w(ω)QT (27)
where Q is the transformation matrix from fluctuating windvelocities to aerodynamic forces, which can be generated ac-cording to the derivation in Section III. To facilitate the gen-eration of the pseudo-excitation vector in PEM, the Choleskydecomposition is applied to SFF(ω) and yields
SFF(ω) = L∗dLT (28)
where L is a lower triangular matrix with unity as its diagonalelements. d is a diagonal matrix with dr as its rth diagonalelement. Physically,
√drLre
iωt can be taken as the harmonicgeneralised pseudo-excitation for (10), in which Lr is the rthcolumn of L. Looking at the jth mode, the equation of motioncan be written as
ηr,j + 2ωjξj ηr,j + ω2jηr,j =
φTj R
√drLre
iωt
mj(29)
in which ξj is the damping ratio of OCL. mj is the jth diagonalelement in the matrix MG
T . ηr,j is the rth harmonic generalisedpseudo-displacement response excited by the rth harmonic gen-eralised pseudo-wind excitation. According to the principle ofPEM, the steady-state response can be calculated by
Ur,j = φjηr,j =φjHj (ω)φ
Tj R
√drLre
iωt
mj(30)
in which,
Hj (ω) =1
ω2j − ω2 + 2iξjωjω
(31)
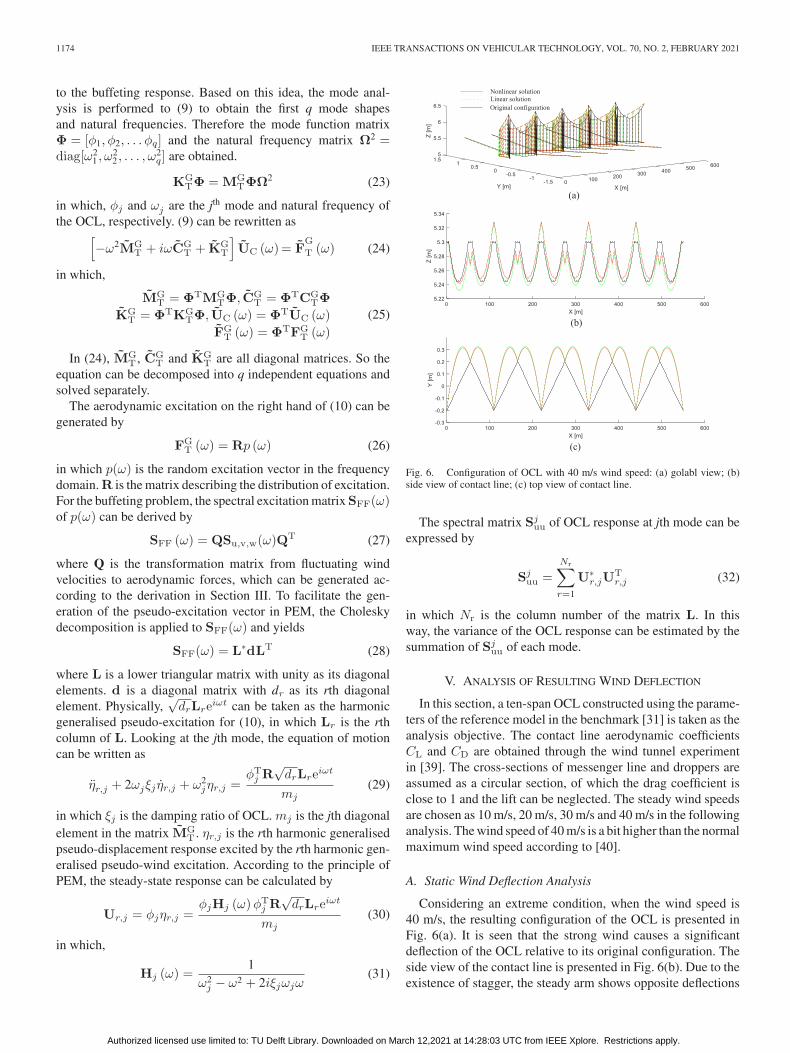
Fig. 6. Configuration of OCL with 40 m/s wind speed: (a) golabl view; (b)side view of contact line; (c) top view of contact line.
The spectral matrix Sjuu of OCL response at jth mode can be
expressed by
Sjuu =
Nr∑r=1
U∗r,jU
Tr,j (32)
in which Nr is the column number of the matrix L. In thisway, the variance of the OCL response can be estimated by thesummation of Sj
uu of each mode.
V. ANALYSIS OF RESULTING WIND DEFLECTION
In this section, a ten-span OCL constructed using the parame-ters of the reference model in the benchmark [31] is taken as theanalysis objective. The contact line aerodynamic coefficientsCL and CD are obtained through the wind tunnel experimentin [39]. The cross-sections of messenger line and droppers areassumed as a circular section, of which the drag coefficient isclose to 1 and the lift can be neglected. The steady wind speedsare chosen as 10 m/s, 20 m/s, 30 m/s and 40 m/s in the followinganalysis. The wind speed of 40 m/s is a bit higher than the normalmaximum wind speed according to [40].
A. Static Wind Deflection Analysis
Considering an extreme condition, when the wind speed is40 m/s, the resulting configuration of the OCL is presented inFig. 6(a). It is seen that the strong wind causes a significantdeflection of the OCL relative to its original configuration. Theside view of the contact line is presented in Fig. 6(b). Due to theexistence of stagger, the steady arm shows opposite deflections
Authorized licensed use limited to: TU Delft Library. Downloaded on March 12,2021 at 14:28:03 UTC from IEEE Xplore. Restrictions apply.
SONG et al.: RESPONSE SPECTRUM ANALYSIS OF WIND DEFLECTION IN RAILWAY OVERHEAD CONTACT LINES 1175
Fig. 7. Two types of cantilever: (a) push-off cantilever; (b) pull-off cantilever.
Fig. 8. Static contact line deflection at different wind speed: (a) side view; (b)top view.
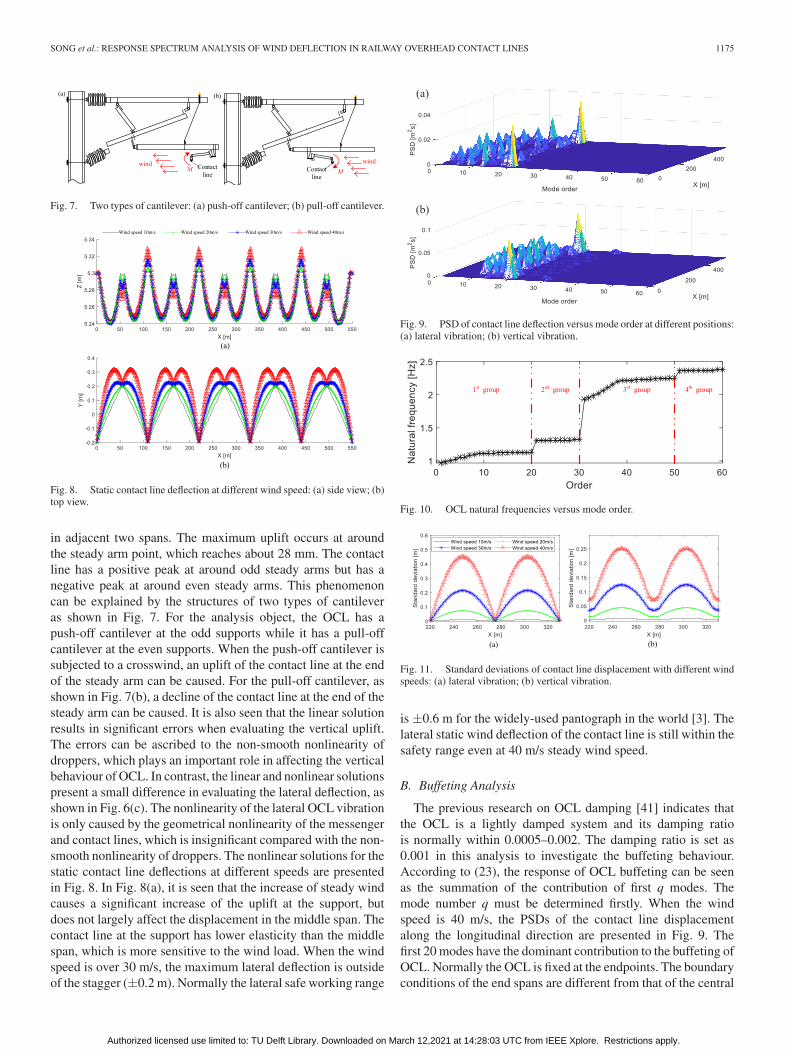
in adjacent two spans. The maximum uplift occurs at aroundthe steady arm point, which reaches about 28 mm. The contactline has a positive peak at around odd steady arms but has anegative peak at around even steady arms. This phenomenoncan be explained by the structures of two types of cantileveras shown in Fig. 7. For the analysis object, the OCL has apush-off cantilever at the odd supports while it has a pull-offcantilever at the even supports. When the push-off cantilever issubjected to a crosswind, an uplift of the contact line at the endof the steady arm can be caused. For the pull-off cantilever, asshown in Fig. 7(b), a decline of the contact line at the end of thesteady arm can be caused. It is also seen that the linear solutionresults in significant errors when evaluating the vertical uplift.The errors can be ascribed to the non-smooth nonlinearity ofdroppers, which plays an important role in affecting the verticalbehaviour of OCL. In contrast, the linear and nonlinear solutionspresent a small difference in evaluating the lateral deflection, asshown in Fig. 6(c). The nonlinearity of the lateral OCL vibrationis only caused by the geometrical nonlinearity of the messengerand contact lines, which is insignificant compared with the non-smooth nonlinearity of droppers. The nonlinear solutions for thestatic contact line deflections at different speeds are presentedin Fig. 8. In Fig. 8(a), it is seen that the increase of steady windcauses a significant increase of the uplift at the support, butdoes not largely affect the displacement in the middle span. Thecontact line at the support has lower elasticity than the middlespan, which is more sensitive to the wind load. When the windspeed is over 30 m/s, the maximum lateral deflection is outsideof the stagger (±0.2 m). Normally the lateral safe working range
Fig. 9. PSD of contact line deflection versus mode order at different positions:(a) lateral vibration; (b) vertical vibration.
Fig. 10. OCL natural frequencies versus mode order.
Fig. 11. Standard deviations of contact line displacement with different windspeeds: (a) lateral vibration; (b) vertical vibration.
is ±0.6 m for the widely-used pantograph in the world [3]. Thelateral static wind deflection of the contact line is still within thesafety range even at 40 m/s steady wind speed.
B. Buffeting Analysis
The previous research on OCL damping [41] indicates thatthe OCL is a lightly damped system and its damping ratiois normally within 0.0005–0.002. The damping ratio is set as0.001 in this analysis to investigate the buffeting behaviour.According to (23), the response of OCL buffeting can be seenas the summation of the contribution of first q modes. Themode number q must be determined firstly. When the windspeed is 40 m/s, the PSDs of the contact line displacementalong the longitudinal direction are presented in Fig. 9. Thefirst 20 modes have the dominant contribution to the buffeting ofOCL. Normally the OCL is fixed at the endpoints. The boundaryconditions of the end spans are different from that of the central
Authorized licensed use limited to: TU Delft Library. Downloaded on March 12,2021 at 14:28:03 UTC from IEEE Xplore. Restrictions apply.
1176 IEEE TRANSACTIONS ON VEHICULAR TECHNOLOGY, VOL. 70, NO. 2, FEBRUARY 2021
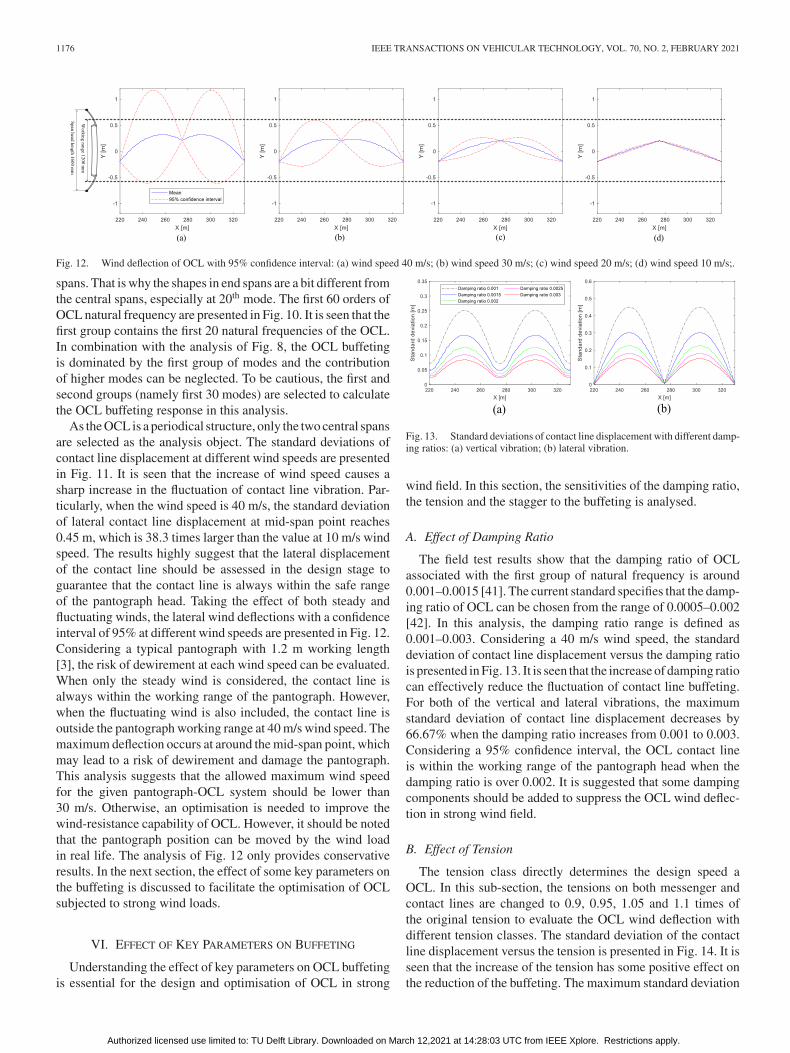
Fig. 12. Wind deflection of OCL with 95% confidence interval: (a) wind speed 40 m/s; (b) wind speed 30 m/s; (c) wind speed 20 m/s; (d) wind speed 10 m/s;.
spans. That is why the shapes in end spans are a bit different fromthe central spans, especially at 20th mode. The first 60 orders ofOCL natural frequency are presented in Fig. 10. It is seen that thefirst group contains the first 20 natural frequencies of the OCL.In combination with the analysis of Fig. 8, the OCL buffetingis dominated by the first group of modes and the contributionof higher modes can be neglected. To be cautious, the first andsecond groups (namely first 30 modes) are selected to calculatethe OCL buffeting response in this analysis.
As the OCL is a periodical structure, only the two central spansare selected as the analysis object. The standard deviations ofcontact line displacement at different wind speeds are presentedin Fig. 11. It is seen that the increase of wind speed causes asharp increase in the fluctuation of contact line vibration. Par-ticularly, when the wind speed is 40 m/s, the standard deviationof lateral contact line displacement at mid-span point reaches0.45 m, which is 38.3 times larger than the value at 10 m/s windspeed. The results highly suggest that the lateral displacementof the contact line should be assessed in the design stage toguarantee that the contact line is always within the safe rangeof the pantograph head. Taking the effect of both steady andfluctuating winds, the lateral wind deflections with a confidenceinterval of 95% at different wind speeds are presented in Fig. 12.Considering a typical pantograph with 1.2 m working length[3], the risk of dewirement at each wind speed can be evaluated.When only the steady wind is considered, the contact line isalways within the working range of the pantograph. However,when the fluctuating wind is also included, the contact line isoutside the pantograph working range at 40 m/s wind speed. Themaximum deflection occurs at around the mid-span point, whichmay lead to a risk of dewirement and damage the pantograph.This analysis suggests that the allowed maximum wind speedfor the given pantograph-OCL system should be lower than30 m/s. Otherwise, an optimisation is needed to improve thewind-resistance capability of OCL. However, it should be notedthat the pantograph position can be moved by the wind loadin real life. The analysis of Fig. 12 only provides conservativeresults. In the next section, the effect of some key parameters onthe buffeting is discussed to facilitate the optimisation of OCLsubjected to strong wind loads.
VI. EFFECT OF KEY PARAMETERS ON BUFFETING
Understanding the effect of key parameters on OCL buffetingis essential for the design and optimisation of OCL in strong
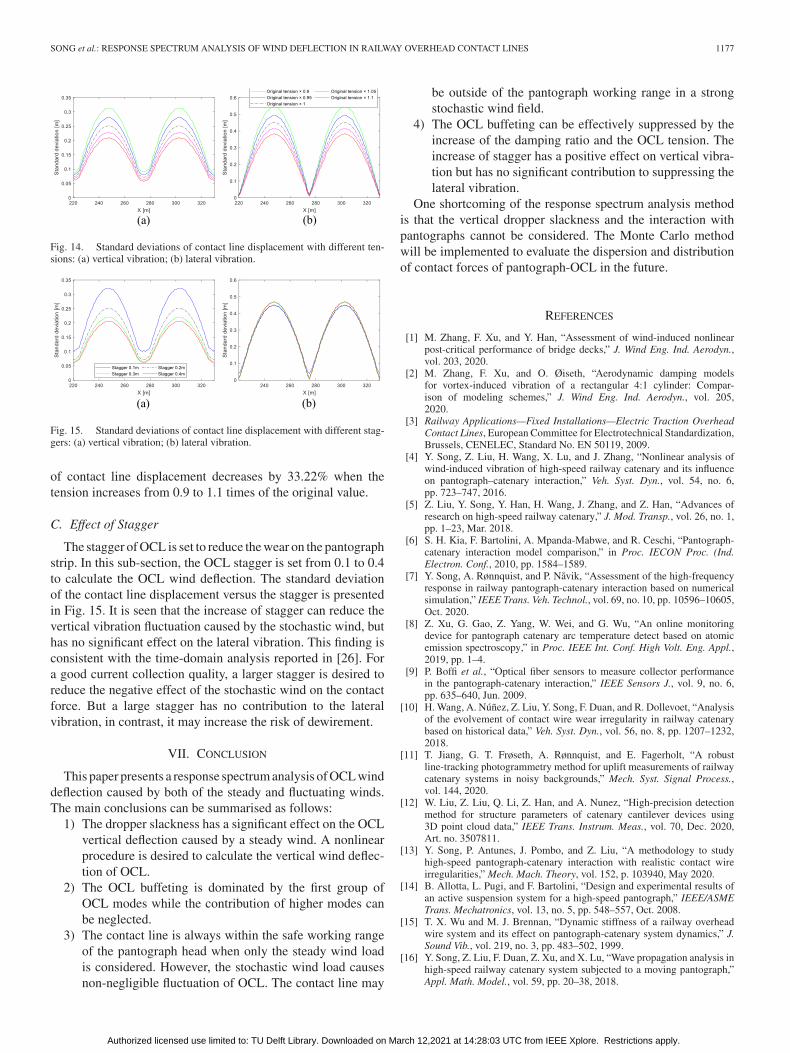
Fig. 13. Standard deviations of contact line displacement with different damp-ing ratios: (a) vertical vibration; (b) lateral vibration.
wind field. In this section, the sensitivities of the damping ratio,the tension and the stagger to the buffeting is analysed.
A. Effect of Damping Ratio
The field test results show that the damping ratio of OCLassociated with the first group of natural frequency is around0.001–0.0015 [41]. The current standard specifies that the damp-ing ratio of OCL can be chosen from the range of 0.0005–0.002[42]. In this analysis, the damping ratio range is defined as0.001–0.003. Considering a 40 m/s wind speed, the standarddeviation of contact line displacement versus the damping ratiois presented in Fig. 13. It is seen that the increase of damping ratiocan effectively reduce the fluctuation of contact line buffeting.For both of the vertical and lateral vibrations, the maximumstandard deviation of contact line displacement decreases by66.67% when the damping ratio increases from 0.001 to 0.003.Considering a 95% confidence interval, the OCL contact lineis within the working range of the pantograph head when thedamping ratio is over 0.002. It is suggested that some dampingcomponents should be added to suppress the OCL wind deflec-tion in strong wind field.
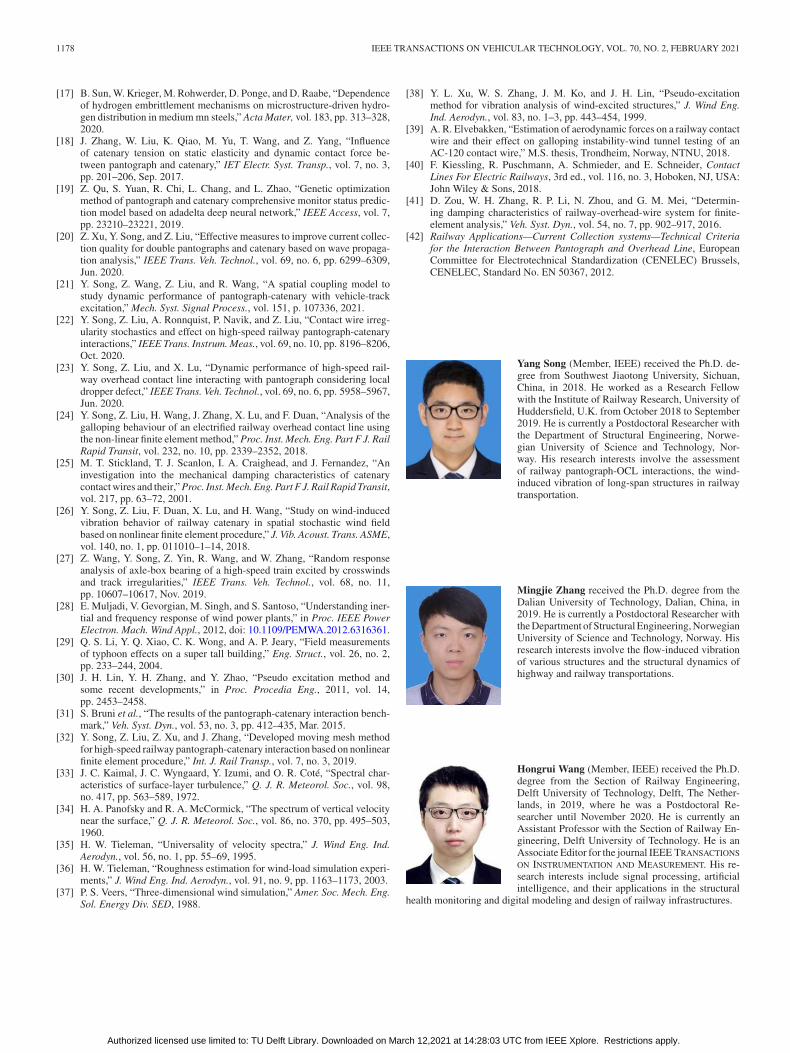
B. Effect of Tension
The tension class directly determines the design speed aOCL. In this sub-section, the tensions on both messenger andcontact lines are changed to 0.9, 0.95, 1.05 and 1.1 times ofthe original tension to evaluate the OCL wind deflection withdifferent tension classes. The standard deviation of the contactline displacement versus the tension is presented in Fig. 14. It isseen that the increase of the tension has some positive effect onthe reduction of the buffeting. The maximum standard deviation
Authorized licensed use limited to: TU Delft Library. Downloaded on March 12,2021 at 14:28:03 UTC from IEEE Xplore. Restrictions apply.
SONG et al.: RESPONSE SPECTRUM ANALYSIS OF WIND DEFLECTION IN RAILWAY OVERHEAD CONTACT LINES 1177
Fig. 14. Standard deviations of contact line displacement with different ten-sions: (a) vertical vibration; (b) lateral vibration.
Fig. 15. Standard deviations of contact line displacement with different stag-gers: (a) vertical vibration; (b) lateral vibration.
of contact line displacement decreases by 33.22% when thetension increases from 0.9 to 1.1 times of the original value.
C. Effect of Stagger
The stagger of OCL is set to reduce the wear on the pantographstrip. In this sub-section, the OCL stagger is set from 0.1 to 0.4to calculate the OCL wind deflection. The standard deviationof the contact line displacement versus the stagger is presentedin Fig. 15. It is seen that the increase of stagger can reduce thevertical vibration fluctuation caused by the stochastic wind, buthas no significant effect on the lateral vibration. This finding isconsistent with the time-domain analysis reported in [26]. Fora good current collection quality, a larger stagger is desired toreduce the negative effect of the stochastic wind on the contactforce. But a large stagger has no contribution to the lateralvibration, in contrast, it may increase the risk of dewirement.
VII. CONCLUSION
This paper presents a response spectrum analysis of OCL winddeflection caused by both of the steady and fluctuating winds.The main conclusions can be summarised as follows:
1) The dropper slackness has a significant effect on the OCLvertical deflection caused by a steady wind. A nonlinearprocedure is desired to calculate the vertical wind deflec-tion of OCL.
2) The OCL buffeting is dominated by the first group ofOCL modes while the contribution of higher modes canbe neglected.
3) The contact line is always within the safe working rangeof the pantograph head when only the steady wind loadis considered. However, the stochastic wind load causesnon-negligible fluctuation of OCL. The contact line may
be outside of the pantograph working range in a strongstochastic wind field.
4) The OCL buffeting can be effectively suppressed by theincrease of the damping ratio and the OCL tension. Theincrease of stagger has a positive effect on vertical vibra-tion but has no significant contribution to suppressing thelateral vibration.
One shortcoming of the response spectrum analysis methodis that the vertical dropper slackness and the interaction withpantographs cannot be considered. The Monte Carlo methodwill be implemented to evaluate the dispersion and distributionof contact forces of pantograph-OCL in the future.
REFERENCES
[1] M. Zhang, F. Xu, and Y. Han, “Assessment of wind-induced nonlinearpost-critical performance of bridge decks,” J. Wind Eng. Ind. Aerodyn.,vol. 203, 2020.
[2] M. Zhang, F. Xu, and O. Øiseth, “Aerodynamic damping modelsfor vortex-induced vibration of a rectangular 4:1 cylinder: Compar-ison of modeling schemes,” J. Wind Eng. Ind. Aerodyn., vol. 205,2020.
[3] Railway Applications—Fixed Installations—Electric Traction OverheadContact Lines, European Committee for Electrotechnical Standardization,Brussels, CENELEC, Standard No. EN 50119, 2009.
[4] Y. Song, Z. Liu, H. Wang, X. Lu, and J. Zhang, “Nonlinear analysis ofwind-induced vibration of high-speed railway catenary and its influenceon pantograph–catenary interaction,” Veh. Syst. Dyn., vol. 54, no. 6,pp. 723–747, 2016.
[5] Z. Liu, Y. Song, Y. Han, H. Wang, J. Zhang, and Z. Han, “Advances ofresearch on high-speed railway catenary,” J. Mod. Transp., vol. 26, no. 1,pp. 1–23, Mar. 2018.
[6] S. H. Kia, F. Bartolini, A. Mpanda-Mabwe, and R. Ceschi, “Pantograph-catenary interaction model comparison,” in Proc. IECON Proc. (Ind.Electron. Conf., 2010, pp. 1584–1589.
[7] Y. Song, A. Rønnquist, and P. Nåvik, “Assessment of the high-frequencyresponse in railway pantograph-catenary interaction based on numericalsimulation,” IEEE Trans. Veh. Technol., vol. 69, no. 10, pp. 10596–10605,Oct. 2020.
[8] Z. Xu, G. Gao, Z. Yang, W. Wei, and G. Wu, “An online monitoringdevice for pantograph catenary arc temperature detect based on atomicemission spectroscopy,” in Proc. IEEE Int. Conf. High Volt. Eng. Appl.,2019, pp. 1–4.
[9] P. Boffi et al., “Optical fiber sensors to measure collector performancein the pantograph-catenary interaction,” IEEE Sensors J., vol. 9, no. 6,pp. 635–640, Jun. 2009.
[10] H. Wang, A. Núñez, Z. Liu, Y. Song, F. Duan, and R. Dollevoet, “Analysisof the evolvement of contact wire wear irregularity in railway catenarybased on historical data,” Veh. Syst. Dyn., vol. 56, no. 8, pp. 1207–1232,2018.
[11] T. Jiang, G. T. Frøseth, A. Rønnquist, and E. Fagerholt, “A robustline-tracking photogrammetry method for uplift measurements of railwaycatenary systems in noisy backgrounds,” Mech. Syst. Signal Process.,vol. 144, 2020.
[12] W. Liu, Z. Liu, Q. Li, Z. Han, and A. Nunez, “High-precision detectionmethod for structure parameters of catenary cantilever devices using3D point cloud data,” IEEE Trans. Instrum. Meas., vol. 70, Dec. 2020,Art. no. 3507811.
[13] Y. Song, P. Antunes, J. Pombo, and Z. Liu, “A methodology to studyhigh-speed pantograph-catenary interaction with realistic contact wireirregularities,” Mech. Mach. Theory, vol. 152, p. 103940, May 2020.
[14] B. Allotta, L. Pugi, and F. Bartolini, “Design and experimental results ofan active suspension system for a high-speed pantograph,” IEEE/ASMETrans. Mechatronics, vol. 13, no. 5, pp. 548–557, Oct. 2008.
[15] T. X. Wu and M. J. Brennan, “Dynamic stiffness of a railway overheadwire system and its effect on pantograph-catenary system dynamics,” J.Sound Vib., vol. 219, no. 3, pp. 483–502, 1999.
[16] Y. Song, Z. Liu, F. Duan, Z. Xu, and X. Lu, “Wave propagation analysis inhigh-speed railway catenary system subjected to a moving pantograph,”Appl. Math. Model., vol. 59, pp. 20–38, 2018.
Authorized licensed use limited to: TU Delft Library. Downloaded on March 12,2021 at 14:28:03 UTC from IEEE Xplore. Restrictions apply.
1178 IEEE TRANSACTIONS ON VEHICULAR TECHNOLOGY, VOL. 70, NO. 2, FEBRUARY 2021
[17] B. Sun, W. Krieger, M. Rohwerder, D. Ponge, and D. Raabe, “Dependenceof hydrogen embrittlement mechanisms on microstructure-driven hydro-gen distribution in medium mn steels,” Acta Mater, vol. 183, pp. 313–328,2020.
[18] J. Zhang, W. Liu, K. Qiao, M. Yu, T. Wang, and Z. Yang, “Influenceof catenary tension on static elasticity and dynamic contact force be-tween pantograph and catenary,” IET Electr. Syst. Transp., vol. 7, no. 3,pp. 201–206, Sep. 2017.
[19] Z. Qu, S. Yuan, R. Chi, L. Chang, and L. Zhao, “Genetic optimizationmethod of pantograph and catenary comprehensive monitor status predic-tion model based on adadelta deep neural network,” IEEE Access, vol. 7,pp. 23210–23221, 2019.
[20] Z. Xu, Y. Song, and Z. Liu, “Effective measures to improve current collec-tion quality for double pantographs and catenary based on wave propaga-tion analysis,” IEEE Trans. Veh. Technol., vol. 69, no. 6, pp. 6299–6309,Jun. 2020.
[21] Y. Song, Z. Wang, Z. Liu, and R. Wang, “A spatial coupling model tostudy dynamic performance of pantograph-catenary with vehicle-trackexcitation,” Mech. Syst. Signal Process., vol. 151, p. 107336, 2021.
[22] Y. Song, Z. Liu, A. Ronnquist, P. Navik, and Z. Liu, “Contact wire irreg-ularity stochastics and effect on high-speed railway pantograph-catenaryinteractions,” IEEE Trans. Instrum. Meas., vol. 69, no. 10, pp. 8196–8206,Oct. 2020.
[23] Y. Song, Z. Liu, and X. Lu, “Dynamic performance of high-speed rail-way overhead contact line interacting with pantograph considering localdropper defect,” IEEE Trans. Veh. Technol., vol. 69, no. 6, pp. 5958–5967,Jun. 2020.
[24] Y. Song, Z. Liu, H. Wang, J. Zhang, X. Lu, and F. Duan, “Analysis of thegalloping behaviour of an electrified railway overhead contact line usingthe non-linear finite element method,” Proc. Inst. Mech. Eng. Part F J. RailRapid Transit, vol. 232, no. 10, pp. 2339–2352, 2018.
[25] M. T. Stickland, T. J. Scanlon, I. A. Craighead, and J. Fernandez, “Aninvestigation into the mechanical damping characteristics of catenarycontact wires and their,” Proc. Inst. Mech. Eng. Part F J. Rail Rapid Transit,vol. 217, pp. 63–72, 2001.
[26] Y. Song, Z. Liu, F. Duan, X. Lu, and H. Wang, “Study on wind-inducedvibration behavior of railway catenary in spatial stochastic wind fieldbased on nonlinear finite element procedure,” J. Vib. Acoust. Trans. ASME,vol. 140, no. 1, pp. 011010–1–14, 2018.
[27] Z. Wang, Y. Song, Z. Yin, R. Wang, and W. Zhang, “Random responseanalysis of axle-box bearing of a high-speed train excited by crosswindsand track irregularities,” IEEE Trans. Veh. Technol., vol. 68, no. 11,pp. 10607–10617, Nov. 2019.
[28] E. Muljadi, V. Gevorgian, M. Singh, and S. Santoso, “Understanding iner-tial and frequency response of wind power plants,” in Proc. IEEE PowerElectron. Mach. Wind Appl., 2012, doi: 10.1109/PEMWA.2012.6316361.
[29] Q. S. Li, Y. Q. Xiao, C. K. Wong, and A. P. Jeary, “Field measurementsof typhoon effects on a super tall building,” Eng. Struct., vol. 26, no. 2,pp. 233–244, 2004.
[30] J. H. Lin, Y. H. Zhang, and Y. Zhao, “Pseudo excitation method andsome recent developments,” in Proc. Procedia Eng., 2011, vol. 14,pp. 2453–2458.
[31] S. Bruni et al., “The results of the pantograph-catenary interaction bench-mark,” Veh. Syst. Dyn., vol. 53, no. 3, pp. 412–435, Mar. 2015.
[32] Y. Song, Z. Liu, Z. Xu, and J. Zhang, “Developed moving mesh methodfor high-speed railway pantograph-catenary interaction based on nonlinearfinite element procedure,” Int. J. Rail Transp., vol. 7, no. 3, 2019.
[33] J. C. Kaimal, J. C. Wyngaard, Y. Izumi, and O. R. Coté, “Spectral char-acteristics of surface-layer turbulence,” Q. J. R. Meteorol. Soc., vol. 98,no. 417, pp. 563–589, 1972.
[34] H. A. Panofsky and R. A. McCormick, “The spectrum of vertical velocitynear the surface,” Q. J. R. Meteorol. Soc., vol. 86, no. 370, pp. 495–503,1960.
[35] H. W. Tieleman, “Universality of velocity spectra,” J. Wind Eng. Ind.Aerodyn., vol. 56, no. 1, pp. 55–69, 1995.
[36] H. W. Tieleman, “Roughness estimation for wind-load simulation experi-ments,” J. Wind Eng. Ind. Aerodyn., vol. 91, no. 9, pp. 1163–1173, 2003.
[37] P. S. Veers, “Three-dimensional wind simulation,” Amer. Soc. Mech. Eng.Sol. Energy Div. SED, 1988.
[38] Y. L. Xu, W. S. Zhang, J. M. Ko, and J. H. Lin, “Pseudo-excitationmethod for vibration analysis of wind-excited structures,” J. Wind Eng.Ind. Aerodyn., vol. 83, no. 1–3, pp. 443–454, 1999.
[39] A. R. Elvebakken, “Estimation of aerodynamic forces on a railway contactwire and their effect on galloping instability-wind tunnel testing of anAC-120 contact wire,” M.S. thesis, Trondheim, Norway, NTNU, 2018.
[40] F. Kiessling, R. Puschmann, A. Schmieder, and E. Schneider, ContactLines For Electric Railways, 3rd ed., vol. 116, no. 3, Hoboken, NJ, USA:John Wiley & Sons, 2018.
[41] D. Zou, W. H. Zhang, R. P. Li, N. Zhou, and G. M. Mei, “Determin-ing damping characteristics of railway-overhead-wire system for finite-element analysis,” Veh. Syst. Dyn., vol. 54, no. 7, pp. 902–917, 2016.
[42] Railway Applications—Current Collection systems—Technical Criteriafor the Interaction Between Pantograph and Overhead Line, EuropeanCommittee for Electrotechnical Standardization (CENELEC) Brussels,CENELEC, Standard No. EN 50367, 2012.
Yang Song (Member, IEEE) received the Ph.D. de-gree from Southwest Jiaotong University, Sichuan,China, in 2018. He worked as a Research Fellowwith the Institute of Railway Research, University ofHuddersfield, U.K. from October 2018 to September2019. He is currently a Postdoctoral Researcher withthe Department of Structural Engineering, Norwe-gian University of Science and Technology, Nor-way. His research interests involve the assessmentof railway pantograph-OCL interactions, the wind-induced vibration of long-span structures in railwaytransportation.
Mingjie Zhang received the Ph.D. degree from theDalian University of Technology, Dalian, China, in2019. He is currently a Postdoctoral Researcher withthe Department of Structural Engineering, NorwegianUniversity of Science and Technology, Norway. Hisresearch interests involve the flow-induced vibrationof various structures and the structural dynamics ofhighway and railway transportations.
Hongrui Wang (Member, IEEE) received the Ph.D.degree from the Section of Railway Engineering,Delft University of Technology, Delft, The Nether-lands, in 2019, where he was a Postdoctoral Re-searcher until November 2020. He is currently anAssistant Professor with the Section of Railway En-gineering, Delft University of Technology. He is anAssociate Editor for the journal IEEE TRANSACTIONS
ON INSTRUMENTATION AND MEASUREMENT. His re-search interests include signal processing, artificialintelligence, and their applications in the structural
health monitoring and digital modeling and design of railway infrastructures.
Authorized licensed use limited to: TU Delft Library. Downloaded on March 12,2021 at 14:28:03 UTC from IEEE Xplore. Restrictions apply.


