A radio pulsing white dwarf binary star - arXiv compact object is not visible in the spectra,...
27
A radio pulsing white dwarf binary star T.R. Marsh 1 , B.T. G¨ ansicke 1 , S. H¨ ummerich 2,3 , F.-J. Hambsch 2,3,4 , K. Bernhard 2,3 , C.Lloyd 5 , E. Breedt 1 , E.R. Stanway 1 , D.T. Steeghs 1 , S.G. Parsons 6 , O. Toloza 1 , M.R. Schreiber 6 , P.G. Jonker 7,8 , J. van Roestel 8 , T. Kupfer 9 , A.F. Pala 1 , V.S. Dhillon 10,11,12 , L.K. Hardy 10 , S.P. Littlefair 10 , A. Aungwerojwit 13 , S. Arjyotha 14 , D. Koester 15 , J.J. Bochinski 16 , C.A. Haswell 16 , P. Frank 2 , P.J. Wheatley 1 1 Department of Physics, Gibbet Hill Road, University of Warwick, Coventry, CV4 7AL, UK 2 Bundesdeutsche Arbeitsgemeinschaft f ¨ ur Ver¨ anderliche Sterne e.V. (BAV), Berlin, Germany 3 American Association of Variable Star Observers (AAVSO),Cambridge, MA, USA 4 Vereniging Voor Sterrenkunde (VVS), Brugge, Belgium 5 Department of Physics and Astronomy, University of Sussex, Brighton, BN1 9QH, UK 6 Instituto de F´ ısica y Astronom´ ıa, Universidad de Valpara´ ıso, Avenida Gran Bretana 1111, Val- para´ ıso, Chile 7 SRON, Netherlands Institute for Space Research, Sorbonnelaan 2, 3584-CA, Utrecht, The Nether- lands 8 Department of Astrophysics/IMAPP, Radboud University Nijmegen, P.O. box 9010, 6500 GL Nijmegen, The Netherlands 9 Division of Physics, Mathematics and Astronomy, California Institute of Technology, Pasadena, CA 91125, USA 10 Department of Physics and Astronomy, University of Sheffield, Sheffield, S3 7RH, UK 11 Instituto de Astrofisica de Canarias (IAC), E-38205 La Laguna, Tenerife, Spain 12 Universidad de La Laguna, Dpto. Astrofisica, E-38206 La Laguna, Tenerife, Spain 13 Department of Physics, Faculty of Science, Naresuan University, Phitsanulok 65000, Thailand 14 Program of Physics, Faculty of Science and Technology, Chiang Rai Rajabhat University, Chiang Rai 57100, Thailand 15 Institut f ¨ ur Theoretische Physik und Astrophysik, University of Kiel, 24098 Kiel, Germany 16 Department of Physical Sciences, The Open University, Milton Keynes, UK doi:10.1038/nature18620 White dwarfs are compact stars, similar in size to Earth but ∼ 200,000 times more massive 1 . Isolated white dwarfs emit most of their power from ultraviolet to near-infrared wavelengths, but when in close orbits with less dense stars, white dwarfs can strip material from their com- panions, and the resulting mass transfer can generate atomic line 2 and X-ray 3 emission, as well as near- and mid-infrared radiation if the white dwarf is magnetic 4 . However, even in bi- naries, white dwarfs are rarely detected at far-infrared or radio frequencies. Here we report 1 arXiv:1607.08265v1 [astro-ph.SR] 27 Jul 2016
Transcript of A radio pulsing white dwarf binary star - arXiv compact object is not visible in the spectra,...
A radio pulsing white dwarf binary star
T.R. Marsh1, B.T. Gansicke1, S. Hummerich2,3, F.-J. Hambsch2,3,4, K. Bernhard2,3, C.Lloyd5, E.Breedt1, E.R. Stanway1, D.T. Steeghs1, S.G. Parsons6, O. Toloza1, M.R. Schreiber6, P.G. Jonker7,8,J. van Roestel8, T. Kupfer9, A.F. Pala1, V.S. Dhillon10,11,12, L.K. Hardy10, S.P. Littlefair10, A.Aungwerojwit13, S. Arjyotha14, D. Koester15, J.J. Bochinski16, C.A. Haswell16, P. Frank2, P.J.Wheatley1
1Department of Physics, Gibbet Hill Road, University of Warwick, Coventry, CV4 7AL, UK2Bundesdeutsche Arbeitsgemeinschaft fur Veranderliche Sterne e.V. (BAV), Berlin, Germany3American Association of Variable Star Observers (AAVSO),Cambridge, MA, USA4Vereniging Voor Sterrenkunde (VVS), Brugge, Belgium5Department of Physics and Astronomy, University of Sussex, Brighton, BN1 9QH, UK6Instituto de Fısica y Astronomıa, Universidad de Valparaıso, Avenida Gran Bretana 1111, Val-paraıso, Chile7SRON, Netherlands Institute for Space Research, Sorbonnelaan 2, 3584-CA, Utrecht, The Nether-lands8Department of Astrophysics/IMAPP, Radboud University Nijmegen, P.O. box 9010, 6500 GLNijmegen, The Netherlands9Division of Physics, Mathematics and Astronomy, California Institute of Technology, Pasadena,CA 91125, USA10Department of Physics and Astronomy, University of Sheffield, Sheffield, S3 7RH, UK11Instituto de Astrofisica de Canarias (IAC), E-38205 La Laguna, Tenerife, Spain12Universidad de La Laguna, Dpto. Astrofisica, E-38206 La Laguna, Tenerife, Spain13Department of Physics, Faculty of Science, Naresuan University, Phitsanulok 65000, Thailand14Program of Physics, Faculty of Science and Technology, Chiang Rai Rajabhat University, ChiangRai 57100, Thailand15Institut fur Theoretische Physik und Astrophysik, University of Kiel, 24098 Kiel, Germany16Department of Physical Sciences, The Open University, Milton Keynes, UK
doi:10.1038/nature18620
White dwarfs are compact stars, similar in size to Earth but∼ 200,000 times more massive1.Isolated white dwarfs emit most of their power from ultraviolet to near-infrared wavelengths,but when in close orbits with less dense stars, white dwarfs can strip material from their com-panions, and the resulting mass transfer can generate atomic line2 and X-ray3 emission, aswell as near- and mid-infrared radiation if the white dwarf is magnetic4. However, even in bi-naries, white dwarfs are rarely detected at far-infrared or radio frequencies. Here we report
1
arX
iv:1
607.
0826
5v1
[as
tro-
ph.S
R]
27
Jul 2
016

the discovery of a white dwarf / cool star binary that emits from X-ray to radio wavelengths.The star, AR Scorpii (henceforth AR Sco), was classified in the early 1970s as a δ-Scuti star5,a common variety of periodic variable star. Our observations reveal instead a 3.56hr periodclose binary, pulsing in brightness on a period of 1.97min. The pulses are so intense thatAR Sco’s optical flux can increase by a factor of four within 30 s, and they are detectableat radio frequencies, the first such detection for any white dwarf system. They reflect thespin of a magnetic white dwarf which we find to be slowing down on a 107 yr timescale. Thespin-down power is an order of magnitude larger than that seen in electromagnetic radia-tion, which, together with an absence of obvious signs of accretion, suggests that AR Sco isprimarily spin-powered. Although the pulsations are driven by the white dwarf’s spin, theyoriginate in large part from the cool star. AR Sco’s broad-band spectrum is characteristicof synchrotron radiation, requiring relativistic electrons. These must either originate fromnear the white dwarf or be generated in situ at the M star through direct interaction with thewhite dwarf’s magnetosphere.
AR Sco’s brightness varies on a 3.56 h period (Fig. 1a); it was this that caused the δ-Scuticlassification5. The scatter visible in Fig. 1a prompted us to take optical photometry with the high-speed camera ULTRACAM6. These data and follow-up observations taken in the ultraviolet andnear-infrared (Extended Data Table 1) all show strong double-humped pulsations on a fundamentalperiod of 1.97 min (Figs 2 and 3); the scatter in Fig.1a is the result of the pulsations. Most unusuallyof all, an hour-long observation at radio frequencies with the Australia Telescope Compact Array(ATCA) also shows the pulsations (Figs 2d, 2e and 3d). The pulse fraction, (fmax− fmin)/(fmax +
fmin), exceeds 95 % in the far ultraviolet (Fig. 2), and is still 10 % at 9 GHz in the radio. Only inX-rays did we not detect pulses (pulse fraction < 30 % at 99.7 % confidence). AR Sco’s opticalmagnitude (g′) varies from 16.9 at its faintest to 13.6 at its peak, a factor of 20 in flux.
We acquired optical spectra which show a cool M-type main-sequence star (Extended DataFig. 1) with absorption lines that change radial velocity sinusoidally on the 3.56 h period withamplitude K2 = (295± 4) km s−1 (Fig. 1b; we use subscripts “1” and “2” to indicate the com-pact star and the M star respectively). The 3.56 h period is therefore the orbital period of a closebinary star. The M star’s radial velocity amplitude sets a lower limit on the mass of its compan-ion of M1 ≥ (0.395± 0.016) M�. The compact object is not visible in the spectra, consistentwith either a white dwarf or a neutron star, the only two types of object which can both supporta misaligned magnetic dipole and spin fast enough to match the pulsations. The optical and ul-traviolet spectra show atomic emission lines (Extended Data Figs. 1 and 2) which originate fromthe side of the M star facing the compact object (Extended Data Fig. 3). Their velocity ampli-tude relative to the M star sets a lower limit upon the mass ratio q = M2/M1 > 0.35 (ExtendedData Fig. 4). This, along with the requirement that the M star fits within its Roche lobe, definesmass ranges for each star of 0.81 M� < M1
<∼ 1.29 M� and 0.28 M� < M2<∼ 0.45 M�. The
2

M star’s spectral type (M5) suggests that its mass lies at the lower end of the allowed range forM2. Assuming that the M star is close to its Roche lobe, its brightness leads to a distance estimated = (M2/0.3 M�)1/3(116± 16) pc.
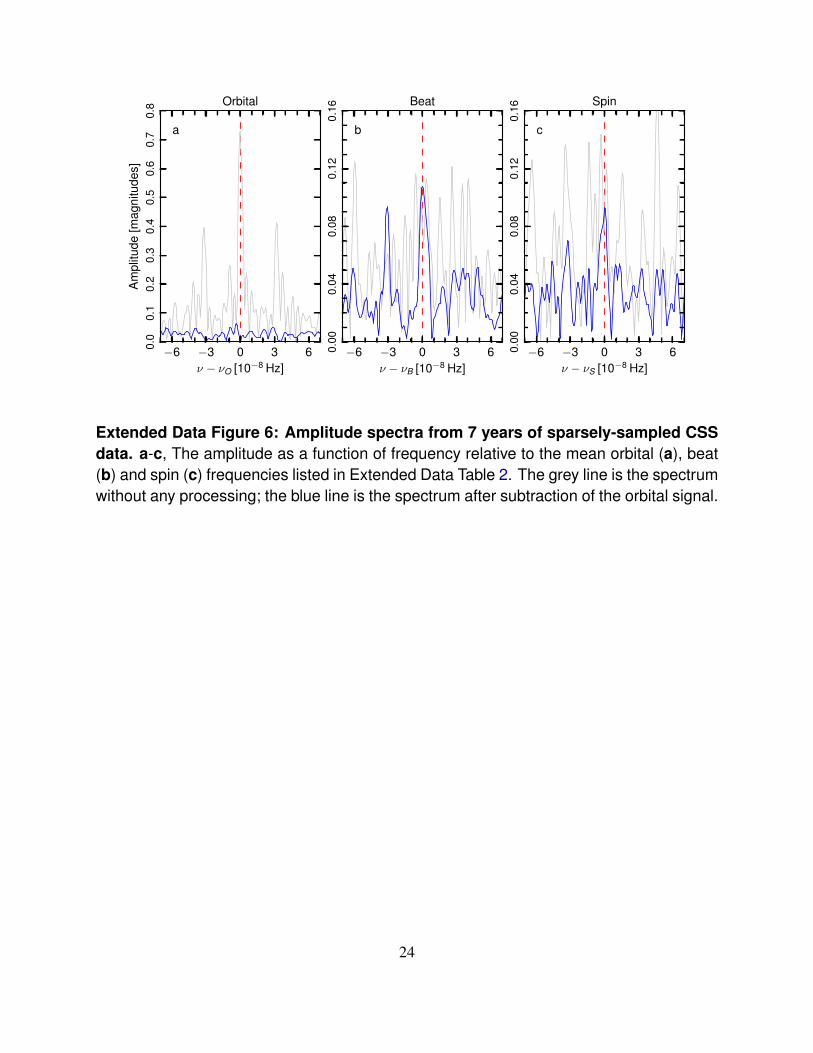
The amplitude spectra of the pulsations show the presence of two components of similarfrequency (Fig. 3). Using our own monitoring and archival optical data spanning 7 years7, wemeasured precise values for the frequencies of these components, finding their difference to bewithin 20 parts per million of the orbital frequency, νO (Extended Data Figs 5 and 6, ExtendedData Table 2). The natural interpretation is that the higher frequency component represents thespin frequency νS of the compact star (PS = 1.95 min), while its lower frequency and generallystronger counterpart is a re-processed or “beat” frequency νB = νS−νO (PB = 1.97 min), assumingthat the compact star spins in the same sense as the binary orbit.
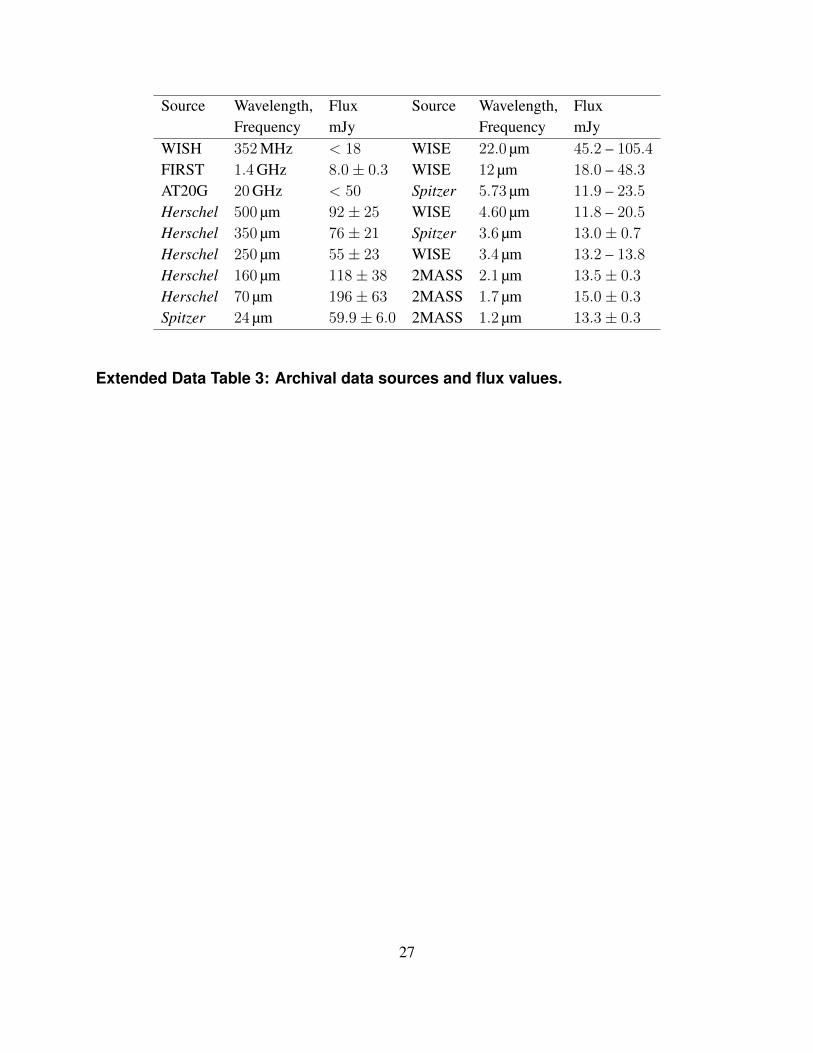
AR Sco emits across the electromagnetic spectrum (Fig. 4, Extended Data Table 3), and,in the infrared and radio in particular, is orders of magnitudes brighter than the thermal emissionfrom its component stars represented by model atmospheres8,9 in Fig. 4. Integrating over thespectral energy distribution (SED) shown in Fig. 4 and adopting a distance of 116 pc, we find amaximum luminosity of ≈ 6.3× 1025 W and a mean of L ≈ 1.7× 1025 W, well in excess of thecombined luminosities of the stellar components L? = 4.4× 1024 W. The two possible sourcesof this luminosity are accretion and spin-down power of the compact object. A spinning object ofmoment of inertia I loses energy at a rate Lν = −4π2IνSνS where νS and νS are the spin frequencyand its time derivative. Using the archival optical data we measured the spin frequency to beslowing, with a frequency derivative of νS = −(2.86± 0.36)× 10−17 Hz s−1. For parameterstypical of neutron stars and white dwarfs (MNS = 1.4 M�, RNS = 10 km; MWD = 0.8 M�,RWD = 0.01 R�), this leads to Lν(NS) = 1.1× 10²¹ W and Lν(WD) = 1.5× 1026 W. Comparedto the mean luminosity in excess of the stellar contributions, L+ = L − L? = 1.3× 1025 W,this shows that spin-down luminosity is sufficient to power the system if the compact object isa white dwarf but not if it is a neutron star. Accretion is the only possible power source in thecase of a neutron star – an accretion rate of MNS = 1.0× 10⁻¹⁴ M� yr−1 suffices. Accretioncould partially power a white dwarf, but it cannot be the main source because the rate required,MWD = 1.3× 10⁻¹¹ M� yr−1, is high enough that we should see Doppler-broadened emissionlines from the accreting gas whereas AR Sco only shows features from the M star.
The observations point toward a white dwarf as the compact object. First, AR Sco’s distanceof 116 pc is an order of magnitude closer than the nearest accreting neutron star known, Cen X-410, but typical of white dwarf / main-sequence binaries (closer systems are known11). Second,AR Sco’s X-ray luminosity, LX = 4.9× 10²³ W, is only 4 % of the largely-optical luminosityexcess, L+. By contrast, the X-ray luminosities of accreting neutron stars are typically 100 times
3

their optical luminosities12. Third, at PS = 1.95 min, AR Sco has a spin period an order of magni-tude longer than any (neutron star powered) radio pulsar known13. Finally, the upper limit massesM1 = 1.29 M� and M2 = 0.45 M� are simultaneously low for a neutron star but high for an M5M star. A 0.8 M� white dwarf with a 0.3 M� M dwarf is a more natural pairing.
AR Sco’s observational properties are unique. It may represent an evolutionary stage of aclass of stars known as intermediate polars (IPs), which feature spinning magnetic white dwarfsaccreting from low-mass stars in close binaries14. Only one IP, AE Aquarii (AE Aqr), has a broad-band SED similar to AR Sco15 and comparably strong radio emission16, although it shows noradio pulsations17 (< 0.8 %) and its 0.4 % optical pulsations compare with 70 % in AR Sco. Witha 25 % pulse fraction, even the IP with the strongest-known optical pulsations, FO Aquarii18, fallswell short of AR Sco. A key difference is perhaps the lack of significant accretion in AR Scocompared to the IPs. This can be seen from its X-ray luminosity which is less than 1 % of the X-ray luminosity of a typical IP19, but above all from its optical and ultraviolet emission lines whichcome entirely from the irradiated face of the M star. IPs by contrast show Doppler-broadened lineemission, often from accretion discs, and even AE Aqr, which is in an unusual “propeller” state inwhich transferred matter is expelled upon encountering the magnetosphere of its rapidly-spinningPS = 33 s white dwarf20,21, shows broad and stochastically variable line emission. We can findno analogue of AR Sco’s radio properties. Pulsed radio emission has been detected from browndwarfs and M stars22,23, but the broad-band nature of AR Sco’s emission, its short pulsation period,and lack of circular polarisation (our ATCA data constrain it to < 10 %), distinguish it from thesesources.
The white dwarf in AR Sco is currently spinning down on a timescale τ = ν/ν = 107 yr.White dwarfs are not born spinning rapidly24, and a prior stage of accretion-driven spin-up isrequired. Depending upon the distance at which the accreting material coupled to the white dwarf’smagnetic field, between 0.002 M� and 0.015 M� of matter are required to reach PS = 1.95 min.For an accretion rate of 10−9 M� yr−1, typical of similar period systems, this takes from 2× 10⁷ yrto 1.5× 10⁸ yr. Both spin-up and spin-down timescales are much shorter than the likely age of thesystem: the cooling age of the white dwarf alone exceeds 1.2× 10⁹ yr25. Thus we could be seeingone of many such episodes in AR Sco’s history. There is empirical evidence for similar cycling ofaccretion rate in both white dwarf26,27 and neutron star binary systems28,29. If so, since the spin-upand spin-down timescales are similar in magnitude, there would be a good chance of catching thespin-down phase.
AR Sco’s extremely broad-band SED is indicative of synchrotron emission from relativisticelectrons. A significant fraction appears to come from the cool M star. We infer this from thedominant beat frequency component that in the absence of accretion can only come from the M
4

star. Since the M star occupies ∼ 1/40th of the sky as seen from the white dwarf, while the spin-down luminosity is ∼ 11.5 times the mean electromagnetic power, this requires a mechanism totransfer energy from the white dwarf to the M dwarf which is more than 40/11.5 = 3.5 times moreefficient than the interception of isotropically-emitted radiation. At the same time, direct pulsedemission from the white dwarf must not overwhelm the re-processed component. Two possibilitiesare collimated fast particle outflows and direct interaction of the white dwarf’s magnetosphere withthe M dwarf, but the exact emission mechanism operative in AR Sco is perhaps its most mysteriousfeature.
5

References
1. Althaus, L. G., Althaus, L. G., Isern, J. & Garcıa-Berro, E. Evolutionary and pulsationalproperties of white dwarf stars. Astron. & Astrophys. Review 18, 471–566 (2010).
2. Szkody, P. et al. Cataclysmic Variables from the Sloan Digital Sky Survey. VIII. The FinalYear (2007-2008). Astron. J. 142, 181–189 (2011).
3. Revnivtsev, M., Revnivtsev, M., Revnivtsev, M., Ritter, H. & Sunyaev, R. Properties of theGalactic population of cataclysmic variables in hard X-rays. Astron. & Astrophys. 489,1121–1127 (2008).
4. Parsons, S. G. et al. A magnetic white dwarf in a detached eclipsing binary. Mon. Not. R.Astron. Soc. 436, 241–252 (2013).
5. Satyvaldiev, V. On seventeen variable stars. Astronomicheskij Tsirkulyar 633, 7–8 (1971).
6. Dhillon, V. S. et al. ULTRACAM: an ultrafast, triple-beam CCD camera for high-speedastrophysics. Mon. Not. R. Astron. Soc. 378, 825–840 (2007).
7. Drake, A. J. et al. First Results from the Catalina Real-Time Transient Survey. Astrophys. J.696, 870–884 (2009).
8. Koester, D. White dwarf spectra and atmosphere models . Mem. della Soc. Astron. Italiana81, 921–931 (2010).
9. Husser, T.-O. et al. A new extensive library of PHOENIX stellar atmospheres and syntheticspectra. Astron. & Astrophys. 553, A6: 1–9 (2013).
10. Chevalier, C., Chevalier, C., Chevalier, C., Pedersen, H. & van der Klis, M. Optical studiesof transient low-mass X-ray binaries in quiescence. I - Centaurus X-4: Orbital period, lightcurve, spectrum and models for the system. Astron. & Astrophys. 210, 114–126 (1989).
11. Thorstensen, J. R., Lepine, S. & Shara, M. Parallax and Distance Estimates for TwelveCataclysmic Variable Stars. Astron. J. 136, 2107–2114 (2008).
12. Bradt, H. V. D. & McClintock, J. E. The optical counterparts of compact galactic X-raysources. Ann. Rev. Astron. & Astrophys. 21, 13–66 (1983).
13. Manchester, R. N., Manchester, R. N., Teoh, A. & Hobbs, M. The Australia Telescope Na-tional Facility Pulsar Catalogue. Astron. J. 129, 1993–2006 (2005).
14. Patterson, J. The DQ Herculis stars. Publ. Astron. Soc. Pacif. 106, 209–238 (1994).
6

15. Oruru, B. & Meintjes, P. J. X-ray characteristics and the spectral energy distribution of AEAquarii. Mon. Not. R. Astron. Soc. 421, 1557–1568 (2012).
16. Bookbinder, J. A. & Lamb, D. Q. Discovery of radio emission from AE Aquarii. Astrophys.J. Lett. 323, L131–L135 (1987).
17. Bastian, T. S., Beasley, A. J. & Bookbinder, J. A. A Search for Radio Pulsations from AEAquarii. Astrophys. J. 461, 1016–1020 (1996).
18. Patterson, J. & Steiner, J. E. H2215-086 -King of the DQ Herculis stars. Astrophys. J. Lett.264, L61–L64 (1983).
19. Pretorius, M. L. & Mukai, K. Constraints on the space density of intermediate polars fromthe Swift-BAT survey. Mon. Not. R. Astron. Soc. 442, 2580–2585 (2014).
20. Wynn, G. A., King, A. R. & Horne, K. A magnetic propeller in the cataclysmic variable AEAquarii. Mon. Not. R. Astron. Soc. 286, 436–446 (1997).
21. Meintjes, P. J. & Venter, L. A. The diamagnetic blob propeller in AE Aquarii and non-thermal radio to mid-infrared emission. Mon. Not. R. Astron. Soc. 360, 573–582 (2005).
22. Berger, E. et al. Discovery of radio emission from the brown dwarf LP944-20. Nature 410,338–340 (2001).
23. Hallinan, G. et al. Periodic Bursts of Coherent Radio Emission from an Ultracool Dwarf.Astrophys. J. Lett. 663, L25–L28 (2007).
24. Charpinet, S., Fontaine, G. & Brassard, P. Seismic evidence for the loss of stellar angularmomentum before the white-dwarf stage. Nature 461, 501–503 (2009).
25. Renedo, I. et al. New Cooling Sequences for Old White Dwarfs. Astrophys. J. 717, 183–195(2010).
26. Hessman, F. V., Gansicke, B. T. & Mattei, J. A. The history and source of mass-transfervariations in AM Herculis. Astron. & Astrophys. 361, 952–958 (2000).
27. Manser, C. J. & Gansicke, B. T. Spectroscopy of the enigmatic short-period cataclysmicvariable IR Com in an extended low state. Mon. Not. R. Astron. Soc. 442, L23–L27 (2014).
28. Archibald, A. M. et al. A Radio Pulsar/X-ray Binary Link. Science 324, 1411–1414 (2009).
29. Papitto, A. et al. Swings between rotation and accretion power in a binary millisecond pulsar.Nature 501, 517–520 (2013).
7

Acknowledgements TRM, ERS, DS, EB, PJW, VSD, SPL and ULTRACAM were supported by the Sci-ence and Technology Facilities Council (STFC, ST/L000733 and ST/M001350/1). BTG, AP and PGJ ac-knowledge support from the European Research Council (ERC, 320964 and 647208). OT, SGP and MRSacknowledge support from Fondecyt (3140585 and 1141269). MRS also received support from MilleniumNucleus RC130007 (Chilean Ministry of Economy). AA acknowledges support from the Thailand ResearchFund (MRG5680152) and the National Research Council of Thailand (R2559B034). Based on observationscollected with telescopes of the Isaac Newton Group in the Spanish Observatorio del Roque de los Mucha-chos of the Instituto de Astrofısica de Canarias, the European Organisation for Astronomical Research inthe Southern Hemisphere (095.D-0489, 095.D-0739, 095.D-0802), the NASA/ESA Hubble Space Tele-scope (14470), and the Thai National Telescope. Archival data from the Herschel, Spitzer and WISE spaceobservatories, and from the Catalina Sky Survey were used. We thank the Swift mission PI for a target-of-opportunity program on AR Sco with the XRT and UVOT instruments, and the Director of ATCA for theaward of Director’s Discretionary Time.
Competing Interests The authors declare that they have no competing financial interests.
Author contributions TRM organised observations, analysed the data, interpreted the results and was theprimary author of the manuscript. BTG, AFP, EB, SGP, PGJ, JvR, TK, MRS, and OT acquired, reduced andanalysed optical and ultraviolet spectroscopy. ERS acquired, reduced and analysed the ATCA radio data.SH, FJH, KB, CL and PF first identified the unusual nature of AR Sco and started the optical monitoringcampaign. VSD, LKH, SPL, AA, SA, JJB and CAH acquired and reduced the high-speed optical photom-etry. DTS and PJW acquired and analysed Swift and archival X-ray data. DK calculated the white dwarfmodel atmosphere. All authors commented on the manuscript.
Correspondence Correspondence and requests for materials should be addressed to TRM.(email: [email protected]).
8
0
4
8
12
R-b
and
flux
[mJy
] a
0.0 0.5 1.0 1.5 2.0
Orbital phase [cycles]
−300
0
300
Rad
ialv
eloc
ity[k
m/s
] b
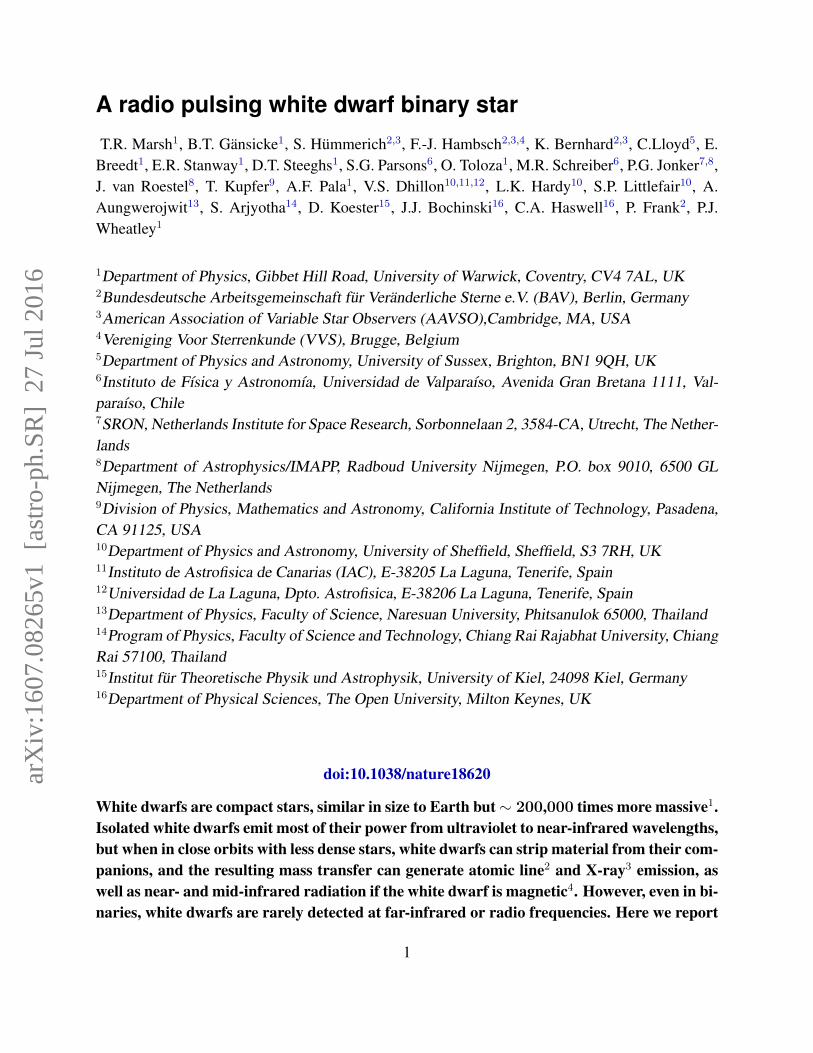
Figure 1: AR Sco’s optical brightness and radial velocity curve. a, Photometry (30 sexposures) taken over 7 years shows a factor four variation in brightness on a 3.56 hperiod, with large scatter at some phases. b, The M star varies sinusoidally in velocity onthe same period, showing it to be the orbital period of a close, circular orbit binary star.The orbital phase is defined so that at phase 0 the M star is at its closest point to Earth.±1σ error bars are shown, but are too small to see in b.
9

0.0
0.4
0.8
1.2
1.6 aHST/COSλ = 0.132µm
e
0
4
8
12 bg′, WHT/ULTRACAMλ = 0.48µm
f
0
20
40
cKS , VLT/HAWK-Iλ = 2.16µm
g
0.0 0.2 0.4 0.6 0.8 1.0
Orbital phase [cycles]
0
4
8
12
16 d9.0 GHz, ATCAλ = 3.33 cm
1.0 1.5 2.0 2.5 3.0 3.5 4.0
Beat phase [cycles]
h
Flux
dens
ity[m
Jy]
Figure 2: Ultraviolet, optical, infrared and radio fluxes of AR Sco. a–d, High-speedmeasurements of the UV, optical, infrared and radio fluxes of AR Sco plotted againstorbital phase. Sections of similar orbital phases, marked by dashed lines, are shownexpanded in e–h where they are plotted against the beat pulsation phase. Black dotsmark individual measurements. None of the four sets of data were taken simultaneouslyin time. The different colours in a indicate that the data were acquired in different orbitalcycles.
10

0.0
0.2
0.4
0.6
0.8
HSTa
0.00
0.05
0.10
0.15 g′b
0.00
0.05
0.10
0.15 KS
c
6 8 10 12 14 16 18
Frequency [mHz]
0.00
0.02
0.04
0.06
0.085.5 Ghz9.0 Ghz
d
Frac
tiona
lam
plitu
de
Figure 3: Fourier amplitudes of the ultraviolet, optical, infrared and radio fluxesof AR Sco versus temporal frequency . a–d are the amplitude spectra correspondingto a–d of the light-curves of Fig. 2. All bands show signals with a fundamental periodof ∼ 1.97 min (8.46 mHz) and its second harmonic. The signals have two components,clearest in the harmonic, which we identify as the spin frequency νS and “beat” frequencyνB = νS−νO, where νO is the orbital frequency. The beat component is the stronger of thetwo and defines the dominant 1.97 min pulsation period; the spin period is 1.95 min.
11

108 109 1010 1011 1012 1013 1014 1015 1016 1017 1018 1019
Frequency ν [Hz]
10−20
10−19
10−18
10−17
10−16
10−15
10−14
10−13
10−12ν
f ν[W
m−
2]
21cm ATCA Herschel S/W Ks H J i′ g′ u′ UVW1
HST
Swift XRT
Figure 4: The wide band Spectral Energy Distribution (SED) of AR Sco. Black barsshow the range spanned by intensive, time-resolved data; grey bars represent more lim-ited datasets spanning less than the full variation. Grey points with error bars (1σ) repre-sent single exposures. The grey lines represent the ±1σ range of X-ray spectral slopes.Triangles are upper-limits. “S/W” marks data from Spitzer and WISE. The red and bluelines show model atmospheres, extended at long wavelengths with black-body spectra,for the M star (R2 = 0.36 R�, T2 = 3100 K) and white dwarf (R1 = 0.01 R�, T2 = 9750 Kupper limit) at a distance d = 116 pc. See Extended Data Tables 1 and 3 for details of datasources.
12

Methods
Data sources. AR Sco’s location in the ecliptic plane, not far from the Galactic centre and only2.5◦ North-West of the centre of the Ophiuchus molecular cloud, means that it appears in manyarchival observations. It is detected in the FIRST 21 cm radio survey30, the Two Micron All SkySurvey (2MASS)31, the Catalina Sky Survey (CSS)7, and in the Herschel, WISE and Spitzer in-frared satellite archives32,33,34. Useful upper limits come from non-detections in the AustraliaTelescope 20 GHz (AT20G) survey35 and the WISH survey36. Flux measurements, ranges (whentime resolved data are available) and upper limits from these sources are listed in Extended DataTable 3.
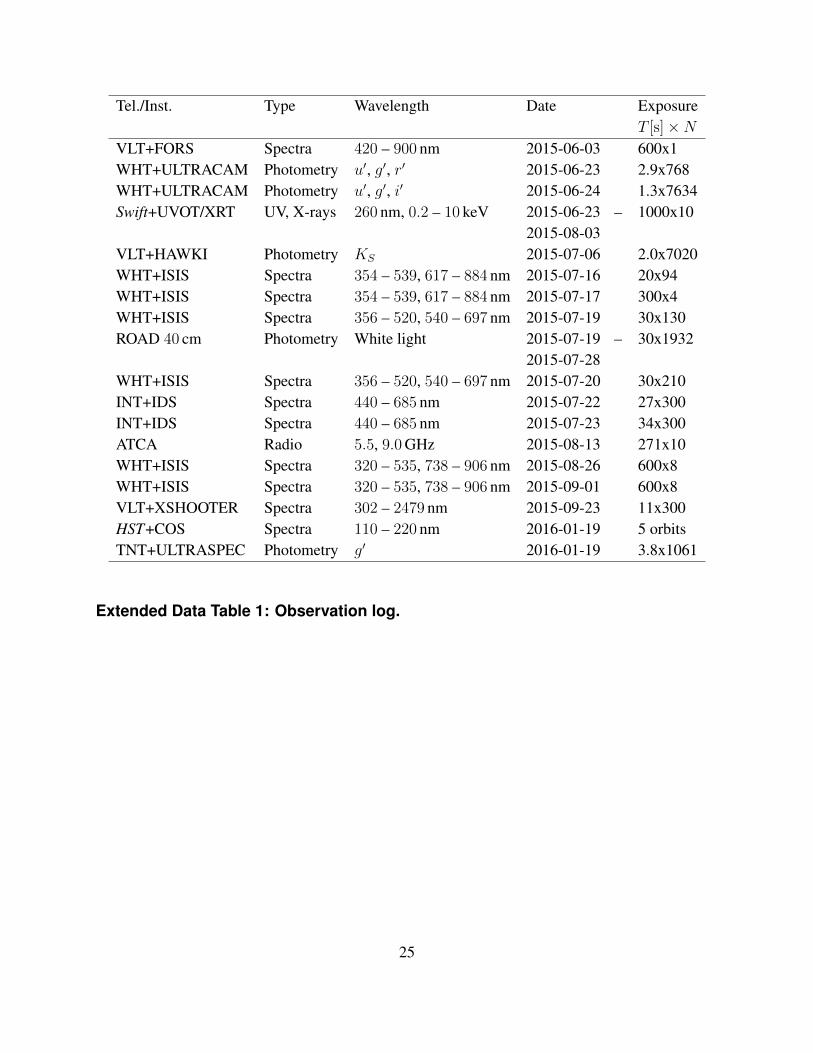
We supplemented these data with our own intensive observations on a variety of telescopesand instruments, namely: the 8.2 m Very Large Telescope (VLT) with the FORS and X-SHOOTERoptical/NIR spectrographs and the HAWK-I NIR imager; the 4.2 m William Herschel Telescope(WHT) with the ISIS spectrograph and the ULTRACAM high-speed camera6; the 2.5 m IsaacNewton Telescope (INT) with the Intermediate Dispersion Spectrograph (IDS); the 2.4 m ThaiNational Telescope with the ULTRASPEC high-speed camera37; the UV/optical and X-ray instru-ments UVOT and XRT on the Swift satellite; the COS UV spectrograph on the Hubble SpaceTelescope, HST; radio observations on the Australia Telescope Compact Array (ATCA). Opti-cal monitoring data came from a number of small telescopes. We include here data taken with a406 mm telescope at the Remote Observatory Atacama Desert (ROAD) in San Pedro de Atacama38.Extended Data Table 1 summarises these observations.
The orbital, spin and beat frequencies. The orbital, spin and beat frequencies were best mea-sured from the small-telescope data because of their large time-base. For example, see the ampli-tude spectrum around the spin/beat components of the clear filter data from 19–28 July 2015 shownin Extended Data Fig. 5. The final frequencies, which give the dashed lines of Extended DataFig. 5, were obtained from the CSS data. These consisted of 305 exposures each 30-seconds induration spanning the interval 30 May 2006 until 8 July 2013. We rejected 6 points which lay morethan 4σ from the multi-sinusoid fits that we now describe. To search for signals in these sparsely-sampled data, we first transformed the UTC times of the CSS data to a uniform timescale (TDB)and then corrected these for light-travel delays to the solar system barycentre. The periodogram ofthese data is dominated by the strong orbital modulation, which leaks so much power across thespectrum owing to the sparse sampling that the spin/beat component can only be seen after the or-bital signal is removed. Once this was done, beat and spin components matching those of ExtendedData Fig. 5 could be identified (Extended Data Fig. 6). We carried out bootstrap multi-sinusoid fitsto compute the distributions of the orbital, beat and spin frequencies. The orbital frequency closelyfollows a Gaussian distribution; the beat and spin distributions are somewhat non-Gaussian in theirhigh and low frequency wings respectively, but are nevertheless well-defined. Statistics computed
13

from these distributions are listed in Extended Data Table 2.
Having established that the two pulsation frequencies are separated by the orbital frequency,we carried out a final set of fits in which we enforced the relation νS − νB = νO, but also allowedfor a linear drift of the pulsation frequency in order to be sensitive to any change in the pulsationfrequency. This led to a significant improvement in χ2 (> 99.99% significance on an F -test) whichdropped from 326 to 289 for the 299 fitted points relative to a model in which the frequencies didnot vary (after scaling uncertainties to yield χ2/N ≈ 1 for the final fit). Bootstrap fits gave anear-Gaussian distribution for the frequency derivative with ν = −(2.86± 0.36)× 10−17 Hz s−1.
Pulsations are detected at all wavelengths with suitable data other than X-rays, where limitedsignal (≈ 630 source photons in 10.2 ks) leads to the upper limit of a 30 % pulse fraction quoted inthe main text. The Swift X-ray observations were taken in 1000 s chunks over the course of morethan one month and we searched for the pulsations by folding into 20 bins and fitting a sinusoid tothe result. There were no significant signals on either the beat or spin periods or their harmonics.We used a power-law fit to the X-ray spectrum to deduce the slopes shown in Fig. 4.
The M star’s spectral type and distance. The CSS data establish the orbital period P = 0.14853528(8) d,but not the absolute phase of the binary. This we derived from observations of the M star, whichalso led to a useful constraint upon the distance to the system. The VLT+FORS data were takenshortly before the photometric minimum, allowing a clear view of the M star’s contribution. Weused M star spectral-type templates developed from SDSS spectra39 to fit AR Sco’s spectrum, ap-plying a flux scaling factor α to the selected template and adding a smooth continuum to representany extra flux in addition to the M star. The smooth spectrum was parameterised by exp(a1 + a2λ)
to ensure positivity. The coefficients a1, a2 and α were optimised for each template, with emissionlines masked since they are not modelled by the smooth spectrum. Out of the templates available(M0-9 in unit steps), the M5 spectrum gave by far the best match with χ2 = 24,029 for 1165points fitted compared to > 100,000 for the M4 and M6 templates on either side (Extended DataFig. 1). The templates used were normalised such that the scaling factor α = (R2/d)2. We foundα = 3.02 × 10⁻²¹, so R2/d = 5.5 × 10⁻¹¹. Assuming that the M star is close to its Roche lobe(there is evidence supporting this assumption in the form of ellipsoidal modulations of the minimabetween pulsations in the HAWK-I data, Fig. 2), its mean density is fixed by the orbital period,which means that its radius is fixed by its mass. Assuming M2 = 0.3 M�, for reasons outlined inthe main text, we find that R2 = 0.36 R�, and hence d = 149 pc. This is an overestimate as theFORS spectrum was taken through a narrow slit. We estimated a correction factor by calculatingthe i′-band flux of the spectrum (2.50 mJy) and comparing it to the mean i′-band flux (4.11 mJy)of the ULTRACAM photometry over the same range of orbital phase. This is approximate giventhat the ULTRACAM data were not taken simultaneously with the FORS data and there may bestochastic variations in brightness from orbit-to-orbit, however the implied 61 % throughput is
14

plausible given the slit width of 0.7” and seeing of ∼ 1”. The final result is the distance quoted inthe main text of d = (116± 16) pc, and allows for uncertainties in the calibration of the surfacebrightness of the templates and in the slit-loss correction.
We used the radius, spectral type and distance to estimate the KS flux density from thedonor as fKs = 9.4 mJy. The minimum observed flux density from the HAWK-I data is 9.1 mJy.Uncertainties in the extrapolation required to estimate theKS flux and from ellipsoidal modulationsallow the numbers to be compatible, but they suggest that the estimated distance is as low as it canbe and that the M star dominates the KS flux at minimum light. The estimated M star fluxes for i′
and g′, fi′ = 1.79 mJy and fg′ = 0.07 mJy, are comfortably less than the minimum observed fluxesof 2.57 mJy and 0.624 mJy in the same bands. We do not detect the white dwarf. The strongestconstraint comes from the HST far ultraviolet data which at its lowest require T1 < 9750 K. Awhite dwarf model atmosphere of T = 9750 K, log g = 8, corrected for slit-losses is plotted inFig. 1, and also (without slit losses) in Fig. 2 which shows the average HST spectrum. Given thesmall maximum contribution of the white dwarf seen in these figures, the absence of absorptionfeatures from the white dwarf is unsurprising.
The M star’s radial velocity. We used spectra taken with the ISIS spectrograph on the WHT andX-SHOOTER on the VLT to measure radial velocities of the M star using the NaI 8200 doubletlines. These vary sinusoidally on the same 3.56 h period as the slowest photometric variation(Fig. 1), hence our identification of this period as the orbital period. We fitted the velocities with
VR = γ +K2 sin (2π(t− T0)/P ) ,
with the period fixed at the value obtained from the CSS data, P = 0.14853528 d, and the systemicoffset γ allowed to float free for each distinct subset of the data to allow for variable offsets. Wefound K2 = (295± 4) km s−1 and T0 = 57264.09615(33) d, thus the orbital ephemeris of AR Scois
BMJD(TDB) = 57264.09615(33) + 0.14853528(8)E,
where E is the cycle number, and the time scale is TDB, corrected to the barycentre of the solarsystem, expressed as a Modified Julian Day number (MJD = JD − 2400000.5). This ephemerisis important in establishing the origin of the emission lines, as will be shown below.
The radial velocity amplitude and orbital period along with Kepler’s third law define the“mass function”
M31 sin3 i
(M1 +M2)2=PK3
2
2πG= (0.395± 0.016) M�,
where i is the orbital inclination. This is a hard lower limit to the mass of the compact object,M1, which is only met for i = 90◦ and M2 = 0. There is however a caveat to this statement: itis sometimes observed that irradiation can weaken the absorption lines on the side of the cool star
15
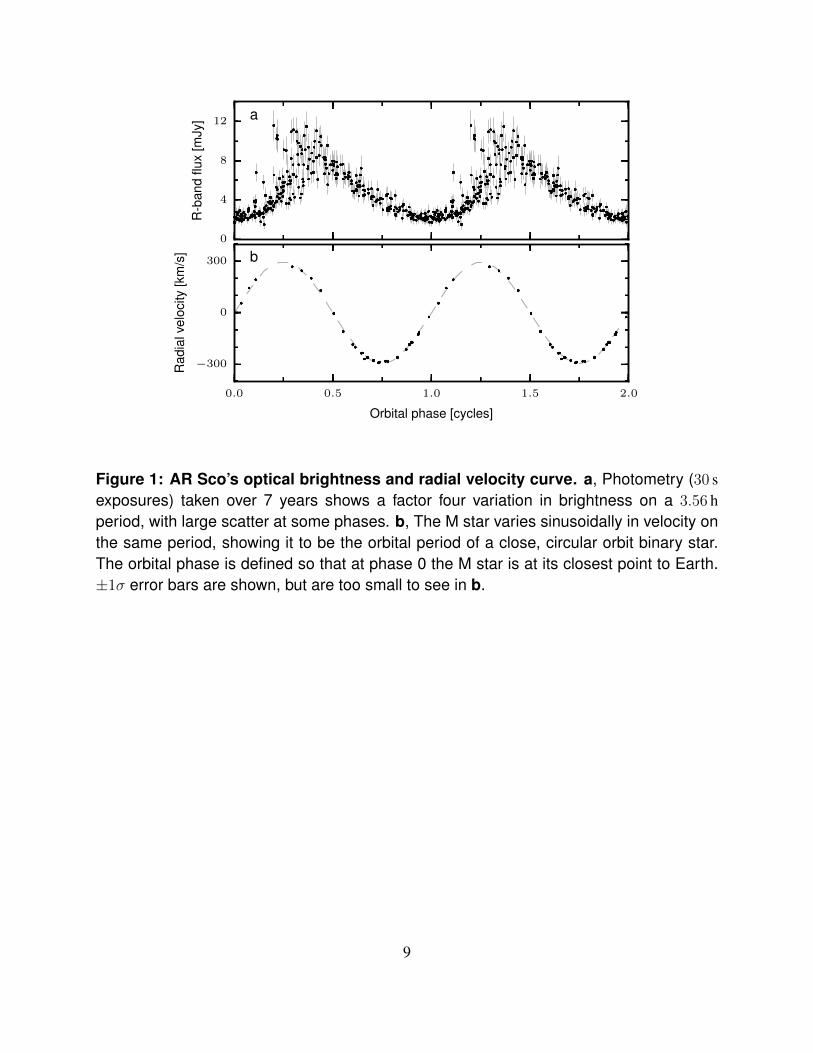
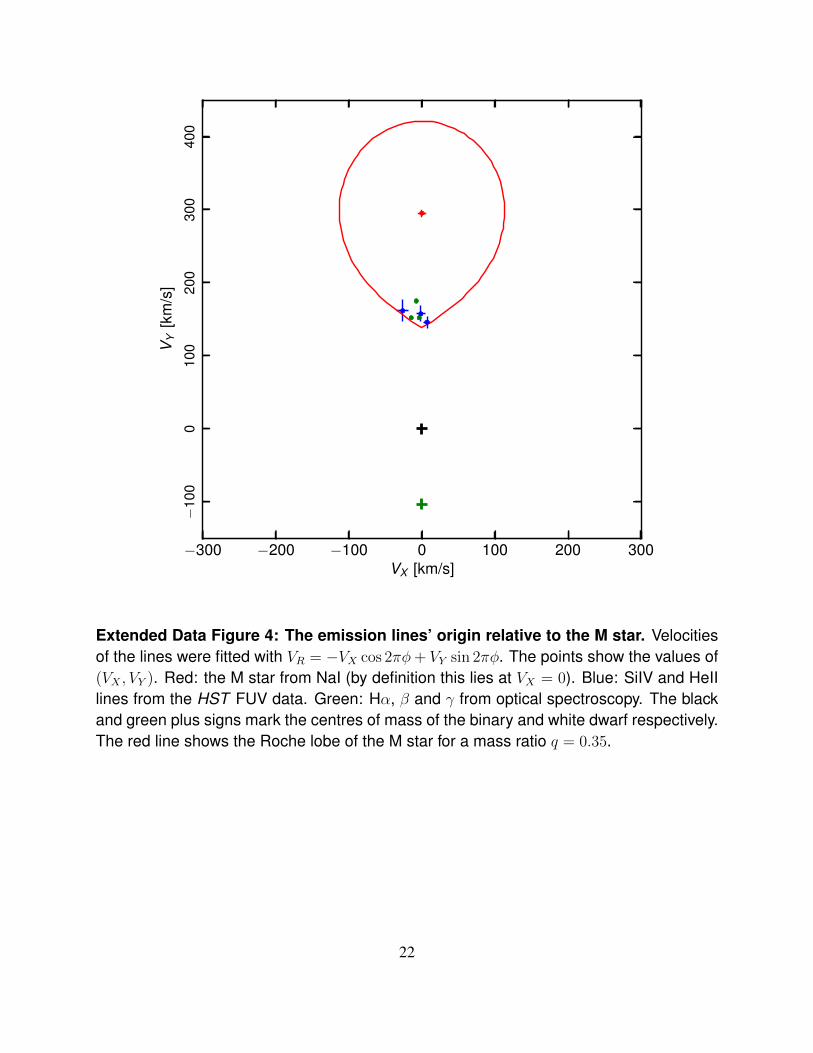
facing the compact object causing the observed radial velocity amplitude to be an over-estimateof the true amplitude40,41. If this effect applied here, which we suspect it might, both K and themass function limit would need to be reduced. Given the large intrinsic variability of AR Sco, andthe lack of flux-calibrated spectra, it was not possible to measure the absolute strength of NaI. Weattempted therefore to search for the influence of irradiation from another side effect, which is thatit causes the radial velocity to vary non-sinusoidally42. We failed to detect any obvious influenceof irradiation through this method, but its effectiveness may be limited by the heterogeneous natureof our data which required multiple systematic velocity offsets. Despite our failure to detect clearsigns of the effect of irradiation upon the M star’s radial velocities, we would not be surprised ifthe true value of K was anything up to ∼ 20 km s−1 lower than we measure. However, with noclear evidence for the effect, in this we paper we proceed on the basis that we have measured thetrue value of the M star’s centre of mass radial velocity amplitude. This is conservative in the sensethat any reduction in K would move the mass limits we deduce to lower values, which would tiltthe balance even more heavily towards a white dwarf as the compact star. The UV and opticalemission lines come from the irradiated face of the M star and their amplitude compared to K2 setsa lower limit to the relative size of the M star, and hence, through Roche geometry, the mass ratioq = M2/M1. Extended Data Fig. 4 shows how the emission measurements lead to the quoted limitof q > 0.35, which leads in turn to the lower limits M1 > 0.81 M� and M2 > 0.28 M� quoted inthe main text.
The orbital period of a binary star sets a lower limit on the mean densities of its componentstars43. Since the mean densities of main-sequence stars decrease with increasing mass, this im-plies that we can set an upper limit to the mass of any main-sequence component. In the case ofAR Sco we find that 〈ρ2〉 > 8900 kg m−3 which leads to M2 < 0.42 M�; the slightly larger valueof 0.45 M� quoted in the text allows for uncertainty in the models. The limit becomes an equalitywhen the M star fills its Roche lobe, which we believe to be the case, or very nearly so, for AR Sco.However, we expect that even in this case the number deduced still functions as an upper limit be-cause the mass-losing stars in close binaries are generally over-sized and therefore less dense thanmain-sequence stars of the same mass44. Indeed, systems with similar orbital periods to that ofAR Sco have donor star masses in the range 0.2 M� to 0.3 M�44. This, and the M5 spectral type,are why we favour a mass of M2 ≈ 0.3 M�, close to the lower limit on M2.
Brightness temperature at radio wavelengths. The pulsations in radio flux are a remarkablefeature of AR Sco, unique amongst known white dwarfs and white dwarf binaries. If we assumethat, as at other wavelengths, and as suggested by the alignment of the second harmonic powerwith 2νB (Extended Data Fig. 3), they arise largely from the M star, then we can deduce brightnesstemperatures from the relation
Tb =λ2
2πk
(d
R2
)2
fν .
16

These work out to be≈ 1012 K and≈ 1013 K for the observations at ν = 5.5 GHz and ν = 1.4 GHzrespectively. Although the value at the lowest frequency exceeds the ∼ 1012 K limit at whichsevere cooling of the electrons due to inverse Compton scattering is thought to occur45, this isnot necessarily a serious issue given the short-term variability exhibited by the source. The limitscan be lowered by appealing to a larger emission region as the radio data in hand are not enoughto be certain that emission arises solely on the M star. Even so, the 0.98 min second harmonicpulsations that are seen in the radio flux suggest an upper limit to the size of the emission regionof 25 R� from light-travel time alone. This implies a minimum brightness temperature of 109 Kat 1.4 GHz, showing clearly that the radio emission is non-thermal in origin. We assume thatsynchrotron emission dominates; while there may be thermal and cyclotron components at shorterwavelengths, there is no clear evidence for either.
Code availability. The data were reduced with standard instruments pipelines for the HST, VLT,and Swift data. The WHT and INT data were reduced with STARLINK software. Scripts forcreating the figures are available from the first author apart from the code for computing the whitedwarf model atmosphere, which is a legacy F77 code and complex to export. The atmospheremodel itself however is available on request.
30. Becker, R. H., White, R. L. & Helfand, D. J. The FIRST Survey: Faint Images of the RadioSky at Twenty Centimeters. Astrophys. J. 450, 559–577 (1995).
31. Skrutskie, M. F. et al. The Two Micron All Sky Survey (2MASS). Astron. J. 131, 1163–1183(2006).
32. Pilbratt, G. L. et al. Herschel Space Observatory. An ESA facility for far-infrared andsubmillimetre astronomy. Astron. & Astrophys. 518, L1–L6 (2010).
33. Wright, E. L. et al. The Wide-field Infrared Survey Explorer (WISE): Mission Descriptionand Initial On-orbit Performance. Astron. J. 140, 1868–1881 (2010).
34. Werner, M. W. et al. The Spitzer Space Telescope Mission. Astrophys. J. Supp. 154, 1–9(2004).
35. Murphy, T. et al. The Australia Telescope 20 GHz Survey: the source catalogue. Mon. Not.R. Astron. Soc. 402, 2403–2423 (2010).
36. De Breuck, C., De Breuck, C., De Breuck, C., Rottgering, H. & van Breugel, W. A sampleof ultra steep spectrum sources selected from the Westerbork In the Southern Hemisphere(WISH) survey. Astron. & Astrophys. 394, 59–69 (2002).
37. Dhillon, V. S. et al. ULTRASPEC: a high-speed imaging photometer on the 2.4-m ThaiNational Telescope. Mon. Not. R. Astron. Soc. 444, 4009–4021 (2014).
17

38. Hambsch, F.-J. ROAD (Remote Observatory Atacama Desert): Intensive Observations ofVariable Stars. Journal of the American Association of Variable Star Observers (JAAVSO)40, 1003–1009 (2012).
39. Rebassa-Mansergas, A., Rebassa-Mansergas, A., Rebassa-Mansergas, A., Schreiber, M. R.& Koester, D. Post-common-envelope binaries from SDSS - I. 101 white dwarf main-sequencebinaries with multiple Sloan Digital Sky Survey spectroscopy. Mon. Not. R. Astron. Soc.382, 1377–1393 (2007).
40. Hessman, F. V., Hessman, F. V., Nather, R. E. & Zhang, E.-H. Time-resolved spectroscopyof SS Cygni at minimum and maximum light. Astrophys. J. 286, 747–759 (1984).
41. Wade, R. A. & Horne, K. The radial velocity curve and peculiar TiO distribution of the redsecondary star in Z Chamaeleontis. Astrophys. J. 324, 411–430 (1988).
42. Marsh, T. R. A spectroscopic study of the deeply eclipsing dwarf nova IP Peg. Mon. Not. R.Astron. Soc. 231, 1117–1138 (1988).
43. Faulkner, J., Flannery, B. P. & Warner, B. Ultrashort-Period Binaries. II. HZ 29 (=AM CVn):a Double-White Semidetached Postcataclysmic Nova?. Astrophys. J. Lett. 175, L79–L83(1972).
44. Knigge, C., Baraffe, I. & Patterson, J. The Evolution of Cataclysmic Variables as Revealedby Their Donor Stars. Astrophys. J. Supp. 194, 28–75 (2011).
45. Kellermann, K. I. & Pauliny-Toth, I. I. K. The Spectra of Opaque Radio Sources. Astrophys.J. Lett. 155, L71–L78 (1969).
18

5000 6000 7000 8000 9000
Wavelength [A]
0.0
0.5
1.0
1.5
2.0
2.5
3.0
Flux
dens
ity,fλ,[
10−
18W
m−
2A−
1]
Extended Data Figure 1: The optical spectrum of the white dwarf’s M star com-panion. A 10 minute exposure of AR Sco taken with FORS on the VLT between orbitalphases 0.848 and 0.895 (black). Other spectra: an optimally-scaled M5 template (green);the sum of the template plus a fitted smooth spectrum (red); AR Sco minus the template,i.e. the extra light (magenta); a white dwarf model atmosphere of T = 9750 K, log g = 8.0,the maximum possible consistent with the HST data (blue). A slit-loss factor of 0.61 hasbeen applied to the models. The strong emission lines come from the irradiated face ofthe M star.
19

1200 1400 1600 1800 2000
Wavelength [A]
010
2030
4050
6070
Flux
dens
ity,fλ,
[10−
19W
m−
2A−
1]
CIV 1550
HeII 1640SiIV 1400
CII 1335
NV1240
CIII1175
Extended Data Figure 2: HST ultraviolet spectrum of AR Sco. This shows the meanHST spectrum with geocoronal emission plotted in grey. The blue line close to the x-axisis a white dwarf model atmosphere of T = 9750 K, log g = 8.0, representing the maximalcontribution of the white dwarf consistent with light-curves. The radial velocities of theemission lines (Extended Data Fig. 4) show that, like the optical lines, the ultraviolet linesmainly come from the irradiated face of the M star.
20

400 0 400Velocity [km/s]
0.6
00.6
50.7
00.7
50.8
00.8
50.9
00.9
5
Orb
ital phase
a
HeI 5875
400 0 400Velocity [km/s]
b
Hα 6562
400 0 400Velocity [km/s]
c
NaI 8200
400 0 400Velocity [km/s]
d
CaII 8498
Extended Data Figure 3: Velocity variations of atomic emission lines compared tothose of the M star. a, b and d show emission lines from a sequence of spectra from theVLT+X-SHOOTER data; c shows the NaI 8200 absorption doublet from the M star. Thedashed line shows the motion of the centre of mass of the M star deduced from the NaImeasurements while the dotted lines show the maximum range of radial velocities fromthe M star for q = M2/M1 = 0.35. The emission lines move in phase with the NaI doubletbut at lower amplitude, showing that they come from the inner face of the M star.
21
−300 −200 −100 0 100 200 300VX [km/s]
−10
00
100
200
300
400
VY
[km
/s]
Extended Data Figure 4: The emission lines’ origin relative to the M star. Velocitiesof the lines were fitted with VR = −VX cos 2πφ+ VY sin 2πφ. The points show the values of(VX , VY ). Red: the M star from NaI (by definition this lies at VX = 0). Blue: SiIV and HeIIlines from the HST FUV data. Green: Hα, β and γ from optical spectroscopy. The blackand green plus signs mark the centres of mass of the binary and white dwarf respectively.The red line shows the Roche lobe of the M star for a mass ratio q = 0.35.
22

0.00
0.05
0.10
0.15
0.20
Am
plitu
de[m
ags]
νB νSa
8.3 8.4 8.5 8.6 8.7Frequency [mHz]
0.00
00.
025
0.05
0A
mpl
itude
[mag
s]
νB νS νS + νOc 0.00
0.05
0.10
0.15
2νB 2νSb
16.8 16.9 17.0 17.1 17.2Frequency [mHz]
0.00
0.05
0.10
2νB 2νSd
8.3 8.4 8.5 8.6 8.7Frequency [mHz]
0.00
0.05
0.10
0.15
0.20 νB νSe
Extended Data Figure 5: Amplitude spectra from 9 days monitoring with a smalltelescope. a, Amplitude as a function of frequency around the 1.97 min signal from datataken with a 40 cm telescope. b, The same at the second harmonic. c and d, The sameas a and b after subtracting the beat frequency signals at νB and 2νB. Signals at νS + νOand 2νS − νO are also apparent. e, The window function, computed from a pure sinusoidof frequency νB and amplitude 0.18 magnitudes (cf a).
23
−6 −3 0 3 6ν − νO [10−8 Hz]
0.0
0.1
0.2
0.3
0.4
0.5
0.6
0.7
0.8
Am
plitu
de[m
agni
tude
s]a
Orbital
−6 −3 0 3 6ν − νB [10−8 Hz]
0.00
0.04
0.08
0.12
0.16
b
Beat
−6 −3 0 3 6ν − νS [10−8 Hz]
0.00
0.04
0.08
0.12
0.16
c
Spin
Extended Data Figure 6: Amplitude spectra from 7 years of sparsely-sampled CSSdata. a-c, The amplitude as a function of frequency relative to the mean orbital (a), beat(b) and spin (c) frequencies listed in Extended Data Table 2. The grey line is the spectrumwithout any processing; the blue line is the spectrum after subtraction of the orbital signal.
24
Tel./Inst. Type Wavelength Date ExposureT [s]×N
VLT+FORS Spectra 420 – 900 nm 2015-06-03 600x1WHT+ULTRACAM Photometry u′, g′, r′ 2015-06-23 2.9x768WHT+ULTRACAM Photometry u′, g′, i′ 2015-06-24 1.3x7634Swift+UVOT/XRT UV, X-rays 260 nm, 0.2 – 10 keV 2015-06-23 –
2015-08-031000x10
VLT+HAWKI Photometry KS 2015-07-06 2.0x7020WHT+ISIS Spectra 354 – 539, 617 – 884 nm 2015-07-16 20x94WHT+ISIS Spectra 354 – 539, 617 – 884 nm 2015-07-17 300x4WHT+ISIS Spectra 356 – 520, 540 – 697 nm 2015-07-19 30x130ROAD 40 cm Photometry White light 2015-07-19 –
2015-07-2830x1932
WHT+ISIS Spectra 356 – 520, 540 – 697 nm 2015-07-20 30x210INT+IDS Spectra 440 – 685 nm 2015-07-22 27x300INT+IDS Spectra 440 – 685 nm 2015-07-23 34x300ATCA Radio 5.5, 9.0 GHz 2015-08-13 271x10WHT+ISIS Spectra 320 – 535, 738 – 906 nm 2015-08-26 600x8WHT+ISIS Spectra 320 – 535, 738 – 906 nm 2015-09-01 600x8VLT+XSHOOTER Spectra 302 – 2479 nm 2015-09-23 11x300HST+COS Spectra 110 – 220 nm 2016-01-19 5 orbitsTNT+ULTRASPEC Photometry g′ 2016-01-19 3.8x1061
Extended Data Table 1: Observation log.
25

Frequency 5 %-ile 95 %-ile Median Mean RMSmHz mHz mHz mHz mHz
νO 0.077921311 0.077921449 0.077921380 0.077921380 0.000000042νB 8.4603102 8.4603140 8.4603112 8.4603114 0.0000011νS 8.5382332 8.5382356 8.5382348 8.5382346 0.0000008
Extended Data Table 2: Statistics of the orbital, beat and spin frequencies frombootstrap fits.
26
Source Wavelength, Flux Source Wavelength, FluxFrequency mJy Frequency mJy
WISH 352 MHz < 18 WISE 22.0 µm 45.2 – 105.4
FIRST 1.4 GHz 8.0± 0.3 WISE 12 µm 18.0 – 48.3
AT20G 20 GHz < 50 Spitzer 5.73 µm 11.9 – 23.5
Herschel 500 µm 92± 25 WISE 4.60 µm 11.8 – 20.5
Herschel 350 µm 76± 21 Spitzer 3.6 µm 13.0± 0.7
Herschel 250 µm 55± 23 WISE 3.4 µm 13.2 – 13.8
Herschel 160 µm 118± 38 2MASS 2.1 µm 13.5± 0.3
Herschel 70 µm 196± 63 2MASS 1.7 µm 15.0± 0.3
Spitzer 24 µm 59.9± 6.0 2MASS 1.2 µm 13.3± 0.3
Extended Data Table 3: Archival data sources and flux values.
27