Workshop slides review of the effectiveness of the wem and egrc regulatory scheme

Walden UniversityScholarWorks
Walden Dissertations and Doctoral Studies Walden Dissertations and Doctoral StudiesCollection
2016
A Quantitative Study of the Effectiveness ofRegulatory Policy in the Maryland Food IndustryAlphonsus C. KorieWalden University
Follow this and additional works at: https://scholarworks.waldenu.edu/dissertations
Part of the Public Policy Commons
This Dissertation is brought to you for free and open access by the Walden Dissertations and Doctoral Studies Collection at ScholarWorks. It has beenaccepted for inclusion in Walden Dissertations and Doctoral Studies by an authorized administrator of ScholarWorks. For more information, pleasecontact [email protected].

Walden University
College of Social and Behavioral Sciences
This is to certify that the doctoral dissertation by
Alphonsus Korie
has been found to be complete and satisfactory in all respects, and that any and all revisions required by the review committee have been made.
Review Committee Dr. Linda Day, Committee Chairperson, Public Policy and Administration Faculty
Dr. Robert Kilmer, Committee Member, Public Policy and Administration Faculty
Dr. Kirk Williams, University Reviewer, Public Policy and Administration Faculty
Chief Academic Officer Eric Riedel, Ph.D.
Walden University 2016

Abstract
The Effectiveness of Regulatory Policy in the Maryland Food Industry
by
Alphonsus Korie
MA, Sojourner–Douglass College, 2010
BS, Alabama State University, 1986
Dissertation Submitted in Partial Fulfillment
of the Requirements for the Degree of
Doctor of Philosophy
Public Policy and Administration Health Services
Walden University
February 2016

Abstract
Foodborne illness is a persistent problem in the food service industry. Restaurant
inspections reveal that only 60-70% of restaurants are in compliance with health code
requirements, which vary from state to state and county to county. In Maryland, 5 of the
state’s 24 counties have a requirement that restaurants classified as medium- or high-
priority food establishments must employ certified food managers (CFMs). It is unknown
how this requirement has influenced the operation of the affected restaurants and the
extent to which the requirement has resulted in improved food handling safety. The
purpose of this quantitative study was to determine the effectiveness of CFMs in reducing
the incidence of foodborne illness in Maryland counties. The study was based on the
theory of planned behavior. The study was also based on the relationship between
foodborne illness outbreaks and the presence of CFMs and the role such managers can
play in reducing those outbreaks. Data were collected from the Maryland Department of
Health and Mental Hygiene reports regarding foodborne illness outbreaks from 2004 to
2013. A total of 288 establishments were selected for analysis. Data analysis involved
comparing results for the 5 counties that require CFMs with the 19 counties that lack this
requirement. Results showed a significance difference of 0.008 (95% CI, 0.005), z = 4.71,
p = 0.000 in the proportion of foodborne illness outbreaks between county restaurants
that require CFMs and those without such a requirement. Social change implications
include the potential to reduce the incidence of foodborne illness, thereby contributing to
improved public health. The patrons who live in Maryland counties without onsite CFMs
risk exposure to foodborne illness more than those living in counties with CFMs.

The Effectiveness of Regulatory Policy in the Maryland Food Industry
by
Alphonsus Korie
MA, Sojourner–Douglass College, 2010
BS, Alabama State University, 1986
Dissertation Submitted in Partial Fulfillment
of the Requirements for the Degree of
Doctor of Philosophy
Public Policy and Administration Health Services
Walden University
February 2016

Acknowledgements
To my beautiful wife Roseline and four wonderful children, Chidiebere A.
Tochukwu J, Chiamaka C, Chinaemerem A, thank you so much for all your love and
support throughout this journey. Your love and encouragement sustained me even during
some of the most difficult times I encountered along the way, during this voyage.
A heartfelt recognition is given to the best professor ever and my committee chair,
Dr Linda Day, your superior is what made this day possible, and I will always remain
grateful. I would use this opportunity to thank Dr Robert Kilmer, committee member, and
Dr David Healy for your professional guidance. A special thank you goes to my mentor
and spiritual guidance, Dr Hyacinth Anucha for your unwavering support always
especially during this study. This journey would have been much harder without your
support. Thank you to Alvina Chu (DHMH), Yvonne Deloatch, Lisa (DHMH), for your
support. Honestly, I feel blessed to have met all of you.

i
Table of Contents
List of Tables ..................................................................................................................... iv
Chapter 1: Introduction to the Study ....................................................................................1
Introduction ....................................................................................................................1
Background of the Study ...............................................................................................2
Statement of the Problem ...............................................................................................5
Purpose of the Study ......................................................................................................5
Nature of the Study ........................................................................................................6
Research Question and Hypothesis ................................................................................7
Theoretical Basis of the Study .......................................................................................7
Definitions of Terms ......................................................................................................8
Assumptions ...................................................................................................................8
Scope and Delimitations ................................................................................................8
Limitations .....................................................................................................................9
Significance of the Study .............................................................................................10
Summary ......................................................................................................................11
Chapter 2: Review of the Literature ...................................................................................13
Introduction ..................................................................................................................13
Theory of Planned Behavior ........................................................................................14
Foodborne Illness .........................................................................................................19

ii
Food Handling Safety Training ...................................................................................24
Food Industry Regulations ...........................................................................................28
Public Policy and Foodborne Illness............................................................................33
Summary ......................................................................................................................34
Chapter 3: Methods ............................................................................................................36
Introduction ..................................................................................................................36
Research Design...........................................................................................................36
Research Questions and Hypotheses ...........................................................................39
Population and Sample ................................................................................................39
Data Collection ............................................................................................................40
Data Analysis ...............................................................................................................41
Role of the Researcher .................................................................................................41
Ethical Protections .......................................................................................................42
Summary ......................................................................................................................42
Chapter 4: Results ..............................................................................................................43
Introduction ..................................................................................................................43
Data Collection............................................................................................................43 Results ..........................................................................................................................44
Data Analysis ...............................................................................................................48
Summary ......................................................................................................................51
Chapter 5: Discussion, Conclusions, and Recommendations ............................................52
Introduction ..................................................................................................................52

iii
Discussion ....................................................................................................................53
Conclusions ..................................................................................................................54
Limitations ...................................................................................................................54
Contribution of the Study to Social Change ................................................................55
Recommendations for Action ......................................................................................56
Recommendations for Further Research ......................................................................57
Summary ......................................................................................................................58
References ..........................................................................................................................59
Appendix A: Permission to Conduct the Study .................................................................70
Appendix B: Facilities and Counties Reporting Foodborne Outbreaks.............................72
Appendix C: Results of proposed data analysis using ANOVA and Independent-Sample
t-test deemed inappropriate for data with one sample group with zero variance..............80

iv
List of Tables
Table 1. Predicting Behavioral Intention ...........................................................................18
Table 2. Estimated Annual Episodes of Domestically Acquired Foodborne
Illnesses ..................................................................................................................20
Table 3. Estimated Hospitalizations and Deaths from Common Pathogens .....................21
Table 4. 2011 Pathogen-Caused Illnesses and Deaths .......................................................22
Table 5. 2011 Pathogen-Caused Hospitalizations .............................................................23
Table 6. Foodborne Outbreaks in Maryland Counties Requiring CFMs (2004-
2013) ....................................................................................................................466
Table 7. Foodborne Outbreaks in Maryland Counties Not Requiring CFMs
(2004-2013)..........................................................................................................477
Table 8. Test and Confidence Interval for Two Proportions .............................................50
Table C1. Descriptive Statistics of Foodborne Outbreaks of Two
Groups...............................................................................................................................81
Table C2. Shapiro-Wilk Test of Normality .......................................................................83
Table C3. Levene’s Test for Equality of Variances and t Test for Equality of
Means .....................................................................................................................83

v
List of Figures
Figure 1. Theory of planned behavior ................................................................................15 Figure C1. Boxplot showing no data outliers ....................................................................82 Figure C2. ANOVA plot of mean foodborne outbreaks ....................................................85
1
Chapter 1: Introduction to the Study
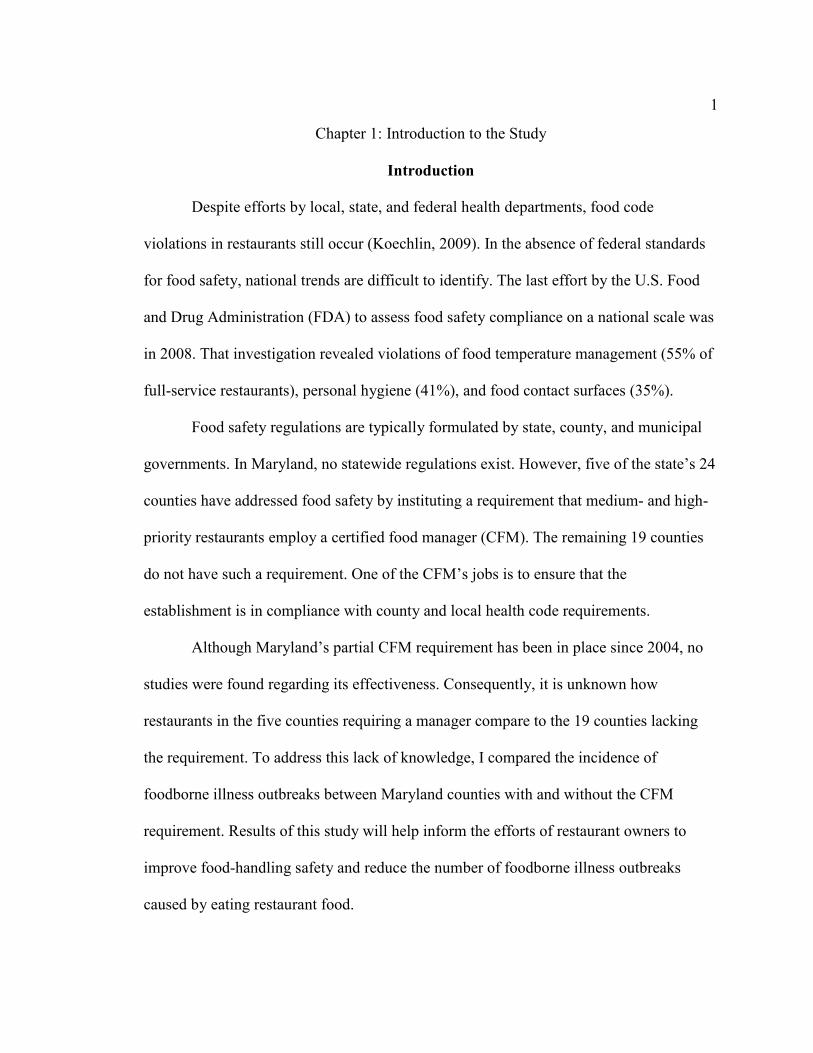
Introduction
Despite efforts by local, state, and federal health departments, food code
violations in restaurants still occur (Koechlin, 2009). In the absence of federal standards
for food safety, national trends are difficult to identify. The last effort by the U.S. Food
and Drug Administration (FDA) to assess food safety compliance on a national scale was
in 2008. That investigation revealed violations of food temperature management (55% of
full-service restaurants), personal hygiene (41%), and food contact surfaces (35%).
Food safety regulations are typically formulated by state, county, and municipal
governments. In Maryland, no statewide regulations exist. However, five of the state’s 24
counties have addressed food safety by instituting a requirement that medium- and high-
priority restaurants employ a certified food manager (CFM). The remaining 19 counties
do not have such a requirement. One of the CFM’s jobs is to ensure that the
establishment is in compliance with county and local health code requirements.
Although Maryland’s partial CFM requirement has been in place since 2004, no
studies were found regarding its effectiveness. Consequently, it is unknown how
restaurants in the five counties requiring a manager compare to the 19 counties lacking
the requirement. To address this lack of knowledge, I compared the incidence of
foodborne illness outbreaks between Maryland counties with and without the CFM
requirement. Results of this study will help inform the efforts of restaurant owners to
improve food-handling safety and reduce the number of foodborne illness outbreaks
caused by eating restaurant food.

2
In the remainder of this chapter, the background of the study will be described,
and the study’s purpose will be further detailed. The study’s theoretical basis will be
explained, and its methods will be briefly presented. Research questions and hypotheses
will be listed, key terms will be defined, and assumptions and limitations will be
described. Chapter 2 consists of a review of the relevant literature on the theory of
planned behavior, foodborne illness, food handling safety, food industry regulations, and
public policy related to foodborne illness. In Chapter 3, I will describe the study’s design,
data collection and analysis procedures, and ethical protections. In Chapter 4 I will
summarize the study’s results, and in Chapter 5 I will present conclusions and
recommendations.
Background of the Study
The safety of the U.S. food supply is affected by imports, domestic distribution
and supply networks, dietary choices, and bacterial adaptations (Lee, 2013). A concern
with food safety led the federal government in 1999 to create the National Food Safety
System (NFSS), which established a task force to promote food safety at all levels,
including food producers, retailers such as restaurants, and government entities that
provide food through schools and relief agencies. In 2000, the U.S. Food and Drug
Administration (FDA) directed each state to require food safety training for all food
service managers. Because the FDA did not specify what such training should include,
requirements vary from state to state. Some states have instituted their own training and
certification programs. Others rely on organizations such as the National Restaurant
Association (NRA) or private companies to provide that service. States also differ in the
employment level at which external training is required (NAS, 1999; & Roberts, 2008).
3
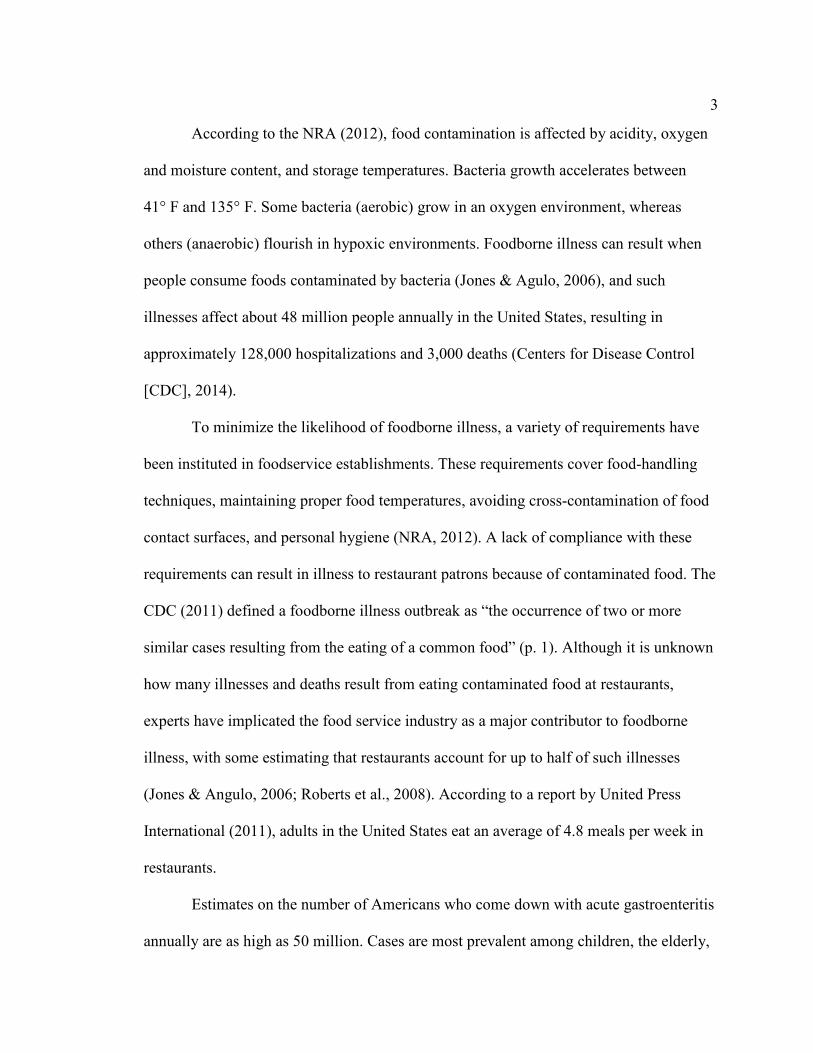
According to the NRA (2012), food contamination is affected by acidity, oxygen
and moisture content, and storage temperatures. Bacteria growth accelerates between
41° F and 135° F. Some bacteria (aerobic) grow in an oxygen environment, whereas
others (anaerobic) flourish in hypoxic environments. Foodborne illness can result when
people consume foods contaminated by bacteria (Jones & Agulo, 2006), and such
illnesses affect about 48 million people annually in the United States, resulting in
approximately 128,000 hospitalizations and 3,000 deaths (Centers for Disease Control
[CDC], 2014).
To minimize the likelihood of foodborne illness, a variety of requirements have
been instituted in foodservice establishments. These requirements cover food-handling
techniques, maintaining proper food temperatures, avoiding cross-contamination of food
contact surfaces, and personal hygiene (NRA, 2012). A lack of compliance with these
requirements can result in illness to restaurant patrons because of contaminated food. The
CDC (2011) defined a foodborne illness outbreak as “the occurrence of two or more
similar cases resulting from the eating of a common food” (p. 1). Although it is unknown
how many illnesses and deaths result from eating contaminated food at restaurants,
experts have implicated the food service industry as a major contributor to foodborne
illness, with some estimating that restaurants account for up to half of such illnesses
(Jones & Angulo, 2006; Roberts et al., 2008). According to a report by United Press
International (2011), adults in the United States eat an average of 4.8 meals per week in
restaurants.
Estimates on the number of Americans who come down with acute gastroenteritis
annually are as high as 50 million. Cases are most prevalent among children, the elderly,

4
pregnant women, and immune-compromised individuals (McCabe-Sellers & Beattie,
2004). As Koechlin (2009) noted, “Unlike home-prepared food, infected foods prepared
in restaurants have the potential for affecting more people” (p. 1). The cause of many
foodborne illness outbreaks remains a mystery, in part because the origin of such
incidents in private homes is often unreported. As Bryan (2002) noted,
Besides those reported, many illnesses never come to the attention of health
authorities. Many persons who develop gastroenteritis neither seek medical
attention nor complain to health authorities. Even when medical assistance is
sought, reports to health authorities are not always made. All reports are not
investigated, and many of those that are investigated do not result in a conclusion
as to (a) vehicle, (b) the mode of contamination and/or the source, and (c) the way
the pathogen survived processing and grew to quantities sufficient to cause
illness. (para. 11 )
One cause of foodborne disease is inadequate hand washing. According to Todd,
Grieg, Bartleson, and Michaels (2009), 40% of food-related disease is caused by food
handlers not using gloves or proper hand-washing techniques when handling ready-to-eat
food products. Allwood, Jenkins, Paulus, Johnson, and Hedberg (2004) studied
restaurants in Minnesota and found that food workers’ ability to use proper hand-washing
procedures was related to a manager’s knowledge of hand-washing requirements and the
existence of a training program. The researchers also found that establishments using live
demonstrations of proper hand washing had better outcomes than did those that used
other means such as signs, posters, or video.

5
In Maryland, five of the state’s 24 counties require foodservice facilities operating
under medium- or high-priority food permits to have a CFM on the premises while the
establishment is open for business. Certification consists of 16 hours of training in safe
food handling, followed by passing an examination approved by the NRA. In Maryland,
that is the SERVSAFE exam. Certification lasts for 3 years.
Statement of the Problem
Millions of Americans contract pathogens that cause foodborne illnesses and
thousands die each year because of these diseases, which often result from improper
food-handling practices in restaurants and other food-service establishments (Jones &
Angulo, 2006; Roberts, 2008). Maryland lacks a statewide policy requiring food services
to employ CFMs as a defense against foodborne illnesses. Instead, individual counties are
on their own to implement food manager certification requirements. The result is that
only five of the state’s 24 counties have such a requirement. It is unknown how requiring
restaurants to have CFMs has affected the operation of those establishments and the
extent to which that requirement has resulted in improved food handling safety. That lack
of knowledge is the problem the current study addressed by a comparison of Maryland
restaurants with and without a CFM requirement. This problem is important because food
manager certification represents an additional expense for restaurant owners, and it is
necessary to know whether the requirement results in greater safety for restaurant
patrons.
Purpose of the Study
The purpose of this quantitative study was to determine whether there are
differences in foodborne disease outbreaks at Maryland medium- and high-priority

6
restaurants employing an onsite CFM compared to establishments without such
managers. CFMs are food workers who receive at least 16 hours of safe food-handling
training and pass a comprehensive certification examination given by SERVSAFE. A
larger purpose of the proposed study is to provide restaurant owners with information that
will help them reduce the incidence of foodborne disease and thus improve public health.
Nature of the Study
This quantitative study was based on a cross-sectional design. The independent
variable was the presence or absence of CFMs at a given foodservice establishment. The
dependent variable was the difference in the proportion of foodborne illness outbreaks
between the two groups of restaurants. Data collection involved collecting information
from the Maryland Department of Health and Mental Hygiene for the period 2004 to
2013, which was used to compare foodborne illness outbreaks from the five counties that
require CFMs and the 19 counties without this requirement. The counties that require
CFMs started enforcement in 2004. The original plan was to subject data to inferential
statistical analysis using a one-way ANOVA and independent-samples t tests to compare
the two groups of restaurants. At the end, this method was not appropriate for my data
analysis, and the two sample proportion test was deemed more appropriate instead.
The current research design was chosen because it promised to be cost effective
and yield a quick turnaround in data collection. A qualitative design was also considered.
Doing interviews would have resulted in richer data, but that depth would have been
achieved at the expense of the breadth that can be attained through document research,
which enables a researcher to employ a much larger sample.
7
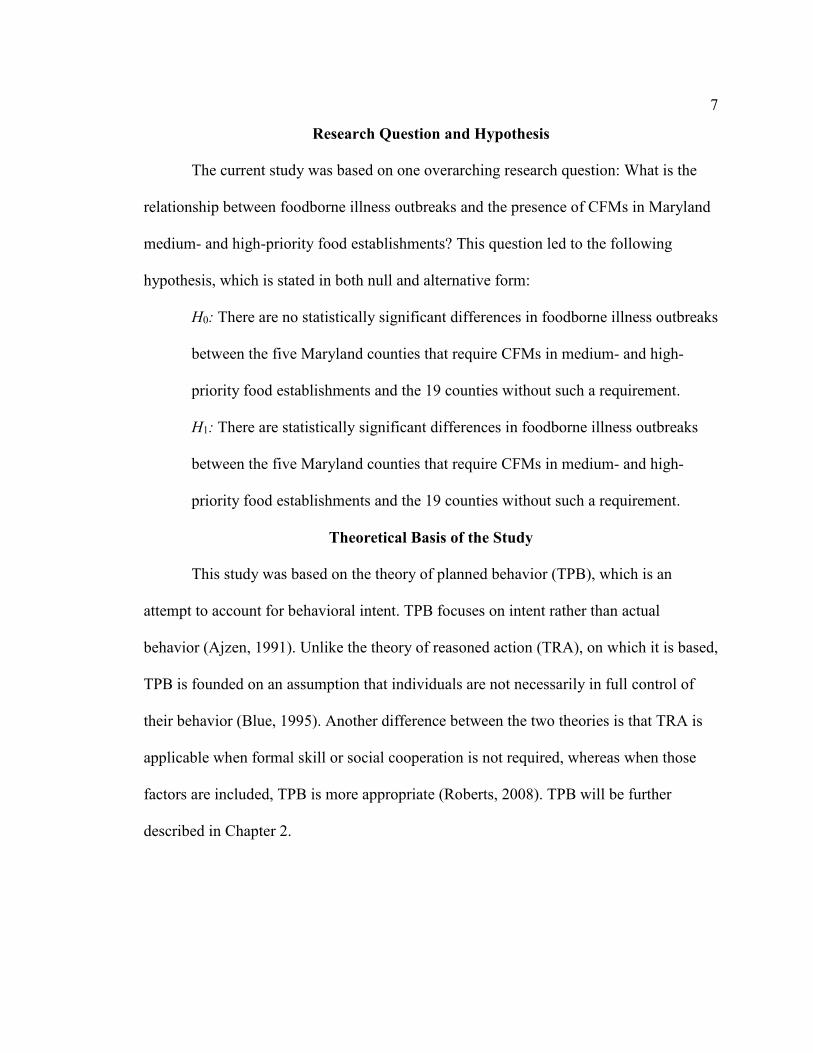
Research Question and Hypothesis
The current study was based on one overarching research question: What is the
relationship between foodborne illness outbreaks and the presence of CFMs in Maryland
medium- and high-priority food establishments? This question led to the following
hypothesis, which is stated in both null and alternative form:
H0: There are no statistically significant differences in foodborne illness outbreaks
between the five Maryland counties that require CFMs in medium- and high-
priority food establishments and the 19 counties without such a requirement.
H1: There are statistically significant differences in foodborne illness outbreaks
between the five Maryland counties that require CFMs in medium- and high-
priority food establishments and the 19 counties without such a requirement.
Theoretical Basis of the Study
This study was based on the theory of planned behavior (TPB), which is an
attempt to account for behavioral intent. TPB focuses on intent rather than actual
behavior (Ajzen, 1991). Unlike the theory of reasoned action (TRA), on which it is based,
TPB is founded on an assumption that individuals are not necessarily in full control of
their behavior (Blue, 1995). Another difference between the two theories is that TRA is
applicable when formal skill or social cooperation is not required, whereas when those
factors are included, TPB is more appropriate (Roberts, 2008). TPB will be further
described in Chapter 2.

8
Definitions of Terms
Foodborne illness outbreak: “An incident in which two or more persons
experience a similar illness after ingestion of a common food, and epidemiologic analysis
implicates the food as the source of the illness” (CDC, 2011, para. 1).
Food-handling practices: Steps employed by food processers and manufacturers
in managing products in their establishments (Baltimore County Department of Health
[BCDH], 2011).
High-priority food establishment: A food facility that cooks then cools food from
135° F to 70° F within 2 hours and 70° F to 41° F within 4 hours, then reheats it to
165° F. Reheated food is kept in a warmer at 135° F until served. Any food product that
does not meet the above requirements is discarded (BCDH, 2011).
Medium-priority food establishment: A food facility that cooks food, holds it at
135° F, and serves it immediately (BCDH, 2011).
Pathogen: Bacteria, virus, or other microorganism causing an illness or disease
(FDA, 2012).
Assumptions
This study is based on the assumption that information provided by the Maryland
Department of Health and Mental Hygiene was accurate, reliable, and timely compared to
self-reported data from restaurant operators.
Scope and Delimitations
This study was confined to the state of Maryland. That geographical area was
chosen for two reasons. First, because Maryland lacks a statewide policy regarding the
presence of an onsite CFM at restaurants, the state represents an appropriate site to

9
compare the effects of counties that require such a manager with those that do not.
Second, I live and work in Maryland. I am familiar with the state’s food service industry,
and it was convenient for me to conduct the study there.
This study was further confined to restaurants defined as medium- and high-
priority food service establishments. Both kinds of restaurant sell food that is cooked
onsite. The distinction between the two has to do with holding times and temperatures
(see Definitions of Terms). Excluded from the study are low-priority establishments,
which sell prepackaged food and beverage items that require no preparation,
refrigeration, or reheating. Low-priority facilities were not included in the study because
food safety considerations pertaining to what such establishments sell have to do with
where the products were manufactured and packaged, which may be outside of Maryland.
Finally, the current study was limited to the period from 2004 to 2013. This time
frame was selected because it was in 2004 that five Maryland counties instituted a
requirement that all medium- and high-priority restaurants employ an onsite CFM, and
2013 is the most recent year for which comprehensive data on foodborne illnesses are
available. Because this study was confined to Maryland counties, and because individual
states, counties, and municipalities are free to establish their own food safety policies, it
will not be possible to generalize the results of this study to other states, counties, or
municipalities.
Limitations
A potential limitation for the current study is my own professional status as a
registered environmental health specialist, in which capacity I formerly supervised the
professional regulators who inspect food establishments in Maryland. Because of my

10
former job, I may have been subject to personal bias based on my specialized knowledge
of Maryland’s food service industry. Appropriate steps were taken to minimize such bias;
these are described further in Chapter 3.
One potential threat to the internal validity of the current study is the possibility
that factors other than the independent variable could have affected the dependent
variable. It was not possible to control for all other potential confounder variables. As
noted above, one threat to external validity is the fact that Maryland’s current food safety
policy lacks a statewide requirement for CFMs in medium- and high-priority food
establishments, which limits the extent to which the study’s findings can be generalized
to states that have a uniform requirement. For example, in 1985 California lawmakers
saw the need for “uniform and statewide health and sanitation standards governing retail
food facilities throughout the state,” (Taber, 2004, p.7) and enacted two laws—the
California Uniform Retail Food Facilities Law (CURFFL) and California Health and
Safety Code, §113700 through §114455—“to ensure food products consumed by the
public are pure, safe and unadulterated” (Taber, 2004, p. 7).
Significance of the Study
Foodborne illness is a public health problem that results in pain and suffering,
absences from work, lost wages, and reduced economic productivity. Foodborne illnesses
affect some 48 million people annually in the United States, resulting in about 3,000
deaths and costing $77.7 billion (CDC, 2014). Although it is unknown how many
instances of foodborne illness are caused by restaurant meals, according to a recent
survey adults in the United States eat an average of 4.8 meals per week in restaurants
(United Press International, 2011).

11
The majority of foodborne illnesses are preventable, and the food service industry
has a major responsibility in reducing such illnesses (Jones & Angulo, 2006). Averett,
Nazir, and Neuberger (2011) called for more effective education for food handlers.
Chukwuocha et al. (2009) found that training in safe food-handling practices resulted in
reductions in foodborne illness outbreaks.
The results of this study can contribute to positive social change by informing the
efforts of restaurant owners and managers to improve food-handling safety in their
establishments. The study outcome can assist community health educators as they
provide information on safe food handling. The study will also benefit legislators and
policy makers as they formulate laws and guidelines to improve the safety of the nation’s
food supply. The net effect of these changes will be fewer hospitalizations and deaths,
reduced pain and suffering, and greater economic productivity. This study will also
provide a basis for further research on the important topic of food safety.
Summary
Foodborne illness, although largely preventable, continues to be a significant
public health problem in the United States. Because a large percentage of meals are eaten
in restaurants, the food industry can play a significant role in reducing foodborne illness
outbreaks. In the absence of federal requirements governing food handling in commercial
establishments, individual states are left to formulate their own policies. In Maryland,
five of the state’s 24 counties have instituted a requirement that a CFM be on duty
whenever the establishment is open for business.
The purpose of this quantitative study was to determine whether there are
differences in foodborne disease outbreaks at Maryland medium- and high-priority

12
restaurants based on the presence of an onsite CFM. Another purpose was to determine if
restaurant owners’ attitudes toward food safety are influenced by the presence or absence
of a CFM requirement. The study was based on the theory of planned behavior. Data
collection consisted of obtaining reports from the Maryland Department of Health and
Mental Hygiene regarding the incidence of foodborne illness outbreaks associated with
the state’s restaurants. Data were statistically analyzed using a one-way ANOVA and
independent-sample t tests used to test differences between the two groups.
Chapter 2 of this dissertation consists of a review of the relevant literature on
foodborne illness, along with a discussion of the theory of planned behavior. In Chapter
3, the study’s methodology will be presented, including research design, data collection
and analysis procedures, and ethical protections. In Chapter 4, the results are
summarized, and in Chapter 5 conclusions and recommendations are offered.

13
Chapter 2: Review of the Literature
Introduction
Foodborne illnesses affect about 48 million Americans a year, resulting in
128,000 hospitalizations and 3,000 deaths (CDC, 2014). A foodborne illness outbreak
results when more than one person gets sick from eating the same contaminated food
(FDA, 2012). Because of the greater potential scale of those affected, outbreaks are more
consequential when they result from food consumed at restaurants. Adults in the United
States eat an average of 4.8 meals per week in restaurants (United Press International,
2011). This suggests that food-service establishments have a large responsibility in
reducing incidences of foodborne illness. According to Pilling, Brannon, Roberts,
Shanklin, & Howells (2009), food-handling safety training can result in “improved
attitudes, food safety behaviors, and employees’ knowledge” (p. 192).
No federal legislation specifies requirements for food-handling safety at
commercial food services. Consequently, states and municipalities are on their own to
implement such requirements. In Maryland, five of the state’s 24 counties have addressed
food safety by requiring all medium- and high-priority food facilities to employ an onsite
CFM, who is responsible for overseeing the safety of food-handling procedures. Because
the efficacy of food managers in reducing foodborne illness has not been studied in
Maryland, the current study was designed to compare the counties requiring food
managers with those that lack this requirement. The study was based on document review
of foodborne illness outbreaks collected by the Maryland Department of Health and
Mental Hygiene from 2004 to 2013.

14
I began the literature review by consulting several databases: Google Scholar,
Sage, and ProQuest. Searches were conducted with the following terms: food safety, food
processing, food handler education, food temperature, foodborne disease, foodborne
illness, foodborne illness outbreaks, public policy and food safety, food workers, food
handlers, food training, food hazards, food handling practices, food contact surfaces,
sanitization process, food equipment cleaning, food storage, hand washing, pathogens,
salmonella poisoning, listeria, listeriosis, escherichia coli, shiga, e-coli, norovirus,
campylobacter, certified food managers, trained food handlers, and food regulation in
Maryland. The literature search involved no date parameters, but in selecting sources for
review, preference was given for those published in the last 10 years. Preference was also
given to peer-reviewed journal articles and doctoral dissertations.
Theory of Planned Behavior
The TPB, which was derived from the TRA, was developed by Ajzen and
Fishbein (1977, 1980). TPB attempts to account for an individual’s “intention to perform
a given behavior” (Ajzen, 1991, p. 181). The emphasis is on intent: “trying to perform a
given behavior rather than . . . actual performance” (Ajzen, 1991, p. 182). Pilling et al.
(2009) stated that TPB is useful in assessing a person’s behavior in light of his or her
intentions. TPB is consonant with Bandura’s (1977) notion of self-efficacy, which affects
performance preparation and effort. Conner and Armitage (1998) lauded TPB for its
frugality in suggesting behavioral determinants.
According to Ajzen (1991), TPB is based on the assumption that behavioral
intentions are affected by three things: attitude, subjective norms, and perceived
behavioral control (see Figure 1). Subjective norms are social influences to engage in or

15
refrain from engaging in a particular behavior. Perceived behavioral control refers to the
anticipated difficulty or challenges associated with a specific behavior and is affected by
both internal factors (abilities, emotions, knowledge) and external influences (time,
financial means, cooperation from others). A positive attitude, supportive subjective
norms, and perceived self-efficacy will increase the likelihood of a person engaging in
the behavior under consideration.
Figure 1. Theory of planned behavior.
According to Blue (1995), TRA is based on the assumption that an individual is in
full control of a particular behavior, whereas TPB operates on the assumption that people
are not necessarily in control of their behavior. For example, if a restaurant worker did
Attitude
toward the
behavior
Intention
Behavior Subjective
norm
Perceived
behavioral
control

16
not receive adequate training in food-handling procedures, that person would not
understand the implications of his or her behavior and would thus not be in full control of
the behavior. Another difference between the two theories is that TRA is applicable when
formal skill or social cooperation is not required, whereas when those factors are
included, TPB is more appropriate (Roberts, 2008).
Bagozzi, Baumgartner, and Yi (1992) used TPB in a study of consumers’ use of
coupons in grocery shopping. The researchers distinguished between a state and action
orientation, which differ according to a capacity for acting on stated intentions. Bagozzi
et al. found that a low capacity for action (state orientation) was associated with
subjective norms, whereas a higher capacity (action orientation) was marked by an
emphasis on attitudes. “State-oriented individuals form their intentions on the basis of
normative expectations, whereas action-oriented individuals arrive at their intentions
through attitudinal considerations” (Bagozzi et al., 1992, p. 507).
Pilling et al. (2009) used TPB in a study of restaurant employees’ beliefs about
food safety. The researchers used a survey and focus groups to determine employees’
attitudes toward washing hands, using thermometers, and sanitizing work surfaces.
Participants described several benefits of hand washing: better personal hygiene and food
safety along with reduced cross-contamination. Disadvantages of hand washing included
inconvenience and dry skin. Actually washing hands, as opposed to merely intending to,
was affected by availability and location of sinks, along with training on how to wash
hands properly. Regarding thermometers, participants noted that they can give a false
sense of security about food safety. The chief barrier to sanitizing work surfaces was a
perception of insufficient time.

17
Another study that considered the dynamics of hand washing was conducted by
Rosen, Zucker, Brody, Engelhard, and Manor (2009), who explored the effects of an
intervention program in 40 Jerusalem preschools. The intervention consisted of lectures,
printed matter, and experiential learning. The researchers measured attitudes, beliefs,
knowledge, and self-efficacy. They concluded that knowledge was affected by the
intervention. “The combination of positive attitudes toward handwashing among
educators and the program’s effectiveness in imparting knowledge helped to create a
sustained social norm of handwashing among many children in disparate locations”
(p. 686).
In a cross-cultural study of attitudes toward hygiene, Curtis, Danquah, and
Aunger (2009) found that the primary motivations for hand washing were disgust and
comfort. Disgust is triggered when one’s hands are soiled with dirt, feces, bodily fluids,
or other deleterious substances. Comfort is achieved when one’s hands are clean and free
from stains. Curtis et al. found that in Uganda, Senegal, Kenya, and Peru, increased hand
washing was motivated by a cholera outbreak. However, when people perceived that the
threat of disease had subsided, they reverted to their previous hygiene habits. The
researchers also found that hand washing was affected by religious beliefs and social
factors such as local cultural norms, family practices, governmental pronouncements,
schools, and the media. Curtis et al. concluded that planned behavior is influenced by
numerous factors but that once a behavior, such as hand washing, becomes common, it
can no longer be regarded as the result of individual planning.
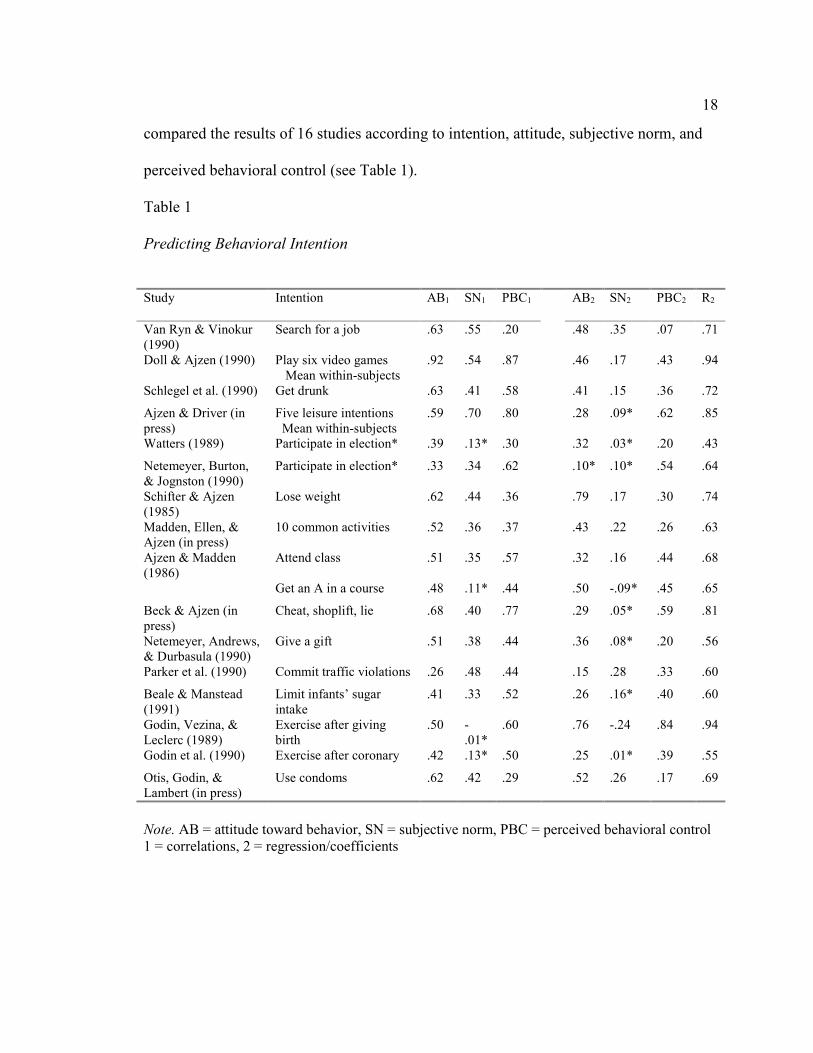
TRA and TPB have been used in numerous other studies on topics ranging from
searching for a job to losing weight to exercising to getting drunk. Ajzen (1991)
18
compared the results of 16 studies according to intention, attitude, subjective norm, and
perceived behavioral control (see Table 1).
Table 1
Predicting Behavioral Intention
Note. AB = attitude toward behavior, SN = subjective norm, PBC = perceived behavioral control 1 = correlations, 2 = regression/coefficients
Study Intention AB1 SN1 PBC1 AB2 SN2 PBC2 R2
Van Ryn & Vinokur (1990)
Search for a job .63 .55 .20 .48 .35 .07 .71
Doll & Ajzen (1990) Play six video games Mean within-subjects
.92 .54 .87 .46 .17 .43 .94
Schlegel et al. (1990) Get drunk .63 .41 .58 .41 .15 .36 .72
Ajzen & Driver (in press)
Five leisure intentions Mean within-subjects
.59 .70 .80 .28 .09* .62 .85
Watters (1989) Participate in election* .39 .13* .30 .32 .03* .20 .43
Netemeyer, Burton, & Jognston (1990)
Participate in election* .33 .34 .62 .10* .10* .54 .64
Schifter & Ajzen (1985)
Lose weight .62 .44 .36 .79 .17 .30 .74
Madden, Ellen, & Ajzen (in press)
10 common activities
.52 .36 .37 .43 .22 .26 .63
Ajzen & Madden (1986)
Attend class .51 .35 .57 .32 .16 .44 .68
Get an A in a course .48 .11* .44 .50 -.09* .45 .65
Beck & Ajzen (in press)
Cheat, shoplift, lie
.68 .40 .77 .29 .05* .59 .81
Netemeyer, Andrews, & Durbasula (1990)
Give a gift
.51 .38 .44 .36 .08* .20 .56
Parker et al. (1990) Commit traffic violations .26 .48 .44 .15 .28 .33 .60
Beale & Manstead (1991)
Limit infants’ sugar intake
.41 .33 .52 .26 .16* .40 .60
Godin, Vezina, & Leclerc (1989)
Exercise after giving birth
.50 -.01*
.60 .76 -.24 .84 .94
Godin et al. (1990) Exercise after coronary .42 .13* .50 .25 .01* .39 .55
Otis, Godin, & Lambert (in press)
Use condoms .62 .42 .29 .52 .26 .17 .69

19
Foodborne Illness
Scallan et al. (2011) estimated that 31 different pathogens are acquired in the
United States each year and that these are responsible for 9.4 million cases of foodborne
illness, resulting in 55,961 hospitalizations and 1,351 deaths. Approximately 5.5 million
foodborne illnesses are due to viruses, 3.6 million are bacteria-related, and 0.2 million are
caused by parasites. The most frequent cause of viral infection is norovirus, whereas
campylobacter and salmonella account for the greatest number of bacterial infections (see
Table 2). The deadliest foodborne illnesses are salmonella, Listeria, Toxoplasma gondii,
and norovirus (see Table 3). The pathogen most likely to result in hospitalization and
death is Listeria (see Tables 4 and 5).
The pathogens that cause foodborne illnesses flourish in environments of
improper temperature control and are spread by “infected food handlers, contaminated
raw ingredients, and cross-contamination” (Rooney et al., 2004, p. 427). According to
Harris et al. (2003), the pathogens responsible for foodborne illness outbreaks find their
way into the food chain during “food production, harvest, processing, transporting, and
more especially in retail and foodservice establishments such as restaurants and cafes” (p.
79). A pathogen’s potential to cause an infection is a function of its ability to survive on
food surfaces or surfaces that come in contact with food. According to Todd et al.,
(2009), enteroviruses can survive at room temperature for up to 2 weeks and in
refrigerated conditions for up to 2 months. Whereas pathogens found in the human body
thrive in moist conditions, rotavirus and skin bacteria flourish under dry conditions and in
low-moisture foods.

20
Table 2
Estimated Annual Episodes of Domestically Acquired Foodborne Illnesses
Pathogen Total Domestically acquired Foodborne, %
Bacteria
Bacillus cereus 63,623 63,411 100
Brucella spp. 2,003 1,679 50
Campylobacter spp. 1,322,137 1,058,387 80
Clostridium botulinum 56 55 100
Clostridium perfringens 969,342 966,120 100
STEC O157 96,534 93,094 68
STEC non–O157 168,698 138,063 82
ETEC, foodborne 39,781 17,897 100
Diarrheagenic E. coli 39,871 39,739 30
Listeria monocytogenes 1,662 1,607 99
Mycobacterium bovis 208 63 95
Salmonella spp. 1,229,007 1,095,079 94
S. enterica serotype 5,752 1,897 96
Shigella spp. 494,908 421,048 31
Staphylococcus aureus 241,994 241,188 100
Streptococcus spp. 11,257 11,219 100
Vibrio cholerae 277 84 100
V. vulnificus 207 203) 47
V. parahaemolyticus 44,950 40,309 86
Vibrio spp. 34,585 30,727 57
Yersinia enterocolitica 116,716 108,490 90
Subtotal 4,883,568 4,330,358)
Parasites
Cryptosporidium spp. 748,123 678,828) 8
Cyclospora cayetanensis 19,808 11,522 99
Giardia intestinalis 1,221,564 1,121,864 7
Toxoplasma gondii 173,995 173,415 50
Trichinella spp. 162 156 100
Subtotal 2,163,652 1,985,785
Viruses
Astrovirus 3,090,384) 3,089,868) <1
Hepatitis A virus 35,769 21,041 7
Norovirus 20,865,958 20,796,079 26
Rotavirus 3,090,384 3,089,868 <1
Sapovirus 3,090,384 3,089,868 <1
Subtotal 30,172,879 30,086,723)
Total 37,220,098 36,402,867
Note. From Scallan et al., 2011. Used with permission.

21
Table 3
Estimated Hospitalizations and Deaths from Common Pathogens
Pathogen Hospital. rate Hospitalizations Death rate Deaths
Bacteria
Bacillus cereus 0.4 20 0 0 Brucella spp. 55.0 55 0.9 1 Campylobacter spp. 17.1 8,463 0.1 76 Clostridium botulinum 82.6 42 17.3 9
Clostridium perfringens 0.6 438 <0.1 26
STEC O157 46.2 2,138 0.5 20
STEC non-O157 12.8 271 0.3 0 ETEC, foodborne 0.8 12 0 0 Diarrheagenic E. coli 0.8 8 0 0
Listeria 94.0 1,455 15.9 255 Mycobacterium bovis 55.0 31 4.7 3 Salmonella spp. 27.2 19,336 0.5 378
S. enterica serotype 75.7 197 0 0 Shigelle spp. 20.2 1,456 0.1 10 Staphylococcus 6.4 1,064 <0.1 6
Streptococcus spp. 0.2 1 0 0
Vibrio cholera 43.1 2 0 0 V. vulnifricus 91.3 93 34.6 36 V. perahaemolyticus 22.5 100 0.9 4 Vibrio spp. 37.1 83 3.7 8 Yersinia enterocolitica 34.4 533 2.0 29 Subtotal 35,756 861
Parasites
Cryptosporidium 25.0 210 0.3 4
Cyclospora
cayetanensis
6.5 11 0.0 0
Giardie intestinalis 8.8 225 0.1 2
Toxoplasma gondii 2.6 4,428 0.2 327 Trichinella spp. 24.3 6 0.2 0
Viruses
Astrovirus 0.4 87 <0.1 0
Hepatitis A virus 31.5 99 2.4 7
Norovirus 0.03 14,663 <0.1 149
Rotavirus 1.7 348 <0.1 0
Sapovirus 0.4 87 <0.1 0
Subtotal 15,284 157
Total 55,961 1,351
Note. From Scallan et al., 2011. Used with permission.

22
Table 4
2011 Pathogen-Caused Illnesses and Deaths
Note. From CDC (2011) FoodNet report. Used with permission. CFR = case fatality ratio.
Pathogen Deaths Cases CFR
Campylobacter 2 6,746 0.03 Listeria 22 134 16.42 Salmonella 24 7,763 0.31
Shigella 2 1,514 0.13 STEC O157 2 463 0.43
STEC non-O157 1 509 0.20
Vibrio 5 154 3.25 Yersinia 3 158 1.90 Cryptosporidium 6 1,334 0.45 Cyclospora 0 22 0.00 Total 67 18,797 0.36

23
Table 5
2011 Pathogen-Caused Hospitalizations
Note. From CDC (2011) FoodNet report. Used with permission.
Morris (2011) posed the question of whether the U.S. food supply was safer in
2011 than in 2000. He pointed to the FoodNet system, which was created to assess the
effect of 1995 U.S. Department of Agriculture (USDA) regulations codified in the
Hazard Analysis and Critical Control Point (HAACP) system. “FoodNet provides annual
data from designated sentinel surveillance sites on numbers of laboratory-diagnosed cases
of 10 predominantly foodborne bacterial and parasitic pathogens” (para. 5). These data,
according to Morris, showed an initial drop in infection rates after the USDA regulations
were implemented, “followed by leveling off in subsequent years” (para. 5).
Many foodborne illnesses go unreported, making it difficult to acquire complete
data on their frequency and type. The CDC’s foodborne illness surveillance network is an
attempt to compile comprehensive data based on reports from states, counties, and
municipalities. In 2004, a multistate foodborne illness outbreak resulted in about 600
Pathogen Hospitalizations Cases % Hospitalization
Campylobacter 1,001 6,746 14.84 Listeria 127 134 94.78 Salmonella 2,174 7,763 28.00
Shigella 321 1,514 21.20 STEC O157 201 463 43.41
STEC non-O157 90 509 17.68
Vibrio 49 154 31.82 Yersinia 56 158 35.44 Cryptosporidium 268 1,334 20.09 Cyclospora 3 22 16.64 Total 4,290 18,797 22.82
24
cases of salmonella, 154 of which required hospitalization. The major transmission
vehicles were roma tomatoes and ground beef (CDC, 2008). The same year, five
Maryland counties reported 178 cases of foodborne illness caused by norovirus, bacillus
cereus, clostridium perfringens, and scombroid toxi. Of these, 17 cases occurred in
private homes and 161 resulted from eating at restaurants. Foods implicated in these
illnesses included smoked salmon, chicken, crab, fried rice, fish sandwiches, iced tea,
seafood salad, beef, and pizza (CDC, 2008).
Salmonella is the most common bacterial infection in the United States (see
Tables 2 and 3). Many U.S. cases of salmonella infection result from food consumed in
other countries. For example, Kimura et al. (2004) attributed 50% of cases in one
outbreak to food eaten in Mexico. Domestically, the most common means of salmonella
infection are undercooked chicken and eggs.
Food Handling Safety Training
Foodborne illnesses result from a variety of causes: undercooked food, improper
food storage, contaminated food preparation surfaces, poor food handler hygiene, and
food obtained from unapproved or unsafe sources (Hedberg, Churas, Radke, Selman, &
Tauxe, 2008). Chukwuocha et al. (2009) estimated that 10-20% of foodborne illness is
due to improper food handling. Roberts et al. (2008) claimed that 59% of foodborne
illnesses can be traced to restaurant operations. Roberts, Barrett, and Sneed (2005) found
that among both chain and independently-owned restaurants, many lack explicit policies
regarding such food safety practices such as using gloves, washing hands, and taking the
temperature of foods after cooking. Todd et al. (2009) reported on a self-report survey of
U.S. food workers in which it was found that a fourth of those surveyed said they do not

25
always wash their hands before handling food and a third said they do not consistently
change gloves after handling raw meat. Given these facts, it is incumbent upon food
service establishments such as restaurants to improve food handling safety. Perhaps the
most obvious way to do so is through employee education.
Studies on the effects of food handling safety training have yielded mixed results.
Wright and Feun studied how inspection scores at restaurants were affected by a
certification process for food service managers and found no significant differences
between pre- and posttest scores (as cited in Roberts et al., 2008). Mathias et al. studied
the effects of food safety education and found that “the number of food handlers trained
in food safety had no significant effect on food safety inspection violations” (as quoted in
Roberts, 2008, p. 253). In their own study, Roberts et al. administered pre- and
posttraining assessments to employees from 31 restaurants in Iowa, Missouri, and
Kansas. The assessments addressed three components of food safety: personal hygiene,
time and temperature of food storage, and cross-contamination. The researchers found
that knowledge and compliance with behavioral standards improved with training.
However, when particular practices were examined individually, only hand-washing
knowledge and behavior improved significantly. Roberts et al. concluded that “training
can improve knowledge and behaviors, but knowledge along does not always improve
behaviors” (p. 252).
Chukwuocha et al. (2009) studied food handlers in Nigeria and found that about
half of their 430 participants displayed inadequate knowledge of food sanitation.
Knowledge was affected by educational level and job status, but the researchers found
“no significant difference in attitude and practice between trained and untrained food
26
handlers” (p. 240). Howes, McEwen, Griffith, and Harris (1996) found food safety
training did not necessarily result in safe food handling behavior. Campbell et al. (1998)
reviewed eight studies of food handler training programs. Six studies showed an
improvement in post training assessment measures.
Cohen, Reichel, and Schwartz (2001) tested the effect of a food handling training
program on food quality at a large food service company. They found a significant
improvement in microbiological quality after the training program, although the results
varied by department. Cotterchio, Gunn, Coffill, Tormey, and Barry (1998) assessed the
effectiveness of a training and certification program for food managers at 94 restaurants.
At restaurants where managers were required to attend the program, inspection scores
improved, and the results held during a 2-year follow-up period.
Hedberg et al. (2006) evaluated data from the Environmental Health Services
Network collected from 2002 to 2003. The researchers compared 22 restaurants where
foodborne disease outbreaks had occurred with 347 restaurants that had no outbreaks.
The two groups of restaurants were similar in the percentage that offered training for food
workers. The presence of a certified kitchen manager was associated with reduced
outbreak risks. Of the restaurants where an outbreak occurred, 32% had a certified
manager, compared with 71% at restaurants with no outbreaks. On the other hand,
“neither the presence of a CKM nor the presence of policies regarding employee health
significantly affected the identification of an infected person or carrier as a contributing
factor” (Hedberg, 2006, p. 2699).
Hammond, Brooks, Schlottmann, Johnson, and Johnson (2005) assessed the
effectiveness of food worker training in Florida. Results were mixed. Some contributing
27
factors to foodborne illness outbreaks increased after training, while others decreased.
The authors concluded that it was impossible to make definitive statements about
Florida’s food worker training program. They noted that one ongoing challenge for
restaurants is the high turnover rate among employees.
Cates et al. (2009) studied the effect of certified kitchen managers at 4,461 Iowa
restaurants and found mixed results. The presence of a certified manager resulted in
decreases for some inspection violations (food handling, equipment requirements,
dishwashing) but not others (temperature control, water, and sewage). The researchers
concluded that
kitchen managers who have successfully completed a food safety training and
certification program are knowledgeable about the relationship between
foodborne illness risk factors and safe food handling and preparation practices
and thus may be more likely to follow and enforce recommended practices to
control foodborne illness risk factors. (p. 388)
Egan et al. (2007) reviewed 46 studies of food safety training published between
1969 and 2003. Countries where the studies were conducted included the United States
(43%), United Kingdom (32%), Canada (4%), Italy (4%), Malaysia (4%), Australia (2%),
Bahrain (2%), New Zealand (2%), Nigeria (2%), and Saudi Arabia (2%). The majority of
studies involved food handlers (65%), with the rest involving food managers. The studies
addressed both attitudes and behavior. Training interventions included home study, as
well as on- and off-site courses and workshops. In studies that used pre- and posttraining
tests of knowledge, only one reported no significant differences. Only four studies
included retraining programs. Egan et al. reported that “the majority of food handlers and

28
managers expressed a positive attitude to food safety but this was not supported by self-
reported practices” (p. 1186).
Lynch, Elledge, Griffith, and Boatright (2003) surveyed restaurant managers in
Oklahoma County, Oklahoma, regarding their knowledge of food safety practices. The
survey addressed experience, sources of training, and certification. Results showed that
those three factors affected food safety knowledge, but there was no relationship between
hours of training and knowledge, nor did the time elapsed since training affect
knowledge.
Averett, Nazir, and Neuberger (2011) studied the effects of mandatory food
handler training imposed by the Kansas City, Missouri Health Department. Training
consisted of a 2-hour lecture conducted by health department personnel that covered hand
washing, dishwashing, hazardous materials, expiration dates, food storage, reheating, and
general hygiene. The researchers compared rates of food-handler violations before and
after implementation of the mandatory training. Although results showed some decreases
in violations after training, Averett et al. concluded that the training program as a whole
produced “no measurable benefit” (p. 14).
Food Industry Regulations
Many industries chafe at regulations, complaining that they hamper trade and
reduce profits. Goldsmith, Turan, and Gow (2003) compared how Europe and the United
States have responded to foodborne illness outbreaks, arguing that European
governments have generally taken an active and coordinated role, whereas the United
States “has opted for a more ad hoc and incremental approach” (p. 2), which has been
widely criticized. Goldsmith et al. cited a 2002 U.S. Government Accounting Report that

29
faulted the U.S. Department of Agriculture’s (USDA) Food Safety and Inspection
Service (FSIS) for inadequate oversight: “Although plants are required to take corrective
action each time a violation is cited, the number of repetitive violations in various
plants—109 in one plant alone—shows that FSIS has not ensured that recurring
violations were eliminated” (as quoted in Goldsmith, 2002, p. 2).
Regarding meat safety, Goldsmith et al. (2002) argued that in the United States
“there have been numerous failures of the system yet reform of the industry and novel
regulation is not apparent” (p. 5). Europe, on the other hand, practices “full meat
traceability and an animal passport system” (Goldsmith et al., 2002, p. 5). Goldsmith et
al. attributed the more lax approach in the United States to that country’s emphasis on
individual rights, which makes the judicial system the arbiter of food safety, whereas in
Great Britain such arbitration is the role of Parliament. The result, argued Goldsmith et
al., is that “food safety is essentially a legal issue” (p. 6) in the United States and
“essentially a regulatory issue” (p. 6) in the United Kingdom. The authors concluded that
because “the U.S. system involves government operating more tangentially to industry”
(p. 10) than in Europe, “organizations like the USDA have conflicting roles, supporting
the industry through its grades and standards, while at the same time attempting to
challenge errant practices” (p. 10).
Yasuda (2010) called the U.S. government’s system of food safety oversight a
“patchwork of . . . bureaucracies” (p. 202). At the federal level, that system comprises
some 15 agencies, including the FDA, USDA, and CDC. The distribution of
responsibility among these entities can seem somewhat arbitrary. For example, “The
USDA inspects meat, poultry, eggs, and the processing plants for these products, and the
30
FDA inspects the rest of foodstuffs and their plants” (Yasuda, 2010, p. 202). Consumer
advisories are issued by both state and federal agencies, and restaurant inspections can be
carried out by state, county, or municipal government agencies. Foodborne disease
outbreak statistics are compiled by the CDC but also by some state governments.
According to Yasuda (2010), although restaurant inspections account for a
considerable expenditure of resources, the effectiveness of those inspections is poorly
understood. Yasuda noted that “disease statistics are not collected separately or
disaggregated by local jurisdiction. There are no data regarding the strictness of
restaurant sanitary standards and their enforcement among different jurisdictions” (p.
207). Yasuda cited several studies about the results of restaurant inspections and argued
that they “have failed to show that restaurants with poor inspection scores cause more
food poisoning complaints than restaurants with better inspection scores” (p. 207).
Martinez, Fearne, Caswell, and Henson (2007) noted that foodborne illness
outbreaks are a political and economic, as well as a public health, issue. The researchers
documented a trend towards coregulation of food safety that involves both government
and private regulatory agencies. As public resources for food safety regulation dwindle,
state and local governments are increasingly willing to join with the private sector to
form coregulatory bodies. However, such ventures are complex and are threatened by a
variety of legislative obstacles.
Another approach to improving food safety is self-regulation in the food industry.
Sharma, Teret, and Brownell (2010) noted that self-regulation has had a checkered
history. In the tobacco industry, it has largely failed, but in others, such as fishing and
forestry, it has been more successful. Sharma et al. evaluated the food industry’s pledge

31
to self-regulate advertising geared to children. The researchers proposed three criteria by
which to evaluate several specific industry claims: transparency, meaningful objectives
and benchmarks, and accountability and objective evaluation. Using these criteria,
Sharma et al. considered the soft drink industry’s promise “to limit portion sizes of
beverages and set standards for the caloric and nutritional content of beverages to be sold
in schools, with greater restriction in elementary and middle schools than in high
schools” (p. 242). The researchers judged this promise largely unfulfilled, charging that
the process of establishing nutrition criteria was not transparent and did not
involve objective input from the scientific community. An example of flawed
criteria is that high schools, where much of the sugared-beverage intake occurs,
are subject to far less restriction than are elementary schools, where little intake
occurs. (Sharma et al., 2010, p. 242)
Sharma et al. (2010) also considered the effectiveness of the 2007 Children’s
Food and Beverage Advertising Initiative, a voluntary program to impose restrictions on
advertising to children in which healthy dietary choices and lifestyles are promoted. The
authors’ skepticism about this effort is reflected in their question, “Will depicting Ronald
McDonald, Captain Crunch, or the Trix Rabbit being physically active make it
permissible to promote unhealthy products to children?” (p. 244). Sharma et al. charged
that self-regulation in the food industry, as in other spheres, is motivated more by
external threats than by altruism. Given that fact, the authors concluded that “successful
self-regulation requires standards that industry can attain to earn the trust of the public,
the public health community, and government” (p. 246).

32
One strategy for promoting food safety in food-serving facilities is known as
hazard analysis of critical control point (HACCP). HACCP was developed by the
National Aeronautics and Space Administration (NASA) to maintain the safety of food
consumed by astronauts while in space. The FDA (2014) defined HACCP as “a
management system in which food safety is addressed through the analysis and control of
biological, chemical, and physical hazards from raw material production, procurement
and handling, to manufacturing, distribution and consumption of the finished product”
(para. 1). FDA guidelines for implementing HACCP stress the importance of training
employees in their role in maintaining food safety. HACCP includes seven principles:
• Conduct a hazard analysis.
• Determine critical control points.
• Establish critical limits.
• Establish monitoring procedures.
• Establish corrective actions
• Establish verification procedures.
• Establish record-keeping and documentation procedures. (FDA, 2014)
Zulkifly, Zahari, Jalis, and Othman (2009) studied the effectiveness of HACCP in
small and medium-sized enterprises in Malaysia, a country with a poor record of food
safety. The researchers interviewed managers of food-manufacturing companies about
their experience implementing HACCP. Results showed that most implementations were
in response to customer demand. HACCP implementation resulted in improved

33
productivity and employee commitment and morale. The chief barriers to implementing
HACCP were entrenched attitudes and a lack of technical and financial resources.
Almanza and Nesmith (2004) noted that safety training for food handlers in the
United States varies by state. Such training usually ends with an examination, and
successful trainees receive a certificate. Where certification is required, usually one CFM
is required at every site. Certification typically lasts for 5 years. Traditionally, a local
health department is the main regulatory body to enforce the certification requirement.
In Maryland, there is no statewide requirement regarding CFMs. Five of the
state’s 24 counties require such a manager on site at any medium- or high-priority food
facility. These managers undergo 16 hours of training, followed by an exam. Certification
is good for 3 years, after which completion of a 1-day recertification training is required.
Maryland also maintains a system of restaurant inspections, which are performed
by professional staff who have at least a 4-year degree and have undergone field training
prior to being licensed by the National Environmental Health Association. Every 3 years
they must account for having completed 20 hours of continuing education on food safety.
Inspectors must be familiar with state, county, and municipal regulations. Some
restaurants in Maryland post their inspection reports online so that patrons can make an
informed decision about whether to dine at a particular facility.
Public Policy and Foodborne Illness
According to he National Association of County and City Health Officials
(NACCHO), “Foodborne illness remains a major threat to public health, and local health
departments serve as the frontline defense against foodborne disease outbreaks” (p. 2).
NACCHO stated that reducing foodborne illness outbreaks depends on “improving

34
consumer education, strengthening reporting requirements, and building local health
department capacity” (p. 2). More specifically, NACCHO recommended establishing an
effective communication apparatus linking local health departments; forming an outbreak
team that includes epidemiologists, environmental health laboratories, regulatory
agencies, food industries, and agriculture departments; and conducting surveillance
investigations following outbreaks. One practical suggestion is to increase the number of
employers providing paid sick leave, which encourages sick employees to stay home and
thus limits the spread of foodborne illnesses.
A national nonprofit public health organization that advocates for improved
public policy is STOP Foodborne Illness. Created in 1994 in response to a West Coast
E. coli outbreak, STOP provides public testimony for proposed legislation and lobbies
federal agencies such as USDA, FDA, and CDC. The organization also provides
mentoring and counseling for victims of foodborne illness.
Summary
Foodborne illness continues to be a significant public health problem, resulting in
thousands of hospitalizations and deaths annually. The majority of reported foodborne
illnesses result from food consumed in restaurants. Because the federal government does
not specify food safety measures, states, counties, and municipalities have instituted a
variety of practices and means of assessment. That variety makes it difficult to evaluate
particular measures, such as the presence at a restaurant of a CFM. Studies of how food
safety training for managers and employees affects food safety have yielded mixed
results.

35
In Maryland, five of the state’s 24 counties require that a CFM be on duty during
a restaurant’s hours of operation. The effectiveness of that requirement has not been
studied, hence the need for the current study. In the next chapter, the study’s methods will
be presented, including research design, data collection and analysis procedures, and
ethical protections.
36
Chapter 3: Methods
Introduction
Food safety is a major public health problem in the United States. The federal
government does not mandate specific food safety practices, leaving states, counties, and
municipalities to implement their own requirements. In Maryland, five of the state’s 24
counties require that a CFM be on duty at all medium- and high-priority restaurants. The
effectiveness of that requirement has not been assessed. Accordingly, the current study
was designed to determine whether CFMs in Maryland have affected the incidence of
foodborne illness in the state. The study, based on the theory of planned behavior,
involved reviewing state public health data on foodborne-illness outbreaks in Maryland
between 2004 and 2013. In the remainder of this chapter, the study’s design, data
collection and analysis procedures, and ethical protections will be described.
Research Design
Sociological research can be classified as qualitative, quantitative, or mixed-
methods. A qualitative design is appropriate for studies of how people behave and for
exploring the meaning behind a particular phenomenon. Qualitative studies typically
involve a small number of participants and often interviews or focus groups. A qualitative
study involves describing and explaining participants’ lived experience (Babbie, 2007;
Maxwell, 2005; Trochim & Donnelly, 2006).
Quantitative studies usually involve arriving at generalizations based on
numerical data. They often address the relationship between two or more variables.
Quantitative research can be descriptive or experimental. Experimental studies are based
on comparing a treatment group and a control group. Nonexperimental research usually

37
involves variables that are not manipulated by the researcher (Mann, 2003; Trochim &
Donnelly, 2006). Mixed-methods studies employ both qualitative and quantitative
techniques. A mixed-methods researcher might start by administering a survey, then
conduct follow-up interviews with a subset of the original sample.
Quasi-experimental and cross-sectional designs are similar. Both are weaker on
internal validity compared to experimental designs. In the case of quasi-experimental
designs, “researchers can randomly select samples from a population, but do not require
the random assignment of individual cases to the comparison groups” (Nachmias &
Nachmias, 2008, p. 118). Both designs allow researchers to conduct studies in “natural,
real-life settings using probability samples” (Nachmias & Nachmias, 2008, p. 133), and
so improve external validity. Quasi-experimental designs “involve the study of more than
one sample,” and the study can continue for an extended period (Nachmias & Nachmias,
2008, p. 130).
Despite the similarities between quasi-experimental and cross-sectional designs,
the latter was more appropriate for the current study because it is relatively quick and
does not require extensive follow-up. Data on all variables are collected once. Cross-
sectional designs can use existing data instead of survey data (Olsen & St. George, 2004;
Public Health Action Support Team [PHAST], 2011). A cross-sectional design is
appropriate for describing the “pattern of relation between variables” (Nachmias &
Nachmias, 2008, p. 116), such as the relationship between foodborne illness outbreaks
and CFMs. Cross-sectional designs are good for descriptive analysis—that is, describing
the group that is being studied—and are able to measure prevalence for all factors being

38
studied (PHAST, 2011). This study employed inferential statistics to compare the two
groups of restaurants being studied.
The current research was a nonexperimental study based on document analysis.
The independent variable was the presence or absence of CFMs. The dependent variable
was the difference in average number of foodborne illness outbreaks between the two
groups of restaurants from 2004 to 2013. A foodborne illness outbreak is defined as an
“incident in which two or more persons experience a similar illness after ingestion of a
common food, and epidemiologic analysis implicates the food as the source of the
illness” (CDC, 2011, para. 1). Data were analyzed with two sample proportion tests when
the original plan to use independent-sample t test and ANOVA was found inappropriate
for my data. The documents analyzed were reports from the Maryland Department of
Health and Mental Hygiene relating to foodborne disease outbreaks from 2004 to 2013 in
the state’s medium- and high-priority restaurants.
A qualitative study was considered but rejected. There are five main types of
qualitative design. In ethnographic approach, “cultural groups are studied in their natural
setting for a prolonged period through observation and interviews” (Creswell, 2009, p.
13). Grounded theory involves “interaction grounded in the views of participants through
the use of multiple stages of data collection, refinement and interrelationships of
categories of information” (Creswell, 2009, p. 13). In a case study, a researcher explores
“programs, events, activities” (Creswell, 2009, p. 13) by using a variety of data collection
procedures for an extended period. In a phenomenological study, a researcher explores
the importance of “human experiences about a phenomenon” (Creswell, 2009, p. 13) as
described by participants. In a narrative study, a researcher studies the way individuals

39
live and asks them to tell stories about their lives (Creswell, 2009, p. 13). Although a
study involving individual interviews would produce richer data than is possible in one
based on a survey, the greater depth that could be achieved with a qualitative design
would come at the expense of the breadth that a quantitative study offers.
Research Questions and Hypotheses
The current study was based on one overarching research question: What is the
relationship between foodborne illness outbreaks and the presence of CFMs in Maryland
medium- and high-priority food establishments? This question led to the following
hypothesis, which is stated in both null and alternative form:
H0: There are no statistically significant differences in foodborne illness outbreaks
between the five Maryland counties that require CFMs in medium- and high-
priority food establishments and the 19 counties without such a requirement.
H1: There are statistically significant differences in foodborne illness outbreaks
between the five Maryland counties that require CFMs in medium- and high-
priority food establishments and the 19 counties without such a requirement.
Population and Sample
The target population for this study was all U.S. states that do not have uniform
requirement for restaurant CFMs. The accessible population was all restaurants in 24
Maryland counties—the five counties that require CFMs and the 19 counties that do not.
Based on an effect size equivalent of 0.3 (one-tailed), an alpha of 0.05, and a power (1-
beta) of 0.80, it was determined that a sample size of at least 64 was needed for the
current study, based on a G-Power calculation (Ellis, 2010, p. 139; Ellis, 2012, p. 25).
However, I used the entire data of 288 provided by Maryland DHMH. Each of the two
40
groups had a different sample size. The counties that require CFMs had 139 samples,
while no CFM counties had 149 restaurants, with an 80% chance of detecting an effect
and a 20% chance of avoiding a Type II error (Ellis, 2012, p. 25). Type II errors occur
when a false null hypothesis is accepted. Type I errors occur when a true null hypothesis
is rejected. The possibility of detecting an effect increases as the sample size increases
(Ellis, 2012).
The sample was drawn from all medium- and high-priority restaurants in
Maryland’s 24 counties. Counties report incidents of foodborne illness outbreaks to local
health departments, which forward them to the state. Based on the FoodNet surveillance
network system, reports are presented statewide despite the fact that monitoring takes
place within individual counties. FoodNet surveillance began in Maryland in 1998 and
expanded to include the entire state in 2002 (DHMH, 2002).
Data Collection
A letter was sent to the Maryland Department of Health and Hygiene requesting
permission to conduct the study (see Appendix A). Approval to conduct was also
obtained from the Walden University Institutional Review Board (IRB) with approval
number 04-30-15-0254919. Data were collected from the Vital Records Division of
Maryland’s Department of Health and Hygiene. These data consisted of information on
foodborne illness outbreaks in the state from 2004 to 2013: where and when they
occurred, and how many people were affected. This information is provided to the state
by local regulatory agencies or counties. Specifically, data from medium- and high-
priority food establishments from the Maryland five counties requiring CFMs and the 19
counties lacking such a requirement were reviewed and the average of foodborne illness

41
outbreaks in the two groups were compared. The 2004-2013 period was chosen because
2004 was when five Maryland counties began requiring the presence of a CFM in
restaurants, and 2013 is the most recent year for which disease information is available.
Permission was obtained from the Maryland Department of Health and Mental Hygiene
and Walden University’s IRB before data collection began.
Data Analysis
Data collected from the Maryland Department of Health and Hygiene were
subjected to statistical analysis. The plan was to calculate means and standard deviations
for the two groups, followed by a one-way ANOVA to determine if there was a
significant difference between the means of the two groups. Data were further planned to
be analyzed using independent-samples t tests, with an alpha value of .05, one-tailed, and
95% confidence level. The t test was also supposed to be used to compare the means of
the two groups of restaurants. However, these statistical methods were found
inappropriate for the analysis of data collected. Data analysis was performed with two
sample proportion test instead of SPSS, which was originally chosen because it has the
capability of handling large amounts of data.
Role of the Researcher
As the primary researcher for this study, I was responsible for collecting and
analyzing the data and interpreting the results. Because of my professional role as a
registered environmental health specialist, I was subject to potential bias. Part of my
former job was supervising the staff that inspects restaurants in Maryland. To minimize
bias, I bracketed any preconceived opinions before conducting the study.

42
Ethical Protections
Permission to conduct the study and IRB approval number 04-30-15-0254919
were obtained before I began data collection. All data have been stored securely. Hard
copies are kept in a locked file cabinet. Electronic data are stored on a password-
protected personal computer. All data will be destroyed 5 years after completion of the
study.
Summary
In this chapter, I described the methods for a quantitative study designed to
determine the effectiveness of a CFM requirement in Maryland medium- and high-
priority restaurants. Data collection was based on statistics regarding foodborne-illness
outbreaks from 2004 to 2013. Data were statistically analyzed using a two sample
proportion test because the original plan to employ one-way ANOVA and independent-
samples t tests used to check for average number of foodborne illness outbreak
differences between two groups were found inappropriate for my data.

43
Chapter 4: Results
Introduction
The purpose of this quantitative study was to determine the effect of an onsite
CFM on the incidence of foodborne disease outbreaks at Maryland medium- and high-
priority restaurants. Five Maryland counties require that food services employ CFMs; the
other 19 counties lack such a requirement. The requirement of CFMs by the Maryland
five counties had been in place during the period of this study. Baltimore County, for
instance, began enforcement of CFM in medium –and high-priority establishments in
2004. The study was based on one overarching question: What is the relationship
between foodborne illness outbreaks and the presence of CFMs in Maryland medium-and
high-priority food establishments? This question led to the following hypothesis: the null
hypothesis stated that there are no statistically significant differences between foodborne
illness outbreaks between the five Maryland counties that require CFMs in medium- and
high-priority food establishments and the 19 counties without such requirement. The
alternative hypothesis states that there are statistically differences in foodborne illness
outbreaks between the five Maryland counties that require CFMs in medium- and high-
priority food establishments and the 19 counties without such requirements. Data on
foodborne disease outbreaks between 2004 and 2013 were collected from the Maryland
Department of Health and Mental Hygiene. The analysis results and data description and
summary of this study are explained in the next sections.
Data Collection
The data for this study were collected from the Vital Records’ Division of
Maryland Department of Health and Mental Hygiene. Data collected consisted of

44
information on foodborne illness outbreaks in the state from 2004 to 2013: where and
when they occurred and how many people affected. These data were specifically from
medium and high-priority food establishments from the Maryland five counties requiring
CFMs and the 19 counties lacking such a requirement.
The proposed plan in chapter three was to conduct sampling from the existing
data for 288 medium and high-priority food establishments collected from the Maryland
Department of Health and Mental Hygiene. That plan was modified and the entire data,
comprising of 139 samples from counties requiring CFMs and 149 samples from counties
without such requirement were used for the study. Data collected represents the larger
population of restaurants in Maryland’s 24 counties.
Results
Data were separated into two groups: counties requiring CFMs (see Table 6) and
counties not requiring CFMs (see Table 7). Tables 6 and 7 list the number of restaurants
in each county reporting at least one outbreak of foodborne illness and the number of
restaurants not reporting outbreak of foodborne illness during the reporting period (2004-
2013). Two counties that did not require CFMs, Caroline and Somerset, reported no
outbreaks. The five Maryland counties that require CFMs had a total of 12,531 medium -
and high - priority food establishments in operation during the period of study, and 139 of
them reported 139 foodborne illness outbreaks, averaging 1.0 per restaurant. That means
a total of 12,392 restaurants from these counties did not report incidents of foodborne
outbreaks during the same period (see Table 6). On the other hand, the 19 Maryland
counties not requiring CFMs had 8,265 medium - and high – priority food establishments
in operation during the study period and 149 reported 157 foodborne illness outbreaks

45
averaging 1.1 per restaurant. The information from this data means that Maryland
counties that do not require CFMs had 8,116 restaurants that did not report foodborne
illness outbreaks during the study period (see Table 7). The significance of this data,
cannot be overlooked. For instance, the 19 Maryland counties not requiring CFMs had
the lowest number of restaurants and reported the highest number of foodborne illness
outbreaks. However, the five Maryland counties that require CFMs had the highest
number of restaurants and lowest number of foodborne outbreaks during the same period.
Data shows for example, 27 foodborne illness outbreaks reported by Baltimore
County, one of the CFM Counties in 2004-2013 (see Table 6), came from 27 different
restaurants in that county. However, Anne Arundel, a non-CFM County, had 35
foodborne outbreaks reported by 34 restaurants during the same period (see Table 7).
The first statistical assumption for this study is that sample proportion one is
equal to sample proportion two; that is, proportion one minus proportion two equals zero.
The second assumption is that proportion one is not equal to proportion two, meaning
that proportion one minus proportion two does not equal zero.

46
Table 6
Foodborne Outbreaks in Maryland Counties Requiring CFMs (2004-2013)
County Foodborne illness
outbreaks
The number of county restaurants
reporting outbreaks
The number of county restaurants that did not report
outbreaks
3. Baltimore 27 27 2,805
13. Howard 13 13 955
15. Montgomery 48 48 2,829
16. Prince George’s 22 22 2,369
24. Baltimore City 29 29 3,434
Total 139 139 12,392
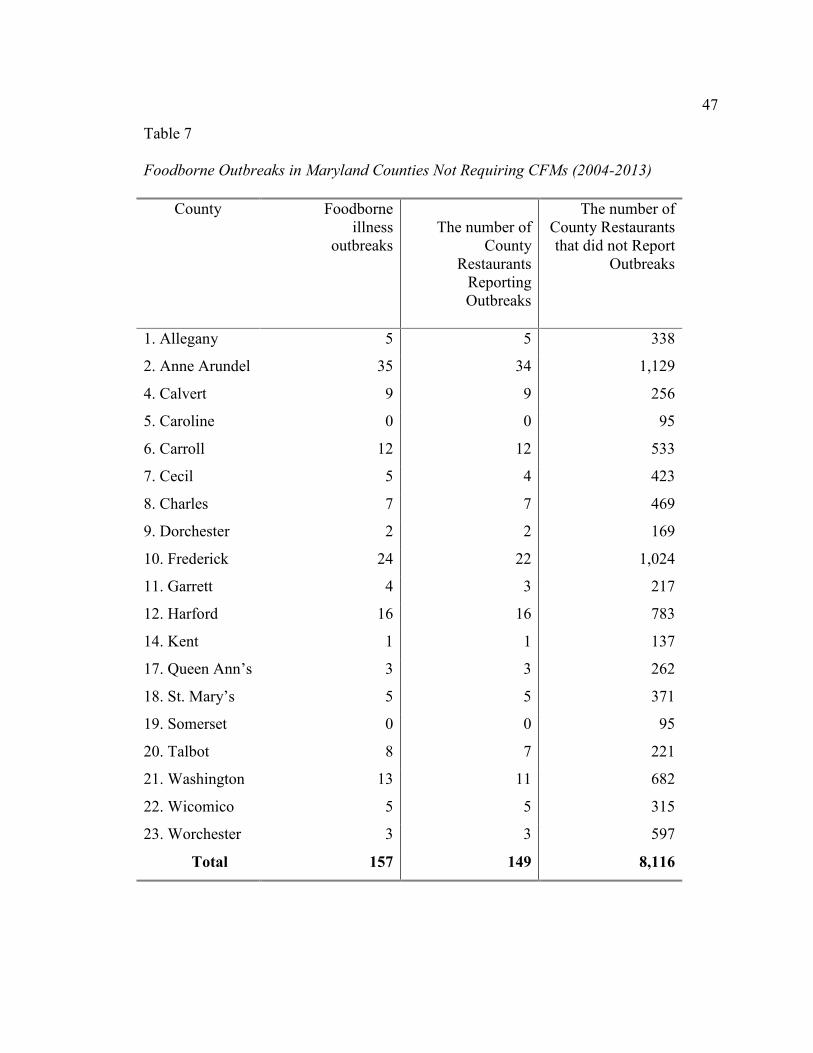
47
Table 7
Foodborne Outbreaks in Maryland Counties Not Requiring CFMs (2004-2013)
County Foodborne illness
outbreaks
The number of
County Restaurants
Reporting Outbreaks
The number of County Restaurants that did not Report
Outbreaks
1. Allegany 5 5 338
2. Anne Arundel 35 34 1,129
4. Calvert 9 9 256
5. Caroline 0 0 95
6. Carroll 12 12 533
7. Cecil 5 4 423
8. Charles 7 7 469
9. Dorchester 2 2 169
10. Frederick 24 22 1,024
11. Garrett 4 3 217
12. Harford 16 16 783
14. Kent 1 1 137
17. Queen Ann’s 3 3 262
18. St. Mary’s 5 5 371
19. Somerset 0 0 95
20. Talbot 8 7 221
21. Washington 13 11 682
22. Wicomico 5 5 315
23. Worchester 3 3 597
Total 157 149 8,116

48
Thus, the foodborne illness data reported by 149 restaurants in non-CFM Counties and
139 from CFM Counties were used for the study. First, the groups were separated
between CFM and non-CFM counties, then subjected to statistical analysis.
Data Analysis
During the proposal stage, it was assumed that data to be collected would be
normally distributed, and t test and ANOVA would be appropriate for the analysis. In
effect, however, the data analysis showed that the assumption of normality, necessary in
order to use these statistical tests appropriately, was not achieved. One of the study
groups had zero variance. Consequently, it was determined that both ANOVA and
independent sample t test would not be appropriate for the analysis of the data. The
results of ANOVA and independent sample t test that were originally proposed for this
study were deemed inappropriate (see Appendix C).
Therefore, it became necessary to conduct data analysis by employing a two-
sample proportion test using Minitab as the appropriate statistical method for this study.
The purpose of two-sample proportion test for this study was to determine whether there
was significance in foodborne illness outbreaks between five Maryland counties that
require CFMs and 19 counties without such requirement for their medium-and high-
priority food establishments.
The summarized data from county restaurants without CFMs showed 157
reported foodborne outbreaks out of 8,265 restaurants, p1, below, while samples from
counties that required CFMs had 139 foodborne outbreaks from 12,531 restaurants, p2,
below.
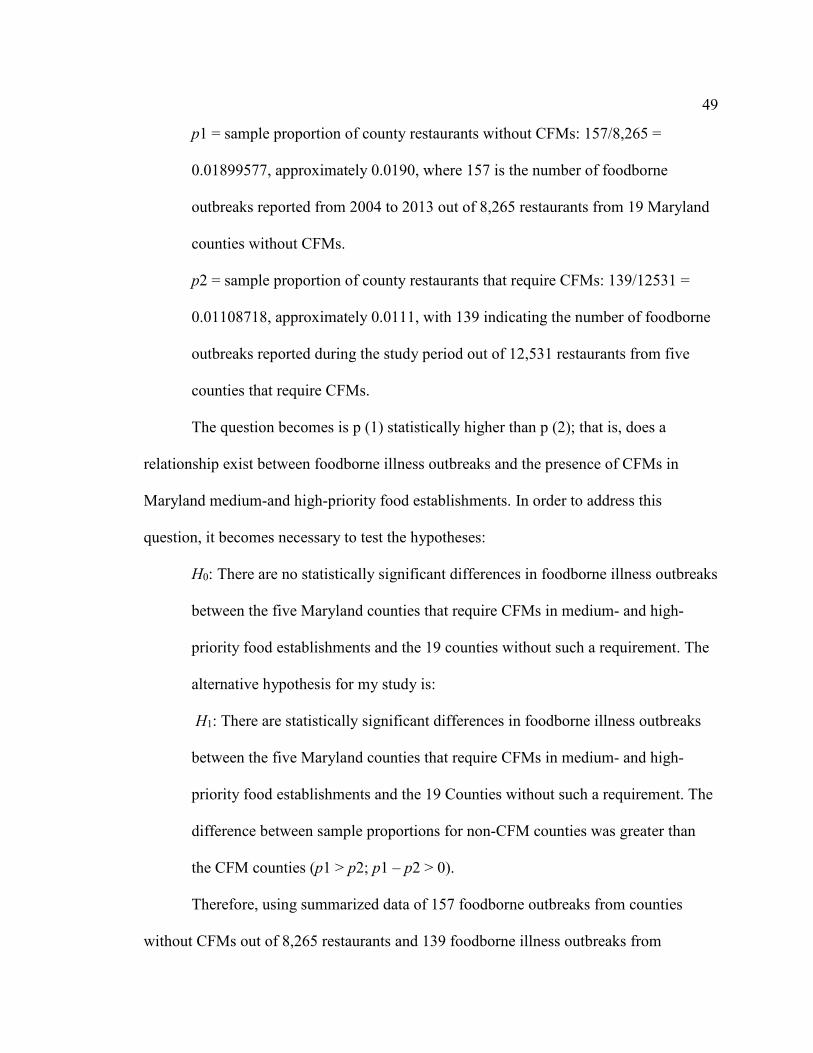
49
p1 = sample proportion of county restaurants without CFMs: 157/8,265 =
0.01899577, approximately 0.0190, where 157 is the number of foodborne
outbreaks reported from 2004 to 2013 out of 8,265 restaurants from 19 Maryland
counties without CFMs.
p2 = sample proportion of county restaurants that require CFMs: 139/12531 =
0.01108718, approximately 0.0111, with 139 indicating the number of foodborne
outbreaks reported during the study period out of 12,531 restaurants from five
counties that require CFMs.
The question becomes is p (1) statistically higher than p (2); that is, does a
relationship exist between foodborne illness outbreaks and the presence of CFMs in
Maryland medium-and high-priority food establishments. In order to address this
question, it becomes necessary to test the hypotheses:
H0: There are no statistically significant differences in foodborne illness outbreaks
between the five Maryland counties that require CFMs in medium- and high-
priority food establishments and the 19 counties without such a requirement. The
alternative hypothesis for my study is:
H1: There are statistically significant differences in foodborne illness outbreaks
between the five Maryland counties that require CFMs in medium- and high-
priority food establishments and the 19 Counties without such a requirement. The
difference between sample proportions for non-CFM counties was greater than
the CFM counties (p1 > p2; p1 – p2 > 0).
Therefore, using summarized data of 157 foodborne outbreaks from counties
without CFMs out of 8,265 restaurants and 139 foodborne illness outbreaks from

50
counties that require CFMs out of 12,531 restaurants, the null and alternative hypothesis
were tested. The result of the two-sample proportion test appears in Table 8.
Table 8
Test and CI for Two Proportions
Sample X N Sample p
Non-CFM (1) 157 8,265 0.018996
CFM (2) 139 12,531 0.011092
Difference = p (1) - p (2) Estimate for difference: 0.00790327 95% lower bound for difference: 0.0049932 Test for difference = 0 (vs > 0): z = 4.71 p value = 0.000 Fisher’s exact test: p value = 0.000 p <.05 and alpha value = 0.05
Since the p value is less than alpha value, the null hypothesis is therefore rejected.
Therefore, there is evidence to suggest that there is a significance difference in the
proportion of foodborne illness outbreaks between county restaurants that require CFMs
and those without such a requirement: a 95% confidence and a lower bound at 0.005
0.008(95% CI, 0.005), z = 4.71, p = 0.000.
The study’s results show that there is a relationship between foodborne illness
outbreaks and the presence or absence of CFMs in restaurants operating as medium- and
high-priority food establishments. Counties employing on-site CFMs had fewer incidents
of foodborne illness outbreaks than did counties without such a requirement. The
question arises whether one foodborne outbreak on average over a ten-year period is
significant enough to consider a change in current regulations. This can be answered

51
affirmatively because when it comes to foodborne outbreak, one outbreak is enough to
send thousands of people to hospitals and may even lead to death.
Summary
In this chapter, the results were presented for a quantitative study designed to
determine the effect of CFMs on the incidence of foodborne illness outbreaks in
Maryland medium- and high-priority restaurants. Data analysis consisted of computing
descriptive statistics and conducting a two-sample proportion test. Results indicated that
restaurants without CFMs were more likely to experience a foodborne illness outbreak
(Sample proportion = 0.0190) than were restaurants with CFMs (Sample proportion =
0.0111). The results obtained by analyzing data using a two-sample proportion test
suggest that there is significance difference in foodborne illness between county
restaurants that require CFMs and those without such requirement. In the next chapter,
these results will be discussed, and recommendations will be made.

52
Chapter 5: Discussion, Conclusions, and Recommendations
Introduction
The purpose of this quantitative study was to determine whether the presence of
an onsite CFM affects the number of foodborne disease outbreaks reported at Maryland
medium- and high-priority restaurants. The nature of study was quantitative, based on a
cross-sectional design. The independent variable was the presence of CFMs at a given
food service establishment. The dependent variable was the difference in the proportion
of foodborne illness outbreaks between the two groups of restaurants. Data were
collected from the Maryland Department of Health and Mental Hygiene for 2004-2013.
A total sample of 139 foodborne illness outbreaks from 12,531 restaurants in the five
Maryland counties requiring CFMs was compared to 157 foodborne outbreaks from
8,265 restaurants in the 19 Maryland counties without such a requirement. Results
showed that restaurants without CFMs reported a significant difference of 0.008
foodborne disease outbreaks, more than restaurants with CFMs. This result is significant
because five counties requiring CFMs have more food establishments during the study
period, 12,531, than the 19 counties without this requirement, with 8,265. Data shows
that CFM counties reported fewer foodborne outbreaks compared to non-CFM counties.
Consequently, when this result is compared to data analysis using a two-sample
proportion test, the outcome of 0.008(95% CI, 0.005), z = 4.71, p =0.000 suggests that
there is significance difference in regard to foodborne disease outbreaks between county
restaurants that require CFMs and those without such requirement.

53
Discussion
This study was based on TPB, which is based on TRA. The difference between
the two theories is that TRA theorists assume that people are usually in control of a
particular behavior, whereas TPB theorists assume that people are not necessarily in
control of their behavior. According to Roberts et al. (2008), TPB is appropriate when
formal skills, such as education and social cooperation, are required. Applying TPB to the
topic at hand yields the conclusion that if a restaurant worker does not receive adequate
training in food-handling procedures, that person will not understand the implications of
his or her behavior and thus will not be in full control of the behavior.
According to Scallan et al. (2011), approximately 9.4 million cases of foodborne
illness are reported in the United States each year, resulting in 55,961 hospitalizations
and 1,351 deaths. Harris et al. (2003) stated that the pathogens responsible for foodborne
illness outbreaks find their way into food chain during “food production, harvest,
processing, transport, and more especially in retail and food service establishments such
as restaurants and cafes” (p. 79). Many foodborne illnesses go unreported, making it
difficult to acquire complete data on their frequency and type. The CDC’s foodborne
illness surveillance network is an attempt to compile comprehensive data based on
reports from states, counties, and municipalities.
According to Roberts et al. (2008), 59% of foodborne illnesses can be traced to
restaurant operations. Roberts et al. (2005) found that many chain and independently-
owned restaurants lack explicit policies regarding food safety practices. Todd et al.
(2009) reported that one fourth of U.S. food workers in a survey said they do not always
wash their hands before handling food, and a third said they do not consistently change

54
gloves after handling raw meat. These facts make it clear that food service establishments
need to improve food handling safety through better employee education and monitoring
of food handling behavior.
Conclusions
The research question on which this study was based asked, “What is the
relationship between foodborne illness outbreaks and the presence of CFMs in Maryland
medium- and high-priority food establishments?” The results showed that between 2004
and 2013, facilities operating with onsite CFMs reported fewer cases of foodborne illness
outbreaks (Sample proportion = 0.0111) than did facilities without CFMs (Sample
proportion = 0.0190), a statistically significant difference of 0.008(95% CI, 0.005), z =
4.71, p = 0.000.
The two-sample proportion method was deemed more appropriate for data
analysis than the proposed ANOVA and independent sample t test where one sample
group has zero variance. The results show that the p value was less than alpha value of
0.05, and therefore, the null hypothesis was rejected.
Limitations
This study was limited to medium- and high-priority food establishments in a
single state: Maryland. The results cannot be generalized to other states or to other types
of food services. The study was based on foodborne illness outbreaks reported to the
Maryland Department of Health and Mental Hygiene from 2004 to 2013. Because not all
incidences of foodborne illness are reported, it cannot be assumed that the data on which
this study was based were comprehensive and complete.
55
Contribution of the Study to Social Change
Foodborne illnesses affect 48 million people annually in the United States,
resulting in about 3,000 deaths and costing $77.7 billion (CDC, 2014). U.S. adults eat an
average of 4.8 meals per week in restaurants (United Press International, 2011). Given
these statistics, the safety of food eaten in restaurants is an important matter of public
health. Results of the current study suggest that people living in Maryland counties
without a requirement that medium- and high-priority restaurants employ an onsite CFM
are at greater risk of exposure to pathogens that cause foodborne illness than are state
residents living in counties with such a requirement.
Results of this study can be used to make a case that Maryland should adopt a
statewide requirement that all foodservice establishments require the presence of an
onsite CFM whenever an establishment is open for business. This study’s results can also
be used to confirm the importance of training in proper food-handling techniques for
foodservice workers and for improved supervision and monitoring of those workers.
CFMs improve food safety and thus contribute to improved public health, in turn
reducing expenses for medical treatment, reducing pain and suffering, and reducing time
missed at work and the accompanying lost wages for the nation’s workforce.
Chukwuocha et al. (2009) found that training in safe food-handling practices
resulted in reduction of foodborne illness outbreaks. Averett et al. (2011) called for more
effective education for food handlers. Results of the current study confirm the
conclusions of this earlier research and can help reduce the number of hospitalizations
and deaths resulting from preventable foodborne illnesses. Such reductions will improve

56
the economic status of potential disease victims by reducing disease-treatment costs and
lost wages as well as foodservice establishments by reducing lawsuits.
Although the focus of this study was on food safety in restaurants, its results can
be used to inform public education directed toward reducing illnesses acquired from
improper food-preparation techniques at home,the largest source of foodborne illnesses.
Schools and public health centers can benefit from the results of this study in their
educational efforts. Elected officials and policy makers can use the results of this study to
guide legislative changes that will improve the safety of the food Americans eat. The
result of all these efforts will be an improved quality of life and greater economic
prosperity for the nation’s citizens.
Recommendations for Action
The impact of foodborne illness outbreaks to the society should compel the
government to become more involved in the education and certification of food workers
rather than leaving it to individual state and local governments to monitor. I recommend
the following actions be taken:
1. The federal government should play an active role in advising states about
how to improve food safety, including the benefits of requiring CFMs in all
restaurants. A federal presence is important because foodborne illness
outbreaks are not constrained by geographical borders. Therefore, the FDA
should provide clear guidance to states about how to reduce foodborne illness
outbreaks. In the absence of federal action, individual states should implement
requirements regarding the presence of CFMs in foodservice establishments.
57
2. Individual foodservice establishments should provide consistent and
comprehensive training for all employees who handle food. Such training
should include an emphasis on washing hands; wearing gloves; and observing
safe practices for preparing, cooking, and storing food.
3. Consumers should take steps to ensure that the foodservice establishments
they patronize employ safe food handling, preparation, storing, and serving
procedures. Pressure from consumers will improve the implementation and
monitoring of food safety practices.
4. Schools and public health agencies should increase and improve their efforts
to educate the public about food safety.
Recommendations for Further Research
This subject is important in keeping our food supply chain safe and our
community healthy. Therefore, I recommend that additional studies be conducted in the
following areas:
1. This study was based on data from a single state: Maryland. The study could
be replicated in other states and other parts of the United States.
2. Additional research could determine whether there are differences in
foodborne illness outbreaks among urban, suburban, and rural areas.
3. The current study was quantitative. A qualitative or mixed-methods study
could incorporate interviews with foodservice employees—both supervisors
and front-line workers. Such interviews could address the quality and
consistency of food safety training, as well as the potential disjuncture
between what people are told and how they behave on the job.

58
4. A longitudinal study could track the progress of foodservice establishments
that employ CFMs over a period of implementing such personnel.
5. Additional research is needed to determine whether there is a relationship
between foodborne illness incidence in restaurants and private homes in a
given area.
6. A study controlling for restaurant size could determine whether that variable
affects the incidence of foodborne illnesses.
Summary
Foodborne illness represents an ongoing public health problem. Results of this
quantitative study indicate that foodborne illness outbreaks were less frequent in
Maryland medium- and high-priority restaurants that require onsite CFMs compared to
state establishments without such a requirement. Results of the study can be used by
legislators, educators, public health officials, and foodservice owners and operators to
improve food safety, thereby improving public health, reducing health care costs and lost
wages, and contributing to greater prosperity for both consumers and dispensers of food.

59
References
Almanza, B. A., & Nesmith, M. S. (2004). Food safety certification regulations in the
United States. Journal of Environmental Health, 66(9), 10-14.
Allwood, P. B., Jenkins, T., Paulus, C., Johnson, L., & Hedberg, C. W. (2004). Hand
washing compliance among retail food establishment workers in Minnesota.
Journal of Food Protection, 67(12), 2825-2828.
Ajzen, I. (1985). From intentions to actions: A theory of planned behavior. In J. Kuhl &
J. Beckmann (Eds.), Action control: From cognition to behavior (pp. 11-39). New
York: Springer-Verlag.
Ajzen, I. (1991). The theory of planned behavior. Organizational Behavior and Human
Decision Process, 50, 179-211.
Ajzen, I., & Fishbein, M. (1977). Attitude-behavior relations: A theoretical analysis and
review of empirical research. Psychological Bulletin, 84, 888-918.
Ajzen, I., & Fishbein, M. (1980). Understanding attitudes and predicting social behavior.
Englewood Cliffs, NJ: Prentice Hall.
Ajzen, I., & Madden, T. (1986). Prediction of goal-directed behavior: Attitudes,
intentions, and perceived behavioral control. Journal of Experimental Social
Psychology, 22, 453-474.
Averett, E., Nazir, N., & Neuberger, J. S. (2011). Evaluation of a local health
department’s food handler training program. Journal of Environmental Health,
73(6), 65-69.
Babbie, E. (2007). The practice of social research (11th ed.). New York, NY: Thomson
Wadsworth.

60
Bagozzi, R. P., Baumgartner, H., & Yi, Y. (1992). State versus action orientation and the
theory of reasoned action: An application to coupon usage. Journal of Consumer
Research, 18, 505-518.
Baltimore County Department of Health. (2011). Code of Baltimore County regulations
1.01.01: Food service facilities. Baltimore, MD: Author.
Bandura, A. (1977). Self-efficacy: Toward a unifying theory of behavioral change.
Psychological Review, 84(2), 191-215.
Barbara, A. A., & Melissa, N. S. (2004). Food safety certification regulations in the
United States. Journal of Environmental Health, 66(9), 10-13.
Beaulie, J., Scutchfield, F. D., & Kelly, A. V. (2003). Content and criterion validity
evaluation of national public health performance standard measurement
instruments. Public Health Reports, 118, 508-517.
Blue, C. L. (1995). The predictive capacity of the theory of reasoned action and the
theory of planned behavior in exercise behavior: An integrated literature review.
Research in Nursing and Health, 18, 105-121.
Bryan, F. I. (2002). Where we are in retail food safety, how we got to where we are, and
how do we get there? Journal of Environmental Health, 65(2), 29-36.
Campbell, M. E., Gardner, C. E., Dwyer, J. J., Isaacs, S .M., Krueger, P. D., & Ying, J.
Y. (1998). Effectiveness of public health interventions in food safety: A
systematic review. Canadian Journal of Public Health, 89(3), 197-202.
Cates, S. C., Muth, M. K., Karns, S. A., Penne, M. A., Stone, C. N. . . . Radke, V. J.
(2009). Certified kitchen managers: Do they improve restaurant inspection
outcomes? Journal of Food Protection, 72(2), 384-391.

61
Centers for Disease Control and Prevention. (2008). Foodborne disease outbreaks are
deadly serious: What you can do to avoid them. Retrieved from
http://www.cdc.gov/features/dsfoodborneoutbreaks/
Centers for Disease Control and Prevention. (2011). Vital signs: Incidence and trends of
infection with pathogens transmitted commonly through food—Foodborne
Diseases Active Surveillance Network, 10 U.S. sites, 1996-2010. Morbidity and
Mortality Weekly Report, 60(22), 749-755.
Centers for Disease Control and Prevention. (2014). Estimates of foodborne illness in the
United States. Retrieved from http://www.cdc.gov/ foodborneburden/index.html
Centers for Disease Control and Prevention. (2011). National Notifiable diseases
surveillance system (NNDSS). Retrieved from http://
http://wwwn.cdc.gov/nndss/script/casedef.aspx?CondYrID=677&DatePub=1/1/20
11%2012:00:00%20AM
Chukwuocha, U. M., Dozie, I. N. S., Amadi, A. N., Nwankwo, B. O., Ukaga, C. N. . . .
Nwoke, E. A. (2009). The knowledge, attitudes and practices of food handlers in
food sanitation in a metropolis in Southeastern Nigeria. East African Journal of
Public Health, 6(3), 243-246.
Clark, P. V. L., & Creswell, J. W. (2008). The mixed methods reader. Thousand Oaks,
CA: Sage.
Cohen, E., Reichel, A., & Schwartz, Z. (2001). On the efficacy of an in-house food
sanitation training program: Statistical measurements and practical considerations.
Journal of Hospitality and Tourism Research, 25(1), 5-16.
doi:10.1177/109634800102500102

62
Conner, M., & Armitage, C. J. (1998). Extending the theory of planned behavior: A
review and avenues for further research. Journal of Applied Social Psychology,
28(15), 1429-1464.
Cotterchio, M., Gunn, J., Coffill, T., Tormey, P., & Barry, M. A. (1998). Effect of a
manager training program on sanitary conditions in restaurants. Public Health
Reports, 113(4), 353-358.
Creswell, J. W. (2009). Research design: Qualitative, quantitative, and mixed methods
approaches (3rd ed.). Thousand Oaks, CA: Sage.
Curtis, V. A., Danquah, L. O., & Aunger, R. V. (2009). Planned, motivated and habitual
hygiene behavior: An eleven-country review. Health Education Research, 24(4),
655-673.
Department of health and mental hygiene, (2002). Epidemiology of campylobacter
infection in Maryland. Maryland FoodNet 2002-2004. Retrieved from
http://dhmh.maryland.gov/phase/Documents/Stephanie_Mickelson.pdf
Downing, S. M. (2003). Validity: On the meaningful interpretation of assessment data.
Medical Education, 37, 830-837
Egan, M. B., Raats, M. M., Grubb, S. M., Eves, A., Lumbers, M. L. . . . Adams, M. R.
(2007). A review of food safety and food hygiene training studies in the
commercial sector. Food Control, 18, 1180-1190.
doi:0.1016/j.foodcont.2006.08.001
Ellis, P. D. (2010). The essential guide to effect sizes: Statistical power, meta-analysis,
and the interpretation of research results. New York, NY: Cambridge University
Press.
63
Ellis, P. D. (2012). Statistical power trip: How the analysis of statistical power will help
you win grants, get published, and have a successful research career. From the
author of the essential guide to effect sizes. Published by MadMethods, an imprint
of KingsPress.org. For other titles in the MadMethods series, visit
www.MadMethods.co
FDA National Retail Food Team. (2009). FDA report on the occurrence of foodborne
illness risk factors in selected institutional foodservice, restaurant, and retail food
store facility types. Retrieved from http://www.fda.gov/
downloads/Food/FoodSafety/RetailFoodProtection/FoodborneIllnessandRiskFact
or Reduction/RetailFoodRiskFactorStudies/UCM224682.pdf
Field, A. (2009). Discovering statistics using SPSS (3rd ed.). Thousand Oaks, CA: Sage.
Fox N., Hunn A., & Mathers N. (2009). Sampling and sample size calculation.
Nottingham, UK: National Institute for Health Research.
Goldsmith, P., Turan, N., & Gow, H. (2003). Food safety in the meat industry: A
regulatory quagmire. International Food and Agribusiness Management Review,
6(1), 1-13.
Guzewich, J., & Ross, M. P. (1999). Evaluation of risks related to microbiological
contamination of ready-to-eat food by food preparation workers and the
effectiveness of interventions to minimize those risks. Washington, DC: FDA
Center for Food Safety and Applied Nutrition.
Hammond, R. M., Brooks, R. G., Schlottmann, J., Johnson, D., & Johnson, R. J. (2005).
Assessing the effectiveness of food worker training in Florida: Opportunities and
challenges. Journal of Environmental Health, 68(3), 19-24.

64
Harris, K. (2001). Food safety: A public crime. New York, NY: Haworth Press.
Harris, L. J., Farber, J. N., Beuchat, L. R., Parish, M. E., Suslow, T. V. . . . Busta, F. F.
(2003). Outbreaks associated with fresh produce: Incidence, growth, and survival
of pathogens in fresh and fresh cut produce. Comprehensive Review of Food
Science Food Safety, 2, 78-141.
Hedberg, C. W., Churas, K. L. P., Radke, V. J., Selman, C. A., & Tauxe, R. V. (2008).
The use of clinical profiles in the investigation of foodborne outbreaks in
restaurants: United States, 1982-1997. Epidemiological and Infection, 136(1), 65-
72.
Hedberg, C. W., Smith, S. J., Kirkland, E., Radke, V., Jones, T. F., & Selman, C. A.
(2006). Systematic environmental evaluations to identify food safety differences
between outbreak and nonoutbreak restaurants. Journal of Food Protection,
69(11), 2697-2702.
Howes, M., McEwen, S., Griffith, M., & Harris, L. (1996). Food handler certification by
home study: Measuring changes in knowledge and behavior. Dairy, Food, and
Environmental Sanitation, 16, 737-744.
Jones, T. F., & Angulo, F. J. (2006). Eating in restaurants: A risk factor for foodborne
disease? Clinical Infectious Disease, 43(10), 1324-1328.
Kimura, A. C., Reddy, V., Marcus, R., Cieslak, P. R., Mohle-Boetani, J. C. . . .
Swerdlow, D. L. (2004). Chicken consumption is a newly identified risk factor for
sporadic Salmonella enterica serotype Enteritidis infections in the United States:
A case-control study in FoodNet sites. Clinical Infectious Disease, 38(Suppl. 3),
S244-252.

65
Koechlin, K. K. M. (2009). Does educational intervention reduce the number of food
violations (Unpublished master’s thesis). Georgia State University, Atlanta, GA.
Lee, B. (2013, September). A review of food safety interventions and evaluation in food
service establishments. National Collaborating Centre for Environmental Health.
Retrieved from http://ncceh.ca/sites/default/files/Food_Safety_Interventions_
Sept_2013_0.pdf
Lynch, R. A., Elledge, B. I, Griffith, C. C., & Boatright, D. T (2003). A comparison of
food safety knowledge among restaurant managers, by source of training and
experience, in Oklahoma County, Oklahoma. Journal of Environmental Health,
66(2), 9-14.
Mann, J. (2003). Observational research methods: Cross-sectional and case-control
studies. Journal of Emergency Medicine, 20, 54-60.
Martinez, M. G., Fearne, A., Caswell, J. A., & Henson, S. (2007). Co-regulation as a
possible model for food safety governance: Opportunities for public-private
partnerships. Food Policy, 32, 299-314. doi:10.1016/j.foodpol.2006.07.005
Maxwell, J. A. (2005). Qualitative research design: An interactive approach (2nd ed.).
Thousand Oaks, CA: Sage.
McCabe-Sellers, B. J., & Beattie, S. E. (2004). Food safety: Emerging trends in
foodborne illness surveillance and prevention. Journal of the American Dietary
Association, 104(11), 1708-1717. Retrieved from http://wwwnc.cdc.gov/
eid/article/17/1/10-1821_article
Nachmias, C. F., & Nachmias, D. (2008). Research methods in the social sciences (7th
ed.). New York, NY: Worth.

66
National Association of County and City Health Officials. (2013). Statement of policy:
Foodborne disease outbreak response. Retrieved from http://www.naccho.org/
advocacy/positions/upload/13-07-Foodborne-Disease-Outbreak-Response.pdf
National Academy of Sciences. (1999). Food safety assessment of the NAS report
ensuring safe food from production to consumption. Retrieved from
http://clinton3.nara.gov/WH/EOP/OSTP/html/foodsafety.html
National Restaurant Association. (2012). ServSafe manager (6th ed.). Chicago, IL:
Author.
Nielsen, S. S. (2010). United States government regulations and international standards
related to food analysis. Food Analysis, Food Science Text Series, pp. 15-33.
doi:10.1007/978-1-4419-1478-1_2
Olsen, C. & St. George, D. M. M. (2004). Cross-sectional study design and data
analysis. The young epidemiology scholars program (Yes) supported by the
Robert Wood Johnson foundation and administered by the College Board.
Retrieved from
http://www.collegeboard.com/prod_downloads/yes/4297_MODULE_05.pdf
Pilling, V. K., Brannon, L. A., Roberts, K. R., Shanklin, C. W., & Howells, A. D. (2009).
Using the theory of planned behavior to elicit restaurant employee beliefs about
food safety: Using surveys versus focus groups. Retrieved from
http://krex.ksu.edu
Powell, D. A., Jacob, C. J., & Chapman, B. J. (2011). Enhancing food safety culture to
reduce rates of foodborne illness. Food Control, 22(6), 817-822.
doi:10.1016/j.foodcont.2010.12.009

67
Public Health Action Support Team. (2011). Introduction to study designs-cross-
sectional studies. Health knowledge education, CPD and revalidation from
PHAST. Retrieved from: http://www.healthknowledge.org.uk/e-
learning/epidemiology/practitioners/introduction-study-design-css
Roberts, K. R. (2008). Using the theory of planned behavior to explore restaurant
managers support for employee food safety training (Doctoral dissertation).
Kansas State University, Manhattan, KS.
Roberts, K. R., & Barrett, B. B. (2011). Restaurant managers’ beliefs about food safety
training: An application of the theory of planned behavior. Journal of Foodservice
Business Research, 14(3), 206-225.
Roberts, K. R., Barrett, B. B., Howells, A. D., Shanklin, C. W., Pilling, V., & Brannon,
L. (2008). Food safety training and foodservice employees’ knowledge and
behavior. Food Protection Trends, 28(4), 252-260. Retrieved from http://krex.k-
state.edu/dspace/bitstream/2097/806/1/RobertsFPTApr2008.pdf
Roberts, K. R., Barrett, B., & Sneed, J. (2005). Health department sanitarians perception
of food safety practices in restaurants. Food Protection Trends, 25, 694-700.
Rooney, R. M., Cramer, E. H., Mantha, S., Nichols, G., Bartram, J. K. . . . Benembarek,
P. K. (2004). A review of outbreaks of foodborne disease associated with
passenger ships: Evidence for risk management. Public Health Report, 119(4),
427-434.

68
Rosen, L., Zucker, D., Brody, D., Engelhard, D., & Manor, O. (2009). The effect of a
handwashing intervention on preschool educator beliefs, attitudes, knowledge and
self-efficacy. Health Educational Resources, 24(4), 686-698.
doi:10.1093/her/cyp004
Salant, P., & Dillman, D. A. (1994). How to conduct your own survey. New York, NY:
John Wiley and Sons.
Scallan, E., Hoekstra, R. M., Angulo, F. J., Tauxe, R. V., Widdowson, M. A. . . . Griffin,
P. M. (2011). Foodborne illness acquired in the United States: Major pathogens.
Emerging Infectious Disease, 17(1), 7-15.
Scharff, R. L. (2011). Economic burden from health losses due to foodborne illness in the
United States. Journal of Food Protection, 75(1), 123-131. doi:10.4315/0362-
028X.JFP-11-058
Sharma, L. L., Teret, S. P., & Brownell, K. D. (2010). The food industry and self-
regulation: Standards to promote success and to avoid public health failures.
American Journal of Public Health, 100(2), 240-246.
doi:10.2105/AJPH.2009.160960
Taber, J. G. (2004). The effect of mandated food safety certification in Kings County,
California on the occurrence of risk factors associated with foodborne illness.
(Doctoral dissertation). Retrieved from
http://search.proquest.com/docview/305034824
69
Todd, E. C. D., Greig, J. D., Bartleson, C. A., & Michaels, B. S. (2009). Outbreaks where
foodworkers have been implicated in the spread of foodborne disease. Part 6.
Transmission and survival of pathogens in the food processing and preparation
environment. Journal of Food Protection, 72(1), 202-219.
Trochim, W. M. K., & Donnelly, J. P. (2006). Research methods knowledge base (3rd
ed.). Mason, OH: Atomic Dog Publishing.
United Press International. (2011, Sept. 19). Americans eat out about 5 times a week.
Retrieved from http://www.upi.com/Health_News/ 2011/09/19/Americans-eat-
out-about-5-times-a-week/UPI-54241316490172/
U.S. Food and Drug Administration. (2009). Voluntary national retail food regulatory
program standards. OMB Control No. 0910-0621. Washington, DC: Author.
U.S. Food and Drug Administration. (2012). What you should know about government
response to foodborne illness outbreaks. Washington, DC: Author.
U.S. Food and Drug Administration. (2014). Hazard analysis & critical control points
(HACCP). Retrieved from http://www.fda.gov/
Food/GuidanceRegulation/HACCP/
Yasuda, T. (2010). Food safety regulation in the United States. An empirical and
theoretical examination. The Independent Review, 15(2), 201-226.
Zulkifly, M. I, Zahari, M. S. M, Jalis, M. H., & Othman, Z. (2009). An investigative
study into the hazard analysis of critical control point (HACCP) implementation
in small and medium-sized food manufacturing enterprises (SMEs). Journal of
Tourism, Hospitality & Culinary Arts, 1(3), 101-122.
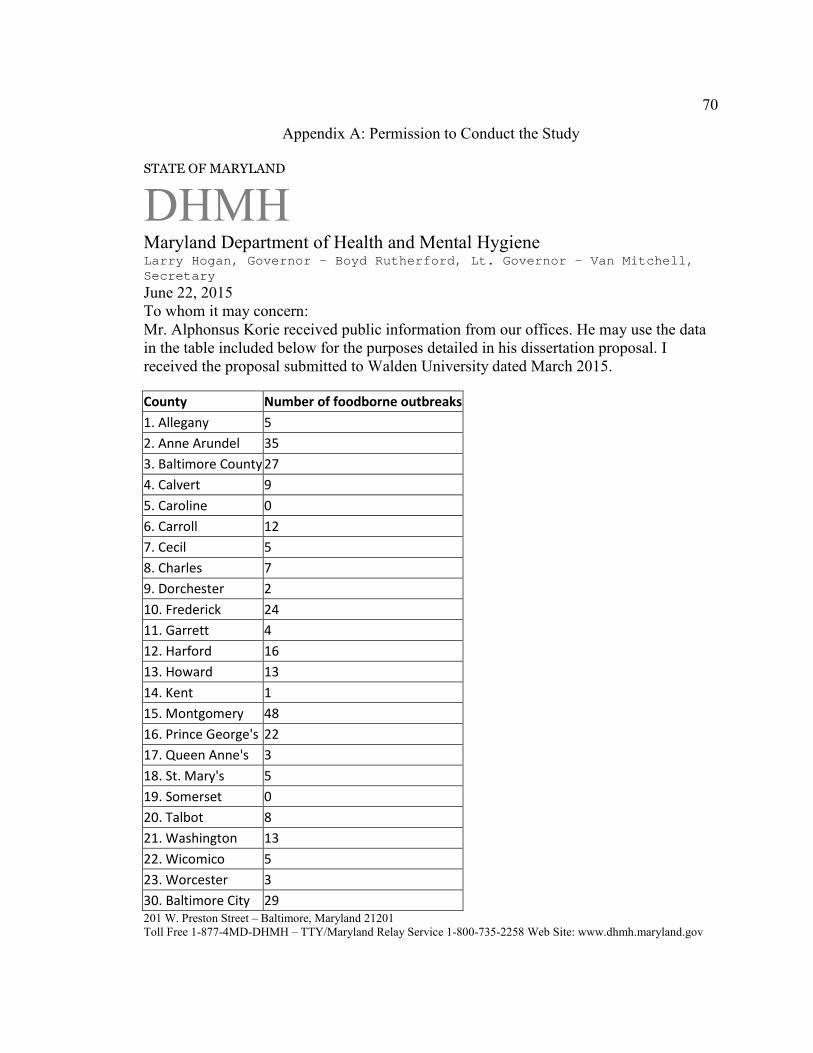
70
Appendix A: Permission to Conduct the Study
STATE OF MARYLAND
DHMH
Maryland Department of Health and Mental Hygiene Larry Hogan, Governor - Boyd Rutherford, Lt. Governor - Van Mitchell, Secretary
June 22, 2015 To whom it may concern: Mr. Alphonsus Korie received public information from our offices. He may use the data in the table included below for the purposes detailed in his dissertation proposal. I received the proposal submitted to Walden University dated March 2015.
County Number of foodborne outbreaks
1. Allegany 5
2. Anne Arundel 35
3. Baltimore County 27
4. Calvert 9
5. Caroline 0
6. Carroll 12
7. Cecil 5
8. Charles 7
9. Dorchester 2
10. Frederick 24
11. Garrett 4
12. Harford 16
13. Howard 13
14. Kent 1
15. Montgomery 48
16. Prince George's 22
17. Queen Anne's 3
18. St. Mary's 5
19. Somerset 0
20. Talbot 8
21. Washington 13
22. Wicomico 5
23. Worcester 3
30. Baltimore City 29
201 W. Preston Street – Baltimore, Maryland 21201 Toll Free 1-877-4MD-DHMH – TTY/Maryland Relay Service 1-800-735-2258 Web Site: www.dhmh.maryland.gov

71
Sincerely, Alvina Chu, MHS Chief, Division of Outbreak Investigation cc: Clifford Mitchell, MD, ScM, MPH, Director, Environmental Health Bureau
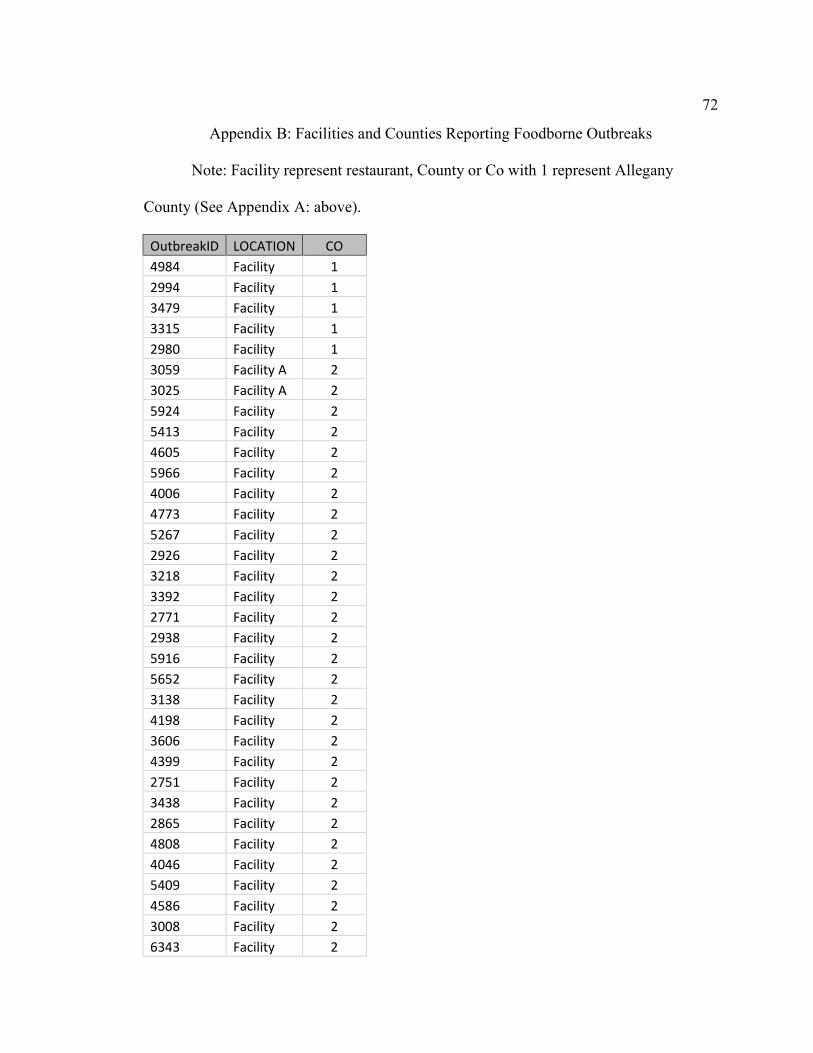
72
Appendix B: Facilities and Counties Reporting Foodborne Outbreaks
Note: Facility represent restaurant, County or Co with 1 represent Allegany
County (See Appendix A: above).
OutbreakID LOCATION CO
4984 Facility 1
2994 Facility 1
3479 Facility 1
3315 Facility 1
2980 Facility 1
3059 Facility A 2
3025 Facility A 2
5924 Facility 2
5413 Facility 2
4605 Facility 2
5966 Facility 2
4006 Facility 2
4773 Facility 2
5267 Facility 2
2926 Facility 2
3218 Facility 2
3392 Facility 2
2771 Facility 2
2938 Facility 2
5916 Facility 2
5652 Facility 2
3138 Facility 2
4198 Facility 2
3606 Facility 2
4399 Facility 2
2751 Facility 2
3438 Facility 2
2865 Facility 2
4808 Facility 2
4046 Facility 2
5409 Facility 2
4586 Facility 2
3008 Facility 2
6343 Facility 2

73
2860 Facility 2
2973 Facility 2
4394 Facility 2
3197 Facility 2
4917 Facility 2
3053 Facility 2
4122 Facility 3
6255 Facility 3
5671 Facility 3
5730 Facility 3
2772 Facility 3
4141 Facility 3
4685 Facility 3
3541 Facility 3
4228 Facility 3
4591 Facility 3
5852 Facility 3
3465 Facility 3
2949 Facility 3
3528 Facility 3
5664 Facility 3
4850 Facility 3
5400 Facility 3
5739 Facility 3
6308 Facility 3
4288 Facility 3
6315 Facility 3
6112 Facility 3
4933 Facility 3
3294 Facility 3
2832 Facility 3
5375 Facility 3
5392 Facility 3
3238 Facility 4
4367 Facility 4
3250 Facility 4
5010 Facility 4
2924 Facility 4
2916 Facility 4
4725 Facility 4

74
4594 Facility 4
6341 Facility 4
5237 Facility 6
6305 Facility 6
3324 Facility 6
4505 Facility 6
2747 Facility 6
2805 Facility 6
6235 Facility 6
4673 Facility 6
5915 Facility 6
2962 Facility 6
4380 Facility 6
2986 Facility 6
5243 Facility B 7
2929 Facility B 7
3998 Facility 7
4328 Facility 7
6275 Facility 7
2976 Facility 8
5897 Facility 8
4234 Facility 8
3357 Facility 8
4008 Facility 8
5911 Facility 8
6389 Facility 8
3999 Facility 9
5927 Facility 9
6279 Facility 10
5755 Facility C 10
3599 Facility C 10
4308 Facility 10
4468 Facility D 10
4045 Facility D 10
6176 Facility 10
6259 Facility 10
3445 Facility 10
5423 Facility 10
4015 Facility 10
3476 Facility 10
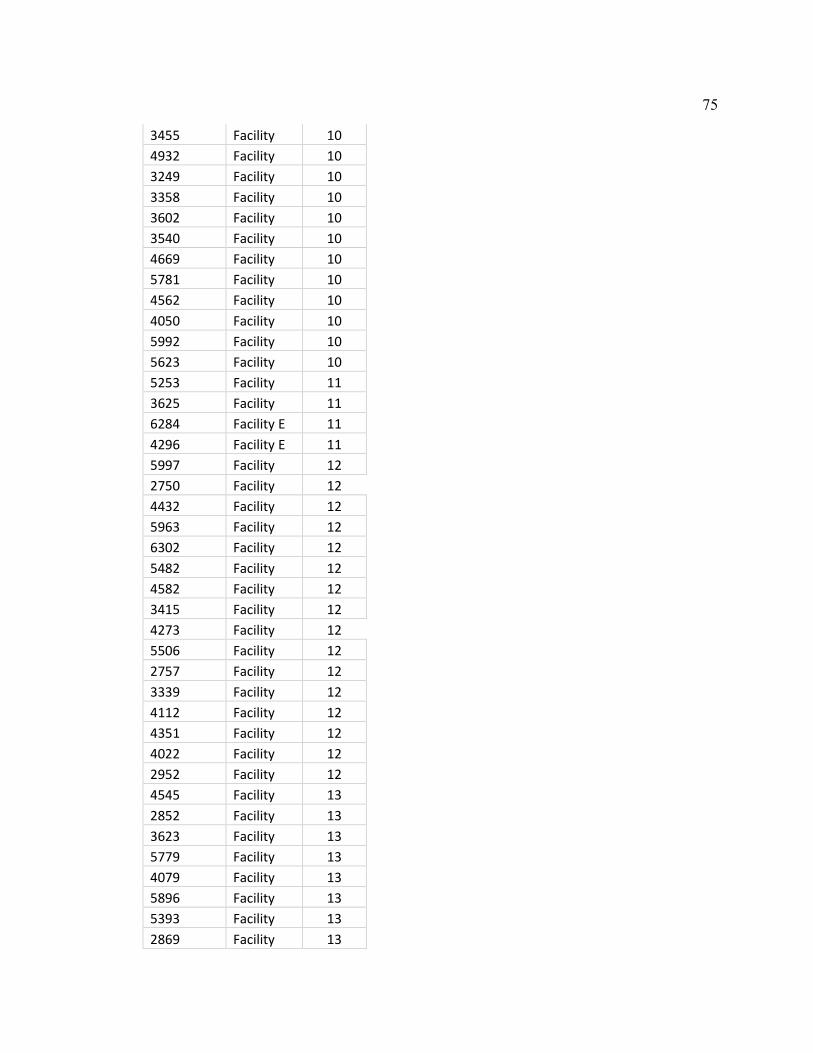
75
3455 Facility 10
4932 Facility 10
3249 Facility 10
3358 Facility 10
3602 Facility 10
3540 Facility 10
4669 Facility 10
5781 Facility 10
4562 Facility 10
4050 Facility 10
5992 Facility 10
5623 Facility 10
5253 Facility 11
3625 Facility 11
6284 Facility E 11
4296 Facility E 11
5997 Facility 12
2750 Facility 12
4432 Facility 12
5963 Facility 12
6302 Facility 12
5482 Facility 12
4582 Facility 12
3415 Facility 12
4273 Facility 12
5506 Facility 12
2757 Facility 12
3339 Facility 12
4112 Facility 12
4351 Facility 12
4022 Facility 12
2952 Facility 12
4545 Facility 13
2852 Facility 13
3623 Facility 13
5779 Facility 13
4079 Facility 13
5896 Facility 13
5393 Facility 13
2869 Facility 13

76
5805 Facility 13
6312 Facility 13
5234 Facility 13
5302 Facility 13
4660 Facility 13
3244 Facility 14
5672 Facility 15
3067 Facility 15
4864 Facility 15
3291 Facility 15
6331 Facility 15
4360 Facility 15
3604 Facility 15
3608 Facility 15
5390 Facility 15
3590 Facility 15
6029 Facility 15
4596 Facility 15
5861 Facility 15
6126 Facility 15
3587 Facility 15
4499 Facility 15
4039 Facility 15
5928 Facility 15
5444 Facility 15
4034 Facility 15
4662 Facility 15
4943 Facility 15
2921 Facility 15
4029 Facility 15
5224 Facility 15
6337 Facility 15
5692 Facility 15
2914 Facility 15
4374 Facility 15
6006 Facility 15
4390 Facility 15
4363 Facility 15
4389 Facility 15
2950 Facility 15

77
6280 Facility 15
4043 Facility 15
5520 Facility 15
5677 Facility 15
6153 Facility 15
6317 Facility 15
4576 Facility 15
3077 Facility 15
4539 Facility 15
4325 Facility 15
3579 Facility 15
3258 Facility 15
2905 Facility 15
4317 Facility 15
5312 Facility 16
5509 Facility 16
2975 Facility 16
3022 Facility 16
2758 Facility 16
5918 Facility 16
3287 Facility 16
5715 Facility 16
4035 Facility 16
4610 Facility 16
3055 Facility 16
3211 Facility 16
6270 Facility 16
3477 Facility 16
2897 Facility 16
3017 Facility 16
3441 Facility 16
2862 Facility 16
5703 Facility 16
5593 Facility 16
2972 Facility 16
2963 Facility 16
5670 Facility 17
2753 Facility 17
3601 Facility 17
3424 Facility 18

78
2944 Facility 18
3010 Facility 18
3469 Facility 18
3006 Facility 18
3099 Facility 20
3045 Facility 20
2748 Facility F 20
4150 Facility F 20
3295 Facility 20
5399 Facility 20
5694 Facility 20
3036 Facility 20
4347 Facility G 21
3351 Facility G 21
4318 Facility 21
2939 Facility 21
4401 Facility H 21
4311 Facility H 21
6152 Facility 21
6268 Facility 21
5711 Facility 21
5335 Facility 21
4206 Facility 21
3293 Facility 21
3986 Facility 21
5840 Facility I 22
4601 Facility I 22
2948 Facility 22
2907 Facility 22
5688 Facility 22
3240 Facility 23
2947 Facility 23
2884 Facility 23
3174 Facility 30
3016 Facility 30
4012 Facility 30
4882 Facility 30
3605 Facility 30
6327 Facility 30
5980 Facility 30

79
4903 Facility 30
3333 Facility 30
3207 Facility 30
2982 Facility 30
3370 Facility 30
4574 Facility 30
3021 Facility 30
4621 Facility 30
6297 Facility 30
4480 Facility 30
4578 Facility 30
6306 Facility 30
6310 Facility 30
4375 Facility 30
4948 Facility 30
5693 Facility 30
3352 Facility 30
4378 Facility 30
4557 Facility 30
2763 Facility 30
4024 Facility 30
5377 Facility 30

80
Appendix C: Results of proposed data analysis using ANOVA and Independent-
Sample t test deemed inappropriate for data with one sample group with zero variance.
Data Analysis
Data analysis began with an independent-samples t test. The purpose of a t test is to
determine the likelihood that a difference between two groups’ averages occurred. The
data were also subjected to a one-way ANOVA. Results of the two tests were similar.
Consequently, ANOVA could not perform post-hock analysis for less than three variable
groups and CFM counties have equal number of foodborne outbreaks and number of
affected restaurants reported. On the other hand, one of the groups has zero variance;
making it impossible to analyze data with both independent-sample t-test and ANOVA.
Group statistics (see Table 8) revealed that the average number of foodborne illness
outbreaks among the 149 restaurants without CFMs was 1.06 (SD = .24, SEM = .02),
compared to a mean of 1.00 for the 139 restaurants with CFMs (SD = .00, SEM = .00).
There were no data outliers, as shown in Figure 2. However, four point locations shown
in Figure 2 may appear to be outliers because the showed up on the plot with
characteristics of an outlier, but they are not. Data used for the analyses ranged from 1 to
2 in both groups and the four point locations shown in Figure 2 have values of 2.
Therefore, they cannot be outliers.

81
Table C1
Descriptive Statistics of Foodborne Outbreaks of Two Groups
N M SD SE
95% CI for M
Min. Max. Lower bound
Upper bound
Restaurants
without CFMs 149 1.060 .239 .020 1.022 1.099 1.000 2.000
Restaurants
with CFMs 139 1.000 .000 .000 1.000 1.000 1.000 1.000
Total 288 1.031 .174 .010 1.011 1.052 1.000 2.000

82
Figure C1. Boxplot showing no data outliers.
Data were assessed for normal distribution using the Shapiro Wilk test (p < .05)
and the Kolmogorov-Smirnov test. That analysis revealed that foodborne illness outbreak
scores for each group of restaurants were not normally distributed (see Table 9). The
assumption of normality is necessary for statistical significance testing using
independent-samples t test. However, the independent samples t test is considered
“robust” to violations of normality. Therefore, some violations of this assumption can be
tolerated, and the test will still provide valid results.
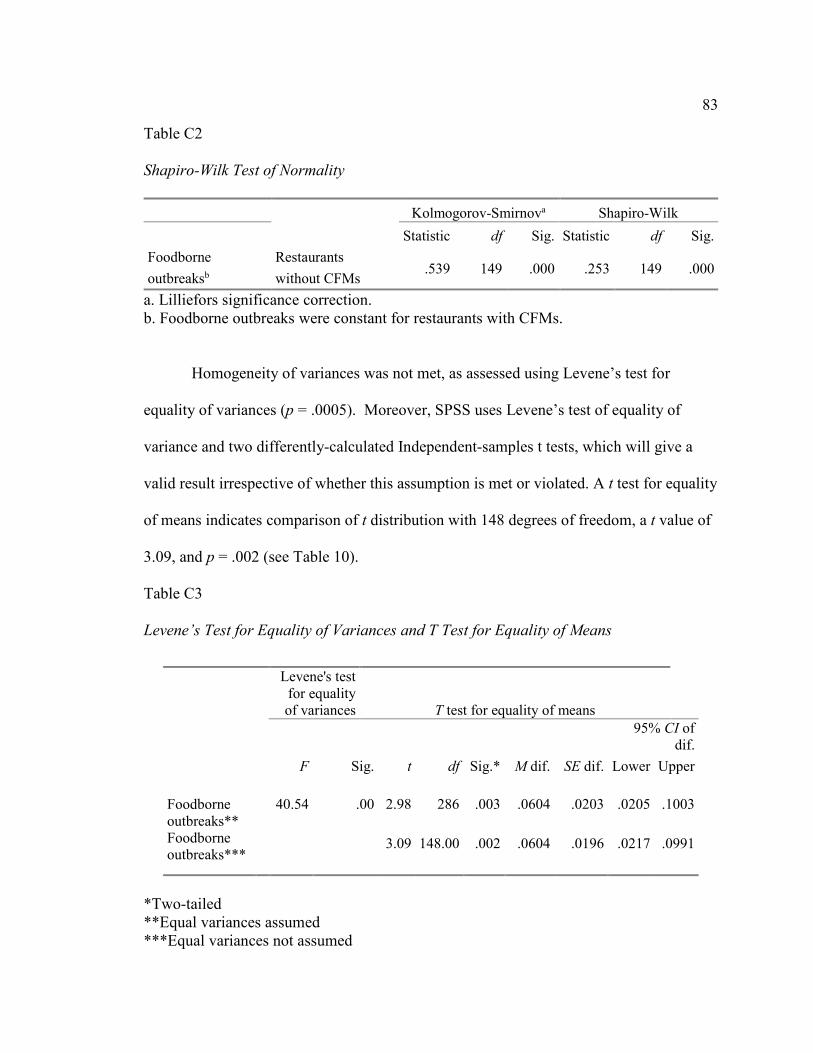
83
Table C2
Shapiro-Wilk Test of Normality
Kolmogorov-Smirnova Shapiro-Wilk
Statistic df Sig. Statistic df Sig.
Foodborne
outbreaksb
Restaurants
without CFMs .539 149 .000 .253 149 .000
a. Lilliefors significance correction. b. Foodborne outbreaks were constant for restaurants with CFMs.
Homogeneity of variances was not met, as assessed using Levene’s test for
equality of variances (p = .0005). Moreover, SPSS uses Levene’s test of equality of
variance and two differently-calculated Independent-samples t tests, which will give a
valid result irrespective of whether this assumption is met or violated. A t test for equality
of means indicates comparison of t distribution with 148 degrees of freedom, a t value of
3.09, and p = .002 (see Table 10).
Table C3
Levene’s Test for Equality of Variances and T Test for Equality of Means
*Two-tailed **Equal variances assumed ***Equal variances not assumed
Levene's test for equality of variances T test for equality of means
F Sig. t df Sig.* M dif. SE dif.
95% CI of dif.
Lower Upper
Foodborne outbreaks** Foodborne outbreaks***
40.54 .00 2.98 286 .003 .0604 .0203 .0205 .1003
3.09 148.00 .002 .0604 .0196 .0217 .0991
84
The null hypothesis for the current study was as follows:
H0: There are no difference in foodborne illness outbreaks between the five
Maryland counties that require certified food managers in medium- and high-priority
food establishments and the 19 counties without such a requirement.
There was a statistically significant difference of .06 in mean foodborne outbreaks
scores between county restaurants without CFMs and those with CFMs: 0.06(95% CI,
0.02 to 0.10), t (148.00) = 3.09, p = .002 (see Table 10). Based on this result, the null
hypothesis is rejected. In other words, there is a relationship between foodborne illness
outbreaks and the presence or absence of CFMs in restaurants operating as medium- and
high-priority food establishments. The study’s results show that Counties employing on-
site CFMs had fewer incidents of foodborne illness outbreaks than did counties without
such a requirement. A question may be raised whether one foodborne outbreak on
average over a ten year period is significant enough to consider a change in current
regulations. The answer is yes because when it comes to a foodborne outbreak, one
outbreak is enough to send thousands of people to the hospital and even deaths. A plot of
the foodborne outbreak means of the two groups (using ANOVA) indicates mean values
ranging from 1.00 for restaurants with CFMs to 1.06 for restaurants without CFMs (see
Figure 3).

85
Figure C2. ANOVA plot of mean foodborne outbreaks.