A QUANTITATIVE QFD METHOD TAKING INTO ACCOUNT CO...
95
A QUANTITATIVE QFD METHOD TAKING INTO ACCOUNT CO ST AND RISK FACTORS A thesis submitted to the Faculty of Graduate Studies and Research in partial fulfillment of the requirements of the Master's degree of Engineering Supervised by Professor Vince Thomson Department of Mechanical Engineering McGill University Shan Zhao Department of Mechanical Engineering, McGill University Montreal, Quebec, Canada June 2004 ©
Transcript of A QUANTITATIVE QFD METHOD TAKING INTO ACCOUNT CO...

A QUANTITATIVE QFD METHOD TAKING INTO ACCOUNT CO ST AND RISK FACTORS
A thesis submitted to the
Faculty of Graduate Studies and Research
in partial fulfillment of the requirements of the Master's degree of Engineering
Supervised by Professor Vince Thomson
Department of Mechanical Engineering
McGill University
Shan Zhao
Department of Mechanical Engineering, McGill University
Montreal, Quebec, Canada
June 2004 ©

1+1 Library and Archives Canada
Bibliothèque et Archives Canada
Published Heritage Branch
Direction du Patrimoine de l'édition
395 Wellington Street Ottawa ON K1A ON4 Canada
395, rue Wellington Ottawa ON K1A ON4 Canada
NOTICE: The author has granted a nonexclusive license allowing Library and Archives Canada to reproduce, publish, archive, preserve, conserve, communicate to the public by telecommunication or on the Internet, loan, distribute and sell th es es worldwide, for commercial or noncommercial purposes, in microform, paper, electronic and/or any other formats.
The author retains copyright ownership and moral rights in this thesis. Neither the thesis nor substantial extracts from it may be printed or otherwise reproduced without the author's permission.
ln compliance with the Canadian Privacy Act some supporting forms may have been removed from this thesis.
While these forms may be included in the document page count, their removal does not represent any loss of content from the thesis.
• •• Canada
AVIS:
Your file Votre référence ISBN: 0-494-06597-4 Our file Notre référence ISBN: 0-494-06597-4
L'auteur a accordé une licence non exclusive permettant à la Bibliothèque et Archives Canada de reproduire, publier, archiver, sauvegarder, conserver, transmettre au public par télécommunication ou par l'Internet, prêter, distribuer et vendre des thèses partout dans le monde, à des fins commerciales ou autres, sur support microforme, papier, électronique et/ou autres formats.
L'auteur conserve la propriété du droit d'auteur et des droits moraux qui protège cette thèse. Ni la thèse ni des extraits substantiels de celle-ci ne doivent être imprimés ou autrement reproduits sans son autorisation.
Conformément à la loi canadienne sur la protection de la vie privée, quelques formulaires secondaires ont été enlevés de cette thèse.
Bien que ces formulaires aient inclus dans la pagination, il n'y aura aucun contenu manquant.

,"- -- -
ACKNOWLEDGEMENTS
1 wish to express my special gratitude to Professor Vince Thomson for being a great
supervisor. 1 thank him for introducing me to research and keeping me interested. My
research and this the sis would not have been possible without his constant encouragement,
patience, assistance, teaching and wise instruction. 1 would like to thank the Department
of Mechanical Engineering, Mc Gill University, for offering me the opportunity to acquire
advanced knowledge and further my education. 1 dedicate this thesis to my parents for
pro vi ding me endless love, understanding, and support.
Thank you!
1

ABSTRACT
This thesis develops a quantitative quality function deployment (QFD) method and
integrates it with the methodologies of value engineering and risk analysis. Numerical
parameters and scales allow measurement of product development and onward
adjustment as the process unfolds. In QFD, customer requirements are usually defined in
terms of design characteristics. In the method developed here, customer requirements are
related to product functions. The use of value engineering then allows costs to be
quantified. The analysis of design uncertainties allows the determination of risk factors.
By introducing the new concepts of customer satisfaction value and an integrated
evaluation index, an appropriate balance between customer and enterprise satisfaction
can be attained in the final product. The new QFD method provides a quantitative
approach based on cost and risk for evaluating how weIl customer requirements are taken
into account in the development of a product.
2

RÉSUMÉ
Cette thèse propose une méthode quantitative de démarche qualité et l'intègre aux
méthodologies d'ingénierie de la valeur et d'analyse du risque. Les paramètres et échelles
numériques permettent de mesurer le produit et d'apporter des corrections tout au long du
déroulement du processus. Dans le cadre de la démarche qualité, les exigences des clients
se définissent habituellement en se fondant sur les caractéristiques de conception. Dans la
méthode élaborée ici, ces exigences sont reliées aux fonctions du produit. L'utilisation de
l'ingénierie de la valeur permet alors de quantifier les coûts. L'analyse des incertitudes
liée à la conception quant à elle permet de déterminer les facteurs de risque. En mettant
en place de nouveaux concepts de valeur de satisfaction du client et d'index d'évaluation
intégré, un juste équilibre entre la satisfaction du client et celle de l'entreprise peut être
atteint dans le produit final. La nouvelle méthode de démarche qualité propose une
approche quantitative fondée sur le coût et le risque pour évaluer jusqu'à quel point les
exigences du client sont prises en compte dans le développement d'un produit.
3

CONTENTS
ACKNOWLEDGEMENTS .......................................................................................................... 1 ABSTRACT ..•................................................................................................................................ 2 CHAPTER 1 .................................................................................................................................. 5 INTRODUCTION ......................................................................................................................... 5
1.1 Background ........................................................................................................................... 5 1.2 Objectives .............................................................................................................................. 6 1.3 Quality Function Deployment ............................................................................................... 7
1.3.1 History and Definition ................................................................................................... 7 1.3.2 House of Quality Matrix ................................................................................................ 9 1.3.3 QFD Models ................................................................................................................ 12 1.3.4 Itnpletnentation ............................................................................................................ 14
1.4 Value Engineering ............................................................................................................... 15 1.4.1 Definition ..................................................................................................................... 16 1.4.2 Implementation ............................................................................................................ 20
1.4.2.1 Information Phase ................................................................................................. 22 1.4.2.2 Function Ana1ysis Phase (or FAST Diagramming Phase) ................................... 22 1.4.2.3 Creative Phase ...................................................................................................... 24 1.4.2.4 Evaluation Phase .................................................................................................. 24 1.4.2.5 Developing and Reporting Phase ......................................................................... 25 1.4.2.6 Implementation Phase .......................................................................................... 25
1.5 Risk Management ............................................................................................................... 26 1.5.1 Risk .............................................................................................................................. 26 1.5.2 Ri sk Management Process ........................................................................................... 27
1.5.2.1 Risk Identification ................................................................................................ 28 1.5.2.2 Risk Analysis and Assessment.. ........................................................................... 29 1.5.2.3 Risk Control ......................................................................................................... 31
1.5.3 Integrated Risk Management in the Engineering Field ............................................... 32 CHAPTER 2 ................................................................................................................................ 39 OPTIMIZATION MODEL FOR IMPROVED QUANTITATIVE QFD .............................. 39
2.1 Background and Assumptions ............................................................................................. 39 2.2 Interpretation and Formulation of House of Quality Matrix ............................................... 41 2.3 Diagramming Function Analysis - the Function Tree ........................................................ 43 2.4 Constructing the Integrated Cost and Risk Analysis Matrix ............................................... 47
2.4.1 Cost and Risk Analysis Matrix 0 - Current Design ..................................................... 49 2.4.2 Cost and Risk Analysis Matrix n - New Designs ........................................................ 56
2.5 Building the Integrated Evaluation Matrix - Current Design and Different Solutions ....... 58 2.6 Deploying Development Matrix and Diagramming - Best Solution .................................. 61
CHAPTER 3 A CASE STUDY .................................................................................................. 65 3.1 HOQ Matrix ........................................................................................................................ 65 3.2 Function Tree and Cost and Risk Analysis Matrix 0 - CUITent Design .............................. 67 3.3 Cost and Risk Analysis Matrix 1 and Cost and Risk Analysis Matrix 2 - New Designs ... 73 3.4 Integrated Evaluation Matrix .............................................................................................. 77 3.5 Deve10pment Matrix and Diagram ...................................................................................... 81
CHAPTER 4 CONCLUSION AND FUTURE WORK ........................................................... 83 4.1 Conclusion .......................................................................................................................... 83 4.2 Constraints and Future Work .............................................................................................. 86
APPENDIX: P ARAMETER DEFINITION ............................................................................. 88 REFERENCES ............................................................................................................................ 91
4

1.1 Background
CHAPTERI
INTRODUCTION
"As the twig is bent, so grows the tree." This old saying is usually applied to children
as they grow to adulthood. It is also true for product concepts brought to life as products
in full production, or freshly introduced services or newly designed and implemented
processes. Earliest inputs must be right because they determine the direction of so many
activities that follow. Just de ci ding what concept will be worked on and developed
further defines and commits about 80% ofthe final costs (processing and assembly labor,
raw materials, processing and purchased parts and so on). It also determines the total
cycle time (product or service), the durability of the product, the ease of consistently
delivering the product or service, and several of the customers' perceptions about the
quality of the product, service or process. If the earliest activities in the design process
are well structured, it will definitely save waste and costly iterations later.
Everyday, a great variety of new or improved products are designed and
manufactured, which offer enough space for customers to become more selective in
making their choices. To survive the fierce competition in the market, companies have to
develop quality products and customer satisfaction becomes more and more of a concern
in the product design phase. As a well-known customer-oriented approach, quality
function deployment (QFD) is widely used not only to make the process possible to
translate the voice of customers into the language of designers, but also, it can assist in
making decisions during product design and development.
5

Generally, most of the existing methods and models used for QFD are able to pay
enough attention to customer requirements, and a higher customer satisfaction level is
regarded as the key to designing and developing products successfully. But these
techniques seldom consider the effect of resource constraints on the enterprise, such as
budget, time, labor. .. , nor do they usually take into account the impact of design
uncertainties during product development, for example, cost, risk, market and so on.
1.2 Objectives
In this thesis, a quantitative model is presented to offer a more practical means of
integrating value engineering and risk analysis methodologies with the QFD planning
process. In the new integrated QFD model, customer requirements are re1ated to product
functions and to how well customer requirements can be satisfied in order to evaluate a
design. Besides, financial factors and design uncertainties are considered during product
design by deploying detailed cost and risk analysis at the level of design functions. The
job plan in value engineering offers a systematic structure for analysis. Furthermore, by
introducing the new concepts of customer satisfaction value and an integrated evaluation
index, the best balance between customer and enterprise satisfaction can be achieved. In
summary, the objectives ofthis thesis are:
• to develop a quantitative QFD model and to integrate it with the methodologies of
value engineering and risk analysis in order to consider not only customer
satisfaction, but also enterprise satisfaction by making detailed cost and risk
analysis during design,
• to introduce the new concepts of customer satisfaction value and an integrated
evaluation index to assist in decision making,
6

• to propose a method for companies to determine the realistic target unit cost for
design in order to obtain the best balance between customer and enterprise
satisfaction with consideration of financial factors and design uncertainties.
The structure of this thesis is as follows. First, a general introduction of the concepts
and methodologies of QFD, value engineering and risk are made in Chapter 1. Next, the
theoretical description for the optimization model is given in Chapter 2. Moreover, in
Chapter 3, an example is provided to show how the model works. Finally, conclusions
and future work are summarized in Chapter 4.
In order to help readers to understand the approach better, different colors are
employed in the matrices in Chapter 2 and Chapter 3. Input information is indicated by
colorful (red, bIue or pink) letters or numbers (not in colorful shades). Output information
(or decision indicators) is highlighted in colorful shades, such as, light yellow, tE, Il,
or light turquoise, r'lill~t~~, light green. In addition, formulae are first defined
in the theory model and then expressed in Excel worksheets. Therefore, ca1culations can
be seen more easily and understanding the process is simplified.
1.3 Quality Function Deployment
1.3.1 History and Definition
Among various customer-oriented methodologies for product design and
development, Quality function deployment (QFD) is widely adopted. The concept of
quality function deployment was first proposed by Akao in 1966. Akao published the
idea as a system in an April 1972 magazine article under the name Hinshitsu Tenkai.
Again, Akao together with Shigeru Mizuno published the first book on QFD in 1978.
And the term "quality house" was presented during a Japan Standards Association
7

conference in 1979. Then, QFD was introduced into the entire Toyota Group. Four years
later, QFD was formally introduced to the United States by Furukawa, Kogure and Akao
during a four-day seminar for about 80 quality assurance managers from prominent U.S.
companies. And in 1984, Donald Clausing ofXerox introduced QFD to Ford. Moreover,
Ford suppliers developed the first case study on QFD outside Japan in 1987. In the next
year, Don Clausing published their article, "The House of Quality", in the May-June
1988 edition of the Harvard Business Review. In 1994, the QFD institute was founded by
Mr. Glenn H. Mazur together with Mr. Richard Zultner and Dr. John Terninko.
Over 40 years since the basic concepts and fundamental methodology of QFD have
been known, QFD has been defined in many different ways. According to the definition
by the American Supplier Institute (ASI) in 1987, QFD constitutes a system for
translating customer requirements into appropriate company requirements at every stage,
from research through production design and development, to manufacture, distribution,
installation, marketing, sales and services. Another definition is that by Akao (1990)
which states that "QFD is a method for developing a quality design aimed at satisfying
the customer and then translating the customer's demands into design targets and major
quality assurance points". It provides a systematic environment for product design based
on customer requirements and involves all members of the producer organization. What it
focuses on is to improve the efficiency of the initial product design. Nowadays, QFD
methodology is considered to be useful, particularly for its benefits in planning. In the
very near future, it could come to constitute the cohesive element within a group of
instruments able to create an integrated environment for decisional aids in the field of
design (Franceschini, 2002).
8

1.3.2 House of Quality Matrix
QFD bridges the communications gap between the customer and the personnel
involved in choosing the concepts as weIl as designing and engineering the product to be
manufactured, distributed and maintained in the field (Revelle, Moran, Cox, 1998). The
linkages between the customer and the design are rationally structured in a series of
matrices, in which the most basic matrix used is the house of quality (HOQ). It assists in
the conversion of customer's requirements, the Whats to How the customer requirements
will be met (quality characteristics). Its matrix structure and visual nature gave both
discipline and guidance to the conversionprocess. A typical house of quality is shown in
Figure 1.1.
Section A contains a list of customer requirements. These are usually provided by the
marketing department after investigation with customers, which involves information
coIlected from actual customers of the product about their statements of their needs and
wants, and their prioritization of these desires. In this phase, it is important to maximize
customer involvement to determine product structure because any misunderstanding of
customer' s demands and needs will lead to wrong decisions about development process
characteristics, not to mention product characteristics. When all the information has been
collected, the list should be then refined and sorted; similar items need to be grouped into
one category, which will help focus the QFD process. Besides, the customers' own words
should be used so that the actual quality that customers really demand can be expressed
and understood. Generally, customers' desires are vague and not easily quantified.
9

1
Section A en
~ Customer ::t:
Requirements lS """ 0
1
01
WHATs t:: = 'fil =~ o <!) .• u
WHATI t: § - - ~
00 6 " .§ .... <!)
S .8 '" ;:l u
Section E Correlation Matrix ;;:
1
Section C 1 1
Design Requirements -~
1 HOWs
1 @
1
Section D Relationship Matrix
~
Symbols for Strength of Relationship: * = Strong o = Medium t. = Weak
Figure 1.1 House of Quality
1
1
N
~ @
Symb ols for Positive or Ive Relationship: Negaf
++= +=P
Strong positive ositive
- =Ne gative -- = St rong negative
Section B in the House of Quality can inc1ude recorded information for
• importance rating
• customer satisfaction levels towards the current product
• customer satisfaction levels towards competitors' current products
• setting the goal, de ci ding which level of customer satisfaction needs to be
attained, and
• setting values for every customer attribute.
This step collects data from customers as a basis for comparison. By figuring out the
importance rank and showing how well both the company and competitors meet
10

customer' s needs, it helps the design team to discover the strengths and weaknesses of
the product on both sides, capture additional customer' s requirement, and put more
emphasis on the most important attributes for using limited resources (money,
time, ...... ) more effectively.
Section C contains technical attributes (or design characteristics) of the product which
serve as design requirements. This part is the 'HOWs' with respect to the customers'
voice, and the 'WHATs' that emphasizes problem resolution. The criteria for this
technicallanguage are:
• global, solution-independent, and not constrained by any design alternatives or
approaches
• meaningful, i.e., subsequently actionable to drive the design process, and
• measurable, i.e., defining the target value.
Section D contains the relationships between customer requirements and design
requirements. One way is to put a value in each cell in the relationship section, where the
value reflects the extent to which the products' attributes (HOWs) contribute to meet the
customers' attributes (WHATs). Along with the importance ratings of the customer
attributes, section D establishes the contribution of the technical attributes to overall
customer satisfaction. This contribution also represents the importance of every technical
attribute, which is recorded in section C.
Section E contains correlations between technical attributes, which determine whether
each technical attribute supports or impedes the others. More effort needs to be put on the
negative relationship, where two technical attributes adversely affect each other, and
11

usually, tradeoffs need to be made; otherwise, additional research and development effort
may be needed.
The QFD chart helps the design team to set targets on issues which are the most
important to the customer, and how these can be achieved technically. The ranking of the
competitors' products can also be performed by technical and customer benchmarking
(Bouchereau and Rowlands, 2000). The QFD chart is a multifunctional tool that can be
used throughout the organization. For engineers, it is a way to summarize basic data in a
usable form. For marketing, it represents the customer's voice and general managers use
it to discover new opportunities (Clausing and Pugh, 1991).
1.3.3 QFD Models
QFD also provides a set of matrices that serves as both a structure and a graphic
representing the deployment process. These matrices are helpful towards understanding
relationships between inputs and outputs.
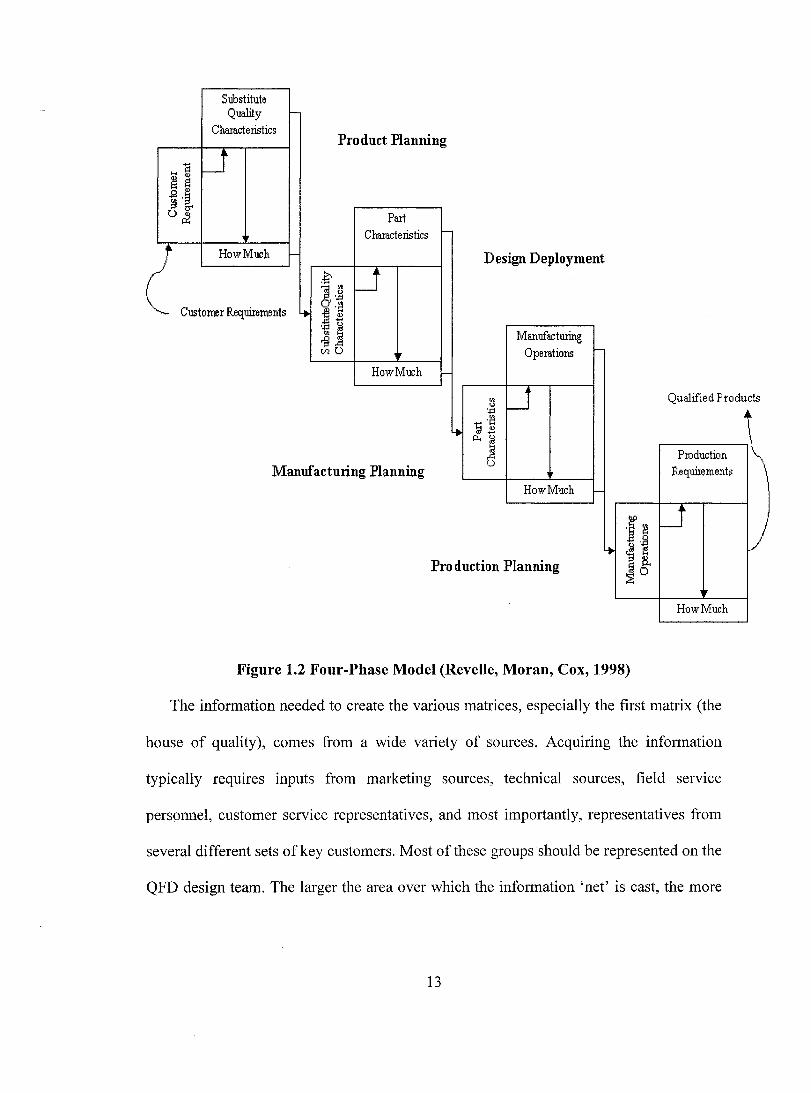
As shown in Figure 1.2, a typical four-phase model is composed of four matrices,
which divide the QFD process into four stages. They are:
• product planning (house of quality)
• design deployment (part deployment)
• manufacturing planning (process planning)
• production planning (production operation planning).
The output of every stage is the input of the next stage, which helps communicate
customer requirements from product design through to production.
12
Substitute Quality 1-
Characteristics Pro duet Planning
"E U ... ., s S .9 ,~ ~ b" o&! Part
Characteristics 1-
! HowMuch 1- Design Deployment ,è U ~ ,~
~ Customer Requirements LJ. a,~
~2 '~ j Manufacturing ~o Operations 1-
HowMuch 1-
" U Qualified Pl'Oduc u
'.jj ... ,~
LJ. '52 p.. n
"'-j Production
ts
Manuf ae turing Planning ()
Requil'ements
HowMuch -
J~ U 4-
-il ~ ~
Pro duetion Planning ~~ HowMuch
Figure 1.2 Four-Phase Model (Revelle, Moran, Cox, 1998)
The information needed to create the various matrices, especially the first matrix (the
house of quality), cornes from a wide variety of sources. Acquiring the information
typically requires inputs from marketing sources, technical sources, field service
personnel, customer service representatives, and most importantly, representatives from
several different sets of key customers. Most of these groups should be represented on the
QFD design team. The larger the area over which the information 'net' is cast, the more
13

likely the end result from the QFD design process will fully meet (or exceed) customers'
expectations.
Furthermore, when the QFD approach is used to consider all the multilevel analyses
and details associated with deploying the voice of the customer, it becomes apparent that
the four-phase model is not enough for many projects. So, the matrix of matrices can be
used to provide a more detailed understanding, which can contain several matrices at
every step of the deployment process. Determining the matrices that will be necessary
depends on the project's goals (or desired outputs) and what intermediate matrices will be
needed to obtain the goals.
1.3.4 Implementation
For QFD to be effective, it must be accepted as an integral part of the organization's
design process. Every organization takes its own approach to design, but aU design
processes share sorne basic activities. A QFD approach may help an organization
discover exciting and pertinent information previously overlooked. These discoveries are
a crucial part of connecting the voice of the customer to the design. The knowledge
gained gives the producer of the product a much better understanding of the needs of the
user and the environment where it will be used.
QFD emphasizes co-operation, convergent consensual decision making, and
systematic linkage of engineering activities (Clausing and Pugh, 1991). Therefore, the
interdisciplinary work team becomes an absolute premise for successful implementation.
It would include experts from design engineering, process (manufacturing) engineering,
research and development, marketing/sales, quality assurance and test, field and customer
service, manufacturing, in sorne cases distribution, and if the organization is project
14

driven, project engineering. If an organization is not project oriented, it is a good idea to
have a person with project management skills leading and facilitating the design team.
Besides, in order to extend QFD to large scale systems, attempts have been made to
integrate QFD with other design-supporting techniques. For instance, the research work
by Nilsson demonstrated how QFD can be linked to an integrated digital requirement and
concept model containing product-related information that evolves during the early
phases of the product development process. It is proposed that in order to gain maximum
benefit, QFD should be applied on a subsystem level and to subsystems that interact to a
large extent with the user. In addition, Bouchereau and Rowlands (2000) in their paper
de scribe efforts made to combine fuzzy logic, artificial neural networks, and Taguchi
methods with QFD. In another paper by Yamashina, Ito and Kawada (2002), a new
method named Innovative Product Development Process (IPDP) is proposed to integrate
QFD with TRIZ (a Russian acronym for Theory of Inventive Problem Solving); IPDP
enables the effective and systematic creation of technical innovation for new products.
1.4 Value Engineering
The value engineering (VE) methodology has been with us for a long time since the
original concept of value methodology was first proposed by Lawrence. D. Miles when
he was assigned to develop a plan to pro duce products for the General Electric Company
(GE) using fewer available materials during 1940s. In 1952, the first value analysis
seminar was conducted at GE. Two years later, the Navy Bureau of Ships, a division of
the Department of Defense, USA, established a value program and applied it at the
engineering stage. After that, due to the successful implementation of value engineering
in the Navy, the U.S. Army and Air Force also launched value engineering programs. In
15

1958, the Society of American Value Engineers (SAVE) was established as an
organization in Washington,. which defined VE methodology formally and which was
dedicated to strengthening its practice and development. Now, VE is popular worldwide.
In the field of value engineering, three terms are used to describe the application of
value techniques:
• Value engineering (VE) describes a value study on a project or product that is
being developed. It analyses the cost of the project as it is being designed.
• Value analysis (V A) describes a value study of a project or product that is already
built or designed and analyzes the product to see if it can be improved. Its
objective is to determine which alternative will pro duce the best value, for
example, which design will give the most reliable performance or the best sales
with the least cost. In many places, the terms VE and V A are used
interchangeably.
• Value management considers the value created in an organization and tries to
maximize the value added along the value chain. The term, value management, is
used to de scribe the entire field of value endeavors, and was first used by the
General Services Administration (USA) in 1974.
1.4.1 Definition
The SAVE international society defines Value Analysis/Engineering as follows.
Value AnalysislEngineering is the systematic application of recognized techniques
that
• identify the functions of a product or service
• establish a monetary value for the functions, and
16

• provide the required functions at the lowest overall cost.
In addition, the research by Del L. Y ounker (2003) defines VE in more detail. VE
means an analysis of the functions of a program, project, system, product, item of
equipment, building, facility, service, or supply of an executive agency performed by
qualified agency or contractor personnel, directed at improving performance, reliability,
quality, safety, and life cycle costs.
From the definitions, it is seen that the definition and analysis of functions are the
foundation of VE, which means VE focuses on what a product does for the customer
rather than what it is. VE defines two types of functions:
• A basic function is what products must do to satisfy customer's needs. It is the
main reason why products are produced. It is also regarded as the essential value
of products.
• A secondary function is what attracts customers to select the product among the
products with the same basic functions. Even though secondary functions can help
to provide customers convenience, attraction and satisfaction, they can be wanted
or unwanted.
The basic functions are the functions upon which secondary functions depend. For a
product, if the basic functions are not required, all the other dependent functions become
meaningless since they exist in order to support the basic functions.
Basically, a function is described by two words, a verb and a no un, which compose a
statement as short as possible. In the statement, the verb defines the required action and
the noun tells what is acted upon. Besides, the function should be measurable so that a
value can be established for the function. Furthermore, the proper definition of functions
17

should be able to help perceive the product in a new way, which means it will offer
opportunities for creativity "to break down the mental constraints and open minds to new
ideas".
Since VE supports cost reduction activities by relating the cost of components of a
product to their functions, function becomes one of the most important concepts of VE.
Defining and analyzing functions can help not only to find out what the product must do,
but also to figure out the most cost effective way of achieving attributes.
Another important term used in VE methodology is value. As Richard Park said
(1999): "A discussion of value is necessary because a measure of value makes it possible
to determine ifwe are spending our money wisely or ifwe are not getting good value." In
other words, the measurement of value can present the background for comparison, and
at the same time, give the direction for cost reduction.
According to the definitions by Webster's New International Dictionary,
• value is a fair return in goods, money, or services etc, for something exchanged,
• value can also be the monetary, estimated or assessed worth of a thing.
Although value is often defined in terms of dollars, it is not equal to cost. According
to Richard Park (1999), cost is a factor that is directly related to the product or service.
Value is an opinion and is related to a want or a need: what the product or service do es
for you or its performance relative to expectations. It is also important to recognize that
value is subject to rapid and measurable change as conditions change.
Value may be measured by using a scale in dollars, time, power, or just by
determining the weight of one versus another. From different points of view, value can be
18
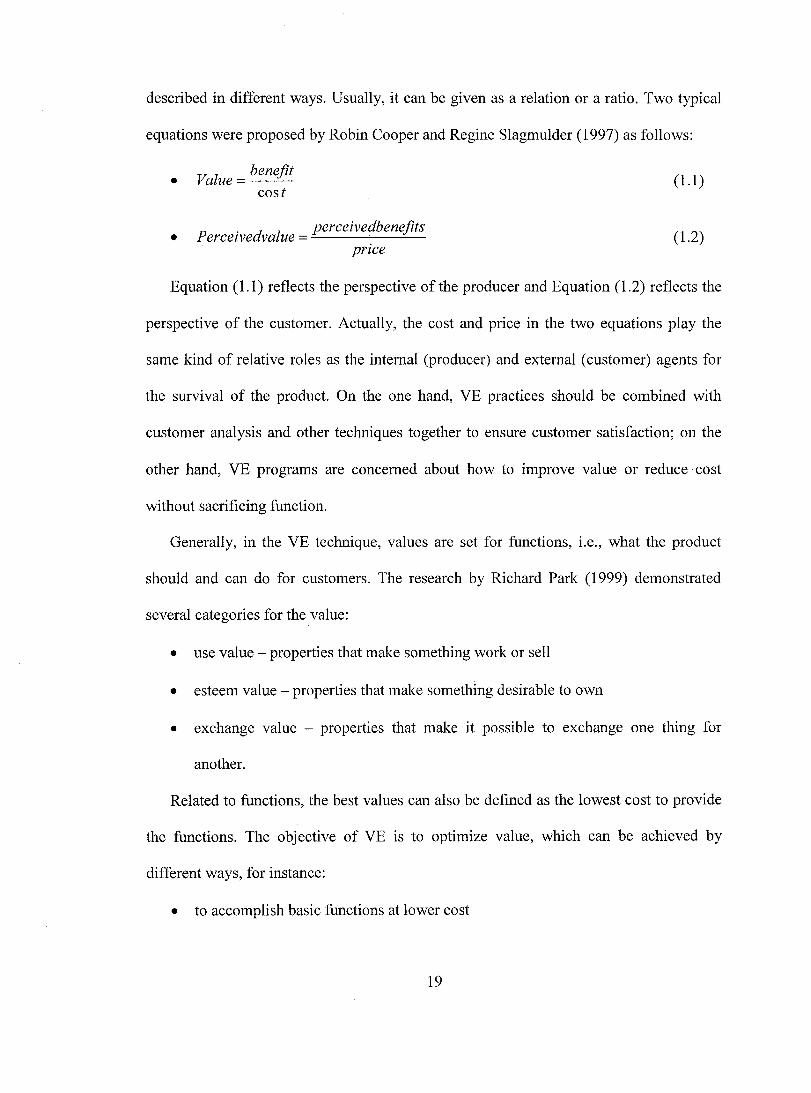
described in different ways. Usually, it can be given as a relation or a ratio. Two typical
equations were proposed by Robin Cooper and Regine Slagmulder (1997) as follows:
•
•
TI" l bene fit raue=-.-..::....-cost
P . d l perceivedbenefits ercelve va ue = "'---------'---
priee
(1.1 )
(1.2)
Equation (1.1) reflects the perspective of the producer and Equation (1.2) reflects the
perspective of the customer. Actually, the cost and price in the two equations play the
same kind of relative roles as the internaI (producer) and external (customer) agents for
the survival of the product. On the one hand, VE practices should be combined with
customer analysis and other techniques together to ensure customer satisfaction; on the
other hand, VE programs are concerned about how to improve value or reduce cost
without sacrificing function.
Generally, in the VE technique, values are set for functions, i.e., what the product
should and can do for customers. The research by Richard Park (1999) demonstrated
several categories for the value:
• use value - properties that make something work or sell
• esteem value - properties that make something desirable to own
• ex change value - properties that make it possible to exchange one thing for
another.
Related to functions, the best values can also be defined as the lowest cost to provide
the functions. The objective of VE is to optimize value, which can be achieved by
different ways, for instance:
• to accomplish basic functions at lower cost
19

• to reduce the cost of secondary functions
• if possible, to eliminate or merge as many secondary functions as possible in
order to lower cost.
Here, three points should be clarified. For the first, basis functions represent the
existence of a product. No matter what will be done to improve the product or reduce cost,
etc., basic functions must be achieved. Secondly, the measure of 'cost' does not have to
be the dollars; it may also be time, power, or any other proper scale unit which can
describe the value of a function. Thirdly, when talking about lowest cost for a given
benefit, customer satisfaction and quality must be ensured. As is well known, there is a
trade-off between customer satisfaction and cost. Lots of methods are initiated and
developed to deal with how to find the proper balance point between customer
satisfaction and cost, which lS also the key and objective for the successful
implementation of VE programs.
In summary, the objective of VE is to improve the value of functions, and the force
driving VE is to ensure that the product achieves its functions in a way that is able to
satisfy the customer at an acceptable cost. Greater value can be achieved by increasing
performance and holding cost the same, or decreasing cost and holding performance the
same, or improving both.
1.4.2 Implementation
A multidisciplinary team and a formaI job plan are two important elements for the
implementation of VE. The former is the organizational premise and context. The latter
provides the guideline and structure.
20

At first, a multidisciplinary team and efficient teamwork can be helpful to understand
the current situation thoroughly because the information and knowledge can be collected
from different views. AIso, the questions can be addressed from varied aspects, and
solutions may be proposed for the problems and combined if possible to be more
powerful. A multidisciplinary or cross-functional team should be selected from skillful
professionals with different work experiences and from different functional divisions,
including marketing, engineering, manufacturing, sales, finance, and so on. As the
members of a successful team, they should be responsible, knowledgeable, good at
communication, capable of making a commitment, and creative which is especially
important for VE.
Another important element of VE implementation is the job plan, which creates a
structure that leads a team through the process and at the same time, compensates for the
peculiarities of the individual (Richard Park 1999). Generally, the job plan involves
several phases:
• information phase
• function analysis phase (or FAST diagramming phase)
• creative phase
• evaluation phase
• developing and reporting phase
• implementation phase.
Following the six steps, analysis and creativity can be used at the proper place in the
process by a team to access and assess the problems, and then create new ideas and
propose solutions.
21

1.4.2.1 Information Phase
In this phase, the first thing to do is to select the project and its major components,
which may be a high cost project, a high risk project or a problem project. Then, the
required multidisciplinary team should be selected and constructed. In addition, one
should make sure that owner, team and other personnel involved understand the VE
process and are clear about the objectives for improving the project.
Next, more effort should be paid to collect an the pertinent information before the VE
study starts. The team can absorb the information in different ways (verbal, written,
visual, etc.) from different resources:
• documents or company agencies
• facilities where the products are designed, manufacture d, packaged, shipped and
returned
• marketing department with information about customer satisfaction
• finance department for the cost data, and
• department managers for trying to make sense of the project for the associated
items.
During the process, make sure that information collection will never stop, and that
information is always up to date. Sometimes, the latest information may change the
direction of the whole study. After obtaining enough information, it needs to be sorted
and summarized for further analysis in the next phase.
1.4.2.2 Function Analysis Phase (or FAST Diagramming Phase)
The heart of the function analysis phase is to define and analyze functions integrated
with cost analysis. The function analysis system technique (FAST) is employed to
22

structure the functions and cost information into a functional tree. A simple example of a
functional tree (Lucie Parrot, 2002) is shown in Figure 1.3.
HOW? ~
WHY?
!wt_!~~I~
Cost Worth Cost/Worth Push
Pass on mower $12.00 $13.00 0.92 The Lawn
Assist movement $18.00 $20.00 0.90
---Limit Muffle noise exhaust $6.00 $6.00 1.00
Store Supply fuel $3.00 $3.00 1.00 power
Collect solar energy $45.00 $30.00 1.50
Totals: $84.00 $72.00
Figure 1.3 An Example of a Function Tree
The tasks to be done in this phase inc1ude:
• to identify and determine functions
• to evaluate and c1assify functions as basic and secondary functions
• to set worth (desirable expense or target cost) per function
• to ascertain the co st of every function
• to deploy the process and the information in a functional tree
• to determine the value per function by dividing the cost by the worth of the
function.
During the process, special attention should be paid to:
23

• assessing customer requirements and attitudes when determining and analyzing
functions
• eliminating unneeded functions and combining functions if possible
• finding the functions with value (cost-to-worth ratio) higher than 1 for cost
improvement
• clarifying the opportunities or problems for the work in the next creative phase.
1.4.2.3 Creative Phase
In this phase, more effort is made to develop new ideas for solving the problems
defined in the previous phase for the functions with bad value. The key to creativity is to
encourage a free flow of ideas without considering costs. No judging during idea creation
is imperative.
Sorne methods are helpful to create ideas, such as, brainstorming, imagination,
positive thinking, accepting aIl ideas, free for opposite attitudes, listing ideas, and so on.
Then, by summarizing, sorting, and combining ideas (if possible), alternatives are
presented. Each of the alternatives should satisfy the basic functions and to sorne extent,
fulfill the secondary functions.
1.4.2.4 Evaluation Phase
The objective of this phase is to evaluate the possible alternatives generated in the
creative phase and find the best ones on which to focus effort for further development in
the next phase.
For each alternative, both advantages and disadvantages are listed. The alternative
with disadvantages that far outweigh advantages should be put aside or abandoned. AIso,
the evaluation matrix can be constructed to rank the alternatives by using the desirable
24

evaluation criteria. Furthermore, as Del L. Y ounker proposed (2003), if none of the
alternatives performs every criterion satisfactorily, return to the creative phase. Use the
knowledge gained in evaluation to create new alternatives.
1.4.2.5 Developing and Reporting Phase
During the development process, by organizing various ideas and comparing new
alternatives with the original situation, the best ideas from the evaluation phase should be
chosen and developed depending upon: feasibility, conditions for implementation,
investment and savings, effect of the changes on product and organization, risk analysis,
etc. Different worksheets can be designed to aid in deploying development and
assessment process systematically and avoid necessary information being overlooked. As
a result, practical project solutions are formed, and expected consequences of successful
implementation are forecast.
Moreover, a weIl prepared presentation should be given for approval. The report
should show how to implement the solutions, what the differences between the proposed
solutions and original situations are, advantages and disadvantages, cost analysis and
value improvement, and so on. The most important item is to clarify and propose the
instant actions which the audience should take to make the solution work.
1.4.2.6 Implementation Phase
At first, since each project is different and the people involved are different, a
different set of values will be discussed and the implementation method will also vary for
every project. Due to the diversity of methods, each project's implementation plan and
schedule should be established, and an effective monitoring system should be built to
ensure proper fulfillment.
25

The research by Del L. Younker (2003) proposed that the design professional and the
owner review the proposed alternatives independently and determine the applicability of
each alternative. The design professional documents the reason why specific alternatives
have not been implemented. The owner directs the design professional to implement
those alternatives that best meet his needs and requirements. In aU cases, the design
professional is responsible for determining the technical feasibility of an alternative, and
each alternative must be independently designed and confirmed before its implementation
into the project design.
1.5 Risk Management
GeneraUy, risk arises from uncertainty, which is defined as "doubt about our ability to
know". Since uncertainty is inherent in material strength, engineering design,
manufacturing pro cess, operating environments, etc. (Wang and Roush, 2000), risk
inevitably exists in each phase of the life cycle of the product or the project. Since the
term risk management emerged in the mid-1950s, companies have become more and
more conscious of risk and the means of managing risks.
1.5.1 Risk
Risk can also be defined as the "variation in outcomes around an expectation." In
other words, risk refers to how life differs from what is expected (Young and Tippins,
2001). In addition, according to Kliem and Ludin (1997), risk is the occurrence of an
event that has consequences for, or impacts on, projects. They categorized risks in
different ways:
• acceptable vs. unacceptable risks
• short-term vs. long-term risks
26

• positive vs. negative risks
• manageable vs. non-manageable risks
• internaI vs. external risks.
Aiso they pointed out the five key elements of rislc
1. The probability of occurrence of a risk. In a qualitative way, the question, 1s the
probability low, medium, or high? is asked and answered, and quantitatively,
should the probability be anywhere from a to 100 percent?
2. The frequency of occurrence of a risk, which means how often the event might
happen.
3. The impact of an occurrence of a risk. What consequence will it have?
4. The importance relative to other risks. Not all risks are equal and sorne have
greater importance than others for a project's outcome.
5. The exposure, or vulnerability, which is the impact of a risk on a product, system
or project. A risk can have different levels of exposures as well as varying
probabilities of occurrence based on given circumstances. Therefore, exposure is
simply the level of impact times the probability of occurrence.
1.5.2 Risk Management Process
As Young and Tippins (2001) define, risk management is any measure taken to
evaluate risk and to control its potential impact. Since uncertainties and risk are presented
at every stage of a project, risk management becomes a crucial strategy for any company
that wants to achieve its expected objectives successfully. Efficient risk management can
avoid unnecessary risk and control acceptable risk knowledgeably, and therefore,
27

minimize the negative consequences incurred. The risk management process is composed
of three steps which are risk identification, risk analysis and assessment, and risk control.
1.5.2.1 Risk Identification
As the first step of the risk management process, risk identification works as the
premise for both accurate risk analysis and assessment, and efficient risk control. The
identification process involves:
• systematically describing and researching the structure of a project or a product
based on the information collected from different resources, such as
environmental (physical, social, economic, political, legal, operational, etc.)
narration, financial statements, legal documents, jobsite inspections, interviews,
statistical analysis, benchmarking, consulting services, and so on.
• ascertaining the uncertainty factors and recognizing all the possible mechanisms
of failure. For engineering projects, some possible areas for risk include late
design changes and defects, manufacturing variability, the interface between
engineering design and manufacture, structural and technical failures (materials,
tools, process procedures, installation specification), wear-out failures, special
severe environment, human factors, etc. Furthermore, the research by Wang and
Roush (2000) presented four major types of uncertainties, which are inherent
uncertainty (due to variability inherent in the material or the environment),
statistical uncertainty (resulting from incompleteness of statistical data), modeling
uncertainty (resulting from assumptions made in analysis of stresses and strengths,
i.e., the use of simplified models), human error (including errors in calculation,
chosen wrong known data, inadequate design review, failed to calculated critical
28

conditions, poor quality fabrication, wrong materials used, poor judgment and
abuse by operators). AU this information will help to identify risk.
• simplifying the process. It is necessary, after identifying aH initial events, to
combine those that pose the same threat to hazard barri ers and require the same
mitigating functions of the process to prevent hazard exposure. (Modarres, 1993)
1.5.2.2 Risk Analysis and Assessment
The second step of risk management is risk analysis and assessment, in which the raw
data collected in the phase of risk identification is converted into the information
describing the five key elements of risk: probability, frequency, impact, importance, and
exposure. Generally, risk analysis consists of answers to the following questions:
1) What can happen that could cause exposure to hazard?
2) How likely is it to occur?
3) Suppose it happens, what are the consequences?
To answer these questions, first, a list of outcomes or a series of events leading to the
outcomes should be c1arified, and then, the likelihood of the occurrence should be
estimated. Finally, the consequence of each event should be described.
Besides, the research by Kliem and Ludin (1997) demonstrated the two categories of
risk analysis:
• quantitative techniques, which rely heavily on statistical approaches, such as
Monte Carlo simulation
• qualitative techniques, which rely more on judgment than on statistical
calculations, such as heuristics.
29

What's more, a number ofnew methods have been adopted to analyze and assess risk,
such as fuzzy arithmetic, intervai analysis, and artificiai intelligence based methods.
Regardiess of which method is chosen, sorne rules should be considered.
• There are no 100% correct models. Each different method has its own advantages
and disadvantages. Sometimes, integration of methods can get the best result.
• Because the environment can keep changing, data in a model will become "dated"
or incorrect from time to time. Risk is not constant and risk analysis and
assessment is a dynamic process. Therefore, updating information for a moving
target becomes more important.
• lndividual perception for risk may be different from pers on to person. Even the
same person may make a different assessment under similar conditions. In order
to minimize the influence ofhuman factors, a multi-functional team composed of
experienced engineers from different departments is necessary. Also, the
assumptions used shouid be clarified and agreed by team.
• Ranking risks based on their importance to the project is necessary for reasonable
allocation of risk management. Prioritization of risks can help find which risk can
be eliminated completely, which risk is so minor as not to de serve detailed
management effort, and also, which risk should be paid special attention because
of its high probability of occurrence or serious potential impact.
• Risk deals with exposure and uncertainty. Exposure occurs when a risk makes
something vulnerable. Different levels of the vulnerability manifest themselves in
the form of impacts. What complicates the situation is the level of uncertainty of
the risk occurring and its impact. (Kliem and Ludin 1997)
30

1.5.2.3 Risk Control
The essence of risk management is to manage risks in a manner that can create
designs with less chance of failure and so accomplish expected project objectives
effectively. Therefore, how to control risk effectively becomes the most important point.
Several ways are proposed:
• to accept tolerable risk, which can also be regarded as acceptable risk. According
to the research by Modarres (1993), an assessed risk from any controllable
activity should be required to be lower than risk thresholds in order to be defined
acceptable. The societal benefits and the cost trade-offs for risk reduction are
widely used guides to set and justify risk acceptability limits. By comparing the
risks and benefits associated with certain activities, fair, balanced and consistent
limits for risk acceptability can be set and institutional controls on risk can be
established.
• to prevent risk by reducing the occurrence of accidents (or the probability of their
occurrence). In other words, to delete the avoidable risks and minimize the
likelihood of unavoidable risks. It can be achieved by identifying sources of risks
or failure mechanisms, and then removing or improving the related parts or
processes based on the type of risks.
• to mitigate the impact of an undesired event when it does happen. On one hand, a
monitoring or waming system should be installed and assured to work efficiently
enough to detect the actual deviations from plans and to keep on monitoring.
Hence, the consequence of potential risk can be perceived as soon as it is
observed. On the other hand, emergency response measures should be prepared
31

and established to minimize the impact of failure if it does happen. Therefore,
catastrophic loss can be avoided or minimized.
• to transfer risks to insurance companies by contracting for insurance, or to
vendors and suppliers by lowering the price or shortening the delivery time, and
so on.
In summary, risk management is a continuous loop. Throughout the project or the
process, environment or conditions may vary from time to time, which can bring out new
uncertainty factors; therefore, the related risks should be continuously identified, assessed
and controUed throughout the project. Currently, many risk management methods are
available, such as Fault Tree Method (FTM), Event Tree Method (ETM), Decision Tree
Method (DTM), Failure Mode and Effect Analysis (FMEA), and so on, to help detect
potential failures and their possible impacts, and then to try to control risk although not
aU risks can be avoided.
1.5.3 Integrated Risk Management in the Engineering Field
In the engineering field, the process of product development is accompli shed by
making decisions. Each engineering decision has the possibility to make mistakes and to
have loss. The possibility of failure and loss exists almost everywhere and risk is inherent.
For engineering projects, risk can be defined as the deviation of project outcomes from a
mean or anticipated value. It can also be regarded as the chance of incurring a loss or gain
by investing in an engineering project (Wang and Roush 2000). A good engineer is clever
at making decisions that can maximize possible gain, and minimize possible loss;
therefore, risk management becomes a crucial part of aU engineering design decisions.
32

According to Wang and Roush (2000), the central features of any engineering project
are to produce a result that leads to customer satisfaction, to deliver on schedule, and to
deliver within budgeted cost. At the start of any project, there are uncertainties in each of
these factors and it is important to manage the associated ri sIc. This management can help
limit the potential for negative consequences arising from these uncertainties and
maximize the possibilities that results will be better than the target values.
First, related to the uncertainty of resources, technical performance, schedule
outcome, market performance, etc., the major risks involved in engineering projects can
be defined as cost risk, technical risk, schedule risk, and market risk. Engineers often
experiment with the possibilities of improving their products while lowering the cost of
manufacturing. The potential for over-budget cost is a major concern for every engineer.
Cost risk can be estimated in terms of probability and the extent by which final cost is
expected to exceed planned cost. In order to minimize cost risk and maximize
productivity and profitability, a thorough and accurate life-cycle cost analysis is
prerequisite to make reasonable decisions. Since the early design phase of a product or
process has the greatest impact on life-cycle cost and quality, more effort should be made
to optimize product design which can achieve expected cost savings and quality
improvement at the same time. The research by Wang and Roush (2000) demonstrated
how Taguchi's robust design method provides the designer with a systematic and
efficient approach for conducting experimentation to determine near optimum settings of
design parameters for performance and cost.
Can every scheduled manufacturing step follow the designed time table? Will the
final product be delivered on time? How bad will be the effects of the delay? ... . .. These
33

questions should be asked when schedule risk is concerned. It can be expressed in the
term of possibility and the extent by which the expected procedures will be behind the
planned schedule. Managing schedule risk means "arranging the project tasks, and their
resources (human and other) in sequence that facilitates their completion". Sometimes,
companies not only care that the project or product should be accompli shed on time, but
also they hope it could be done by using minimum resources. According to the research
of Wang and Roush (2000), managing schedule risk usually requires breaking the project
into component tasks, figuring out the order in which the tasks must be completed, and
assigning the necessary resources to each task. The simple st management method is
Gantt Charts developed by Henry Gantt, in which each activity necessary to complete a
project or a product is plotted and arranged in the sequence of time with duration marked.
Milestones and markers are provided to make sure every step is on schedule. Moreover,
as another powerful tool, Project Evaluation and Review Technique (PERT) is employed
not only to identify the tasks, their sequence and duration, but also to specify the
relationship between tasks and the resources needed to fulfill each task in required time
period. Once the network of tasks is determined, the Critical Path Method is used to
reallocate resources to find the shortest time in which the project can be completed and
what resources would be needed to do that.
When a new or improved product is introduced into the marketplace or a product is
presented to a new marketplace, such as, in different countries or with changed user
groups, market risk becomes unavoidable. It can be denoted by estimating the possibility
and the extent by which expected market introduction will fail to meet the planned
34

market outcome. In order to lower the influence of the market risks, several points are
necessary:
• to carefully describe the markets addressed (both original and new) and their
difference, and to investigate composition of the customer group in detail
• to identify the market distribution of similar products
• to benchmark customer satisfaction and technical characteristics, to understand
how customers perceive the products versus their competitors, and at the same
time, to identify the areas for competitive advantage and disadvantage
• to introduce sample products to the market and analyze the market outcome.
In addition, diversity and variability of the market entail the market risk itself.
Relatively, data and information must be refreshed and collected from a wide range of
sources to make an accurate evaluation of possible risks. This also increases the difficulty
of market risk management.
Development of society arouses the improvement of technology. In order to achieve
higher commercial and industrial objectives, efforts are made to improve the CUITent
materials, tools, methods, procedures, etc., which results in the renovated or new
technology being adopted. Broadly speaking, for a project, a new technology can be
regarded as any technology which is new. In the other words, not only can it be the one
which has never been used before for a similar process or to produce the same kind of
products, it can also be the one which is just new for the particular project or the
company. Generally, because of the lack ofknowledge and experience, anything new will
lead to something uncertainty. Therefore, how to manage related technology risks leads
to sorne questions about:
35

• description: What is the new technology? How is it used? What are the challenges
and problems?
• assessment: How new is it? (Was it used before in other projects? Is there any
knowledge available for successful experience or failure les sons?) What is the
consequence of success and possible failure?
Moreover, the additional investment used for the implementation of improved or new
technology should be evaluated carefully. Incurred risks should be analyzed thoroughly
and merged into cost risk if possible. It is proposed to use a 'technology directorate'
group to develop a technology, which compared with the old concept development phase
with a "technology development effort", can make goals and constraints to be defined
more clearly, avoid little public scrutiny, and lower the chance for failure.
Besides the four kinds of risk mentioned above, there could be other potential
uncertainty factors which may endanger the achievement of the expected goal. They can
be recognized and defined in terms of environmental risk, hazard risk, political risk,
organizational risk, and so on. Sometimes, the types of risks or their priority is not the
same for different projects or products. The major risk identified in one may be perceived
as a minor risk in another one. AIso, with increasing process complexity for a project or a
product, managing risk becomes harder. Therefore, efficient methods to concurrently
manage different risks are required, and the integration of all the risks expected will
provide the direction for rational decision making.
Integration will become difficult when different kinds of risk are handled. To sorne
extent, prioritization of risks can make risk integration possible, which offers a way to
36

combine different risks together by ranking aIl the risks involved and setting the scale for
different risks.
Wang and Roush (2000) proposed the integrated risk management approach to
manage cost risk, technical risk and schedule risk concurrently. In the other words, they
suggested management attention (and thus, resources) should be focused on the elements
of a project that need such attention in order to permit the project to achieve its teclmical,
schedule, and cost goals proactively. In their research, different methods were presented
for the integration, such as Present Worth (PM) method, Cash Flow Diagram, Network
Diagram. Furthermore, they proposed simulation techniques to solve complicated
problems.
Simulation is the modeling of reality to understand and solve problems. To perform a
simulation analysis for integrated risk management, the first step is to build an analytical
model by replicating the real world based on a set of assumptions and conceived models
of reality, which should be able to represent the actual decision situation. The second step
is to develop a probability distribution from subjective or historie data for each
uncertainty factor in the model, such as project schedule, budget constraints and technical
challenges. It is shown that a large amount of data relating to quality, quantity, schedule,
priees, manpower, overheads, materials, etc. are required to simulate the operation of an
engineering project. Although sorne limits exist, integrated risk management models, to
sorne extent, can simulate random variations to provide a range for the possible profit and
risk control for a project.
In addition, according to Wang and Roush (2000), risk implies opportunities for
improvement, and success in engineering benefits from the ability to recognize
37

opportunities. For engineering projects, there is always a trade-off between risk and
opportunity. A conservative engineer might select the conventional design to assure a
reasonable reliability, while an aggressive engineer might take the innovative design to
achieve better project performance. Anyway, a responsible engineer should be able to
make a balance between risk and opportunity based on the constraints and benefits
inherent in a project. On one side, uncertain factors (or risk) should be identified and
managed in a way to make designs with less chance of failure, and on the other side,
more effort should be focused on the area for further improvement to maximize gain.
38

CHAPTER2
OPTIMIZATION MODEL FOR IMPROVED QUANTITATIVE QFD
2.1 Background and Assumptions
The model to be developed in this thesis is concemed with how QFD can be
integrated with value engineering and risk analysis, given the product-related information
required during the early phases in the product development process. The core structure
of the model comprises three different objects which are customer requirements (CR),
design characteristics (DC), and design functions (DF). Design characteristics work as
the bridge to connect customer requirements with design functions. The interactions of
these entities are described by using quantitative scales in this model. The relationship
between CR and DC is discussed in section 2.2. The connection between DC and DF
during the decomposition process of product into design functions is discussed in section
2.3. Section 2.4 describes the resolution of problems into practical solutions which is
based upon the detailed analysis of cost and risk for every design function. For each of
these solutions, financial factors and design uncertainties are considered. In order to
identify the best solution, the method for comparison and evaluation of the current design
and the different solutions is shown in section 2.5. For this comparison, the new concepts
of customer satisfaction value and an integrated evaluation index are defined and used to
make a decision. Finally, the development of a best solution is discussed in section 2.6. A
method for companies to determine a realistic target unit cost for the best solution is
proposed with consideration of the best balance between customer and enterprise
satisfaction.
39

Three assumptions are made in the model. First, it is assumed that the correlations
between design characteristics and the interactions between design functions can be
ignored. In addition, customer requirements are assumed to be independent from each
other. For a product which is not very complex, it is feasible and reasonable. Therefore,
during the information collection and analysis process, effort is made to classify different
and independent items, and to combine similar and related items. Proper expressions are
given to have accurate descriptions. For example, a vacuum-insulated glass bottle is
analyzed. When the design characteristics are defined, since the shape of stopper may
affect the shape of top, the definition of relative design characteristic can be given as the
shape of top and stopper, in which the two related parts, i.e., top and stopper are
combined.
Second, it is assumed that the ratio of actual cost to planned cost for each function is
1 for solutions or new designs. This means that planned cost will be used to fulfill
functions; this is financiallyreasonable for optimum alternatives with the best value of
functions.
Third, it is assumed that sales are linear with customer satisfaction, ev en though an
increase in cost exists. Therefore, the model is more suitable for a product with a lower
cost or price that is more sensitive to change in unit cost. This means that a relatively
small increase in unit cost can visibly raise customer satisfaction, which causes increased
sales. It is easy to understand that customers pay more to get a better product. However,
for the product with a higher price, like an airplane, the difference in cost has to be
considered when the amount of sales is predicted.
40

2.2 Interpretation and Formulation of House of Quality Matrix
The model starts with the collection of customer requirements (CR) and the first
matrix used here is the house of quality matrix (HOQ). In HOQ, the voice of the
customer is translated into the language of the designer, and this is named the design
characteristics (DC). The relation between CRs and DCs will be discussed further.
At the beginning, who the customer is must be determined and the customer
requirements must be defined properly. The customer's own words will be used so that
the real demands of the us ers can be fully expressed and so that the expression can be
clearly explained and weIl understood. In addition, the type of market is chosen as the
point of reference. Market surveys are made and as much information as possible can be
gathered. By analyzing questionnaires, claims, and attitudes regarding a product or
service, customer requirements are determined and related data is summarized to give
relative importance to customer requirements.
From a technical point of view, design characteristics are determined for the product
or service in order to meet customer requirements. At least one design characteristic is
identified for each customer requirement. Measurable and controllable technical
specifications not only help to exhaustively evaluate the product or service, but also to
reflect customer perception concerning quality. This is a particularly ex acting step
because it implies translating the market model as expressed in subjective terms by the
customer's words into objective factors of a technical nature (performance
characteristics), that is, into a description of the product or service expressed in the
designer's own language (the so-called voice of the engineer) (Franceschini, 2002).
41

The central part of HOQ is the relationship matrix, which indicates the impact of
design characteristics on the satisfaction level of each customer requirement. The
knowledge and experience of engineers who are proficient in the design of the product or
service being developed provide the foundation for the accurate definition of the
relationship between customer requirements and design characteristics. For every element
of the matrix, the question is asked and answered: to what extent can the design
characteristics of a product or service affect the quality expected by the customers in
terms oftheir degree of satisfaction (Franceschini, 2002)7 The relationships between CRs
and DCs are expressed in a quantitative manner.
Table 2.1 House of Quality Matrix
Customer Requirement (CR)
Relative Weight of Importance of CR (C)
AlI the information mentioned above is rationalized and organized into the house of
quality matrix. As shown in Table 2.1, customer requirements and the relative weight of
importance of CR are input into the leftmost columns, and the design characteristics are
located on the right side at the top. The relationship matrix is in the body. Based on the
relative weight of importance of the CRs and the information contained in the
relationship matrix, the weight of importance of the DCs can be derived. The priorities of
the DCs are then determined. The symbols and formulas used in the related matrix are:
CRi: ith customer requirement
42

Ci: relative weight of importance of the ith CR,
(2.1)
Rij : relationship value, indicating the strength of relationship between ith customer
requirement and the /h design characteristic, and the scale 1,2,3,4,6,7,8,9,10 is
used to denote relationship. The bigger the value is, the stronger the relationship
IS.
DCj : jth design characteristic.
Dj: weight of importance of /h DC.
m
D j = ICi * Ru') = 1,2, ... ,n (2.2) i=1
Dt: the sum of the total weight of importance of n design characteristics.
n
Dt =ID; (2.3) )=1
dj: relative weight of importance of /h DC,
d D; . 12 .=--,]= , , ... ,n .1 Dt
(2.4)
fi
Id=l .1 (2.5)
;=1
2.3 Diagramming Function Analysis - the Function Tree
Function identification and analysis should be performed by a multidisciplinary team,
which is requisite for a complete understanding of all aspects of a product. Before
starting team actions, it is necessary to obtain all available information regarding the
project. For a product or a process, this should inc1ude detailed costs, technical drawings,
43

operation sheets, marketing surveys' reliability and warrant y information, a set of parts or
an assembly, and any other available information. If the project is in the concept stage,
the information may be sketchy or be only a set of specifications (Park, 1999). Many
methods can be used to identify functions, such as intuitive research, environmental
analysis, sequential analysis, reference product analysis, regulation analysis, and so on.
The functions should show what a product can do for the customer. Each function can be
expressed by an active verb and a measurable noun. AlI functions are c1arified and
organized into a function tree. When diagramming the function tree, functional
relationships are arranged in accordance with the answers to why/haw logic questions
with 'how a function will be done' to the left and 'why a function exists' to the right. See
Figure 2.1 for an example. In addition, the arrangement of functions which have a time
sequence relationship are arranged such that the functions happening earlier appear at the
right side to answer haw questions, and the functions occurring later are found at the left
to answer why questions.
In this model, the function tree not only provides a hierarchical structure of design
functions (DF), but also indicates the relationships between design characteristics and
design functions. As shown in Figure 2.1, as the oth level function, the basic goal is first
set, which is a general task that the product itself should accomplish, for example, please
customer. By considering the contents of the product, the oth level function can be
decomposed into the 1 st level functions, which are mainly composed of design
characteristics, for example, improve nth design characteristic. It is easy to understand the
cause-and-effect relationships between oth level and 1 st level functions. As an example,
from the left to the right: haw ta please custamer? is asked, and the answer is the design
44

HOW? .. ·'Ji~,,~(qii;·?l
<.;
Improve Design - Characteristics (1)
(DC1)
......
Please Improve Design Customer Characteristics 0)
1 (DCj)
Basic
Goal
......
--- Improve Design
Characteristics (n) (DCn)
r---
1 _J
1 __ -
..... WH Y?
Design Function (11)
(DF 11)
Design Function (12) (DF 12)
1 Design Function (j(k-1»
;-- (DF j(k-1»
1 _ L _ Design Function (jk)
1 (DF jk)
1 !.. _ ~ Design Function (j(k+1»
(DF j(k+1»
Design Function (n(x-1»
1-1 (DF n(x-1»
1 - L _ ~ Design Function (nx)
(DFnx)
Totals:
Figure 2.1 Function Tree
45
Relative Weight of Importance of OF
(f)
f11
f12
f j(k-1}
f jk
fj(k+1)
f n(x-1)
f nx
ft
Actual Cost of OF
(AC) ($)
AC 11
AC12
AC j(k-1)
ACjk
AC j(k+1)
AC n(x-1)
AC nx
ACt
R
s
K
A
N
A
L
y
s
s

characteristics shauld be impraved. Inversely, why the design characteristics shauld be
impraved? The purpose is ta please custamer.
Similarly, corresponding to every characteristic, 1 st level functions can be
decomposed into lower level functions, such as 2nd level, 3rd level, ... , nth level, ....
During the process, two-word function language (noun-verb) is used. Haw and why
questions are asked and answered. Following the above procedure, the function tree is
constructed.
At the deepest level, design functions are classified as basic or secondary functions,
and for each function, the relative weight of importance (f) is given. The bigger the value
of f, the more important the related function is. It means the basic functions have the
higher value of f than the secondary functions related to the same design characteristic.
Moreover, aIl the defined basic functions must be attained in aU solutions proposed later.
Next, the information from historical data and actuallife-cycle cost of the product are
provided by the owner as weIl as design and manufacture professionals. Actual cost for
every function (AC) is derived and put into the right column in function tree.
In summary, during the function analysis phase, what should be performed includes
that:
• design functions are identified and defined by the noun-verb function language
• the connections between design characteristics and design functions are clarified
• design functions are classified as basic or secondary functions by using relative
weight of importance, f
• financial factors are considered and the actual cost of each function is given
46

• the function tree diagram provides a foundation for analyzing cost and risk in
detail in the next cost and risk analysis matrix.
Definition of symbols and formulas related are expressed as follows:
DFjk: kth design function which is related to the /h design characteristic (DCÙ, and it is
from the deepest level functions on the function tree, which is then reordered and
arranged in sequence in the foUowing cost and risk analysis matrices
f jk: relative weight of importance of DF jk
x
If 'k = l,) = l,2, ... ,n k=l .1
(2.6)
ACjk: the actual cost required to achieve DFjk
ACt: total actual cost required to achieve aU the DFs.
n x
ACt =I IACjk (2.7) j=1 k=1
2.4 Constructing the Integrated Cost and Risk Analysis Matrix
Based on the information collected in the function tree, cost and risk analysis matrices
are developed, in which the cost model and risk model are integrated with function
analysis. Financial factors and design uncertainties are considered and identified at the
level of every design function. Actual product data is put into the matrix.
In this model, in order to analyze different cases or designs, a series of cost and risk
analysis matrices are built, which are named cost and risk analysis matrix 0 (CRAM 0)
for the current design, cost and risk analysis matrix 1 (CRAM 1) for solution 1, cost and
risk analysis matrix 2 (CRAM 2) for solution 2, ... , cost and risk analysis matrix n
(CRAM n) for new designs or solutions.
47

Before deploying matrices, target unit costs (TC) must be determined. The definition
of TC is expressed in the equation below:
T arg etUnitCost = T arg etUnitSale Pr ice - T arg etUnit Pr ofitM arg in (2.8)
Historical data and market analysis can help to set a realistic target unit sale price
(TS). Market conditions have to be carefully considered. Enough attention must be paid
to get a proper value for TS, since it is essential for achieving an accurate overall analysis.
In order to help understand how TS can be determined, an example from Cooper and
Slagmulder (1997) is followed. Nissan determines the target price by considering a
nurnber of internaI and external factors. The internaI factors include the position of the
model in the product matrix and the strategic and profitability objectives of top
management for that model. The external factors include the corporation' s image and
level of customer loyalty in the model's niche, the expected quality level and
functionality of the model compared to competitive offerings, the model' s expected
market share, and the expected price of competitive models.
After setting the target unit sale price, the target unit profit margin (TP) needs to be
established based on the company' s experience and on evaluation of competitive
companies with the similar products. Besides, a realistic value of TP should be
determined so as to assure that the expected profitability of the product across its life is
adequate, which means that enough profit margin must be left so that an adequate return
can be earned by the company for a given product.
It is easy to understand that setting a reasonable target unit cost (TC) is a premise for
successfully deploying a cost model. Based on the analysis and definitions above, several
points are clarified to help predict a realistic target unit cost.
48

• TC cost goals must be established before detailed design starts.
• A thorough study of historical data and market information lS necessary.
Customer wants and company profitability requirements must be carefuIly
analyzed and weIl balanced.
• Benchmarking can help a company identify its position compared to its
competitors in the chosen market.
• Target cost should cover aIl costs incurred, both inside and outside, and both
direct and indirect. From another viewpoint, only the product that can guarantee
the proper target profit margin when sold at the target unit price is the meaningful
design for a company to invest to make the product.
2.4.1 Cost and Risk Analysis Matrix 0 - Current Design
CRAM 0 is composed oftwo main parts which are cost analysis and risk analysis. AlI
necessary information about functions, cost, and risk are collected and put into the
current design. Cost and risk analysis are performed in detail. Problems that exist in the
current design are figured out. Possible areas on which more attention should be focused
in the next stage are determined.
As shown in the Table 2.2, design characteristics (DC) and relative weight of
importance of DC( d) from the house of quality matrix are used, and design functions (DF)
and the relative weight of importance of DF(f) are derived from the function tree. Once
the target unit cost is set, based on the value of d and f, the target cost can be prorated to
each design function, and so planned cost of design function (PC) can be obtained. This
can also be regarded as the target function cost by which the necessary design functions
can be achieved. In addition, direct market research, by asking customers to estimate how
49

\
Table 2.2 Cost and Risk Analysis Matrix 0
Product (Current Design) --> Design Characteristics - Functions: Cost and Risk Analysis Target Unit Cost (TC): TC 0 ($)
50

much they would pay for a given function, can also help set a realistic value for the
planned cost of each function. The definition of the pararneters and the related formula
are denoted as follows:
PCjk: the planned cost required to achieve DFjk
PC 'k = d.* f, * TCO ,U = 1,2, ... ,n),(k = 1,2, ... , x) ./ ./ ./k
(2.9)
TCO: target unit cost for product in the current design.
For every design function, the actual cost is given in the function tree. So the ratios of
actual cost ofDFs to planned cost ofDFs can be calculated as follow:
ACjk . V'k = ,} = 1,2, ... ,n,k = 1,2, ... ,x., ./ PCk
./
(2.10)
Vjk: ratio of the actual cost required to achieve DFjk to the planned cost required to
achieve DFjk, the best value of Vjk is equal to 1.
The comparison of the actual cost to planned cost of each function can clearly
determine the places to concentrate creative efforts for maximum benefit. In the other
words, a value of Vjk greater than 1: 1 indicates the opportunity for cost improvement.
The greater the ratio, the greater is the chance for improvement on the potential areas.
Thus, improvement opportunities for the related design functions are identified for
current design, which chart the direction for work in the next phase.
Many variables (factors) can be identified which impact the current design, such as
cost, time, location, level of knowledge, extent of effort, internaI or external change
conditions, performance, etc. Design uncertainties exist in these factors. All of these
uncertainties are considered as risk attributes (RA) in this model. Their definition and the
relative weight of importance of each attribute (RA) should be determined by a
multidisciplinary team which is made up of experts from different departments. They
51

should be familiar with specifications for design and manufacturing. Their expertise can
pro vide the foundation for a thorough and accurate analysis. The parameters and formula
used in matrix are expressed as follows:
RAi: ith risk attribute
Rai: relative weight of importance of ith risk attribute
(2.11)
Once the risk attributes and their relative weights of importance are settled, risk
analysis is deployed in the second part of the matrix and the risk assessment levels are
defined:
Pjki : the risk assessment level for jkth design function DFjk to satisfy the ith risk
attribute RAb which is based on the probability of success for DFjk to fulfill RAi.
The higher the Pjki is, the more probable the jkth design function will fulfill the ith
risk attribute successfuIly, which means the better the result is for
accomplishment, 0:::; PJki :::; 100% .
FPjk: the risk assessment level for jkth design function DFjk to satisfy aIl the risk
attributes, which is based on the average probability of success for FPjk to fulfill
aIl the risk attributes.
y
FPJk = LPJki* RŒ,(j = 1,2, ... ,n),(k = 1,2, ... ,x) (2.12) i=!
DPj: the risk assessment level for the jth design characteristic DCj to satisfy aIl the risk
attributes, which is based on the average probability of success for DCj to fulfill
aIl the risk attributes.
52

DPt: the total risk assessment level for aIl design characteristics, which is also the
average risk assessment level for aIl the design functions.
In order to obtain the risk assessment level (P) for every function, the definition of
success and failure is given for every risk attribute. In addition, some questions are asked
and answered to help get the value of P. For example, when cost is treated as RA, the
definition of success is: the planned cost of the function is enough to achieve the function,
which can definitely satisfy the customer requirement weIl. In this case, it is called the
function can satisfy the risk attribute (cost) successfully and Pis equal to 1 or 100%. On
the other hand, the definition of failure is: when extra money, which is more than 50
percent of planned cost of the function, has to be spent on the function, but it still cannot
attain the desired customer satisfaction, and so P is O. The questions asked are: how much
money is needed to perform the design function? how weIl has the required function been
performed? or what is the chance of success for the function to be achieved? The answers
are given a value between 0 and 1.
Another example of risk is for technique. The definition of success is: when the same
kind of practice has been successfully dealt with before and there is no main technical
challenge now; p is 1 or 100%. On the other hand, the definition of failure is: when a
serious technical problem exists and the solutions are hard to figure out, or the pro cess
has never been tried before; p is O. The questions asked are: what is the technical problem?
to what extent can the function be accompli shed? or what is the opportunity of success
for the function?
As above, after analyzing the chance of success for every function to fulfill each risk
attribute, the risk assessment level of every design function (P) is determined. Then the
risk assessment level for every design characteristic (DP) is computed as follows:
53

x
Dp· = I.FP" * f. ,j = 1,2, ... ,n .1 "=1 .1 .1"
(2.13)
FinaUy, the risk assessment level for aU design characteristics (DPt) is summed,
n
DPt = I.DP*d .1 .1 (2.14)
j=1
The result also glVes the chance of success of the whole design taking into
consideration the given risk attributes. At the same time, by observing the data given in
the risk analysis, more attention should be given to the design functions with lower risk
assessment level or lower chance for success. The potential problems related to the risk
attributes need to be determined. This can give sorne hints for the next stage where as
many new ideas as possible will be created to get the solutions.
As stated above, in cost and risk analysis matrix 0,
• design characteristics and design functions of the product for the current design
are deployed, and their relationships are discussed,
• cost is elaborated at the function level in the first part of the matrix, and the ratio
of actual cost to planned cost is calculated for each function,
• in another part of the matrix, risk attributes are identified and risk assessment
levels for each design function are determined; furthermore, the risk assessment
levels for every design function and aU design characteristics to fulfiU aU risk
attributes are calculated,
• problems and are as for improvement are identified, and more effort should be
paid to the items which show the larger difference between actual cost and
planned cost, and/or the items with lower risk assessment level.
54

Table 2.3 Cost and Risk Analysis Matrix n
Product (Solution n) --> Design Characteristics - Functians: Cast and Risk Analysis Target Unit Cost: TCn ($)
55

2.4.2 Cost and Risk Analysis Matrix n - New Designs
Starting from the issues determined in the preceding phase, as many new ideas as
possible are developed to improve the defined functions. Sorne creativity methods, like
brainstorming, can be used to stimulate creativity for possible alternatives. AlI the
information and data are collected. Created ideas are classified and all the ideas with the
greatest potential are combined to give sorne practical and realistic solutions. For every
solution, the information about cost and design uncertainties is gathered and deployed in
the new cost and risk analysis matrix. This is called the cost and risk analysis matrix n
(CRAM n), n = 1,2,3, ....
As shown in Table 2.3, CRAM n looks quite similar to CRAM O. Since the processes
for building the different matrices are almost the same, there is no need to spend time
repeating the same description. Sorne key points are highlighted below.
• Every proposed solution should be defined carefully and clearly before
constructing matrices. All related information should be collected and analyzed
by multidiscipline team. If necessary, new function trees should be created.
• When setting the target unit cost for solutions or new models, the cost of any
design changes or manufacturing modifications should be considered carefulIy.
• In CRAM n, there are no columns for actual cost of DF (AC) and the ratio of
actual cost to planned cost (V). Planned cost of DF is supposed to fuifill every
function for the new model, which is also the ideal financial case for the optimum
solutions with the best value of functions; then, risk is analyzed as before.
• By building CRAM n, the distribution of cost is shown. Risk assessment levels
for each function to fulfill every risk attribute are carefully laid out. The risk
assessment levels for design functions and design characteristics are calculated.
56

Table 2.4 Integrated Evaluation Matrix
Solutions --> Customer Satisfaction Value + Integrated Evaluation Index
Customer Requirement (CR)
57

• As a result, the average risk assessment level for all design characteristics to
fulfill aU risk attributes is determined for each solution.
2.5 Building the Integrated Evaluation Matrix - Current Design and Different Solutions
In order to filter out the best solution from different solutions, an integrated
evaluation matrix (IEM) is built. In IEM, the current design and different possible
solutions are compared by using customer requirements as the evaluation criteria;
moreover, the value of total customer satisfaction for each design, and the integrated
evaluation index with consideration of cost and risk are determined to assist decision
making.
As shown in Table 2.4, on the top part of the matrix, customer requirements and
relative weight of importance of CR are given in the left columns. Then, the brief
description for current design and different solutions are listed on the right at the top. The
value of customer satisfaction is defined as follows:
Mij : customer satisfaction rank value 1-9, 9=high, which indicates how well the
product is made by using CUITent design or the /h solution satisfies the ith customer
requirement CRi. The higher Mij is, the better the customer requirements are
satisfied.
Mtf the value of total customer satisfaction for the CUITent design or each possible
solution. This indicates how well the product made by using the CUITent design or
the /h solution satisfies aIl the customer requirements.
By giving the value ofMij in the center part of the matrix, each solution is ranked from 1
to 9 against the current design by using every customer requirement as evaluation criteria.
The value of total customer satisfaction for different designs is computed:
58

m
Mt} = ICi * Mij,(j = 1,2, ... ,n) (2.15) i~l
The solution with the higher value of Mtj is the one which can achieve better customer
satisfaction. Also, it implies that the solution is the design that customers really like.
Furthermore, in the bottom part of the matrix, the different designs are given
evaluations with consideration of financial factors and design uncertainties. Parameters
and formulae are:
Sj: average sale units per year for the current design or the /h solution, which is
assumed to be the liner ratio with the total customer satisfaction value for each
solution (MtÙ. The more the customers are satisfied, the more likely it is that they
want to buy the products,
Sj = .Mti , (j = 1,2, ... , n) SO MtO
(2.16)
uej: unit cost for the /h solution, which is the actual unit cost for the current design or
the target unit cost for /h solution
Ctj: total cost ofproduct per year for the current design or the jth solution
Ct· = UC· * S,(j = O,1,2, ... ,n) J J J
(2.17)
Pricej: actual sale priee per unit for the current design or target sale price per unit for the
/h solution
Bj: benefits obtained from making one unit of the product by the company when
using current design or /h solution
B· = Pr ice·,(j = O,1,2, ... ,n) J J
(2.18)
YBj : yearly benefits for current design or /h solution
59

YB· = Pr ice· * S .,(j = 0,1,2, ... ,n) .1 .1.1
(2.19)
(BIUC)j: the ratio of bene fit per unit to cost per unit for current design or lh solution
( BJ Bj. UC . = UCj,(j = 0,1,2, ... ,n)
.1
(2.20)
NVj : integrated evaluation index taking into account cost and risk factors for current
design or lh solution
NV· = [(~J l * D Pt·, (j =O,I,2, ... n) .1 UC. .1
.1
(2.21)
The solution with the higher value ofNV, i.e., the one which can meet the integrated
criteria of cost and risk better, is more beneficial one for enterprise satisfaction.
As described above, different criteria (customer requirements, financial factors,
design uncertainties) are used to make evaluation on each design. The large lists of
solutions are narrowed to the best one or two which will undergo further development in
next phase. Doubtlessly, the solution with the highest value of both Mt and NV will be
the best one. But sometimes, for the solutions with higher Mt, its NV is lower. And
similarly, the solutions with higher NV have Mt in the middle range from 1 to 9. In this
situation, the objective value of Mt and/or NV should be set by benchmarking and careful
analysis. Comparing aIl solutions with the value of Mt (and/or NV) more than the
objective value of Mt (and/or NV), the one with the highest value of NV (and/or Mt) is
the best one. For example, the objective value of Mt is first set at 7. Three solutions are
discussed. Their Mt and NV are given as:
60

NVI = 0.9, NV2 = 0.85, NV3 = 0.7
Since Mtl is less than 7 (objective value), solution 1 is rejected. Besides, Mt2 and Mt3 are
both more than the objective value of7, and at the same time, NV2 is bigger than NV3; so,
Solution 2 is the best one, although Solution 3 has bigger Mt than Solution 2. This means
that the final product foIlowing the proposed design should not only satisfy customers
weIl, but also, should be the one the company can afford.
2.6 Deploying Development Matrix and Diagramming - Best Solution
The best solution deserves further development and the development matrix (DM) is
deployed. Given different target unit costs for the proposed design, customer satisfaction
is analyzed and integrated evaluation indexes are determined. In addition, a diagram is
constructed to show the relation between target unit costs and customer satisfaction, and
the relation between target unit costs and integrated evaluation indexes. The combination
of the matrix and the diagram can show the trend for improvement. Companies can get
what they want, and a reasonable target unit cost for the best solution can be determined
for the proper balance between customer and enterprise satisfaction.
In the development matrix, almost aIl the parameters have been defined before.
Related data can be derived from the matrices illustrated in preceding phases. Here, unit
cost for the best solution (UC) is used to represent the different target unit cost which is
set for the best solution. UC should not be confused with the target unit cost defined for
the different solutions in the cost and risk analysis matrix. Take UC2 as an example. It
means that the planned unit cost for the best solution is UC2 in the development matrix or
the target unit cost (TC) for the best solution is set as UC2. Of course, the value of TC for
the best solution could also be assumed to be UCI, UC3, etc. Now, TC2 means the target
61

Table 2.5 Development Matrix
Best Solution: Unit Cost --> Customer Satisfaction? Evaluation Index?
62

unit cost for solution 2 in the cost and risk analysis matrix 2. If solution 2 is not the best
solution, the value of TC2 is assumed to be constant and to be used in CRAM2. If
solution 2 is found to be the best solution and needs further development, different value
(UC I , UC2, UC3, etc.) can be given as the target unit cost for the best solution, i.e.
solution 2, in the development matrix.
The development matrix comprises two separated parts. In the first part of DM,
different planned unit costs are given as target unit costs for the best solution, and each
planned cost for one product unit is distributed to every design function. The process of
cost analysis is the same as the one elaborated in cost and risk analysis matrix n.
Similarly, the risk analysis for the best solution with different planned unit cost can be
performed at the level of design functions based on the given risk attributes. The process
is the same as the one described in cost and risk analysis matrix n. As a result, total risk
assessment levels are obtained for the best solution with different planned unit costs.
The second part of DM looks quite like the integrated evaluation matrix, in which the
best solution with different planned unit cost is ranked by using criteria for customer
satisfaction, financial factors and design uncertainties. As a result, the value of total
customer satisfaction value and the integrated evaluation index with consideration of cost
and risk are determined for the design with different planned unit cost. Based on their
value, the diagram below can be constructed.
As shown in Figure 2.2, the x axis represents the planned unit cost, the left y axis
denotes total customer satisfaction, and the right y axis shows the integrated evaluation
index with consideration of cost and risk. The pink curve demonstrates the relationship
between customer satisfaction and planned unit cost for the best solution. The dark blue
63

Unit Cost (UC) ($)
Figure 2.2 Unit Cost versus Customer Satisfaction and Evaluation Index Diagram
curve depicts the relationship between the integrated evaluation index and planned unit
cost for the best solution. When the junction points of these two curves are taken, the
proper balance between customer and company satisfaction can be achieved in the final
product. Based on the concrete data and the objective value, the realistic target unit cost
can be determined for the best solution.
Generally, spending more money can make a better product which can achieve higher
customer satisfaction. But sometimes, a perfect product is not only unaffordable, but also
it cannot achieve a high sales level, which means that even interested customers don't
like to spend that much money on the product compared to the same kind of product from
other companies at a lower price. Therefore, it is necessary to find the proper balance
between customer and enterprise satisfaction. An example is illustrated in Chapter 3 to
show how the model works.
64

CHAPTER3
ACASESTUDY
In order to show the performance of the model, an example is presented. Parameters
and related data are illustrated in a series of matrixes. AIl calculations are performed
automatically through the use of spreadsheets based on the equations formulated in
Chapter 2. Solutions and results are discussed at the end of the chapter.
3.1 HOQ Matrix
A company pro duces a hot & cold vacuum-insulated glass bottle (HCVGB). It is
composed of five main parts: plastic mug top, plastic stopper, bottle body (glass interior
wall, vacuum insulation layer, glass exterior wall and the plastic cover), plastic handle,
and plastic base. At first, based on the information collected, customer requirements are
defined and related design characteristics are identified. During this pro cess, similar and
related items are combined together, and different and independent items are separated.
As a result, every customer requirement is independent from each other. Similarly, for
design characteristics with different definitions, their correlations are ignored.
According to a market survey, nine major customer requirements (CR) are gathered
and relative weights of importance of CR (C) are identified. They are: (CRI) good
insulation to keep items hot or cold (C 1=O.35), (CR2) durability (unbreakable) (C2=O.15),
(CR3) easy to fill and serve (C3=O.1), (C~) easy to open and close (C4=O.09), (CRs)
comfortable handle (Cs=O.08), (CR6) stable base (C6=O.08), (CR7) does not spill
(C7=O.06), (CRs) nice look (appearance) (Cs=O.05), (CR9) easy to clean (C9=O.04).
65

Table 3.1 House of Quality Matrix
Customer Requirement Handle 1 Base
66

AIso, there are seven design characteristics (DC), i.e., shape and material of top and
stopper (DCI), shape and dimension of mouth (DC2), attainable vacuum for insulation
layer (DC3), bottle body material (DC4), handle shape and material (DC5), base shape and
material (DC6), exterior color and texture (DC7). The relationship between CRs and DCs
is indicated by the relationship value (Rij), and the scale 1, 2, 3,4, 6, 7, 8, 9, 10 is used.
The bigger the value, the stronger the relationship is. AlI the information above is
illustrated in the HOQ matrix in Table 3.l.
Based on the formulae given in Section 2.2, calculation is done automatically. The
relative weight of importance of design characteristics (d) is the output, which shows the
relative importance of each design characteristic for the whole unit. For example, d3 has
the highest value 0.215, and d7 has the lowest value 0.081, which me ans that DC3 is more
important than DC7, and this somewhat indicates that DC3 deserves more attention than
DC7.
3.2 Function Tree and Cost and Risk Analysis Matrix 0 - Current Design
The functional analysis for the hot & cold vacuum-insulated glass bottle is developed
in the function tree, detailed cost and risk analysis for the glass bottle are processed, and
then put into the cost and risk analysis matrix O.
At first, in the function tree, the basic goal is set, which is to please the customer.
Then, the sequential relationships are arranged in accordance with the answers to
hawlwhy logic questions. For example, from left to the right, the question is haw ta
please the custamer?; from right to the left, the answer is ta imprave design
characteristics. Step by step, aIl design characteristics are connected with design
functions (DF), which are identified as verb-noun descriptions, i.e., keep hot or cold, stop
67

interior contents, grip bottle, and so on. Moreover, actual costs are glven for each
function and their value is put into the right column in the function tree.
Relative Weight Actual HOW? WHY?
~ i::;;;ii{:~''",,;, ' , L~V:èl, ; ;;;f4
-..' ,,~v-..
of Importance of DF Cos! of OF . If) (AC) ($)
~. ;:1!~v&it~(; 1 Stop interior contents (OF1'l) 1 t;:ÎlvIiIO Improve
0.30 $O.[iO
...... 1 Allow mouth open or close (OFI2) 1 0.30 $0.50 R
ri Top and stopper ~ r Keep hot or cold (DF13) l (OCll
0.20 $0.30
r Con Iain c~mtents (DF14) l 0.10 $0.13 S
Satisfy temp. & press. (OF 15) 0.10 $0.15 1<
1 Mouth (DC2) Allow contents to move in and out (DF26) 0.50 $0.50 l\
1 Avoid spill (DF27) 1 0.50 $0.30 N
/\ 1 Altainable vacuum (OC3) 1 r Keep' hot or cold (Df'38) l 1.00 $1.75
1 Avoid breakage and spoilar)El (DF49) 0.50 $1.80 y
1 Picage rI-- -1 Bottle body material ~ H Satisfy temp., press. and light weigl1t 1 Customer (OC4) (OF4(10))
0.30 $0.72 S
1
1 Basic 1 1 clean easily (OF4(11) Goal
0.15 $0.30 S
Keep hot or cold (DF4(12») 0.05 $0.01
r Handle (OC5) 1 1 Grip boUle (OF5( 13)) 0.70 $0.50
1 Be cornforlable (DF5(14») 1 0.30 $0.15
Base (DC6) 1 r Hold boUle stably (DF6(15)) l 1.00 $0.52
-1 Exterior color and texture Attract uservisuallv OF7(16») (DC7)
0.60 $0.12
Satisfv ("elinIJ oftouch (DF?(17)) 0.40 $0.26
Totals: 7.00 $8.61
Figure 3.1 Function Tree
Furthermore, design functions are analyzed and classified, so the relative weight of
importance of DF is determined. The bigger the value of f, the more important is the
function compared with the other functions for the same design characteristics, i.e., for
the same design characteristic, the basic functions should have a higher value of f
compared to the secondary functions. Take Del (top and stopper) as an example, for
which there are five DFs related. Basic functions are DFll, stop interior contents, DF12,
allow mouth to be open or closed, DF 13, keep hot or cold, and secondary functions
68

include DF 14, contain contents, DF 15, satisfy temperature and pressure. Respectively, the
value offll , f12, f13, f14, fl5 are 0.3, 0.3, 0.2, 0.1, 0.1. As shawn, the model also provides a
way ta demonstrate the slight difference between the basic functions in terms of their
importance. For example, DF\\, DF12 and DF13 are determined ta be the basic functions
for DCI. DF Il and DF 12 are more important than DF 13; therefore, fil and f l2 are given the
higher value of 0.3 compared ta f13 with a value of 0.2. The quantitative description for
the importance of DF makes it possible ta prioritize design functions for their related
design characteristic. The most important thing is that the basic functions must be
achieved in the product by using any design or solution. They are: DFII, DF12, DF13 for
DCI, DF26 (allow contents ta move in and out) and DF27 (avoid spill) for DC2, DF38 (keep
hot or cold) for DC3, DF49 (avoid breakage and spoilage) and DF4(1O) (satisfy temperature,
pressure and light weight) for DC4, DF5(13) (grip bottle) for DC5, DF6(l5) (hold bottle
stably) for DC6, DF7(16) (attract user visualIy) for DC7.
Once the function tree is created for the current design, the cast and risk analysis
matrix 0 (CRAM 0) needs ta be built ta give a more systematic description. CRAM 0
comprises two major parts, and in each part, cast and risk of design functions are
elaborated separately for the current design.
By studying the information from history, market, and benchmarking, the target unit
cast for one glass bottle is given as $8.00. With the formulae given in Section 2.4.1, the
unit cast is allocated ta every function and planned cast of each design function is
determined. Then, the ratios of actual cast of functions ta planned cast of functions are
calculated. AlI the information and data are organized in seven columns for DC, d, DF, f,
planned cast of DF (PC), actual cast of DF (AC), actual cast 1 planned cast (V).
69

Table 3.2 Cost and Risk Analysis Matrix 0
~i~"'" "" .... , CC" "W"'"""""·"~V' on """,~, ... ,···c··.,,~v,,~··, "_',,"'w""""'" """,,., ......... , ·"w,"""~, 'v'cu'"""c "v",~""v· .. ", .... · "",,".,~
'Cu.rre.ntJ1!lsi gn.: §J~S'SJlottl!l .::?':J1il5Ï9,!Çh ilra ct!l~~st.i.cs:-F.I,I.'!t:lio,!s:.Cllst an~. RJ~~.!!.~IYS!!i Unit .Cost (TCO) . $8.00
70

From the data in column (V), it is seen that for DF 49, DF 4(10) and DF 4(11), they have higher
values of V: 2.75, 1.84, 1.53, which are much more than 1. Contrarily, for DF27, DF4(12),
DFs(13), DFs(14), DF6(lS), DF7(16), V is equal to 0.54, 0.15, 0.73, 0.51, 0.59, 0.31
respectively, which are much less than 1. The ratios more or less than 1 mean that the
difference exists between planned cost of DF and actual cost of DF. In other words, the
opportunities for cost improvement exist for their related design functions and design
characteristics, which can be easily figured out from the relative columns on the left. The
higher the value of V, the larger the chance for improvement is. Thus, in the cost analysis
part, the comparison of the actual cost with planned cost of each function clearly
indicates potential areas of improvement.
In another part of the matrix, design uncertainties are first considered and defined as
three risk attributes (RA), which are cost (RAI), technique (RA2), and market (RA3).
Corresponding to every risk attribute, the value of relative weight of importance of RA
(Ra) is decided. Next, in order to give the risk assessment level (P) for every function, the
definition of success and failure are given for every risk attribute. Besides, sorne
questions are asked and answered to help get the value of P. For example, for RAI, cost,
the definition of success is that planned cost is high enough to achieve the function,
which can definitely satisfy the customer requirement weIl. In this case, it is defined that
the function can easily satisfy the risk attribute (co st) successfully; then, P is equal to 1 or
100%. On the other hand, the definition offailure is such that after spending extra money,
which is more than 50 percent of planned cost, the design function cannot be achieved
and P is O. Then, the questions are asked: how much money will it cost to perform the
design function? how well has the required function been performed? or what is the
71

chance of success for the function to be achieved? Take DF49 (avoid breakage and
spoilage) as an example. The planed cost is $0.65 and the actual cost is $1.80, which
means extra money, more than 50 percent of planed cost, is consumed to avoid the body
being broken and damaged. However, because the internaI body of the bottle is made of
glass, breakage cannot be absolutely avoided and the chance for the current design to
keep it unbreakable is 0.30 or 30%. In other words, the risk assessment level for DF49 to
satisfy the RAI (cost) is 0.30 for the CUITent design.
As above, after analyzing the chance of success for every function to satisfy each risk
attribute, the risk assessment level of every design function (P) is determined. Then, by
using the formulae described in Section 2.4.1, the risk assessment level for every function
(FP) and the risk assessment level for every design characteristics (DP) to satisfy aIl risk
attributes are computed in sequence. FinaIly, the risk assessment level for aIl design
characteristics (DPt) to satisfy aIl risk attributes is summed, which also gives the average
chance of success for the current design to satisfy the given risk attributes. For the glass
bottle, the risk assessment level for aIl DCs is 0.602.
By observing the data given in the risk analysis part in CRAM 0, it is found that DF49,
DF4(IO), DF4(1l), DF4(12), DFs(14), DF6(IS), DF7(16) have a lower chance ofsuccess, which are
recognized as the areas needing more attention.
Based on cost and risk analysis in CRAM 0, the design functions showing the larger
difference between planned cost and actual cost, and/or having the lower risk assessment
level, are identified and defined as the areas for improvement. Potential problems are
determined and conclusions can be made for the current design. In summary, a new
alternative body material should be found, which should be stronger and more
72

unbreakable, have better ability for special temperature and pressure, be light weight,
have good insulation, and be easily cleaned. AlI of the above functions must be achieved
at a reasonable cost. In addition, it is indicated that more attention should be paid to the
mouth, handle, base and exterior, and more money should be spent to make the necessary
improvements and assure the requisite quality. What's more, effort should be made to
increase the chance of success for mouth, body, handle, base, and exterior to achieve the
required functions when three risk attributes are considered.
3.3 Cost and Risk Analysis Matrix 1 and Cost and Risk Analysis Matrix 2 - New Designs
In the creativity phase of the value engineering process, a wide variety of ideas is
brought out. By gathering and grading all the ideas, two solutions are chosen.
For solution 1, lightweight stainless steel is used as the bottle body material. The steel
bottle is comprised of a mug top made of stainless steel and plastic, plastic stopper,
stainless steel bottle body (interior wall, exterior wall and vacuum insulation layer), a
handle made of plastic and steel, and a steel base.
For solution 2, plastic becomes the bottle body material. What's more, instead of the
vacuum insulation layer used in the original design, a new composite material is added
between the interior wall and the exterior wall of the body as the insulation layer. The
plastic bottle consists of a plastic mug top, a plastic stopper, a plastic bottle body (plastic
interior wall, plastic exterior wall and composite insulation layer), a plastic handle, and a
plastic base.
When constructing the matrices for these two solutions, a detailed market survey and
careful research of historical data are crucial for a good analysis. As shown in the
matrices for each solution, the design characteristics, design functions, and risk attributes
73

are given. The data are inputted for d, f, target unit cost, Ra, P. The processes for cost and
risk analysis at the function level are almost the same as the one explained in Section 3.2.
PC, FP, DP, and DPt are calculated. New areas for improvement are indicated.
Solution 1 has merit, almost satisfying all of the requirements. Its main attraction is
that the new bottle body material, stainless steel, is rugged, rustproof and unbreakable. In
addition, the desired insulation level for the vacuum layer can be achieved, and the new
model improves the design for sorne design characteristics, i.e., mouth, base and exterior
color. To a great extent, the related design functions can be accomplished by the planned
cost. But for the handle, although it has convenient features with a folding plastic handle
grip and the steel linkage with steel bottle body, the risk assessment level for the function
(DF5(14)) is somewhat lower at 0.615. This me ans that there is an opportunity for
improvement here. Another shortcoming is that since steel can transfer heat, and since the
exterior and interior walls are made of a whole piece of steel, there is a heat bridge
between the two walls. Practically, this is hard to avoid. Fortunately, the connection part.
is thin and the heat transfer is small. It is acceptable. This is why in cost and risk analysis
matrix 1, for DF4(12), keep hot or cold, the risk assessment level P4(l2)3 (for market) has a
higher value (0.7) than the risk assessment level P4(12)2 (for technique) which is 0.6. After
calculation, the total risk assessment level for aIl design characteristics for solution 1 is
0.796.
Unlike solution 1, the plastic bottle design in solution 2 looks quite similar to the
glass bottle in the current design except that the material and structure of bottle body are
different from each other. Solution 2 makes sorne improvement on the design for the
parts, i.e., mouth, handle, base and exterior color. Instead of using steel in solution 1,
74

Table 3.3 Cost and Risk Analysis Matrix 1
Solution 1: Stainless Steel Bottle --> Design Characteristics - Functions: Cost and Risk Analysis Target Unit Cost (TC1): $11.00
Stop inlerior contents Allow mouth open or close
Keep hot or cold Contain contents
75

Table 3.4 Cost and Risk Analysis Matrix 2
Solution 2: Plastic Bottle --> Design Characteristics - Functions: Cost and Risk Analysis Target Unit Cost (TC2): $7.00
76

plastic is used, which is appealing for color and texture. However, because composite
insulation materials are needed to fiU the space between the plastic exterior and interior
waUs, there are sorne constraints on the shape of the bottle mouth. For manufacturability,
it is hard to make the mouth with a flexible shape and its thickness has to be bigger,
which is disadvantageous for good fluid flow, and this will cause spillage sometimes. In
addition, the composite material has to satisfy the requirements for use with high
temperature and high pressure, and it has to be light. This type of material is expensive.
But in this example, the planned cost is required in the low to medium range. In addition,
even the lightest insulation material is heavier than a vacuum layer. As mentioned above,
aU the information is shown in the matrix. The total risk assessment level for aU design
characteristics is computed as 0.667 for solution 2.
3.4 Integrated Evaluation Matrix
In the integrated evaluation matrix, aU the customer requirements are input as the
criteria for evaluation. U sing a ranking procedure, the current design and two solutions
are ranked on how well they meet the criteria or satisfy customer requirements. A ranking
scale from 1 to 9 is used and the customer satisfaction rank values (M) are inputted. The
higher the value, the better the customer requirements are satisfied. The total customer
satisfaction values (Mt) are 6.33, 8.14, and 7.04 respectively for the current design,
solution 1 and solution 2. It is seen that compared with the glass and plastic bottles, the
steel bottle satisfies customers best.
Next, more financial information is gathered. The average amount of sales for glass
bottles per year is given as 200,000. Then, if the predicted sales per year for steel and
plastic bottles are linear with customer satisfaction value, the sales are calculated:
77

for solution 1: 8.14 S2 6.33 200000 '
for solution 2: 7.04 S3 -- = 6.33 200000
Thus, the average sales per year for steel and plastic bottles are determined as follows:
S2 = 257188 (for steel bottles), S3 = 222433 (for plastic bottles).
The unit cost and sales price for the different designs are:
UCO = $8.61, UCI= $11.00, UC2 = $7.00
PriceO = $11.00, Price) = $14.50, Price2 = $9.00.
Then, the ratio of the bene fit to the cost is calculated for the designs and the results are
shown in the matrix as:
BO/UCO = 1.28, B)/UCI =1.32, B2/UC2 = 1.29
Combined with the total risk assessment levels which are determined from cost and risk
analysis matrices,
DPtO = 0.602, DPtl = 0.796, DPt2 = 0.667,
The integrated evaluation index with consideration of cost and risk (NV) is calculated for
the designs:
NVO = 1.28 * 0.602 = 0.77,
NV I = 1.32 * 0.796 = 1.05,
NV2 = 1.29 * 0.667 = 0.86
Compared to the original design and solution 2, solution 1 not only has the highest
customer satisfaction value, but also it is ranked best when cost and risk factors are
considered on the company side. Therefore, solution 1 is regarded as the best idea, and
will be given further development in the next phase.
78

Table 3.5 Integrated Evaluation Matrix
Solutions --> Customer Satisfaction Value + Integrated Evaluation Index ir-------------~R~a-n~k~V~a~lu-e-1--9~,~9~=~h~ig~h---------------,
Customer Requirement
(CR)
Relative Weight of
Importance of CR (C)
Good insulation to keep hot or cool 0.35
Durability (unbreakable) 0.15
Easy to fil! and serve 0.1
Easy to open and close 0.09
Comfortable handle 0.08
Stable base 0.08
Does not spill 0.06
Nice look (appearance) 0.05
Easy to clean 0.04
Total Customer Satisfaction Value for Different Design
Average Sale Per Year (S) (units)
Unit Cost (UC) ($/unit)
Total Cost of Product Units Per Year (Ct) /'!;/\I.,<:>r\
Sale Priee Per Unit (Priee) ($/unit)
Current Design
Glass Sottie
7
2
6
7
8
8
8
7
6
200000
$8.61
1,722,000
$11.00
79
Solution 1
Stainless Steel Sottie
8
9
8
9
9
8
8
8.14
257188
$11.00
$14.50
Solution 2
Plastic Sottie
6
6
8
9
8
8
7
9
7
7.04
222433
$7.00
,557,030
$9.00

Table 3.6 Development Matrix
r~ëst$olïïtion: U!liiC~!rt::~ëustomer$lItjSfaëïitl~?E~lïïatjtln Inde x?· ..•..
80

3.5 Development Matrix and Diagram
As the most beneficial idea, solution 1 deserves further scrutiny. The study starts
from the unit cost of the steel bottle. Given different unit cost, the planned cost for every
design function is calculated. Compared to the original design (glass bottle) and the steel
bottles with different unit cost, the customer satisfaction value for every function is
inputted and the total customer satisfaction value is calculated. Similarly, the risk
analyses for different bottles with different unit costs are performed at the level of design
functions based on the three given risk attributes (cost, technique and market). The
approaches described in Section 2.6, Section 2.4, and Section 3.3 are used and the
process will not be presented here in detail. Finally, the total risk assessment levels are
inputted and the integrated evaluation indexes are calculated as described before.
In summary, the data for unit cost, customer satisfaction value, and integrated
evaluation index are gathered in the Table 3.7, and the values are used to build Figure 3.2,
in which the unit cost to customer satisfaction relationships and the unit cost to evaluation
index relationships are shown. For the unit cost vs. customer satisfaction curve (pink), the
design with unit cost $13.00 has the highest customer satisfaction value. Whereas
according to the unit cost vs. evaluation index curve (dark blue), the design with unit cost
$11.50 maximizes the evaluation index, which means the best integrated value for
consideration of cost and risk. Likewise, if the junction point of two curves is taken, the
unit cost is about $12.30, which infers best combination of customer satisfaction,
financial consideration and chance of success.
81

Table 3.7 Unit Cost versus Customer Satisfaction Value and Evaluation Index
Unit Cost vs. Customer Satisfaction Value and Integrated Evaluation Index
9.20 1.20
Q) 9.00 1.00 x ::J
ca Q)
8.80 ""0 > c::
c:: 0.80 c: ---Customer 0 0 :;:; 8.60 :a Satisfaction Value 0
$ ::J (Mt) (/) 8.40 0.60 ca :;:; > CIl W ---+- Integrated Cf)
8.20 ""0 Evaluation Index .... Q) Q) 0.40 "ê (NV) E 0 8.00 Cl ..... Q) (/)
0.20 .....
::J c:: ü 7.80
7.60 0.00
a a a a a a a a a a N Ln 00 a M Ln t- a ...... ,.....; ,.....; ,.....; N N N N M ...... ...... ...... ...... ...... ...... ...... ...... ...... ~ ~ ~ ~ ~ ~ ~ ~ ~
Unit Cost ($)
Figure 3.2 Unit Cost versus Customer Satisfaction and Evaluation Index Diagram
82

4.1 Conclusion
CHAPTER4
CONCLUSION AND FUTURE WORK
The model developed in this thesis incorporates the methodologies of value
engineering and risk analysis within the QFD process. In addition, quantitative
parameters are defined and deployed into matrices to establish the weight of importance
of CR, DC, DF, RA, the relationships between CR and DC, cost related information, risk
assessment level, customer satisfaction value, evaluation index, etc. The merging of these
techniques makes the QFD process more robust and more quantitatively oriented.
The HOQ matrix not only demonstrates hierarchical customer requirements and their
relationships with design characteristics, but also, it prioritizes the design characteristics
and presents the evaluation of the product at the level of design characteristics. Secondly,
the function tree allows product decomposition into design functions. Basic functions and
secondary functions are identified. Actual cost is given for every function. In the next
matrix, cost and risk analysis matrix 0 (CRAM 0), the target unit cost is first set for the
CUITent model. Cost and risk are analyzed at the design function level. Actual to planned
cost ratios and risk assessment levels are separately compared based on the different
criteria for design functions. Meanwhile, the total risk assessment level for aIl design
characteristics is calculated for the current design based on all given risk attributes. Then,
the areas with opportunities for improvement are determined and feasible solutions are
created.
83

Similarly, cost and risk analysis matrix 1, cost and risk analysis matrix 2, ... , cost and
risk analysis matrix n are built for solution 1, solution 2, ... , solution n, in which the
detailed cost and risk analysis are made respectively for every solution. The total risk
assessment levels for all design characteristics are calculated for different solutions based
on the same risk attributes given in CRAM O. Furthermore, in order to make comparisons
between the CUITent design and proposed solutions, necessary cost and risk related
information are organized in the integrated evaluation matrix. Customer satisfaction and
the integrated evaluation index with consideration of cost and risk are used as criteria by
which the CUITent design and proposed solutions are evaluated and the best solution is
determined. The development matrix is constructed for the best solution. Given different
unit costs for the best solution, cost and risk analysis are deployed at the level of design
functions. Then, customer satisfaction and the integrated evaluation index are determined.
Unit cost to customer satisfaction relationships and unit cost to integrated evaluation
index relationships are show in the unit cost versus customer satisfaction and evaluation
index diagram. The best solution with reasonable target unit cost is the one which can
obtain the best balance between customer and enterprise satisfaction with consideration
of financial factors and design uncertainties.
In this model, all the matrices are deployed in a hierarchical manner. The product is
decomposed into design functions, based on which detailed cost and risk analysis are
made for the current design and solutions. It makes the whole process traceable from
customer requirements with strong market focus to design functions and to the actual
solutions, which are design oriented. In addition, with the intention of achieving the best
balance between the external (customer) and the internaI (company) satisfaction,
84

customer satisfaction value (Mt) and integrated evaluation index (NV) are defined and
calculated. An example of the evaluation procedure for different designs and their (Mt,
NV) relationships with the target unit cost for the best solution demonstrates the
capability of the model.
As stated in Chapter 1, the objectives ofthis thesis are:
• to develop a quantitative QFD model integrated with the methodologies of value
engineering and risk analysis, which considers not only the customer satisfaction,
but also the enterprise satisfaction by making detailed cost and risk analysis for
the design
• to introduce the new concepts of customer satisfaction value and an integrated
evaluation index to assist in making a decision
• to propose a method for companies to determine a realistic target unit cost for a
design in order to obtain the best balance between customer and enterprise
satisfaction with consideration of financial factors and design uncertainties.
By integrating the methodologies of value engineering and risk analysis with QFD, a
quantitative QFD method is presented in this thesis. Within the developed quantitative
QFD model, detailed cost and risk analyses incorporate the evaluation of how well
customer requirements are satisfied. During this process, the parameters, i.e., an
integrated evaluation index (NV) and customer satisfaction value (Mt), are defined and
determined to direct the design in order to attain the appropriate balance between
customer and enterprise satisfaction. So, the first two objectives are fulfilled.
During the development process for the proposed design, given different unit cost
(UC) for the product, the values of Mt and NV are determined and their relations with
85

DC are discussed. By observing the unit cost versus costumer satisfaction and evaluation
index diagram and analyzing the related data, companies are able to decide the realistic
unit cost for the preferred design under the criteria of achieving weIl balanced customer
and company satisfaction with consideration of customer requirements, financial factors,
and design uncertainties. Thus, the third objective is achieved. An example was presented
in the thesis to demonstrate the effectiveness of the method.
Due to limited time and space, it is impossible to organize a large number of cases for
varied products and elaborate on the analyses in just one thesis, but the one example
demonstrated the concepts which would be the same for other examples. The hierarchical
organization of the matrices in the method malœs ca1culations easier, and the decision
process faster. With the implementation of this integrated quantitative QFD method,
more knowledge will be acquired and more experience accumulated quicker.
4.2 Constraints and Future Work
In the model developed in this thesis, both the correlation between design
characteristics and the interactions of the design functions are ignored. This is reasonable
for a simple product, but for a complex product composed of a large number of various
components, one item might relate to several different items, and there may be sorne
correlation. So, new methods or matrices should be developed to take this type of
correlation into consideration. Moreover, with increasing product complexity, many more
variables are involved and the matrices become bigger. Calculations could become
burdensome. Thus, simplification of the process should be do ne by combining variables,
developing sub-matrices, and so on.
86

In the quantitative QFD model, function analysis and classification are made for the
group of design functions that is related to the same design characteristic, i.e., every
design characteristic can de li ver at least the basis function demanded by users. In other
words, every design characteristic is independent of each other, and all related parts are
needed for the existence of the product desired by customers. Of course, this model .
allows the combination and/or elimination of the secondary functions in order to lower
cost. However, for the case where companies would like to combine parts in order to
reduce the overall cost, the method needs to be improved so that the function
classification can be made for the design functions related to the different design
characteristics (or parts) for the same product.
Lastly, standardization of risk analysis for similar products might help decision
makers monitor the pro cess more efficiently, perform benchmarking more easily, and
make product improvement faster. Effort should be addressed to the definitions of risk
attributes and risk assessment parameters, proper scales for comparison, and so on.
87

(BIUC) j:
Dt:
APPENDIX: PARAME TER DEFINITION
the actual cost required to achieve DFjk.
total actual cost required to achieve aIl the DFs.
benefits obtained from making one unit of the product by the company
when using current design or /h solution.
the ratio of benefit per unit to cost per unit for current design or /h solution.
·ili . 1 customer reqmrement.
/11
relative weight of importance of the ith CR, ICi = 1. i=1
total cost of product units per year for current design or the jth solution.
/h design characteristic.
weight of importance of /h DC.
the sum of the total weight of importance of aIl design characteristics.
Il
relative weight of importance of /h DC, and Id. = 1 . .1
j=1
kth design function which is related with lh design characteristic (DCj ), and
it is from the deepest level design functions on the function Tree, which is
then reordered and arranged in sequence in cost and risk analysis matrices.
DPj : the risk assessment level for /h design characteristic DCj to satisfy aIl the
risk attributes, which is based on the average probability of success for
DCj to fulfiIl aIl the risk attributes.
DPt: the total risk assessment level for aIl design characteristics, which is aiso
the average risk assessment level for aIl design functions.
88

x
relative weight of importance ofDF jk, If"k = 1,i = 1,2, ... ,n k=1 .1
the risk assessment level for jkth design function DFjk to satisfy aIl the risk
attributes, which is based on the average probability of success for DF jk to
fulfiIl aIl the risk attributes.
customer satisfaction rank value 1-9, (9=High), which indicates how weIl
the product made by using current design or the lh solution satisfies the ith
customer requirement CRi, the higher the value of Mij is, the better the
customer requirements are satisfied.
total customer satisfaction value for current design or each solution, which
means totaIly how weIl the product made by using current design or the jth
solution satisfies aIl the customer requirements.
NVj : integrated evaluation index with consideration of cost and risk for current
design or lh solution. The solution with higher value of NV is a more
beneficial one which can meet the integrated criteria of cost and risk better.
PCjk: the planned cost required to achieve DFjk.
Pjki : the risk assessment level for jkth design function DF jk to satisfy the ith risk
attribute RAi, which is based on the probability of success for DF jk to
fulfiIl RAi. The higher the Pjki is, the more probably the jkth design
function will fulfiIl the ith risk attribute successfuIly, which means the
better the result is for the chance of accomplishment. 0::; Pjki ::; 100% .
actual sale price per unit for CUITent design or target sale priee per unit for
lh solution.
89
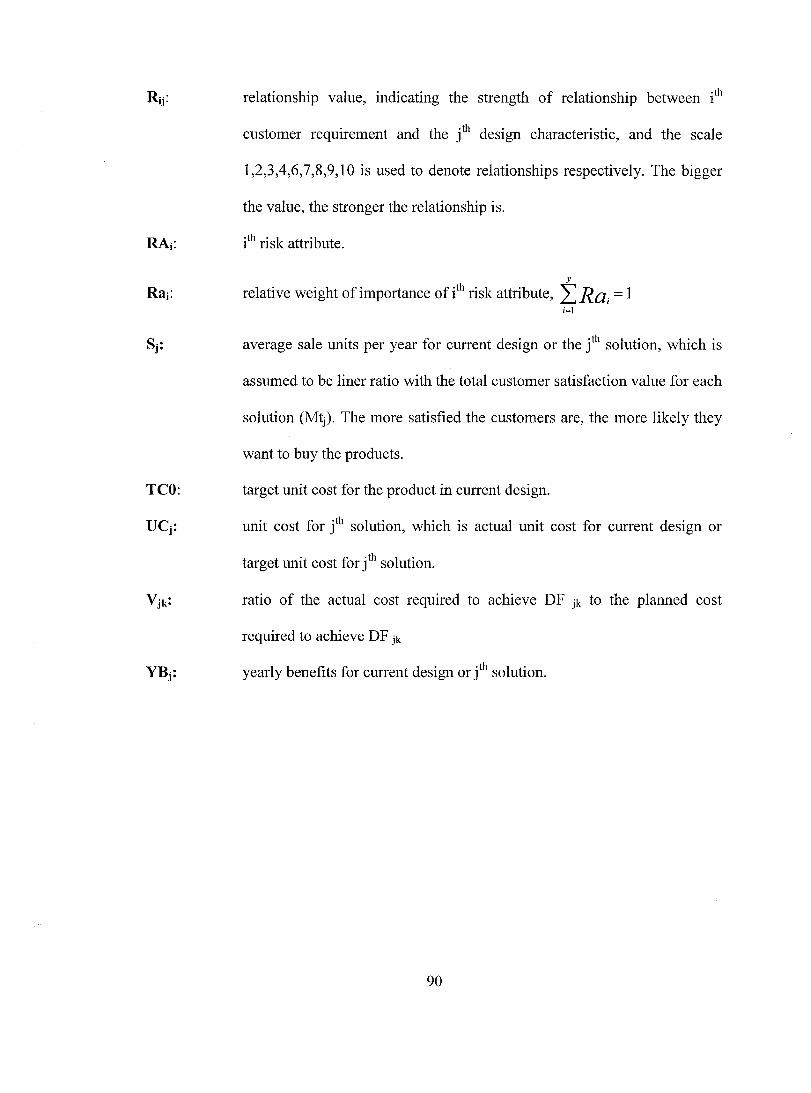
relationship value, indicating the strength of relationship between ith
customer requirement and the /h design characteristic, and the scale
1,2,3,4,6,7,8,9,10 is used to denote relationships respectively. The bigger
the value, the stronger the relationship is.
RAi: ith risk attribute.
y
Rai: relative weight of importance ofith risk attribute, IRa = 1 ;;\
average sale units per year for CUITent design or the /h solution, which is
assumed to be liner ratio with the total customer satisfaction value for each
solution (Mtj). The more satisfied the customers are, the more likely they
want to buy the products.
TCO: target unit cost for the product in current design.
uq: unit cost for /h solution, which is actual unit cost for CUITent design or
target unit cost for /h solution.
ratio of the actual cost required to achieve DF jk to the planned cost
required to achieve DF jk
YBj: yearly benefits for current design or /h solution.
90

REFERENCES
1. Biren Pras ad, 2000, A Concurrent Function Deployment Technique For A
Workgroup-Based Engineering Design Process, Journal of Engineering Design,
Vol. Il, No. 2, 103-119.
2. Del L. Younker, 2003, Value Engineering - Analysis and Methodology (Marcel
Dekker, Inc.).
3. Fiorenzo Franceschini, 2003, Advanced Quality Function Deployment (St. Lucie
Press).
4. Hajime Yamashina, Takaaki Ito and Hiroshi Kawada, 2002, Innovative Product
Development Process By Integrating QFD and Triz, International Journal of
Production Research, Vol. 4, No. 5, 1031-1050.
5. Ivy F. Hooks & Kristin A. Farry, 2001, Customer-Centered Products - Creating
Successful Products through Smart Requirements Management (American
Management Association).
6. Jack B. Revelle, John W. Moran, Charles A. Cox, 1998, The QFD Handbook
(John Wiley & Sons, Inc.).
7. Jiafu Tang, Richard YK. Fung, Baodong Xu, Dingwei Wang, 2001, A New
Approach To Quality Function Deployment Planning With Financial
Consideration, Computers & Operations Research, 29, 1447-1463.
8. John Terninko, 1997, Step-by-Step QFD Customer-Driven Product Design (St.
Lucie Press).
91

9. John X. Wang, Marvin L. Roush, 2000, What Every Engineer Should Know About
Risk Engineering and Management (Marcel Dekker, Inc.).
10. Lou Cohen, 1995, Quality Function Deployment - How to Make QFD Work for
You (Addison-Wesley).
11. L.P. Sullivan, 1986, Quality Function Deployment, A System to Assure that
Customer Needs Drive the Product Design and Production Process, Quality
Progress, June, 39-50.
12. Lucie Parrot, 2002, Value Engineering Workshop, SAVE International, Mcgill
University.
13. L. V. Vanegas, A. W. Labib, 2001, A Fuzzy Quality Function Deployment (FQFD)
Model For Deriving Optimum Targets, International Journal of Production
Research, Vol. 39, No. 1,99-120.
14. M. Modarres, 1993, What Every Engineer Should Know About Reliability and
Risk Analysis (Marcel Dekker, Inc.).
15. Min Xie, Kay-Chuan Tan, 2003, Thong Ngee Goh: Advanc.:ed QFD Applications
(ASQ Quality Press).
16. Peter C. Young, Steven C. Tippins, 2001, Managing Business Risk, an
Organization-Wide Approach to Risk Management (American Management
Association).
17. Ralph L. Kliem, Irwin S. Ludin, 1997, Reducing Project Risk (Gower Publishing
Limited).
18. Robin Cooper, Regine Slagmulder, 1997, Target Costing and Value Engineering
(Productivity Press).
92

19. Richard J. Park, PE, CVS, FSAVE, 1999, Value Engineering - A Plan for
Invention (St. Lucie Press).
20. R. Y. K. Fung, 1. Tang, Y. Tu and D. Wang, 2002, Product Design Resources
Optimization Using A Non-Linear Fuzzy Quality Function Deployment Model,
International Journal of Production Research, Vol. 4, No. 3,585-599.
21. So Young Sohn, In Su Choi, 2001, Fuzzy QFD For Supply Chain Management
With Reliability Consideration, Reliability Engineering and System Safety, 72,
327-334.
22. Tim Bedford, Roger Cooke, 2001, Probabilistic Risk Analysis Foundations and
Methods (Cambridge University Press).
23. Vivianne Bouchereau, Hefin Rowlands, 2000, Methods And Techniques To Help
Quality Function Deployment (QFD), Benchmarking, Volume 7, 8-19.
24. Yanjun Wang, Harry H. West, Tom L. Teague, Najmul Hasan, and M. Sam
Mannan, 2003, Correlation Of Quantitative Risk Results For High Hazard
Processes, Risk Analysis, Vol. 23, No. 5,937-943.
93