A Promise of Equity: Designing a Debt-Free Higher ...
18
March 21, 2019 A Promise of Equity: Designing a Debt-Free Higher Education Program That Works for Everyone EXECUTIVE SUMMARY College affordability has reached crisis levels across the country. Years of state budget cuts to higher education have led to higher tuition and fees, and mounting student debt—all while the students have become increasingly economically and racially diverse. In Massachusetts, per-student state funding for public higher education fell 32 percent from Fiscal Year (FY) 2001 through FY 2018. Large increases in tuition and fees ensued, as did the debt burden that students and their families had to bear in order to afford these costs. Over the past several years, a number of cities and states have responded to the college affordability crisis by creating tuition-free or debt-free higher education programs, known as “Promise” programs. The “promise” is the elimination—or at least reduction—of cost barriers for students accepted to college. In reality, Promise programs have been designed with various restrictions on which students and institutions are eligible, what costs are covered, and more. This paper discusses the key design elements of a Promise program, and offers lessons for Massachusetts as it considers a number of proposals to make college tuition-and-fee-free or debt-free. Based on a review of the relevant literature, including case studies of existing Promise programs and data on college and university students in Massachusetts, this paper offers an equity analysis of the different design elements of a Promise program. That is, how do choices made about each element affect access and affordability for students from less wealthy families, students of color, and immigrant students? Laws and practices forbidding Black people from getting an education and learning to read were widespread during the era of slavery. Legal segregation prevailed from Emancipation through the Supreme Court’s 1954 Brown v. Board of Education decision and the Civil Rights Act of 1964, which prohibited the most egregious forms of state-sanctioned segregation. Even so, access to higher education has continued to depend in large part on factors marked by racial inequalities. One is access to high-quality and well-funded early, elementary, and secondary education. Another is wealth. Both factors are interrelated, and are related to legacies of segregation in housing and labor markets. While a debt-free higher education program is not a silver bullet, it could open up significant opportunities for less wealthy students, students of color, and immigrant students who would go to college if it were less expensive. Whether a debt-free higher education program actually succeeds in doing so depends on how it is designed. The following table offers a brief equity analysis for each of 10 design elements.
Transcript of A Promise of Equity: Designing a Debt-Free Higher ...
March 21, 2019
A Promise of Equity: Designing a Debt-Free Higher
Education Program That Works for Everyone
EXECUTIVE SUMMARY
College affordability has reached crisis levels across the country. Years of state budget cuts to higher education have led to higher tuition and fees, and mounting student debt—all while the students have become increasingly economically and racially diverse. In Massachusetts, per-student state funding for public higher education fell 32 percent from Fiscal Year (FY) 2001 through FY 2018. Large increases in tuition and fees ensued, as did the debt burden that students and their families had to bear in order to afford these costs.
Over the past several years, a number of cities and states have responded to the college affordability crisis by creating tuition-free or debt-free higher education programs, known as “Promise” programs. The “promise” is the elimination—or at least reduction—of cost barriers for students accepted to college. In reality, Promise programs have been designed with various restrictions on which students and institutions are eligible, what costs are covered, and more. This paper discusses the key design elements of a Promise program, and offers lessons for Massachusetts as it considers a number of proposals to make college tuition-and-fee-free or debt-free.
Based on a review of the relevant literature, including case studies of existing Promise programs and data on college and university students in Massachusetts, this paper offers an equity analysis of the different design elements of a Promise program. That is, how do choices made about each element affect access and affordability for students from less wealthy families, students of color, and immigrant students?
Laws and practices forbidding Black people from getting an education and learning to read were widespread during the era of slavery. Legal segregation prevailed from Emancipation through the Supreme Court’s 1954 Brown v. Board of Education decision and the Civil Rights Act of 1964, which prohibited the most egregious forms of state-sanctioned segregation. Even so, access to higher education has continued to depend in large part on factors marked by racial inequalities. One is access to high-quality and well-funded early, elementary, and secondary education. Another is wealth. Both factors are interrelated, and are related to legacies of segregation in housing and labor markets.
While a debt-free higher education program is not a silver bullet, it could open up significant opportunities for less wealthy students, students of color, and immigrant students who would go to college if it were less expensive. Whether a debt-free higher education program actually succeeds in doing so depends on how it is designed. The following table offers a brief equity analysis for each of 10 design elements.
MASSACHUSETTS BUDGET AND POLICY CENTER • WWW.MASSBUDGET.ORG ii
A PROMISE OF EQUITY EXECUTIVE SUMMARY
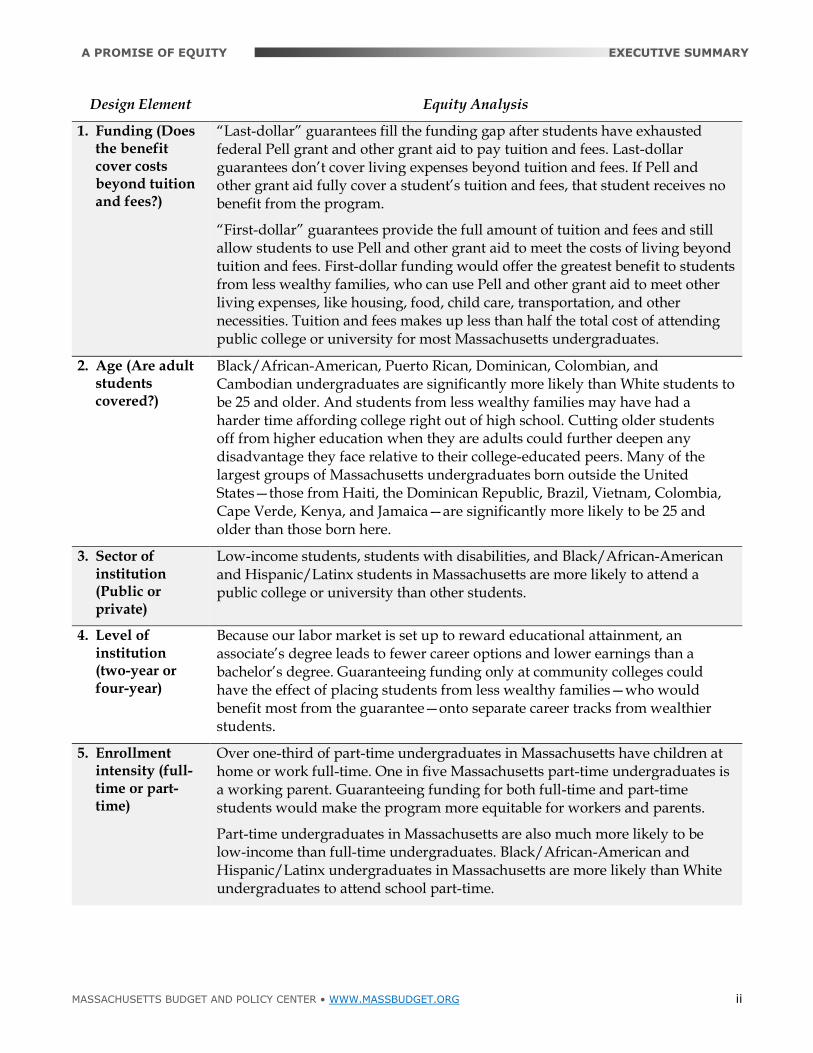
Design Element Equity Analysis
1. Funding (Does the benefit cover costs beyond tuition and fees?)
“Last-dollar” guarantees fill the funding gap after students have exhausted federal Pell grant and other grant aid to pay tuition and fees. Last-dollar guarantees don’t cover living expenses beyond tuition and fees. If Pell and other grant aid fully cover a student’s tuition and fees, that student receives no benefit from the program.
“First-dollar” guarantees provide the full amount of tuition and fees and still allow students to use Pell and other grant aid to meet the costs of living beyond tuition and fees. First-dollar funding would offer the greatest benefit to students from less wealthy families, who can use Pell and other grant aid to meet other living expenses, like housing, food, child care, transportation, and other necessities. Tuition and fees makes up less than half the total cost of attending public college or university for most Massachusetts undergraduates.
2. Age (Are adult students covered?)
Black/African-American, Puerto Rican, Dominican, Colombian, and Cambodian undergraduates are significantly more likely than White students to be 25 and older. And students from less wealthy families may have had a harder time affording college right out of high school. Cutting older students off from higher education when they are adults could further deepen any disadvantage they face relative to their college-educated peers. Many of the largest groups of Massachusetts undergraduates born outside the United States—those from Haiti, the Dominican Republic, Brazil, Vietnam, Colombia, Cape Verde, Kenya, and Jamaica—are significantly more likely to be 25 and older than those born here.
3. Sector of institution (Public or private)
Low-income students, students with disabilities, and Black/African-American and Hispanic/Latinx students in Massachusetts are more likely to attend a public college or university than other students.
4. Level of institution (two-year or four-year)
Because our labor market is set up to reward educational attainment, an associate’s degree leads to fewer career options and lower earnings than a bachelor’s degree. Guaranteeing funding only at community colleges could have the effect of placing students from less wealthy families—who would benefit most from the guarantee—onto separate career tracks from wealthier students.
5. Enrollment intensity (full-time or part-time)
Over one-third of part-time undergraduates in Massachusetts have children at home or work full-time. One in five Massachusetts part-time undergraduates is a working parent. Guaranteeing funding for both full-time and part-time students would make the program more equitable for workers and parents.
Part-time undergraduates in Massachusetts are also much more likely to be low-income than full-time undergraduates. Black/African-American and Hispanic/Latinx undergraduates in Massachusetts are more likely than White undergraduates to attend school part-time.
MASSACHUSETTS BUDGET AND POLICY CENTER • WWW.MASSBUDGET.ORG iii
A PROMISE OF EQUITY EXECUTIVE SUMMARY
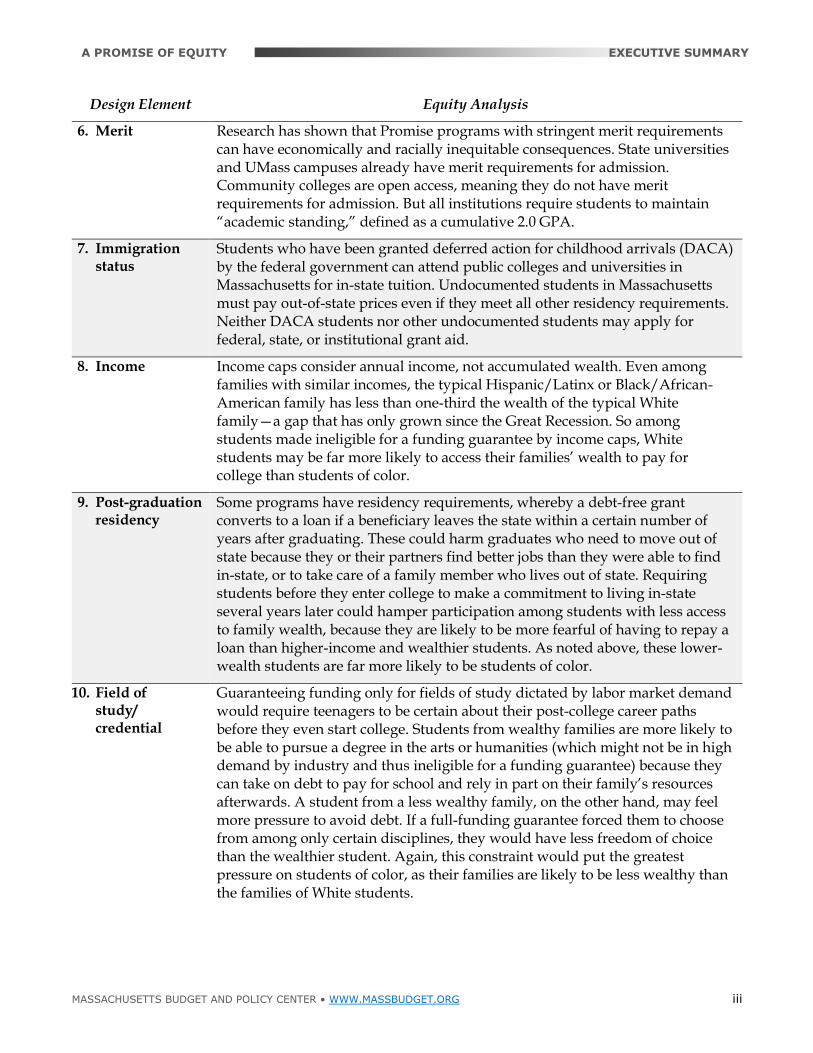
Design Element Equity Analysis
6. Merit Research has shown that Promise programs with stringent merit requirements can have economically and racially inequitable consequences. State universities and UMass campuses already have merit requirements for admission. Community colleges are open access, meaning they do not have merit requirements for admission. But all institutions require students to maintain “academic standing,” defined as a cumulative 2.0 GPA.
7. Immigration status
Students who have been granted deferred action for childhood arrivals (DACA) by the federal government can attend public colleges and universities in Massachusetts for in-state tuition. Undocumented students in Massachusetts must pay out-of-state prices even if they meet all other residency requirements. Neither DACA students nor other undocumented students may apply for federal, state, or institutional grant aid.
8. Income Income caps consider annual income, not accumulated wealth. Even among families with similar incomes, the typical Hispanic/Latinx or Black/African-American family has less than one-third the wealth of the typical White family—a gap that has only grown since the Great Recession. So among students made ineligible for a funding guarantee by income caps, White students may be far more likely to access their families’ wealth to pay for college than students of color.
9. Post-graduation residency
Some programs have residency requirements, whereby a debt-free grant converts to a loan if a beneficiary leaves the state within a certain number of years after graduating. These could harm graduates who need to move out of state because they or their partners find better jobs than they were able to find in-state, or to take care of a family member who lives out of state. Requiring students before they enter college to make a commitment to living in-state several years later could hamper participation among students with less access to family wealth, because they are likely to be more fearful of having to repay a loan than higher-income and wealthier students. As noted above, these lower-wealth students are far more likely to be students of color.
10. Field of study/ credential
Guaranteeing funding only for fields of study dictated by labor market demand would require teenagers to be certain about their post-college career paths before they even start college. Students from wealthy families are more likely to be able to pursue a degree in the arts or humanities (which might not be in high demand by industry and thus ineligible for a funding guarantee) because they can take on debt to pay for school and rely in part on their family’s resources afterwards. A student from a less wealthy family, on the other hand, may feel more pressure to avoid debt. If a full-funding guarantee forced them to choose from among only certain disciplines, they would have less freedom of choice than the wealthier student. Again, this constraint would put the greatest pressure on students of color, as their families are likely to be less wealthy than the families of White students.
MASSACHUSETTS BUDGET AND POLICY CENTER • WWW.MASSBUDGET.ORG 1
March 21, 2019
A Promise of Equity: Designing a Debt-Free Higher
Education Program That Works for Everyone
Introduction
College affordability has reached crisis levels across the country. Years of state budget cuts to higher education have led to higher tuition and fees, and mounting student debt — all while the students have become increasingly economically and racially diverse.1 In Massachusetts, per-student state funding for public higher education fell 32 percent from Fiscal Year (FY) 2001 through FY 2018.2 Large increases in tuition and fees ensued.3 So did the debt burden that students and their families had to bear to afford these costs.4
Over the past several years, several cities and states have responded to the college affordability crisis by creating and proposing tuition-free or debt-free higher education programs, known as “Promise” programs.5 The “promise” is the elimination—or at least reduction—of cost barriers for students accepted to college.
In reality, Promise programs have been designed with various restrictions on which students and institutions are eligible, what costs are covered, and more. This paper discusses the key design elements of a Promise program, and offers lessons for Massachusetts as it considers a number of proposals to make college tuition-and-fee-free or debt-free.
Based on a review of the relevant literature, including case studies of existing Promise programs and data on college and university students in Massachusetts, this paper offers an equity analysis of the different design elements of a Promise program. That is, how do choices made about each element affect access and affordability for students from less wealthy families, students of color, and immigrant students?
Laws and practices forbidding Black people from getting an education and learning to read were widespread during the era of slavery.6 In the decades after Emancipation, higher education opportunities for Black Americans emerged in the form of federally funded Historically Black Colleges and Universities. At the same time, however, legal segregation and racialized, two-tiered systems of education were put in place—most firmly by the Supreme Court’s 1896 Plessy v. Ferguson decision, which held that state policies requiring segregation were not tantamount to illegal discrimination under the 14th Amendment.7 Decades of mass protest and strategic litigation led to the Supreme Court’s 1954 Brown v. Board of Education decision and the Civil Rights Act of 1964, which prohibited the most egregious forms of state-sanctioned segregation.8
Still, equity in higher education is not simply a question of banning official segregation. Access to higher education opportunities depends, in part, on access to high-quality and well-funded early, elementary, and secondary education.
Private early education and care costs more in Massachusetts than in most other states.9 About 20,000 families are on waiting lists for state-subsidized care.10 State funding for early education is down 15
MASSACHUSETTS BUDGET AND POLICY CENTER • WWW.MASSBUDGET.ORG 2
A PROMISE OF EQUITY
percent (after adjusting for inflation) since the start of this century.11 And because K-12 education funding is so dependent on local property taxes, geographically and racially uneven housing markets — another legacy of historically legal segregation —mean that White students from wealthier school districts are the best prepared for postsecondary education.12 In short, quality education has been made into a privilege for those who can afford it, not a right for all who need it.
Access to higher education opportunities also depends on one’s wealth. The best college and university educations go, with few exceptions, to those who can pay the most money. The few exceptions are those schools with multibillion-dollar endowments who can subsidize the attendance of less wealthy students.
Further, White students can afford the high costs of college because they tend to have access to the wealth that many students of color do not. (See Income section below.) Because homeownership is such an important source of wealth, the typical White family has a far higher net worth than the typical Black/African-American or Hispanic/Latinx family.13 The other key source of wealth is savings from income. Unequal access to good, well-paying jobs for workers of color and immigrants forms another barrier to wealth formation.14
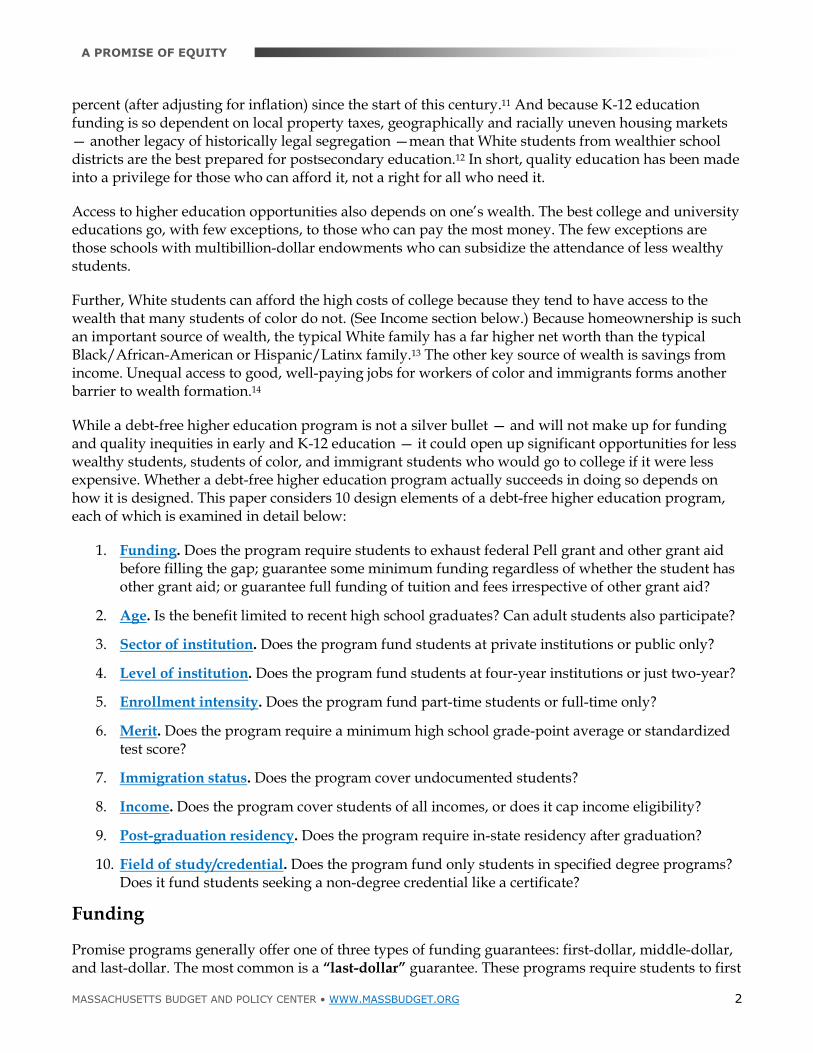
While a debt-free higher education program is not a silver bullet — and will not make up for funding and quality inequities in early and K-12 education — it could open up significant opportunities for less wealthy students, students of color, and immigrant students who would go to college if it were less expensive. Whether a debt-free higher education program actually succeeds in doing so depends on how it is designed. This paper considers 10 design elements of a debt-free higher education program, each of which is examined in detail below:
1. Funding. Does the program require students to exhaust federal Pell grant and other grant aid before filling the gap; guarantee some minimum funding regardless of whether the student has other grant aid; or guarantee full funding of tuition and fees irrespective of other grant aid?
2. Age. Is the benefit limited to recent high school graduates? Can adult students also participate?
3. Sector of institution. Does the program fund students at private institutions or public only?
4. Level of institution. Does the program fund students at four-year institutions or just two-year?
5. Enrollment intensity. Does the program fund part-time students or full-time only?
6. Merit. Does the program require a minimum high school grade-point average or standardized test score?
7. Immigration status. Does the program cover undocumented students?
8. Income. Does the program cover students of all incomes, or does it cap income eligibility?
9. Post-graduation residency. Does the program require in-state residency after graduation?
10. Field of study/credential. Does the program fund only students in specified degree programs? Does it fund students seeking a non-degree credential like a certificate?
Funding
Promise programs generally offer one of three types of funding guarantees: first-dollar, middle-dollar, and last-dollar. The most common is a “last-dollar” guarantee. These programs require students to first
MASSACHUSETTS BUDGET AND POLICY CENTER • WWW.MASSBUDGET.ORG 3
A PROMISE OF EQUITY
use federal Pell grant and other grant aid to pay tuition and fees, and then provide the “last dollars” needed to fill the remaining gap. These last-dollar programs don’t cover living expenses beyond tuition and fees, and if Pell and other grant aid fully cover a student’s tuition and fees, that student receives nothing from the Promise program.
“First-dollar” guarantees, on the other hand, are not offset by the receipt of other aid. They provide the full amount of tuition and fees and still allow students to use Pell and other grant aid to meet living expenses beyond tuition and fees.
Finally, “middle-dollar” programs are similar to last-dollar programs. The difference is middle-dollar programs guarantee some minimal amount of funding to students even if Pell and other grant aid meet all their tuition and fee costs. Students can then use this funding to meet other living expenses.
First-dollar programs are, of course, more expensive for the state than either the last-dollar or middle-dollar programs. But first-dollar guarantees are also the most equitable, as they offer the greatest benefit to students who need the most help affording college. Low-income students are most likely to receive Pell and other grant aid, which they can use to meet other living expenses like housing, food, child care, transportation, and other necessities.15
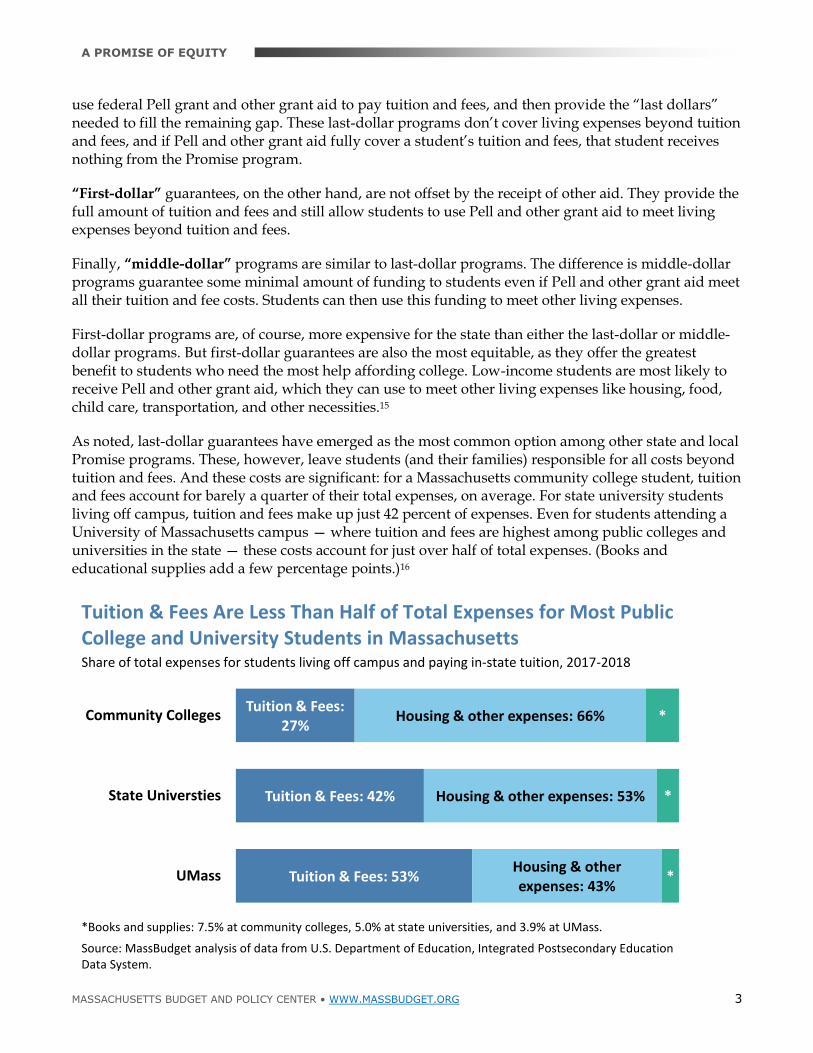
As noted, last-dollar guarantees have emerged as the most common option among other state and local Promise programs. These, however, leave students (and their families) responsible for all costs beyond tuition and fees. And these costs are significant: for a Massachusetts community college student, tuition and fees account for barely a quarter of their total expenses, on average. For state university students living off campus, tuition and fees make up just 42 percent of expenses. Even for students attending a University of Massachusetts campus — where tuition and fees are highest among public colleges and universities in the state — these costs account for just over half of total expenses. (Books and educational supplies add a few percentage points.)16
Tuition & Fees: 27%
Tuition & Fees: 42%
Tuition & Fees: 53%
Housing & other expenses: 66%
Housing & other expenses: 53%
Housing & other expenses: 43%
*
*
*
Community Colleges
State Universties
UMass
Tuition & Fees Are Less Than Half of Total Expenses for Most Public College and University Students in MassachusettsShare of total expenses for students living off campus and paying in-state tuition, 2017-2018
*Books and supplies: 7.5% at community colleges, 5.0% at state universities, and 3.9% at UMass.
Source: MassBudget analysis of data from U.S. Department of Education, Integrated Postsecondary Education Data System.
MASSACHUSETTS BUDGET AND POLICY CENTER • WWW.MASSBUDGET.ORG 4
A PROMISE OF EQUITY
Age
Many Promise programs limit eligibility to recent high school graduates and first-time college attendees. Students from low-income families, however, may have had a harder time affording and completing college right out of high school. Cutting those students off from a Promise program when they are adults could further deepen disadvantages they face relative to their college-educated peers. While most existing Promise programs exclude adult and returning students, a majority of the most recent Promise proposals include them.17
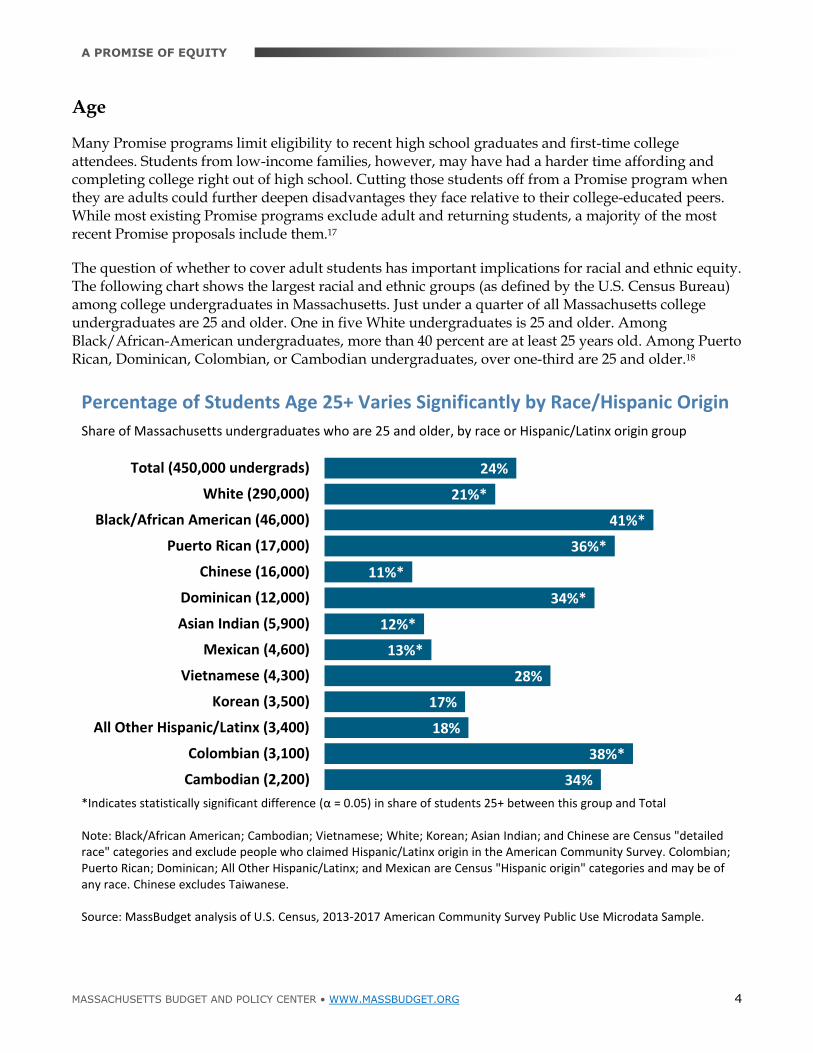
The question of whether to cover adult students has important implications for racial and ethnic equity. The following chart shows the largest racial and ethnic groups (as defined by the U.S. Census Bureau) among college undergraduates in Massachusetts. Just under a quarter of all Massachusetts college undergraduates are 25 and older. One in five White undergraduates is 25 and older. Among Black/African-American undergraduates, more than 40 percent are at least 25 years old. Among Puerto Rican, Dominican, Colombian, or Cambodian undergraduates, over one-third are 25 and older.18
24%
21%*
41%*
36%*
11%*
34%*
12%*
13%*
28%
17%
18%
38%*
34%
Total (450,000 undergrads)
White (290,000)
Black/African American (46,000)
Puerto Rican (17,000)
Chinese (16,000)
Dominican (12,000)
Asian Indian (5,900)
Mexican (4,600)
Vietnamese (4,300)
Korean (3,500)
All Other Hispanic/Latinx (3,400)
Colombian (3,100)
Cambodian (2,200)
Percentage of Students Age 25+ Varies Significantly by Race/Hispanic Origin
Share of Massachusetts undergraduates who are 25 and older, by race or Hispanic/Latinx origin group
*Indicates statistically significant difference (α = 0.05) in share of students 25+ between this group and Total
Note: Black/African American; Cambodian; Vietnamese; White; Korean; Asian Indian; and Chinese are Census "detailed race" categories and exclude people who claimed Hispanic/Latinx origin in the American Community Survey. Colombian; Puerto Rican; Dominican; All Other Hispanic/Latinx; and Mexican are Census "Hispanic origin" categories and may be of any race. Chinese excludes Taiwanese.
Source: MassBudget analysis of U.S. Census, 2013-2017 American Community Survey Public Use Microdata Sample.
MASSACHUSETTS BUDGET AND POLICY CENTER • WWW.MASSBUDGET.ORG 5
A PROMISE OF EQUITY
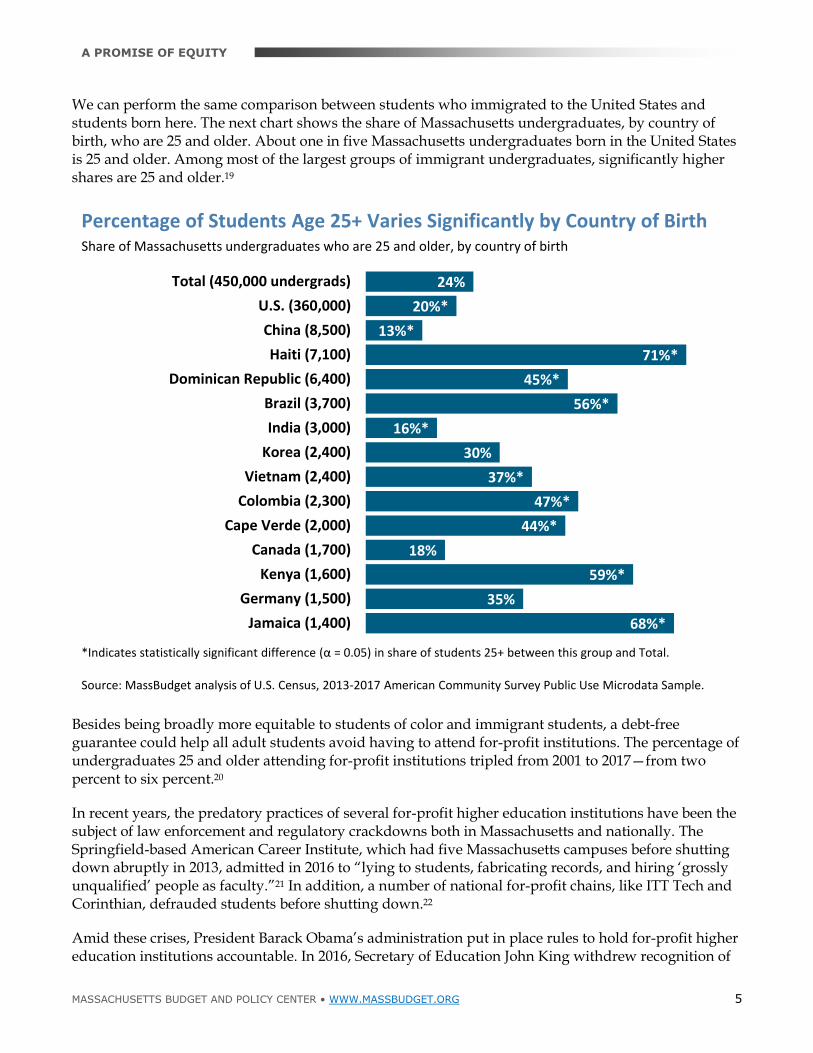
We can perform the same comparison between students who immigrated to the United States and students born here. The next chart shows the share of Massachusetts undergraduates, by country of birth, who are 25 and older. About one in five Massachusetts undergraduates born in the United States is 25 and older. Among most of the largest groups of immigrant undergraduates, significantly higher shares are 25 and older.19
Besides being broadly more equitable to students of color and immigrant students, a debt-free guarantee could help all adult students avoid having to attend for-profit institutions. The percentage of undergraduates 25 and older attending for-profit institutions tripled from 2001 to 2017—from two percent to six percent.20
In recent years, the predatory practices of several for-profit higher education institutions have been the subject of law enforcement and regulatory crackdowns both in Massachusetts and nationally. The Springfield-based American Career Institute, which had five Massachusetts campuses before shutting down abruptly in 2013, admitted in 2016 to “lying to students, fabricating records, and hiring ‘grossly unqualified’ people as faculty.”21 In addition, a number of national for-profit chains, like ITT Tech and Corinthian, defrauded students before shutting down.22
Amid these crises, President Barack Obama’s administration put in place rules to hold for-profit higher education institutions accountable. In 2016, Secretary of Education John King withdrew recognition of
24%
20%*
13%*
71%*
45%*
56%*
16%*
30%
37%*
47%*
44%*
18%
59%*
35%
68%*
Total (450,000 undergrads)
U.S. (360,000)
China (8,500)
Haiti (7,100)
Dominican Republic (6,400)
Brazil (3,700)
India (3,000)
Korea (2,400)
Vietnam (2,400)
Colombia (2,300)
Cape Verde (2,000)
Canada (1,700)
Kenya (1,600)
Germany (1,500)
Jamaica (1,400)
Percentage of Students Age 25+ Varies Significantly by Country of BirthShare of Massachusetts undergraduates who are 25 and older, by country of birth
*Indicates statistically significant difference (α = 0.05) in share of students 25+ between this group and Total.
Source: MassBudget analysis of U.S. Census, 2013-2017 American Community Survey Public Use Microdata Sample.
MASSACHUSETTS BUDGET AND POLICY CENTER • WWW.MASSBUDGET.ORG 6
A PROMISE OF EQUITY
the Accrediting Council for Independent Colleges and Schools (ACICS), which was the accrediting body responsible for overseeing Corinthian, ITT, and other for-profits. President Donald Trump’s Secretary of Education Betsy DeVos has sought to undo the Obama-era regulations, and she has restored accrediting authority to ACICS.23 A Promise program that offers free public undergraduate education to adult students could constrain for-profits’ growth among this age group at a time when the federal government is no longer holding this troubled industry accountable.
Sector (public or private)
A handful of state Promise programs allow participants to attend both private and public institutions. Massachusetts already provides state aid to students attending private institutions—an average of $39.2 million from fiscal years 2012 through 2016.24
One obvious consideration is that tuition and fees at public colleges and universities are much lower than at private schools. A public guarantee of fully funded tuition and fees as set by private institutions could pose enormous cost burdens to the program, especially considering nearly half of Massachusetts residents pursuing bachelor’s degrees attend private four-year institutions.25
Indiana, Louisiana, Oklahoma, and Washington allow students to attend private institutions, but contain costs by limiting funding to the amounts they would have received at comparable public schools. That gives students more schools to choose from, but requires them to pay the difference between the private school’s actual costs and the award amount.26
Besides costs, however, there is the matter of oversight. Public colleges and universities in Massachusetts are subject to public oversight via a number of channels, including the Board of Higher Education (BHE) and statutes enacted by the Legislature. The BHE has relatively limited regulatory authority, however, when it comes to so-called “independent” (that is, private non-profit) colleges and universities in Massachusetts. Furthermore, BHE has no purview over 23 Massachusetts independent colleges and universities, including some of the largest schools.27 Changing this would require new legislation. (Following the sudden shutdown of Mount Ida College in 2018, and amid a continual wave of closures among Massachusetts non-profit colleges and universities, there are legislative proposals to give BHE more authority to regulate non-profits that might be at risk of shutting down.28 These proposals, however, would not apply to the 23 schools over which BHE currently lacks purview.)
To the extent that Massachusetts has an interest in combining guaranteed funding for students with the ability to ensure academic quality and other standards at the schools those students attend, it would be hard-pressed to do so under the status quo.
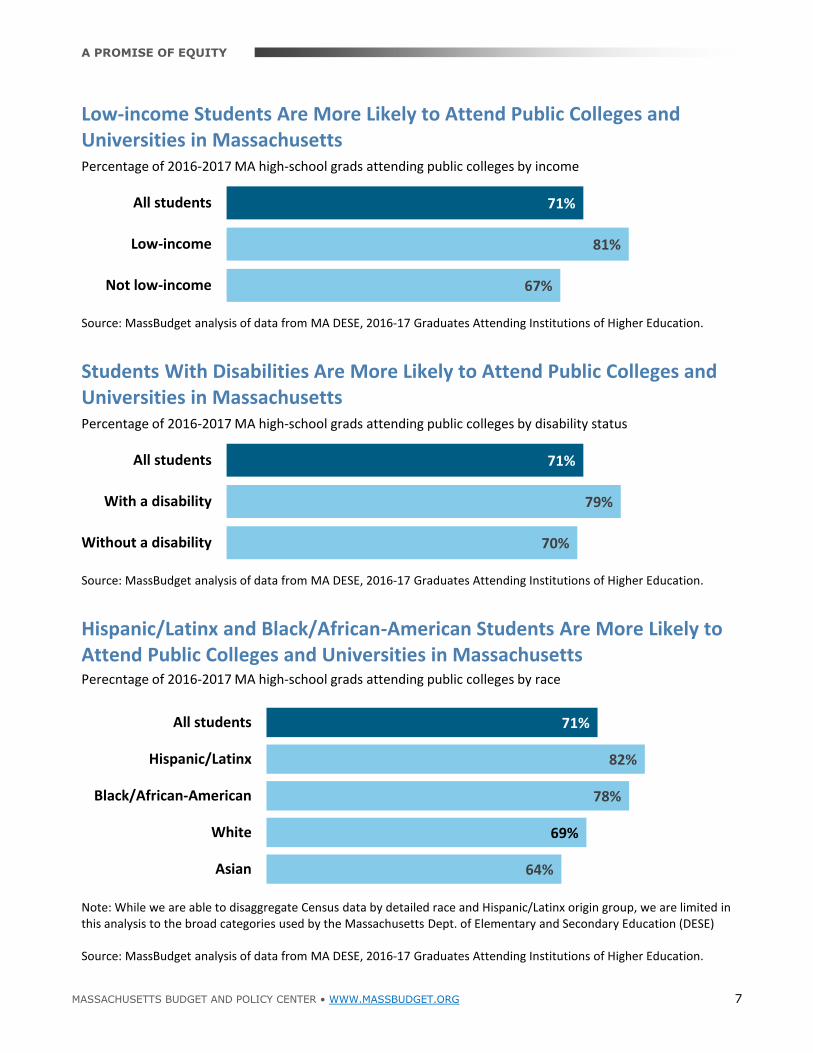
Prioritizing public over private institutions also has economic and racial equity implications. Low-income students, students with disabilities, Black/African-American students, and Hispanic/Latinx students are more likely to attend public colleges or universities in Massachusetts.29
MASSACHUSETTS BUDGET AND POLICY CENTER • WWW.MASSBUDGET.ORG 7
A PROMISE OF EQUITY
71%
81%
67%
All students
Low-income
Not low-income
Low-income Students Are More Likely to Attend Public Colleges and Universities in Massachusetts
Source: MassBudget analysis of data from MA DESE, 2016-17 Graduates Attending Institutions of Higher Education.
Percentage of 2016-2017 MA high-school grads attending public colleges by income
71%
79%
70%
All students
With a disability
Without a disability
Students With Disabilities Are More Likely to Attend Public Colleges and Universities in Massachusetts
Source: MassBudget analysis of data from MA DESE, 2016-17 Graduates Attending Institutions of Higher Education.
Percentage of 2016-2017 MA high-school grads attending public colleges by disability status
71%
82%
78%
69%
64%
All students
Hispanic/Latinx
Black/African-American
White
Asian
Hispanic/Latinx and Black/African-American Students Are More Likely to Attend Public Colleges and Universities in Massachusetts
Note: While we are able to disaggregate Census data by detailed race and Hispanic/Latinx origin group, we are limited in this analysis to the broad categories used by the Massachusetts Dept. of Elementary and Secondary Education (DESE)
Source: MassBudget analysis of data from MA DESE, 2016-17 Graduates Attending Institutions of Higher Education.
Perecntage of 2016-2017 MA high-school grads attending public colleges by race
MASSACHUSETTS BUDGET AND POLICY CENTER • WWW.MASSBUDGET.ORG 8
A PROMISE OF EQUITY
Finally, previous MassBudget research has shown that graduates from public institutions in Massachusetts are much more likely to remain in the state than graduates from private institutions.30
Level of institution (two-year or four-year)
Most Promise programs limit the benefit to students at community colleges, though more recently created or proposed programs cover four-year schools, as well.31 Whether or not to cover students at four-year schools is an important equity question. Because our labor market is set up to reward educational attainment, an associate’s degree leads to fewer career options and lower earnings than a bachelor’s degree. A Promise program that guarantees funding only at community colleges could have the effect of placing lower-income students—who would benefit most from the guarantee—onto separate career tracks from higher-income students.
Limiting the funding guarantee only to students at two-year schools may also lead to “undermatching.” Undermatching happens when students who may qualify for—and can afford—more selective four-year institutions choose a less expensive option based mainly on cost. So restricting the benefit to less expensive two-year institutions could lead to adverse post-graduation consequences not readily apparent at the moment someone is deciding where to apply to college based primarily on cost.
In Massachusetts, researchers Sarah Cohodes and Joshua Goodman found that the Adams Scholarship — a waiver of public college and university tuition (but not fees, which make up a much larger share of mandatory costs) — found that such undermatching might occur among some students when four-year public universities are made more affordable. High-achieving students from middle-income school districts were found to have chosen four-year public Massachusetts universities that measured lower on “a combination of graduation rates, academic skill of the student body, and instructional expenditures” than more selective four-year institutions for which they were academically qualified.32 The effect wasn’t limited to enrollment: these students also graduated at lower rates than if they had enrolled at the more selective options.
For students from lower- and higher-income districts, however, the authors found no undermatching effect. The Adams Scholarship increased college enrollment among high-achieving students from lower-income by eight percentage points. As for students from higher-income districts, the authors found the Adams Scholarship provided no incentive to switch from more expensive, more selective private alternatives to state colleges or universities.33
An important caveat in applying the lessons from the Cohodes-Goodman study to proposed Promise programs is that the Adams Scholarship is a relatively small tuition-only waiver, amounting to about eight to 16 percent of combined tuition and fees in the 2018-2019 academic year.34 Fully subsidizing tuition and fees could lead to increases in both overall enrollment among students from low-income districts and undermatching among high-achieving students from middle-income school districts.
Cohodes and Goodman found no “crowding-out” effect among students from high-income districts (that is, these students didn’t forgo more selective options to take public university slots away from other students), but it is possible that such an effect could emerge under the much higher benefit provided under the debt-free proposal, compared with the Adams Scholarship’s relatively small tuition-only waiver.
Among students from middle-income districts, however, their study does raise at least the possibility of a crowding-out effect. Namely, students who might be qualified to enroll at a more selective college could choose to enroll at a state university. Because there are limited slots at these state universities,
MASSACHUSETTS BUDGET AND POLICY CENTER • WWW.MASSBUDGET.ORG 9
A PROMISE OF EQUITY
such a choice could have the effect of displacing a student for whom state universities are the only viable postsecondary option.
The effect of increasing enrollment among lower-income students is notable, and brings up questions of equity when considering whether to cover students at four-year institutions. The potential for undermatching and crowding out among middle-income students points to the need to match investments in access and affordability with investments in quality, in order to make public colleges and universities a top choice for all students. As noted above, per-student funding of public higher education fell 32 percent from Fiscal Year (FY) 2001 to FY 2018.
Enrollment intensity (full-time or part-time)
While most existing Promise programs require full-time attendance as a condition of participation, more states are opening up their Promise programs to part-time students, or considering doing so.35
Students may attend college part-time because they have to work, raise children, or both. Among part-time undergraduates in Massachusetts, 36 percent have children at home and 36 percent work full-time. About one-third of Massachusetts part-time undergraduates are parents who are working or looking for work.36
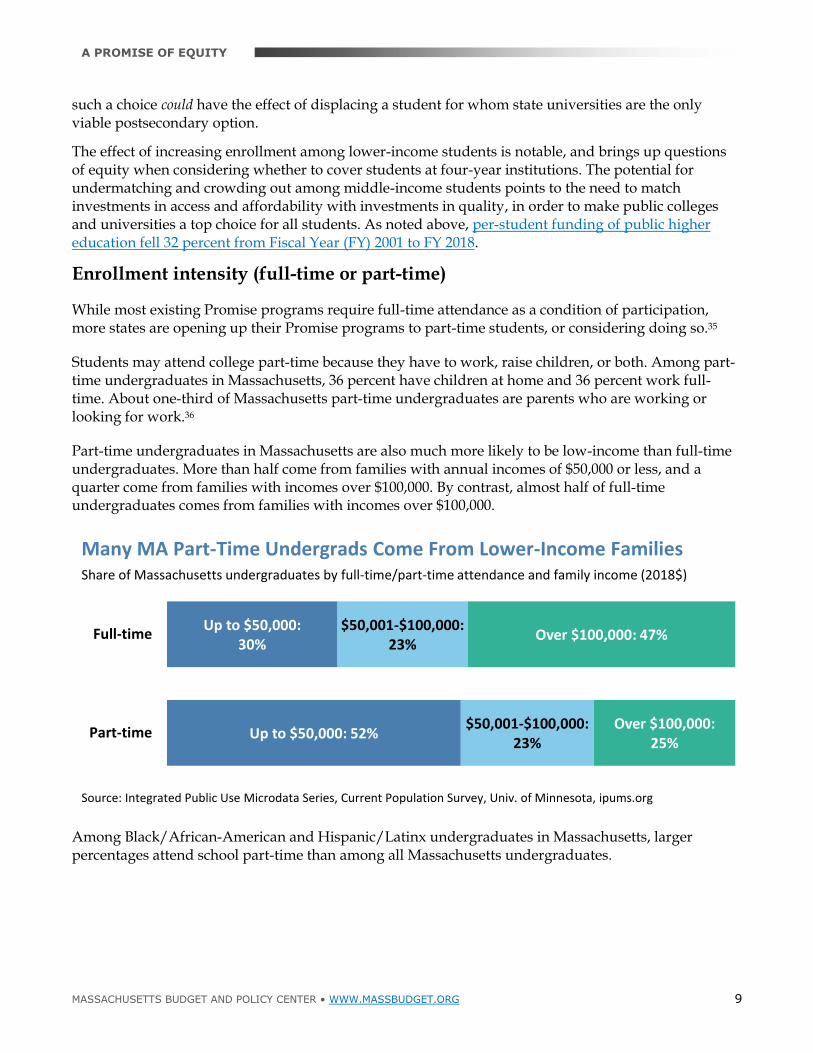
Part-time undergraduates in Massachusetts are also much more likely to be low-income than full-time undergraduates. More than half come from families with annual incomes of $50,000 or less, and a quarter come from families with incomes over $100,000. By contrast, almost half of full-time undergraduates comes from families with incomes over $100,000.
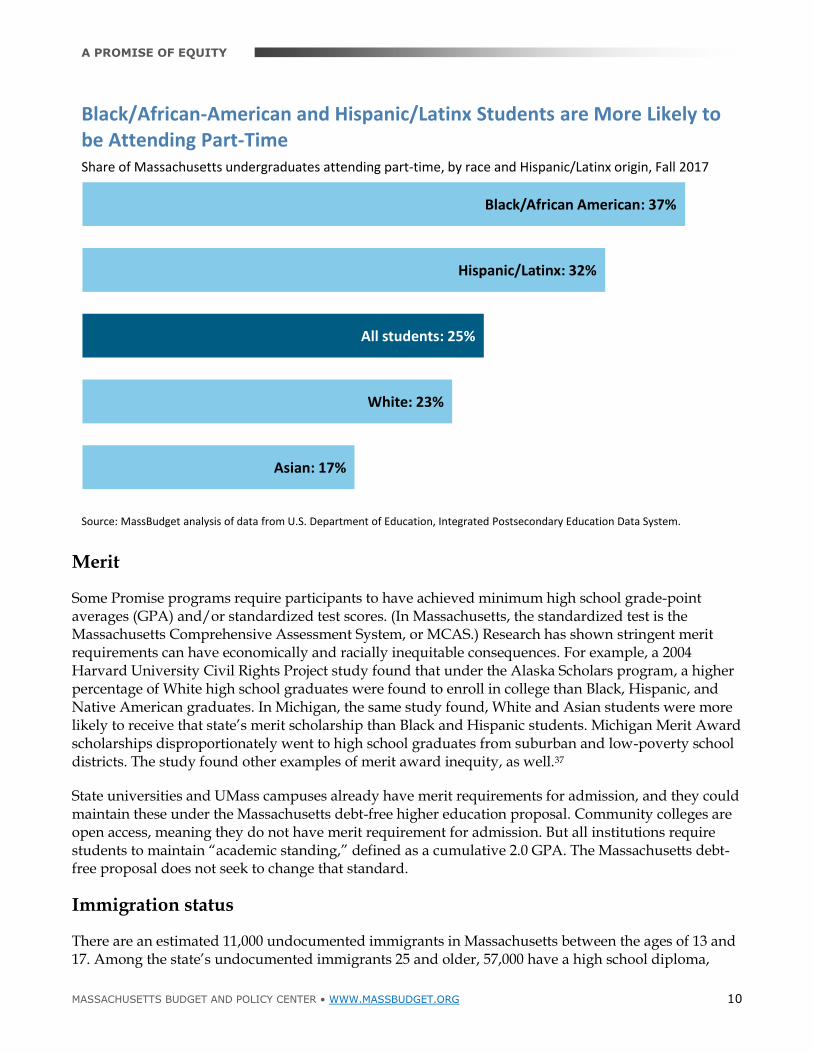
Among Black/African-American and Hispanic/Latinx undergraduates in Massachusetts, larger percentages attend school part-time than among all Massachusetts undergraduates.
Up to $50,000: 30%
Up to $50,000: 52%
$50,001-$100,000: 23%
$50,001-$100,000: 23%
Over $100,000: 47%
Over $100,000: 25%
Full-time
Part-time
Many MA Part-Time Undergrads Come From Lower-Income FamiliesShare of Massachusetts undergraduates by full-time/part-time attendance and family income (2018$)
Source: Integrated Public Use Microdata Series, Current Population Survey, Univ. of Minnesota, ipums.org
MASSACHUSETTS BUDGET AND POLICY CENTER • WWW.MASSBUDGET.ORG 10
A PROMISE OF EQUITY
Merit
Some Promise programs require participants to have achieved minimum high school grade-point averages (GPA) and/or standardized test scores. (In Massachusetts, the standardized test is the Massachusetts Comprehensive Assessment System, or MCAS.) Research has shown stringent merit requirements can have economically and racially inequitable consequences. For example, a 2004 Harvard University Civil Rights Project study found that under the Alaska Scholars program, a higher percentage of White high school graduates were found to enroll in college than Black, Hispanic, and Native American graduates. In Michigan, the same study found, White and Asian students were more likely to receive that state’s merit scholarship than Black and Hispanic students. Michigan Merit Award scholarships disproportionately went to high school graduates from suburban and low-poverty school districts. The study found other examples of merit award inequity, as well.37
State universities and UMass campuses already have merit requirements for admission, and they could maintain these under the Massachusetts debt-free higher education proposal. Community colleges are open access, meaning they do not have merit requirement for admission. But all institutions require students to maintain “academic standing,” defined as a cumulative 2.0 GPA. The Massachusetts debt-free proposal does not seek to change that standard.
Immigration status
There are an estimated 11,000 undocumented immigrants in Massachusetts between the ages of 13 and 17. Among the state’s undocumented immigrants 25 and older, 57,000 have a high school diploma,
Black/African American: 37%
Hispanic/Latinx: 32%
All students: 25%
White: 23%
Asian: 17%
Black/African-American and Hispanic/Latinx Students are More Likely to be Attending Part-TimeShare of Massachusetts undergraduates attending part-time, by race and Hispanic/Latinx origin, Fall 2017
Source: MassBudget analysis of data from U.S. Department of Education, Integrated Postsecondary Education Data System.
MASSACHUSETTS BUDGET AND POLICY CENTER • WWW.MASSBUDGET.ORG 11
A PROMISE OF EQUITY
some college, or an associate’s degree.38 Undocumented immigrants are not eligible for federal aid. While students who have been granted deferred action for childhood arrivals (DACA) by the federal government can attend public colleges and universities in Massachusetts for in-state tuition, undocumented students in Massachusetts must pay out-of-state prices even if they meet all other residency requirements. (Currently 18 states allow undocumented students to pay in-state tuition.39) Neither DACA students nor undocumented students may apply for federal, state, or institutional grant aid. Bills to allow all undocumented immigrants who have attended three years of high school in Massachusetts to pay in-state tuition, and to qualify for state and institutional aid, have been filed in several consecutive legislative sessions, including the current one.
Income
Many Promise programs limit participation to students from families making up to a certain income. While income caps can have the effect of targeting aid where most needed, it also has a number of other more harmful effects, including racially inequitable ones. First, income caps, as their name suggests, look at income—not wealth. This matters because even among families with similar incomes, the racial wealth gap is large. (See the Introduction for a brief discussion of the barriers to wealth formation laid down by historic and ongoing inequities in education, housing, and labor markets.)
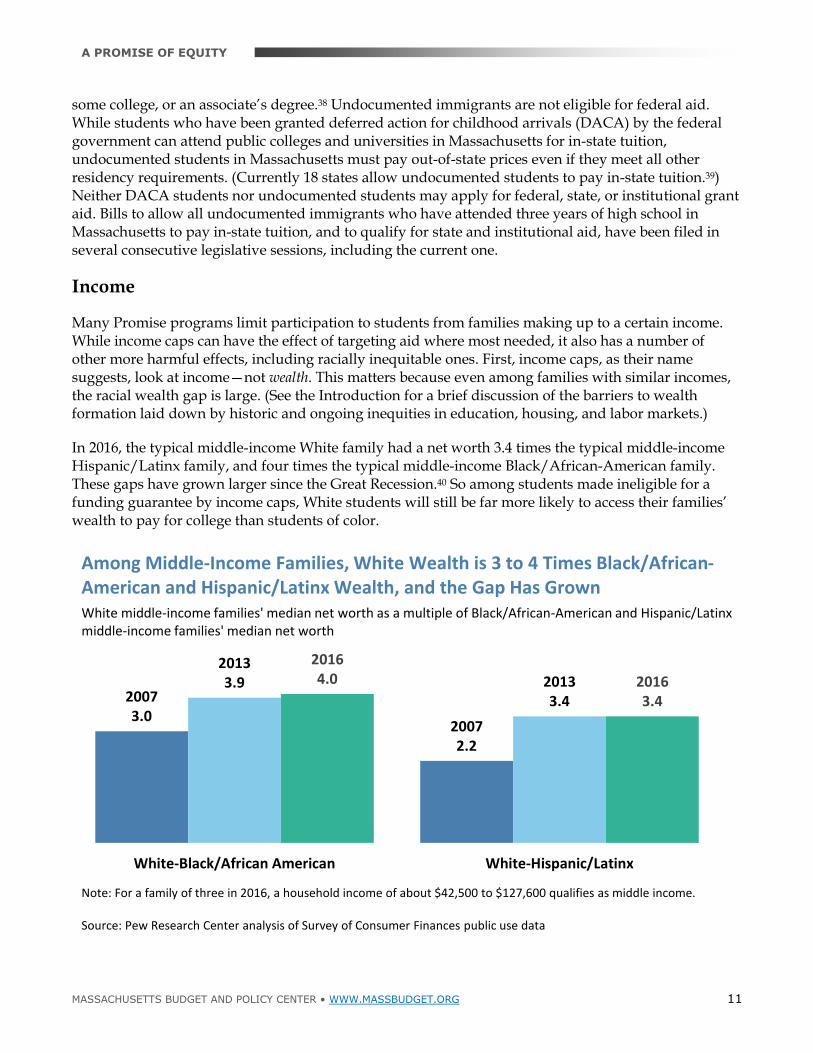
In 2016, the typical middle-income White family had a net worth 3.4 times the typical middle-income Hispanic/Latinx family, and four times the typical middle-income Black/African-American family. These gaps have grown larger since the Great Recession.40 So among students made ineligible for a funding guarantee by income caps, White students will still be far more likely to access their families’ wealth to pay for college than students of color.
20073.0
20072.2
20133.9 2013
3.4
20164.0 2016
3.4
White-Black/African American White-Hispanic/Latinx
Among Middle-Income Families, White Wealth is 3 to 4 Times Black/African-American and Hispanic/Latinx Wealth, and the Gap Has Grown
Note: For a family of three in 2016, a household income of about $42,500 to $127,600 qualifies as middle income.
Source: Pew Research Center analysis of Survey of Consumer Finances public use data
White middle-income families' median net worth as a multiple of Black/African-American and Hispanic/Latinx middle-income families' median net worth
MASSACHUSETTS BUDGET AND POLICY CENTER • WWW.MASSBUDGET.ORG 12
A PROMISE OF EQUITY
Second, a simple income cap doesn’t account for family size, or whether the student is from a higher- or lower-cost region of Massachusetts.
Finally, imposing an income cap would likely have the effect of creating an expectation that our public higher education system is primarily for students from families with fewer resources. Eschewing income caps would instead guarantee a debt-free college education to everyone who is admitted. Students from families with fewer resources would still be eligible for other forms of need-based aid.
Post-graduation residency
Only three Promise programs require in-state residency after graduation: Arkansas, New York, and Rhode Island.41
It may seem reasonable at first to expect students to remain in Massachusetts after their college education, when that education has been fully funded by the state. New York State’s Excelsior program, for example, requires students to stay in the state for the same number of years after graduation as the length of the award. For example, if a student receives the Excelsior scholarship for four years and lives in New York State for three years after graduation, one-quarter of the grant would convert to a loan.
A potential problem with this residency requirement is that it would harm any graduates who needs to move out of Massachusetts because of a job opportunity or to take care of a family member who lives out-of-state. Requiring students, before they enter college, to make a commitment to living in-state several years later could hamper participation among students with lower-incomes and students with less access to family wealth, because they are likely to be more fearful of having to repay loans than higher-income and wealthier students. And, as noted earlier, these lower-wealth students are far more likely to be students of color.
Fields of study/credential
Some Promise programs require students to enroll in “high-demand” fields: majors that match the labor needs of the private sector. Such an imposition would require teenagers to be certain about their post-college career paths before they even start college. What if a student in a qualifying major decides midway that they would be happier switching to a non-qualifying major?
Equity issues arise here, as well. A student from a wealthy family is more likely to be able to pursue a degree in the arts or humanities (which might not be in high demand by industry and thus not eligible for a funding guarantee) because, thanks to their family’s resources, they can take on debt to pay for school and may not be totally dependent on their own earnings afterwards. A student from a less wealthy family, on the other hand, may feel more pressure to avoid debt. If a full-funding guarantee forced them to choose only certain disciplines, they would have less freedom of choice than the wealthier student.
Notes and Sources
1 Michael Mitchell, Michael Leachman, Kathleen Masterson, and Samantha Waxman, Center on Budget and Policy Priorities, October 4, 2018, “Unkept Promises: State Cuts to Higher Education Threaten Access and Equity” [https://www.cbpp.org/research/state-budget-and-tax/unkept-promises-state-cuts-to-higher-education-threaten-access-and]
MASSACHUSETTS BUDGET AND POLICY CENTER • WWW.MASSBUDGET.ORG 13
A PROMISE OF EQUITY
2 Jeremy Thompson, Massachusetts Budget and Policy Center, March 1, 2018, “Educated and Encumbered: Student Debt Rising with Higher Education Funding Falling in Massachusetts” [http://www.massbudget.org/report_window.php?loc=Educated-and-Encumbered.html#chart5]
3 Thompson [http://www.massbudget.org/report_window.php?loc=Educated-and-Encumbered.html#chart6]
4 Thompson [http://www.massbudget.org/report_window.php?loc=Educated-and-Encumbered.html#chart13]
5 Mark Huelsman, Demos, September 26, 2018, “A Blueprint for College Debt” [https://www.demos.org/sites/default/files/publications/A%20Blue%20Print%20for%20College%20Without%20Debt_0.pdf]; Tiffany Jones and Katie Berger, The Education Trust, 2018, “A Promise Fulfilled: A Framework for Equitable Free College Programs” (esp. the table on pp. 5-6) [https://edtrust.org/resource/a-promise-fulfilled/]; Jen Mishory, The Century Foundation, March 5, 2018, “The Future of Statewide College Promise Programs” [https://tcf.org/content/report/future-statewide-college-promise-programs/]. These three reports form the basis for most of this paper’s general characterizations of Promise programs. “Tuition-free” programs are designed to ensure that beneficiaries can attend college without paying tuition (and fees), but leave students responsible for covering living expenses. “Debt-free” programs are designed to cover all expenses, many of which students now meet by borrowing.
6 PBS, “Schools and Education During Reconstruction” [https://www.pbs.org/wgbh/americanexperience/features/reconstruction-schools-and-education-during-reconstruction/]
7 Lia Epperson, April, 1, 2017, “Civil Rights Remedies in Higher Education: Jurisprudential Limitations and Lost Moments in Time,” Washington and Lee Journal of Civil Rights and Social Justice, Vol. 23, pp. 352-353 [https://scholarlycommons.law.wlu.edu/cgi/viewcontent.cgi?article=1436&context=crsj]
8 Chad Williams, Miami Herald, July 28, 2017, “A silent protest parade in 1917 set the stage for civil rights marches” [https://www.miamiherald.com/opinion/op-ed/article164116762.html]; Epperson, pp. 353-363
9 Child Care Aware of America, 2018, “The High Cost of Child Care: A Review of Prices and Proposed Solutions for a Broken System,” pp. 29-31 [https://cdn2.hubspot.net/hubfs/3957809/COCreport2018_1.pdf]
10 Massachusetts Department of Early Education and Care, July 10, 2018, “Caseload Review”
11 MassBudget, BudgetBrowser [http://massbudget.org/browser/subcat.php?c1=1&c2=19&id=Early+Education+%26+Care&inflation=cpi&budgets=19b1#comparisons]
12 Laura Sullivan, Tatjana Meschede, Lars Dietrich, and Thomas Shapiro, Institute for Assets and Social Policy, Brandeis University; Amy Traub, Catherine Ruetschlin, and Tamara Draut, Demos, “The Racial Wealth Gap: Why Policy Matters,” June 21, 2016, pp. 17-18 [https://www.demos.org/sites/default/files/publications/RacialWealthGap_2.pdf]
13 Sullivan, Meschede, Dietrich, Shapiro, Traub, Ruetschlin, and Draut, p. 9
14 Valerie Wilson and William M. Rodgers III, Economic Policy Institute, “Black-white wage gaps expand with rising wage inequality,” p. 23 [https://www.epi.org/files/pdf/101972.pdf]
15 U.S. Department of Education, “What costs does a Federal Pell Grant cover?” [https://studentaidhelp.ed.gov/app/answers/detail/a_id/1560/~/what-costs-does-a-federal-pell-grant-cover]
16 MassBudget analysis of data from U.S. Department of Education, Integrated Postsecondary Education Data System (IPEDS)
17 Jones and Berger, pp. 5-6. Of the 15 active programs listed, three allow adults and returning students to participate. Of the 16 more recent proposals listed, nine do so.
18 MassBudget analysis of U.S. Census, 2013-2017 American Community Survey Public Use Microdata Sample (ACS PUMS)
19 MassBudget analysis of U.S. Census, 2013-2017 ACS PUMS
20 MassBudget analysis of IPEDS data
21 Patrick Johnson, Springfield Republican, June 6, 2016, “Former Springfield-based American Career Institute admits lying to students, fabricating records and employing unqualified teachers” [https://www.masslive.com/news/2016/06/closed_springfield-based_ameri.html]
MASSACHUSETTS BUDGET AND POLICY CENTER • WWW.MASSBUDGET.ORG 14
A PROMISE OF EQUITY
22 Rowan Moore-Gerety, National Public Radio, December 7, 2016, “What Former Employees Say ITT Tech Did To Scam Its Students” [https://www.npr.org/sections/ed/2016/12/07/502601724/what-former-employees-say-itt-tech-did-to-scam-its-students]; Jillian Berman, MarketWatch, March 24, 2016, “College ordered to pay over $1 billion for misleading students” [https://www.marketwatch.com/story/for-profit-college-ordered-to-pay-over-1-billion-for-misleading-students-2016-03-24]
23 Michael Stratford, Politico, August 10, 2018, “DeVos rolls back rules aimed at low-performing for-profit and career colleges” [https://www.politico.com/story/2018/08/10/devos-low-performing-for-profit-colleges-772302]; Andrew Kreighbaum, Inside Higher Ed, November 26, 2018, “DeVos Restores Recognition for Troubled For-Profit Accreditor” [https://www.insidehighered.com/news/2018/11/26/devos-restores-authority-profit-accreditor]
24 MassBudget analysis of data provided by Massachusetts Department of Higher Education
25 MassBudget analysis of IPEDS data
26 Indiana Commission for Higher Education, 21st Century Scholarship webpage [https://scholars.in.gov]; Louisiana Office of Student Financial Assistance, TOPS Opportunity Award webpage [https://www.osfa.la.gov/tops_Opportunity.html]; Oklahoma State Regents for Higher Education, November 2018, “Oklahoma’s Promise: Information for Financial Aid Officers,” p. 6 [https://www.okhighered.org/okpromise/pdf/fao-handbook.pdf]; Washington Student Achievement Council, March 2018, “State Need Grant and College Bound Scholarship Program Manual for Financial Aid Administrators, 2018-19,” p. 28 [https://www.wsac.wa.gov/sites/default/files/2018-19-SNG_CBS_ProgramManualFinal.pdf]
27 Massachusetts Department of Higher Education, “Purview of the Board of Higher Education” [http://www.mass.edu/foradmin/academic/independentpurview.asp]
28 Laura Krantz, Boston Globe, March 6, 2019, “Baker wants increased state oversight of private colleges” [https://www.bostonglobe.com/metro/2019/03/06/baker-wants-increased-state-oversight-private-colleges/uzWS5w1YtlXLrYIXLcGEMM/story.html]. For specific bills filed in the 191st Massachusetts legislature, see Senate Bill 761, “An Act relative to transparency in higher education” [https://malegislature.gov/Bills/191/S761]; House Bill 1217, “An Act relative to higher education transparency” [https://malegislature.gov/Bills/191/H1217]; and Senate Bill 2183, “An Act to support improved financial stability in higher education” [https://malegislature.gov/Bills/191/S2183].
29 MassBudget analysis of data from Massachusetts Department of Elementary and Secondary Education, 2016-17 Graduates Attending Institutions of Higher Education [http://profiles.doe.mass.edu/statereport/gradsattendingcollege.aspx]. “Low-income” is used here instead of the Massachusetts Department of Elementary and Secondary Education’s (DESE) technical but less widely familiar term “economically disadvantaged.” DESE used to define students as “low-income” based on participation in the free or reduced-price lunch program. Now DESE defines students as “economically disadvantaged” if, according to DESE data, they participate in any of the following programs: Supplemental Nutrition Assistance Program (“food stamps”); Transitional Assistance for Families with Dependent Children (TAFDC); the Department of Children and Families' (DCF) foster care program; and MassHealth (Medicaid).
30 Thompson [http://www.massbudget.org/report_window.php?loc=Educated-and-Encumbered.html#chart3]
31 Jones and Berger, pp. 5-6. Of the 15 active programs listed, 6 cover four-year institutions. Of the 16 more recent proposals listed, 8 do so.
32 Sarah Cohodes and Joshua Goodman, January 31, 2014, “Merit Aid, College Quality and College Completion: Massachusetts’ Adams Scholarship as an In-Kind Subsidy,” pp. 22-23 [https://scholar.harvard.edu/files/joshuagoodman/files/paper_2.pdf]
33 Cohodes and Goodman, p. 22
34 Massachusetts Department of Higher Education, “Adams Scholarship — Current and Recent Value” [http://www.mass.edu/osfa/programs/adamstable.asp]
35 Jones and Berger, p. 8
MASSACHUSETTS BUDGET AND POLICY CENTER • WWW.MASSBUDGET.ORG 15
A PROMISE OF EQUITY
36 MassBudget analysis of data from Sarah Flood, Miriam King, Renae Rodgers, Steven Ruggles, and J. Robert Warren. Integrated Public Use Microdata Series, Current Population Survey: Version 6.0 [dataset]. Minneapolis, MN: IPUMS, 2018. “Full-time” is 35 hours or more per week.
37 Donald E. Heller and Patricia Marin (eds.), Harvard University Civil Rights Project, 2004, “State Merit Scholarship Programs and Racial Inequality” [https://www.nmefoundation.org/getmedia/78d0251f-ee9d-4410-9645-ac16392be40c/heller-marin-state-merit-scholarship-2004]; Susan Dynarski, December 2002, “The Consequences of Merit Aid,” p. 22 [https://www.nber.org/papers/w9400.pdf]; Louisiana Board of Regents, October 2018, “Analysis of the TOPS Program from 2008-2017,” pp. 14-15 [https://regents.la.gov/wp-content/uploads/2018/11/9b-TOPS-1202-2018-Final-DRAFT-Proposal-for-BOR.pdf]
38 Migration Policy Institute, “Profile of the Unauthorized Population: Massachusetts” [https://www.migrationpolicy.org/data/unauthorized-immigrant-population/state/MA]
39 National Conference of State Legislatures, March 14, 2019, “Undocumented Student Tuition: Overview” [http://www.ncsl.org/research/education/undocumented-student-tuition-overview.aspx]
40 Rakesh Kochhar and Anthony Cilluffo, Pew Research Center, November 1, 2017, “How wealth inequality has changed in the U.S. since the Great Recession, by race, ethnicity and income” [http://www.pewresearch.org/fact-tank/2017/11/01/how-wealth-inequality-has-changed-in-the-u-s-since-the-great-recession-by-race-ethnicity-and-income]
41 Mishory, p. 4
https://regents.la.gov/wp-content/uploads/2018/11/9b-TOPS-1202-2018-Final-DRAFT-Proposal-for-BOR.pdf