
A Novel Approach to Continuous Sampling and Measurement of Uranium Containing Particulate Matter
153
A Novel Approach to Continuous Sampling and Measurement of Uranium Containing Particulate Matter A Thesis Submitted to the Committee on Graduate Studies in Partial Fulfillment of the Requirements for the Degree of Doctor of Philosophy in the Faculty of Arts and Science TRENT UNIVERSITY Peterborough, Ontario, Canada © Copyright by Kashif Imtiaz Choudhry, 2011 Environmental and Life Sciences Graduate Ph.D. Program (ENLS) January 2012
-
Upload
dr-kashif-imtiaz-choudhry -
Category
Documents
-
view
91 -
download
1
Transcript of A Novel Approach to Continuous Sampling and Measurement of Uranium Containing Particulate Matter

A Novel Approach to Continuous Sampling
and Measurement of Uranium Containing
Particulate Matter
A Thesis Submitted to the Committee on Graduate Studies
in Partial Fulfillment of the Requirements for the Degree of Doctor of
Philosophy in the Faculty of Arts and Science
TRENT UNIVERSITY
Peterborough, Ontario, Canada
© Copyright by Kashif Imtiaz Choudhry, 2011
Environmental and Life Sciences Graduate Ph.D. Program (ENLS)
January 2012

This work is dedicated
to my
Parents
Their prayers are always behind me

i
Abstract
A Novel Approach to Continuous Sampling and Measurement of
Uranium Containing Particulate Matter
Kashif Imtiaz Choudhry

ii
Abstract
Continuous monitoring of industrial heavy metals release into the environment is
important for emission control and compliance with standards. In this research, a
method for continuous monitoring of uranium-containing particles in industrial
emissions was developed. A particle-into-liquid sampler (PILS) was found to be a
suitable instrument for the continuous collection of uranium dioxide (UO2) and
uranium tetrafluoride (UF4) at a rate of 1-5 mg h-1
into the transporting solution. The
efficiency of various solutions (as sample transport media), including water and a
sodium carbonate/hydrogen peroxide (Na2CO3-H2O2) solution for the collection of
particles was evaluated. The sodium carbonate/hydrogen peroxide solution was found
to be preferable to water for the collection of UO2 and UF4 because particle build-up
on the impaction surface and blockages in liquid transport lines were eliminated.
The data collected in experiments show that a sample air flow rate (l min-1
) has a
significant effect on particle collection efficiency. The combination of a sample air
flow rate of 10 l min-1
(for UO2) or 16.7 l min-1
(for UF4), a steam flow rate of 1.5 ml
min-1
and a sample transport solution flow rate of 0.5 ml min-1
demonstrated greater
than 89% recovery of the particle mass of UO2 and greater than 92% recovery for UF4
in the sample plus impactor drain lines.
A comparison was also made between uranium concentrations in particles collected
from a traditional high volume sampler (filter) with aerosols collected by the PILS.
Results showed that U in particles collected with the high volume air sampler using
filters was consistently higher than in aerosols collected with the PILS. The PILS and
filter results show a good correlation (R2
= 0.98); on average the PILS collected 80%
of uranium found in the filter samples.
iii
Significant quantities of rare earth elements (REE) are found in tailings of uranium
ore. Therefore, a microwave digestion method was also developed for six commonly
used rare earth oxides using 2% (v/v) nitric acid that can be used with PILS for
continuous monitoring of rare earth elements in ambient air. Results show that using
20 ml of nitric acid (2 % v/v) and closed vessel microwave heating at 100oC for 60
minutes yields greater than 90±5% recoveries of all six REEs. The PILS is an
effective instrument for aerosol collection into a liquid; it is very reproducible, it is
easy to use, it offers a better understanding of aerosol composition and provides time-
dependent information.
Keywords: Continuous emission monitoring, uranium dioxide, uranium tetrafluoride,
microwave digestion, particle-into-liquid sampler, rare earth oxide, high volume air
sampler.

iv
Preface
This thesis is submitted as partial fulfillment of the requirements for the degree of
Doctor of Philosophy in Environmental and Life Sciences (ENLS). The work was
carried out at Trent University, Peterborough, ON, Canada and Cameco Corporation,
Port Hope, ON, Canada on the topic of “A novel approach to continuous sampling
and measurement of uranium containing particulate matter”.

v
Acknowledgement
I would like to give my sincere thanks to my thesis advisors, Dr. R. Douglas Evans,
Dr. R. Jack Cornett and Dr. Qianli Xie, because they provided me with incredible
support, encouragement, and guidance during the course of my thesis. I am thankful
to Dr. Huan Zhong for his assistance for the sample analysis. A very special thank to
Cameco Corporation, Port Hope, Ontario for providing some of the samples and
facilities to complete the work. Dr. Simon Reid, Dr. Katerina Kyyst and Jacques
Gauthier (Cameco Corporation, Port Hope, ON) also have my complete gratitude.
Their experience and previous work played a very important role and made my thesis
task much easier.
The financial support from the Trent University and Natural Science and Engineering
research Council of Canada (NSERC) is gratefully acknowledged. Many thanks to Dr.
Hayla Evans for her editorial work. I also thank Linda Cardwell, (Environmental and
Life Sciences graduate study office) and Laurie Denise Kryshka (Evans lab manager)
for their help with logistics during my time of study.
Finally, I take this opportunity to express my profound gratitude to my beloved
parents, my brothers and sisters, my wife and daughter for their moral support and
patience during my study at Trent University, Peterborough, Ontario, Canada.
At last, I want to devote this thesis to my Almighty God. It would not have been
possible to complete this degree Doctor of Philosophy in Environmental and Life
Sciences (ENLS) without His grace.

vi
TABLE OF CONTENTS
ABSTRACT…..................................................................................................... i
PREFACE…...................................................................................................... iv
ACKNOWLEDGMENT ......................................................................................... v
TABLE OF CONTENTS …………………………………………………………. vi
LIST OF FIGURES ……………………………………………………………. x
LIST OF TABLES ……………………………………………………………… xiii
CHAPTER 1 ……………………………………………………………. 1
INTRODUCTION ………………………………………………..…………… 1
1.1 Introduction ………………………..………………………………. 2
1.2 Aerosol chemical composition measurements …………………….. 3
1.2.1 Sample collection methods ………………….…………….. 3
1.2.1.1 Off-line measurements ……….……………. 4
1.2.1.2 Continuous or semi-continuous measurements. 7
1.2.2 Sample preparation ………………………….……………… 9
1.2.3 Sample analysis ……..……………………….……………… 11
1.3 Proposed research ……………………………………………………. 13
1.4 References ……………………………………………………………. 15
CHAPTER 2 ……………………………………………………………… 21
DISSOLUTION OF URANIUM DIOXIDE (UO2) AND URANIUM TETRAFLUORIDE (UF4)
PARTICLES IN A Na2CO3-H2O2 SOLUTION ……………………………………… 21
2.1 Abstract ………………………..………………………………………. 22
2.2 Introduction ………………………..…………………………………... 23
2.3 Methods ……………………………………………………………….. 25
2.3.1 Reagents and standards ………………….……………………… 25
2.3.2 Dissolution experiments ………………………….…………… 25
2.3.3 X-ray fluorescence (XRF) analysis …………………………… 26
2.4 Results and discussion ………………………………………………… 26
2.5 Conclusion ………………………………………………...…………... 33
2.6 References ……………………………………………………………... 34

vii
CHAPTER 3 ………………………………………………………………… 36
DETERMINATION OF TRACE LEVEL RARE EARTH ELEMENTS USING MICROWAVE
DIGESTION AND INDUCTIVELY COUPLED PLASMA MASS SPECTROMETRY ......... 36
3.1 Abstract ………………………..……………………………………….. 37
3.2 Introduction ………………………..…………………………………… 38
3.3 Materials and Methods …………………………………………………. 41
3.3.1 Chemicals and standards ………………….……………………. 41
3.3.2 Sample preparation ………………………….………………….. 42
3.3.3 Determination of REEs by ICP-MS ……………………………. 43
3.4 Results and discussion ………………………………………………….. 44
3.4.1 Effect of sample size – Microwave digestion …………………... 44
3.4.2 Effect of acid concentration – Microwave digestion …………… 45
3.4.3 Effect of digestion time – Microwave and hotplate digestion ….. 48
3.4.4 Microwave versus hotplate digestion …………………………... 50
3.5 Conclusion ………….…………………………………………………... 52
3.6 References ……………………………………………………………… 53
CHAPTER 4 ……………………………………………………………….. 57
PARTICLE-INTO-LIQUID SAMPLER (PILS) OPTIMIZATION FOR THE CONTINUOUS
MONITORING OF URANIUM DIOXIDE (UO2) AND URANIUM TETRAFLUORIDE (UF4)
PARTICLES IN HIGH PARTICLE CONCENTRATION ENVIRONMENTS …….......... 57
4.1 Abstract ………………………..……………………………………… 58
4.2 Introduction ………………………..…………………………………. 59
4.3 Experiments …………………………………………………………… 64
4.3.1 Reagents and standards ………………….……………………... 64
4.3.2 Aerosol generator ………………………….…………………... 64
4.3.3 Particle-into-liquid sampler (PILS) ………….………………… 67
4.3.4 Pre-treatment of PILS samples ………...…..…………………... 69
4.3.5 ED-XRF analysis ………………………………………………. 69
4.4 Results and discussion …………………………………………………. 70
4.4.1 Water as the transport liquid ………………….………………... 70
4.4.2 Optimization of PILS system for UO2 and UF4………………. 73
4.4.2.1 PILS – Sample line plus impactor drain ………... 75
4.4.2.2 PILS – Growth chamber drain ………...…..…… 83
4.4.2.3 PILS – Filter plus cold trap ………...…..………. 85
4.5 Conclusion ………………………………………………...…………… 85
4.6 References ……………………………………………………………... 87
viii
CHAPTER 5 ……………………………………………………………….. 91
DETERMINATION OF URANIUM (U) IN ATMOSPHERIC AEROSOLS USING A
PARTICLE-INTO-LIQUID SAMPLER (PILS)…………………………………. 91
5.1 Abstract ………………………..………………………………………. 92
5.2 Introduction ………………………..…………………………………… 93
5.3 Materials and Methods …………………………………………………. 95
5.3.1 Sampling location ………………….…………………………… 95
5.3.2 Aerosol sampling ………………………….…………………… 96
5.3.2.1 Particle-into-liquid sampler (PILS) …………….. 96
5.3.2.2 High volume air sampler ………...…..…………. 98
5.3.3 Reagents and standards …………………………………………. 99
5.3.4 Pre-treatment of the PILS and filter samples ……………..……. 99
5.3.4.1 Filter samples …………………………............... 99
5.3.4.2 PILS samples …………………………............... 100
5.3.5 Inductively coupled plasma mass spectrometric (ICP-MS)
analysis ……………………………………………………….... 100
5.4 Results and discussion …………………………………………………. 101
5.4.1 Optimization of PILS system ………………….………………. 101
5.4.2 Uranium concentration in atmospheric particles …………… 102
5.4.3 Monitoring of uranium in the air ………….………………….. 104
5.5 References ……………………………………………………………… 110
CHAPTER 6 ………………………………………………………………… 112
GENERAL DISSCUSION AND CONCLUSIONS …..……..………………. 112
6.1 General discussion and conclusions…..………………………………… 113
6.2 References ……………………………………………………………… 122
APPENDICES ………………………………………………………………… 123
Appendix 1 …………………………………..………………………………… 124
Appendix 2 …………………………………..………………………………… 125
Appendix 3 …………………………………..………………………………… 126
Appendix 4 …………………………………..………………………………… 129
Appendix 5 …………………………………..………………………………… 130
Appendix 6 …………………………………..………………………………… 131

ix
Appendix 7 …………………………………..………………………………… 132
Appendix 8 …………………………………..………………………………… 134
Appendix 9 …………………………………..………………………………… 135
Appendix 10 …………………………………..………………………………… 136
Appendix 11 …………………………………..………………………………… 138

x
LIST OF FIGURES
Figure 2.1 UO2 dissolution (%) in sodium carbonate (0 - 7 wt %) /
hydrogen peroxide (0.15 wt %) as a function of time.
……. 29
Figure 2.2 UF4 dissolution (%) in sodium carbonate (0 - 5 wt %) /
hydrogen peroxide (0.01 wt %) as a function of time.
……. 29
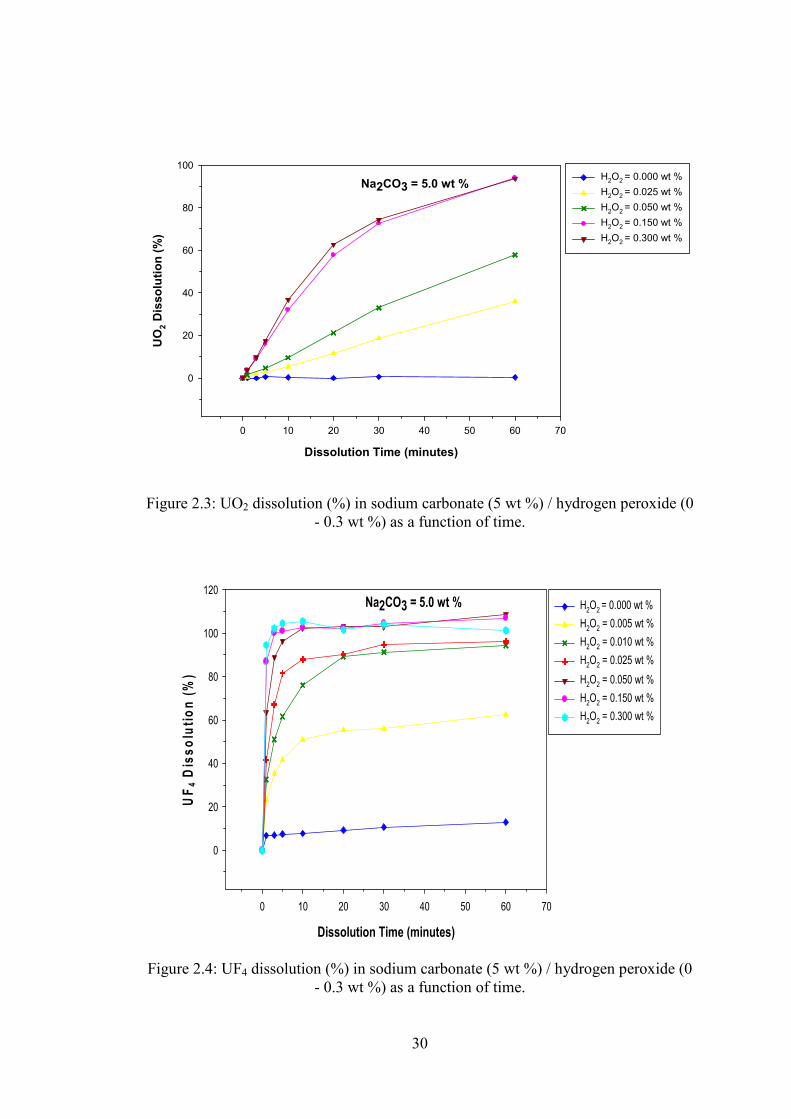
Figure 2.3 UO2 dissolution (%) in sodium carbonate (5 wt %) /
hydrogen peroxide (0 - 0.3 wt %) as a function of time.
……. 30
Figure 2.4 UF4 dissolution (%) in sodium carbonate (5 wt %) /
hydrogen peroxide (0 - 0.3 wt %) as a function of time.
……. 30
Figure 3.1 Effect of sample size (20, 40, 60 and 80 mg) on
recovery, 20 ml (50% HNO3), 100oC, 15 min
microwave digestion. For each element, the same
letters on different bars indicate no significant
difference (p > 0.05) between them, whereas different
letters on different bars indicate a significant difference
(p < 0.05) between them.
……. 45
Figure 3.2 Effect of acid concentration (2, 5 or 20% v/v) on
recovery. 20 mg sample, 20 ml HNO3, 100oC
microwave digestion. For each element, the same
letters on different bars indicate no significant
difference (p > 0.05) between them, whereas different
letters on different bars indicate a significant difference
(p < 0.05) between them.
……. 47
Figure 3.3 Effect of digestion time (30, 45 or 60 min) on recovery.
20 mg sample, 20 ml (2% HNO3), 100oC, microwave
digestion. For each element, the same letters on
different bars indicate no significant difference (p >
0.05) between them, whereas different letters on
different bars indicate a significant difference (p <
0.05) between them.
……. 49
Figure 3.4 Effect of digestion time (30, 60 or 90 min) on recovery.
20 mg sample, 20 ml (2% HNO3), 100oC, Hot plate
digestion. For each element, the same letters on
different bars indicate no significant difference (p >
0.05) between them, whereas different letters on
different bars indicate a significant difference (p <
0.05) between them.
……. 49

xi
Figure 3.5 A comparison of microwave vs hot plate digestion. 20
mg sample, 20 ml (2% HNO3), 100oC.
……. 50
Figure 4.1 TSI fluidized bed aerosol generator with particle
removal setup to control aerosol output rate to 1-5 mg
h-1
.
……. 65
Figure 4.2 Schematic diagram of the PILS; for the continuous
collection of UO2 and UF4 particles into the liquid
stream.
……. 66
Figure 4.3 PILS running with water as sample transport liquid:
UO2 particle mass recovery (%) in different lines
during four successive experimental run at the sample
air flow rate of 10 l min-1
, water flow rate for steam
generation of 1.5 ml min-1
and transport liquid flow rate
of 0.4 ml min-1
.
……. 71
Figure 4.4 PILS running with water: particle build-up on
impaction surface and blockage in liquid collection
lines.
……. 73
Figure 4.5 UO2 particle mass collection efficiency (%) in sample
line at different sample air flow rates and transport
liquid flow rates.
……. 77
Figure 4.6 UF4 particle mass collection efficiency (%) in the
sample line at different sample air flow rates and
transport liquid flow rates.
……. 77
Figure 4.7 UO2 particle mass collection efficiency (%) in the
impactor drain at different sample air flow rates and
transport liquid flow rates.
……. 78
Figure 4.8 UF4 particle mass collection efficiency (%) in the
impactor drain at different sample air flow rates and
transport liquid flow rates.
……. 78
Figure 4.9 UO2 particle mass recovery (%) in the PILS unit’s
different lines at different sample air flow rates and
transport liquid flow rates (Note: UO2 percentage
recovery in filter + cold trap is too small to see clearly
on the graph).
……. 81
Figure 4.10 UF4 particle mass recovery (%) in the PILS unit’s
different lines at different sample air flow rates and
transport liquid flow rates.
……. 82

xii
Figure 5.1 Schematic diagram of the PILS for the continuous
collection of particle into the liquid stream.
……. 97
Figure 5.2 Uranium concentrations during July and August 2010. ……. 103
Figure 5.3 A comparison of uranium concentrations in
atmospheric aerosols collected using high volume air
sampler vs the PILS.
……. 104
Figure 5.4 Uranium concentrations measured using the PILS (with
digestion vs without digestion).
……. 106

xiii
LIST OF TABLES
Table 2.1 UO2 and UF4 particle size distribution. ………. 31
Table 2.2 UO2 - initial dissolution rate and solution pH as a
function of various combinations of sodium carbonate
and hydrogen peroxide solution.
………. 31
Table 2.3 UF4 - initial dissolution rate and solution pH as a
function of various combinations of sodium carbonate
and hydrogen peroxide solution.
………. 31
Table 3.1 Instrumental operating conditions and data acquisition
parameters.
………. 43
Table 4.1 UO2 and UF4 particle size distribution. ………. 66
Table 5.1 Instrumental operating conditions and data acquisition
parameters.
………. 101

1
Chapter 1
Introduction
2
1.1 Introduction
The effects of poor air quality on human health are well-known and principally affect
the body’s respiratory system and the cardiovascular system [1]. The pollutant species
most often of concern are carbon dioxide (CO2), carbon monoxide (CO),
hydrocarbons (HC), ozone (O3), nitrogen oxides (NOx), particulate matter (PM),
sulphur dioxide (SO2), and lead (Pb).
Particulate matter (PM) consists of a complex mixture of organic and inorganic
substances depending on the source. Particulate matter is classified on the basis of its
aerodynamic diameter (i.e. the diameter of a sphere of unit density) or particle size.
The most commonly used fractions are
• TSP : Total suspended particles, comprises all particles
• PM10 : Particles with an aerodynamic diameter less than 10 µm
• PM2.5 : Particles with an aerodynamic diameter less than 2.5 µm
• Coarse fraction: Aerodynamic diameter between 2.5 and 10 µm
Particles emitted directly into the air are known as direct or primary particulate matter,
while other particles formed indirectly in the atmosphere from chemical reactions of
gaseous pollutants are known as secondary particulate matter. Particulate matter can
remain in the air from a few hours to several days and can be transported over long
distances.
3
There is increasing interest in determining the concentration of contaminants in
aerosols (defined as solid and liquid particles suspended in air) in order to assess their
impact on the environment and human health. It is also very important to continuously
monitor particulate matter releases to the environment from industry in order to
control them and be compliant with regulatory standards. Due to the health effects of
PM, many standards have been set by various governments for the maximum amount
of pollutant emissions released from industry to the environment. Most of the national
ambient air quality standards (NAAQS) for aerosols are based on particles smaller
than 10 µm in aerodynamic diameter (PM10 and PM2.5) [2]. Atmospheric aerosol
measurements were extensively reviewed by McMurry [3] and Chow [4]. Particulate
matter chemical composition measurement frequently requires the collection of
representative samples, sample pretreatment / dissolution prior to chemical analysis.
1.2 Aerosol chemical composition measurements
1.2.1 Sample collection methods
Sampling of atmospheric particulates is a first step towards the continuous monitoring
of heavy metal releases from industry to the environment. Aerosol chemical
composition measurement can be performed using offline or continuous sampling
methods. Atmospheric particulate uranium and rare earth elements are normally
collected using offline techniques such as filters and impactors.

4
1.2.1.1 Off-line measurements
To date, measurements of particle composition are typically performed off-line by
collecting particles on filters or other media, for a period of time ranging from hours
to days, depending on the sample air flow rate and particle concentration. A filter is
weighed before and after sampling and the concentration of PM is determined from
the increase in filter mass divided by the volume of air sampled. The US
Environmental Protection Agency (EPA) has well-established reference methods to
obtain the best results when sampling particulate matter on filters using high-volume
and low-volume samplers for different concentrations and particle sizes [5]. Different
types of filters including fiber, membrane and granular bed filters have been used to
collect aerosols [4-7]. The material of choice depends on several factors such as
mechanical, chemical and temperature stability of the filter, blank concentration, flow
resistance and loading capacity [4].
The major disadvantage with traditional sample collection techniques is the usually
long sampling time, depending on the particle concentrations in the air. Other
problems that may be associated with filter measurements include: adsorption of
vapors onto the substrate (positive artifact) [8-13], evaporation losses of semi-volatile
compounds during and after sampling (negative artifact) [3, 4, 14-19], contamination
of filters during filter loading in the field [4] and reactions between collected particles,
gases and the filter substrate [16]. Loss of samples or contamination can also occur
due to particle removal from the gas, the chemical composition of the aerosol, the
filter material, changes in temperature, and pressure changes within the sampler

5
during sampling. Combined, these problems during filter preparation, sampling,
sample collection, transportation and storage before analysis can lead to significant
uncertainties in the results.
Atmospheric particulate uranium is normally collected on filters. Most of the
previously reported concentrations of particulate uranium in air are based on this
method, usually with long sampling times. For example, an atmospheric uranium
concentration as high as 200 ng m-3
has been reported near a nuclear fuel production
plant (based on 1 week sampling time) [20-22]. In another study [23], atmospheric
particulate uranium was collected on filters over a 24 hour period using a high volume
air sampler and over a one week period using a low air flow rate air sampler; the
reported average particulate uranium concentration in the air at urban and rural
locations within New York State, ranged from 0.10 to 1.47 ng m-3
.
Thus, atmospheric particulate matter collection using filtration techniques requires a
long period of time, from 24 hours to a week, to collect the required minimum sample
mass for analysis and therefore cannot provide time-dependent information (variation
over a short time period). In addition, filter based sampling is labor intensive because
the filter needs to be conditioned before sampling, weighed before and after the
sampling, and installed and removed from the filter holder and sampling instrument.
Results may not be available in a timely fashion because of the long sampling period,
the time elapsed between sample collection, sample preparation and analysis.
Therefore, atmospheric particle collection on filters using a high volume sampler is
not suitable for investigating short time frame variations in atmospheric trace metal
concentrations since it takes a long time to collect enough sample mass for analysis.
In the case of heavy metal release from industry, continuous emission monitoring is
important for either continual compliance or to determine exceedances from
6
regulatory standards. Therefore it is important to develop a continuous monitoring
method that can provide information on variation in atmospheric trace metal
concentrations.
A common alternative type of aerosol sampler is the impactor. An impactor is an
instrument in which particle impaction in a non-rotating flow is the basic mechanism
of particle capture. In a conventional impactor, air carrying the particles passes
through a single jet nozzle and particles are collected by impaction onto a flat plate.
Only particles larger than the cut-off size of the impactor are collected on the plate;
smaller particles follow the streamline and leave the system or enter a series of
impactor stages (in the case of a cascade impactor), each with a successively smaller
cut-off size in order to collect particles with differing size ranges. Generally, inertia
impactors can be used over a wide range of impactor cut-off sizes from 0.005 µm to
approximately 50 µm [24]. The MOUDI cascade impactor (MSP Corporation,
Minnesota, USA) is used regularly to collect size-fractionated particles (0.032 – 18
µm, with as many as 10 impactor stages) in many size intervals at the same time.
Particle bounce is an inherent problem with impactors; however coated (e.g. with
greases and oils) substrates largely eliminate bounce and are commonly used for
atmospheric sampling [3].
Cyclones are another type of off-line instrument that can separate particles according
to their aerodynamic diameter. In cyclone samplers, a jet of air containing particles
enters tangentially into the cylinder / conical chamber and then swirls downwards.
Particles with sufficient inertia cannot follow the air streamline and deposit on the

7
inner walls of the cyclone or collect on the bottom of the cyclone, while finer particles
remain in the air streamline and leave the system through the outlet at the top.
Cyclones are very popular for aerosol sampling to separate larger particles from
smaller particles (e.g. coarse fractions from PM2.5). Most of the cyclones used are
single stage, examples of which include, the Cyclone PM1.0, Cyclone PM2.5 and
Cyclone PM10 (URG Corporation, Chapel Hills NC, USA and BGI Incorporated.
Waltham, MA, USA). A cascade version of the cyclone sampler, designed for gas
emissions stack sampling, consists of 5 stages with cut-off sizes ranging from 0.32 to
5.4 µm at a sampling flow rate of 28.3 l min-1
[25]. Cyclone samplers are not easily
subjected to errors due to particle bounce and they have a large capacity for particle
loading.
1.2.1.2 Continuous or semi-continuous measurements
To overcome artifacts associated with off-line aerosol measurements, several real-
time or near real-time methods for the measurement of aerosol mass concentrations
have been explored. Buhr et al. (1995) [26] developed an automated method that
collects particulate matter on a frit surface, which is continuously flushed with de-
ionized water. Anders et al. [27] developed a method where the particles were directly
impacted on flowing liquid and then analysed. In the system devised by Shaorong et
al. [28], particles are charged and collected on the surface of an electrode, which is
periodically washed with de-ionized water for sample collection and analysis. The
Aerosol-to-Liquid Particle Extraction System (ALPES), developed by the Savannah
River Technology Center (SRTC) and Oak Ridges National Laboratory (ORNL), is

8
another useful device for the monitoring of particulate matter [29]. APLES is a dual
mechanism collection system in which ambient air is drawn in at an air flow rate of
300 l min-1
, then an ionization section is used to ionize the particles and finally a
liquid collection medium is employed for capturing the particles.
It is known that very small particles are difficult to collect by impaction [30]. To
overcome this problem, the concept of growing the aerosol particle size with steam
prior to particle collection was introduced. The particle-into-liquid sampler (PILS)
was developed by Weber et al. [31] based on the work of Simon and Dasgupta [32].
A sample of air is introduced into the PILS system using a vacuum pump and the flow
rate is controlled by a critical orifice, which is placed at the exit of the PILS system.
At the entrance of the PILS the air is mixed with steam to obtain a supersaturated
environment in which particles grow. This is followed by collection of the particles
by inertial impaction onto a quartz plate (the impaction plate), which is continuously
washed with a steady stream of water. Originally the PILS was coupled only to two
ion chromatographs for separate anion and cation analysis, but it has the ability to
connect with other analytical instruments for online sample analysis. The PILS
collection efficiency for particle diameters between 0.03 to 10 µm is greater than 97%
and can be coupled to an analytical technique for the continuous measurement of
aerosol composition [33].

9
1.2.2 Sample preparation
Sample preparation/digestion is a critical step in continuous monitoring of heavy
metals in air samples. For most analytical techniques involving the measurement of
particulates, it is first necessary to dissolve the particle samples prior to elemental or
isotopic analysis. Samples can be prepared using different techniques such as particle
dissolution in alkaline solutions or acid digestion in an open, closed or flow through
digestion system using a conventional or microwave heat source. Commonly used
acids include nitric acid, sulfuric acid, hydrogen peroxide, perchloric acid,
hydrochloric acid and hydrofluoric acid or any combination of all these acids. Open
vessel acid digestion using a hot plate is the oldest and simplest method of sample
preparation. This is an inexpensive system that operates at atmospheric pressure and
so does not suffer from problems associated with pressure build-up; however open
vessel acid digestion using a hotplate is limited by a low maximum digestion
temperature that cannot exceed the boiling point of the acid at ambient pressure. Other
disadvantages are that it is relatively slow, it may create a temperature gradient within
the sample, there is the risk of contamination, a large amount of acid is required and
there is the danger of loss of trace elements.
Abu-Samra et al. [34] first used microwaves as a heating source for digestion in 1975.
Since 1975, much research has been carried out using microwave digestion to
improve the technique’s efficiency for different types of environmental samples [35].
The closed vessel digestion method involves placing the sample in a closed vessel to
achieve a reaction temperature above the atmospheric boiling point of the acid. Thus

10
the reaction rate is increased but the reaction time is decreased. However, excessive
pressure build-up during the digestion of samples with high organic content, can lead
to rupturing of the sealed vessel. The move to a microwave digestion approach offers
many advantages over conventional methods including a reduction in digestion time
and the ability to digest difficult matrices; however sample digestion remains multi-
step and labor intensive. These problems can be overcome or controlled by adopting a
continuous-flow microwave digestion system. The concept of online continuous flow
microwave digestion at higher temperatures and pressures has been discussed in the
literature and has resulted in significant time savings compared with batch microwave
digestion [36, 37].
This study focuses on the dissolution of uranium dioxide (UO2) and uranium
tetrafluoride (UF4) particles because of their use in the nuclear fuel processing
industry. A microwave digestion method was also developed for the determination of
trace level rare earth elements (REE) because significant quantities of rare earth
oxides are found in tailings of uranium ore and now are widely used in different
industries. Unfortunately, there is limited information regarding the dissolution of
uranium tetrafluoride, although it is known to be slightly soluble in water and more
soluble in concentrated acids and alkalis [38-40]. There have been many studies
investigating the dissolution of UO2 powder / pellets in acidic media, such as
phosphoric acid (H3PO4) [41, 42] and sulphuric acid (H2SO4) [43-45], with the most
commonly used being nitric acid [46-52].
11
In addition, the dissolution of UO2 using supercritical carbon dioxide (CO2) [53, 54]
and also alkaline solutions [55, 56] has been extensively reviewed. Carbonate
solutions, in particular, exhibit a high capacity for dissolved uranium. Peper et al. [57]
studied the dissolution kinetics of UO2 powder at room temperature using various
oxidants (K2SO4, NaOCl, H2O2) in alkaline solutions. They found that hydrogen
peroxide (H2O2) provided the most rapid initial dissolution rate; as well, the initial
dissolution rate of UO2 increased with increasing hydrogen peroxide concentration.
1.2.3 Sample Analysis
Chemical analysis of collected samples is the final step towards aerosol chemical
composition measurements. Several analytical techniques, including for example,
instrumental neutron activation analysis (INAA) [58-60], atomic absorption
spectrometry (AAS) [61, 62], X-ray fluorescence (XRF) [63-66] and inductively
coupled plasma mass spectrometry (ICP-MS) [67-77] have been used for the
determination of uranium and REEs in different environmental samples (see [78-80]
for operating principles and more details on the application of these analytical
methods). In this study, ICP-MS and x-ray fluorescence (XRF) spectrometry were
used for the measurement of uranium or rare earth element concentrations in the
samples. Specifically, XRF was used to analyze liquid samples collected from the
particle-into-liquid-sampler system because the particle concentrations were relatively
high. For ambient air samples, ICP-MS was used instead due to its low detection
limits.

12
XRF is a nondestructive analysis that can be used to determine the total concentration
of elements including uranium and REEs in liquid, solid and powder samples. The
detection limit of XRF is in the parts per million (ppm) range and analysis cannot
distinguish variation among isotopes of an element. X-ray fluorescence (XRF) has
been used often to determine REEs [65, 66], uranium and other actinides [81-83] in a
variety of matrices because it has advantages such as rapid sample analysis, minimum
sample handling, relatively low cost and it is non-destructive. Inductively coupled
plasma mass spectrometry (ICP-MS) is a powerful analytical technique, which allows
the simultaneous detection of almost all elements. The advantages of ICP-MS include
quick and accurate sample analysis, low detection limits as well as the determination
of multiple elements and isotopes simultaneously.
Atmospheric particulate uranium typically collected on air filters requires long
sampling time (depending on the flow rate and particle concentration in the air),
followed by sample preparation and then analysis by various methods, including ICP-
MS, alpha spectrometry, or X-ray fluorescence (XRF). Previously, most reported
concentrations of particulate uranium in the air were based on one week air particulate
sampling on filters and analysis by ultraviolet fluorometry, fission track analysis or
mass spectrometry [21, 23, 84]. Querol et al. [85], and Singh and Wrenn [86]
collected air particulate samples on cellulose filters and analyzed them with
instrumental neutron activation analysis (INNA) (detection limit 0.03 µg per filter)
and with alpha spectrometry (detection limit of 0.02 dpm/L for 238
U; 27 ng l-1
)
respectively. In another study, Boomer and Powell [67] collected air particulate
samples on glass fiber filters, digested them in nitric acid and finally analyzed them
using ICP-MS and found a detection limit of 0.1 µg l-1
in the final solution. Uchida et

13
al. [87] measured uranium (238
U) at a detection limit of less than 0.1 ppt using ICP-
MS, making it a suitable instrument for the measurement of uranium concentrations in
environmental samples.
1.3 Proposed research
The main purpose of the present study is to further our understanding of continuous
emission monitoring using a particle-into-liquid-sampler system. The information
gained in this study could help improve the continuous monitoring of particulate
contaminants, especially uranium.
Specifically, three questions are addressed in this study: (1) Is it possible to use a
particle-into-liquid sampler (PILS) instead of filters for the continuous collection of
uranium-containing particulates? (2) Is it possible to dissolve uranium containing
particulates into the PILS system or digest particles using low acid concentrations
after collection in liquid? (3) Can ICP-MS be combined with the PILS for the
continuous measurement of ambient particulate uranium concentrations in the air?
For the nuclear industry it is very important to continuously monitor uranium release
into the environment for control purposes and compliance with emission standards. A
fluidized bed aerosol generator was used to generate high purity UO2 and UF4
aerosols at a rate of 1 – 5 mg h-1
to simulate stack conditions. Uranium dioxide (UO2)
and uranium tetrafluoride (UF4) particles that were generated were used for the

14
optimization of the PILS for the continuous collection of particles into liquid.. An
aqueous carbonate solution used as a sample transport liquid in the PILS to dissolve
UO2 and UF4 particles within the system and finally elemental analysis was carried
out using XRF or ICP-MS.
Significant quantities of rare earth oxides are found in tailings of uranium ore and
now widely use in other industries. Therefore, a microwave digestion method was
also developed for the digestion of six commonly used rare earth oxides, including
praseodymium oxide (Pr6O11), neodymium oxide (Nd2O3), samarium oxide (Sm2O3),
gadolinium oxide (Gd2O3), dysprosium oxide (Dy2O3) and ytterbium oxide (Yb2O3)
using 2% (v/v) nitric acid. Because particles of these rare earth oxides have different
physical and chemical characteristics (including density, solubility, and stability), it is
anticipated that in the future, the PILS can be optimized for these particles as well.

15
1.4 References
1. Health-Canada Air Quality and Health.; ISBN: 978-0-662-44819-8, Cat. No.:
H128-1/07-496-8E. HC Pub.: 4473: 2007.
2. EPA, 40 CFR Part 50 – National Ambient air quality standards for particulate
matter. In Environmental Protection Agency: 1997.
3. McMurry, P. H., A review of atmospheric aerosol measurements. Atmospheric
Environment 2000, 34, 1959-1999.
4. Chow, J. C., Measurement methods to determine compliance with ambient air
quality standards for suspended particles. Journal of the Air and Waste
Management Association 1995, 45, 320-382.
5. EPA, Integrated sampling of suspended particular matter (SPM) in ambient air.
Compendium chapter IO-2. In Environmental Protection Agency: 1999.
6. Lee, K. W.; Mukund, R., Filter Collection. In Aerosol Measurement:
Principles, Techniques and Applications, 2nd ed.; Baron, P. A.; Willeke, K.,
Eds. A John Wiley & Sons, Inc: New Jersey, 2005; pp 197-228.
7. EPA, Selection, Preparation and extraction of Filter Material, Compendium
Method IO-3.1. In Environmental Protection Agency: 1999.
8. McMurry, P. H.; Zhang, X. Q., Size Distribution of Ambient Organic and
Elemental Carbon. Aerosol Science and Technology 1989, 10, 430-437.
9. Hering, S. V.; Appel, B. R.; Cheng, W.; Salaymeh, F.; Cadle, S. H.; Mulawa,
P. A.; Cahill, T. A.; Eldred, R. A.; Surovik, M.; Fitz, D.; Howes, J. E.; Knapp,
K. T.; Stockburger, L.; Turpin, B. J.; Huntzicker, J. J.; Zhang, X.-Q.;
McMurry, P. H., Comparison of Sampling Methods for Carbonaceous
Aerosols in Ambient Air. Aerosol Science and Technology 1990, 12, 200-213.
10. Volckens, J.; Leith, D., Filter and electrostatic samplers semivolatile aerosols:
Physical artifacts. Environmental Science and Technology 2002, 36, 4613-
4617.
11. McDow, S. R.; Huntzicker, J. J., Vapor Adsorption Artifacts in the Sampling
of Organic aerosol: Face Velocity Effects. Atmospheric Environment 1990,
24A, 2563-2571.
12. Eatough, D. J.; Aghdale, N.; Cottam, M.; Gammon, T.; Hansen, L. D.; Lewis,
E. A.; Farber, R. J., Loss of semi-volatile Organic compounds from particles
during sampling on filters. In Transactions: Visibility and fine particles,
Mathai, C. V., Ed. Air and waste management Association: Pittsburgh, PA,
1990; pp 146-156.
13. Turpin, B. J.; Huntzicker, J. J.; Hering, S. V., Investigation of organic aerosol
sampling artifacts in the Los Angeles basin. Atmospheric Environment 1994,
28, 3061-3071.
14. Appel, B. R.; Tokiwa, Y., Atmospheric particulate nitrate sampling errors due
to reactions with particulate and gaseous strong acids. Atmospheric
Environment 1981, 15, 1087-1089.
15. Dunwoody, C. L., Rapid Nitrate Loss from PM-10 Filters. Journal of Air
Pollution Control Association 1986, 36, 817-818.
16. Smith, J. P.; Grosjean, D.; Jr., J. N. P., Observation of significant losses of
particulate nitrate and ammonium from high volume glass fiber filter samples
stored at room temperature. Journal of Air Pollution Control Association 1978,
28, 930-933.

16
17. Wang, H.-C.; John, W., Characteristics of the Berner Impactor for Sampling
Inorganic Ions. Aerosol Science and Technology 1988, 8, 157-172.
18. Witz, S.; Eden, R. W.; Wadley, M. W.; Dunwoody, C.; Papa, R. P.; Torre, K.
J., Rapid loss of particulate nitrate, chloride, and ammonium on quartz filters
during stroge. Journal of Air Waste Management Association 1990, 40, 53-61.
19. Eatough, D. J.; Wadsworth, A.; Eatough, D. A.; Crawford, J. W.; Hansen, L.
D.; Lewis, E. A., A Multiple-system, multi-channel diffusion denuder sampler
for the determination of fine-particulate organic material in the Atmosphere.
Atmospheric Environment 1993, 27A, 1213-1219.
20. Tracy, B. L.; Meyerhof, D. P., Uranium concentration in air near a Canadian
uranium refinery. Atmospheric Environment 1987, 21, 165-172.
21. Ahier, B. A.; Tracy, B. L., Evaluating the radiological impact of uranium
emissions in Port Hope, Ontario – A comparison of monitoring and modeling.
Journal of Environmental Radioactivity 1997, 34, 187-205.
22. Al-Khayat, T. A. H.; Eygen, B. v.; Hewitt, C. N.; Kelly, M., Modelling and
measurement of the dispersion of radioactive emissions from a nuclear fuel
fabrication plant in the U.K. Atmospheric Environment 1992, 26A, 3079-3087.
23. McEachern, P.; Myers, W. G.; White, F. A., Uranium concentration in surface
air at rural and urban localities within New York State. Environmental Science
and Technology 1971, 5, 700-703.
24. Mora, J. F. d. l.; Hering, S. V.; Rao, N.; McMurry, P. H., Hypersonic
impaction of ultrafine particles. Journal of Aerosol Science 1990, 21, 169-187.
25. Marple, V. A.; Olson, B. A.; Rubow, K. L., Inertia, gravitational, centrifugal,
and thermal collection techniques. In Aerosol measurement – Principles,
techniques and applications, 2nd ed.; Baron, P. A.; Willeke, K., Eds. A John
Wiley & Sons, Inc: New Jersey, 2005.
26. Buhr, S. M.; Buhr, M. P.; Fehsenfeld, F. C.; Holloway, J. S.; Karst, U.; Norton,
R. B.; Parrish, D. D.; Sievers, R. E., Development of a semi-continuous
method for the measurement of nitric acid vapor and particulate nitrate and
sulfate. Atmospheric Environment 1995, 29, 2609-2624.
27. Karlsson, A.; Irgum, K.; Hansson, H.-C., Single-stage flowing liquid film
impactor for continuous on-line particle analysis. Journal of Aerosol science
1997, 28, 1539-1551.
28. Liu, S.; Dasgupta, P. K., Automated System for Chemical Analysis of
Airborne Particles based on Corona-Free Electrostatic collection. Analytical
Chemistry 1996, 68, 3638-3644.
29. Cable-Dunlap, P.; DeGange, J. J.; Nichols, L. S.; Duckworth, D. C.; Park, S.
H.; Berkel, G. J. v., Interface of a particle collector with an on-line
electrochemically-modulated separation system for analysis for airborne
radioisotopes. Journal of Radioanalytical and Nuclear Chemistry 2005, 263,
177-181.
30. McKenna, J. D.; Turner, J. H.; Jr, J. P. M., Fine particle (2.5 microns)
emissions: regulations, measurement, and control. John Wiley & Sons, Inc:
Hoboken, New Jersey, 2008.
31. Weber, R. J.; Orsini, D.; Daun, Y.; Lee, Y.-N.; Klotz, P. J.; Brechtel, F., A
Particle-into-Liquid collector for rapid measurement of aerosol bulk chemical
composition. Aerosol Science and Technology 2001, 35, 718-727.
32. Simon, P. K.; Dasgupta, P. K., Continuous Automated Measurement of
gaseous and Nitrous and Nitric Acids and Particulate Nitrite and Nitrate.
Environmental Science and Technology 1995, 29, 1534-1541.

17
33. Orsini, D. A.; Ma, Y.; Sullivan, A.; Sierau, B.; Baumann, K.; Weber, R. J.,
Refinement to the particle-into-liquid sampler (PILS) for ground and airborne
measurements of water soluable aerosol composition. Atmospheric
Environment 2003, 37, 1243-1259.
34. Abu-Samra, A.; Morries, J. S.; Koirtyohann, S. R., Wet ashing of some
biological samples in microwave oven. Analytical Chemistry 1975, 47, 1475-
1477.
35. Lamble, K. J.; Hill, S. J., Microwave digestion procedure for environmental
matrices. Analyst 1998, 123, 103R-133R.
36. Stewart, L. J. M.; Barnes, R. M., Flow-through, microwave-heated digestion
chamber for automated sample preparation prior to inductively coupled
plasma spectrochemical analysis. Analyst 1994, 119, 1003-1010.
37. Kim, Y. D.; Lee, G. H.; Kim, H. S.; Kim, D. S.; Kwang Kyu Park.,
Development of continuous flow microwave digestion procedures for analysis
of trace metal oxides in water using ion chromatography. Bulletin of the
Korean Chemical Society 1994, 15, 786-791.
38. Zavodska, L.; Kosorinova, E.; Scerbakova, L.; Lesny, J., Environmental
chemistry of uranium In Hungarian Electronic Journal of Sceicne - HU ISSN
1418-7108: HEJ Manuscript no.: ENV-081221-A, 2008.
39. Wise, W. M.; Soehnlin, H. R.; McBride, C. H., An improved method for
dissolution of uranium tetrafluoride. Analytical Chemistry 1962, 34, 1035.
40. Lukyanychev, Y. A.; Nikolaev, N. S., The solubility of uranium tetrafluoride
in aqueous solutions of acids. Atomic Energy 1963, 15, 1184-1187.
41. Stromatt, R. W.; Connally, R. E., Determination of the stoichiometry of
uranium dioxide by controlled potential coulometry. Analytical Chemistry
1961, 33, 345-346.
42. Takeishi, H.; Muto, H.; Aoyagi, H.; Adachi, T.; Izawa, K.; Yoshida, Z.;
Kawamura, H., Determination of oxygen/uranium ratio in irradiated uranium
dioxide based on dissolution with strong phosphoric acid. Analytical
Chemistry 1986, 58, 458-462.
43. Habashi, F.; Thurston, G. A., Kinetics and mechanism of the dissolution of
uranium dioxide. Energia Nuclearel 1967, 14, 238-244.
44. Shying, M. E., Oxide dissolution mechanisms – III: Surface activation in the
system uranium dioxide – sulphuric acid. Journal of Inorganic and Nuclear
Chemistry 1973, 35, 3299-3305.
45. Murty, B. N.; Yadav, R. B.; Ramamurthy, C. K.; Syamundar, S.,
Spectrophotometric determination of the oxygen to uranium ratio in uranium
oxides based on dissolution in sulphuric acid. Talanta 1991, 38, 1335-1340.
46. Shabbir, M.; Robins, R. G., Kinetics of the dissolution of uranium dioxide in
Nitric acid - I. Journal of Applied Chemistry 1968, 18, 129-134.
47. Shabbir, M.; Robins, R. G., Kinetics of the dissolution of uranium dioxide in
Nitric acid - II. Journal of Applied Chemistry 1969, 19, 52-56.
48. Ikeda, Y.; Yasuike, Y.; Takashima, Y.; Park, Y.-Y.; Asano, Y.; Tomiyasu, H., 17
O NMR study on dissolution reaction of UO2 in nitric acid mechanism of
electron transfer. Journal of Nuclear Science and Technology 1993, 30, 962-
964.
49. Asano, Y.; Kataoka, M.; Ikeda, Y.; Hasegawa, S.; Takashima, Y.; Tomiyasu,
H., New method for dissolving UO2 using ozone. Progress in Nuclear Energy
1995, 29, 243-249.

18
50. Ikeda, Y.; Yasuika, Y.; Nishimura, K.; Hasegawa, S.; Takashima, Y., Kinetics
study on dissolution of UO2 powders in nitric acid. Journal of Nuclear
Materials 1995, 224, 266-272.
51. Sasaki, S.; Wada, Y.; Tomiyasu, H., Basic study of photochemistry for
application to advanced nuclear fuel cycle technology. Progress in Nuclear
Energy 1998, 32, 403-410.
52. Kim, E.-H.; Hwang, D.-S.; Yoo, J.-H., Dissolution mechanism of UO2 in nitric
acid solution by photochemical reaction. Journal of Radioanalytical and
Nuclear Chemistry 2000, 245, 567-570.
53. Tomioka, O.; Meguro, Y.; Enokida, Y.; Yamamoto, I.; Yoshida, Z.,
Dissolution behavior of uranium oxide with supercritical CO2 using HNO3-
TBP complex as a reactant. Journal of Nuclear Science and Technology 2001,
328, 1097-1102.
54. Samsonov, M. D.; Wai, C. M.; Lee, S.-C.; Kulyako, Y.; Smart, N. G.,
Dissolution of uranium dioxide in supercritical fluid carbon dioxide. Chemical
Communications 2001, (18), 1868-1869.
55. Grambow, B. Spent fuel, dissolution and oxidation: An evaluation of literature
data; Svensk Kӓrnbrӓnslehantering AB (Swedish Nuclear fuel and waste
management Co) - Report SKB TR 89-13 - Sweden: 1989.
56. McKenzie, W. F. UO2 dissolution rates: A review; Lawrence Livermore
National Laboratory Report UCRL-ID-111663: 1992.
57. Peper, S. M.; Brodnax, L. F.; Field, S. E.; Zehnder, R. A.; Valdez, S. N.;
Runde, W. H., Kinetic study of oxidative dissolution of UO2 in aqueous
carbonate media. Industrial and Engineering Chemistry Research 2004, 43,
8188-8193.
58. Lange, P. W. D.; Venter, J. H.; Wet, W. J. D., Non-destructive neutron
activation analysis of gold and uranium in residue samples of different ore
bodies. Journal of Radioanalytical Chemistry 1969, 2, 219-228.
59. Suc, N. V.; Desai, H. B.; Parthasarathy, R.; Gangadharan, S., Rare earth
impurities in high purity lanthanum oxide determined by neutron activation
analysis. Journal of Radioanalytical and Nuclear Chemistry; Letters 1992,
164, 321-325.
60. Orvini, E.; Speziali, M.; Salvini, A.; Herborg, C., Rare earth elements
determination in environmental matrices by INNA. Microchemical Journal
2000, 67, 97-104.
61. Martin, M. J., The determination of uranium by atomic-absorption
spectrophotometry. Analyst 1971, 96, 843-846.
62. Gupta, J. G. S., Determination of yttrium and rare-earth elements in rocks by
graphite-furnace atomic-absorption spectrometry. Talanta 1981, 28, 31-36.
63. Dragnev, T. N.; Karamanova, J.; Damianov, B., Precise non-destructive x-ray
fluorescence method for uranium and thorium concentration measurements.
Journal of Radioanalytical Chemistry 1979, 52, 439-448.
64. Berdikov, V. V.; Grigor’EV, O. I.; Iokhin, B. S., X-ray fluorescence
determination of uranium and neighbouring elements in solution. Journal of
Radioanalytical Chemistry 1982, 68, 181-192.
65. Vito, I. E. D.; Masi, A. N.; Olsina, R. A., Determination of trace rare earth
elements by X-ray fluorescence spectrometry after preconcentration on a new
chelating resin loaded with thorin. Talanta 1999, 49, 929-935.
66. Dixit, P. M., Characterization of high purity rare-earth oxides by x-ray
fluorescence method. Bulletin of Material Science 1981, 3, 371-374.

19
67. Boomer, D. W.; Powell, M. J., Determination of uranium in environmental
samples using inductively coupled plasma mass spectrometry. Analytical
Chemistry 1987, 59, 2810-2813.
68. Pedreira, W. R.; Sarkis, J. E. S.; Rodrigues, C.; Tomiyoshi, I. A.; Queiroz, C.
A. d. S.; Abrao, A., Determination of trace amounts of rare earth elements in
highly pure praseodymium oxide by double focusing inductively coupled
plasma mass spectrometry and high-performance liquid chromatography.
Journal of Alloys and Compounds 2001, 323-324, 49-52.
69. Pedreira, W. R.; Sarkis, J. E. S.; Rodrigues, C.; Tomiyoshi, I. A.; Queiroz, C.
A. d. S.; Abrao, A., Determination of trace amounts of rare earth elements in
high pure lanthanum oxide by sector field inductively coupled plasma mass
spectrometry (HR ICP-MS) and high-performance liquid chromatography
(HPLC) techniques. Journal of Alloys and Compounds 2002, 344, 17-20.
70. Pedreira, W. R.; Sarkis, J. E. S.; Queiroz, C. A. d. S.; Rodrigues, C.;
Tomiyoshi, I. A.; Abrao, A., Determination of trace amounts of rare-earth
elements in highly pure neodymium oxide by sector field inductively coupled
plasma mass spectrometry (ICP-SFMS) and high-performance liquid
chromatography (HPLC) techniques. Journal of Solid State Chemistry 2003,
171, 3-6.
71. Pedreira, W. R.; Queiroz, C. A. d. S.; Abrao, A.; Pimentel, M. M.,
Quantification of trace amounts of rare earth elements in high purity
gadolinium oxide by sector field inductively coupled plasma mass
spectrometry (ICP-MS). Journal of Alloys and Compounds 2004, 374, 129-
132.
72. Pedreira, W. R.; Queiroz, C. A.; Abrao, A.; Rocha, S. M.; Vasconcellos, M. E.
d.; Boaventura, G. R.; Pimentel, M. M., Trace amounts of rare earth elements
in high purity samarium oxide by sector field inductively coupled plasma mass
spectrometry after separation by HPLC. Journal of Alloys and Compounds
2006, 418, 247-250.
73. Shibata, N.; Fudagawa, N.; Kubota, M., Electrothermal vaporization using a
tungsten furnace for the determination of rare-earth elements by inductively
coupled plasma mass spectrometry. Analytical Chemistry 1991, 63, 636-640.
74. Kawabata, K.; Kishi, Y.; Kawaguchi, O.; Watanabe, Y.; Inoue, Y.,
Determination of rare-earth elements by inductively coupled plasma mass
spectrometry with ion chromatography. Analytical Chemistry 1991, 63, 2137-
2140.
75. Li, B.; Zhang, Y.; Yin, M., Determination of trace amounts of rare earth
elements in high-purity cerium oxide by inductively coupled plasma mass
spectrometry after separation by solvent extraction. Analyst 1997, 122, 543-
547.
76. Zhang, S.-X.; Murachi, S.; Imasaka, T.; Watanabe, M., Determination of rare
earth impurities in ultrapure europium oxide by inductively-coupled plasma
mass spectrometry. Analytica Chimica Acta 1995, 314, 193-201.
77. He, M.; Hu, B.; Zeng, Y.; Jiang, Z., ICP-MS direct determination of trace
amounts of rare earth impurities in various rare earth oxides with only one
standard series. Journal of Alloys and Compounds 2005, 390, 168-174.
78. Piksaikin, V. M.; Pshakin, G. M.; Roshchenko, V. A., Review of methods and
instruments for determining undeclared nuclear materials and activities.
Science and Global Security 2006, 14, 49-72.

20
79. Becker, J. S., Inorganic mass spectrometry: Principles and Applications.
Copyright ©2007 John Wiley & Sons Ltd, ISBN: 978-0-470-01200-0: West
Sussex, 2007.
80. Cullen, M., Atomic Spectroscopy in elemental analysis. Copyright © 2004
Blackwell Publishing Ltd / CRC Press LLC, ISBN: 0-8493-2817-9: FL 33431,
USA, 2004.
81. Hoffmann, P.; Pilz, N.; Lieser, K. H., Determination of uranium in various
matrices using EDXRF and excitation by different radionuclides. Journal of
Radioanalytical and Nuclear Chemistry 1989, 132, 121-129.
82. Hanif, I.; Hanif, J.; Hasany, S. M.; Iqbal, M. Z., Studies of Uranium-Cerium
admixture solutions by EDXRF spectroscopy. X-Ray Spectrometry 1995, 24,
298-306.
83. Natarajan, V.; Kulkarni, M. J.; Porwal, N. K.; Dhawale, B. A.; Hon, N. S.;
Godbole, S. V.; Manchanda, V. K., Determination of uranium content in Th, U
mixed oxides using EDXRF. Nuclear Instruments and Methods in Physics
Research, Section B: Beam interactions with material and atoms 2008, 266,
3290-3294.
84. Hamilton, E. I., The concentration of uranium in air from contrasted natural
environments. Health Physics 1970, 19, 511-520.
85. Querol, X.; Alastuey, A.; López-Soler, A.; Boix, A.; Sanfeliu, T.; Martynov, V.
V.; Piven, P. I.; Kabina, L. P.; Souschov, P. A., Trace element contents in
atmospheric suspended particles: inferences from instrumental neutron
activation analysis. Fresenius' Journal of Analytical Chemistry 1997, 357,
934-940.
86. Singh, N. P.; Wrenn, M. E., Determinations of actinides in biological and
environmental samples. Science of The Total Environment 1988, 70, 187-203.
87. Uchida, S.; Garcia-Tenorio, R.; Tagamia, K.; Garcia-Leon, M., Determination
of U isotopic ratios in environmental samples by ICP-MS. Journal of
Analytical Atomic Spectrometry 2000, 15, 889-892.

21
Chapter 2
Dissolution of uranium dioxide (UO2)
and uranium tetrafluoride (UF4)
particles in a Na2CO3-H2O2 solution

22
2.1 Abstract
The dissolution of uranium dioxide (UO2) and uranium tetrafluoride (UF4) particles in
a sodium carbonate (Na2CO3) - hydrogen peroxide (H2O2) solution at room
temperature was studied. It was found that the UO2 dissolution increases with an
increase in carbonate concentration in the solution with maximum dissolution at 5
wt % of sodium carbonate concentration in the solution. Using the optimum
concentration of Na2CO3 for the dissolution of UO2 and UF4 (i.e. 5 wt %), further
experiments were carried out with varying concentrations of H2O2 (0 - 0.3 wt %) to
determine the optimum concentration of H2O2 for the dissolution of UO2 and UF4
particles. It was found that the UO2 and UF4 dissolution rate increases with an
increase in H2O2 concentration, with the maximum initial dissolution rate at 0.15
wt % of H2O2 in the solution. UF4 particles were dissolved more rapidly i.e., higher
initial dissolution rate than UO2 particles. Within 3 minutes, complete dissolution of
100 mg of UF4 was achieved in 200 ml of 5 wt % Na2CO3 and 0.15 wt % of H2O2 at
room temperature. A sodium carbonate (5 wt %) / hydrogen peroxide (0.15 wt %)
solution was found to be the most favorable combination for the dissolution of UO2
and UF4 particles.
Keywords: Uranium dioxide, uranium tetrafluoride, sodium carbonate, hydrogen
peroxide, dissolution.

23
2.2 Introduction
Uranium is the heaviest naturally occurring radioactive element. Uranium isotopes
emit mainly alpha particles, which have little penetrating ability and so they cannot
make their way into human body tissue through skin. Thus, uranium is a health
hazard only when uranium compounds are ingested or inhaled [1]. Exposure to
uranium can cause lung cancer, kidney damage, respiratory diseases, etc [2]. Uranium
is used mainly for nuclear power plants as a fuel to generate electricity. Global
production of uranium is increasing every year [3]. Therefore, it is important to
continuously monitor uranium release into the environment.
For most analytical techniques involving the measurement of particulates, it is first
necessary to dissolve the particle samples prior to elemental or isotopic analysis.
Unfortunately, there is limited information available regarding the dissolution of
uranium tetrafluoride, although it is known to be slightly soluble in water and more
soluble in concentrated acids and alkalis [4-6]. There have been many studies
investigating the dissolution of UO2 powder / pellets in acidic media, such as
phosphoric acid (H3PO4) [7, 8] and sulphuric acid (H2SO4) [9-11], with the most
commonly used being nitric acid [12-18].
In addition, the dissolution of UO2 using supercritical carbon dioxide (CO2) [19, 20]
and also alkaline solutions [21, 22] has been extensively reviewed. Carbonate
solutions, in particular, exhibit a high capacity for dissolved uranium. Peper et al. [23]

24
studied the dissolution kinetics of UO2 powder at room temperature using various
oxidants (K2SO4, NaOCl, H2O2) in alkaline solutions. Hydrogen peroxide (H2O2)
showed the most rapid initial dissolution rate; as well, the initial dissolution rate of
UO2 increased with the increasing hydrogen peroxide concentration. Pierce et al. [24]
studied the dissolution kinetics of UO2 using carbonate, as a function of solution pH
and temperature. They reported that the dissolution rate of UO2 increased with
increasing pH and that the rate of UO2 dissolution increased by an order of magnitude
with a 30oC increase in temperature.
In the present study the dissolution of uranium dioxide (UO2) and uranium
tetrafluoride (UF4) particles was investigated. The objective was to optimize uranium
dioxide (UO2) and uranium tetrafluoride (UF4) powder dissolution in a sodium
carbonate (Na2CO3) / hydrogen peroxide (H2O2) solution at room temperature. The
overall goal was to determine experimentally the best combination of sodium
carbonate (wt %) and hydrogen peroxide (wt %) for the dissolution of high purity
uranium dioxide and uranium tetrafluoride focusing on a high initial dissolution rate.
The optimal carbonate (Na2CO3)/hydrogen peroxide (H2O2) solution then can be used
in a particle-into-liquid sampler (PILS) as a sample transport liquid for the continuous
monitoring of particulate uranium.

25
2.3 Methods
2.3.1 Reagents and standards
High purity uranium dioxide and uranium tetrafluoride particles with particle sizes
smaller than 100 µm (Table 2.1) (Cameco Corporation, Port Hope, Ontario Canada)
were used for the dissolution study. Hydrogen peroxide (H2O2) (30% W/W ACS
grade; EMD Chemicals Inc, Gibbstown, NJ, USA) and sodium carbonate (Na2CO3)
(Mallinkrodt Baker, Phillipsburg, NJ, USA) were used to dissolve the uranium
dioxide and uranium fluoride particles. Distilled de-ionized water (18.2 MΩ) was
used for the preparation of all solutions.
2.3.2 Dissolution experiments
Various concentrations of sodium carbonate / hydrogen peroxide solutions were
prepared (Na2CO3 = 0 - 7 wt % and H2O2 = 0 - 0.3 wt %). A beaker filled with 200 ml
of sodium carbonate / hydrogen peroxide solution was placed on a stir plate. 100 mg
of uranium dioxide or uranium tetrafluoride particles were weighed and added to the
sodium carbonate / hydrogen peroxide solutions. The solution was continuously
stirred and small samples (~ 5ml) were withdrawn at regular intervals (1, 3, 5, 10, 20,
30 and 60 minutes). Samples were filtered to remove any undigested material from
the solution using a 0.45 µm pore size syringe filter (VWR International).

26
2.3.3 X-ray fluorescence (XRF) analysis
An X-ray fluorescence spectrometer (Innov-X System, inc, Woburn, MA, USA) was
used in this study for the measurement of uranium concentrations in the liquid
samples. Calibration curves for uranium dioxide (0-600 mg UO2 l-1
) and uranium
tetrafluoride (0-600 mg UF4 l-1
) were created. The calibration curves were then used
to determine UO2 and UF4 particle mass dissolution in each sample.
2.4 Results and discussion
UO2 is insoluble and UF4 is slightly soluble in water. Dissolution of UO2 (Appendix 1
and Table 2.2) and UF4 (Appendix 2 and Table 2.3) was measured in solutions having
different sodium carbonate - hydrogen peroxide concentrations (using nine different
Na2CO3 - H2O2 concentration combinations for UO2 and ten combinations for UF4)
as a function of time. The experiments were carried out at room temperature.
Carbonates have been used primarily as leaching agents for the recovery of uranium
from soils and ores [25]. Carbonates form highly soluble anionic carbonate uranyl
species, uranyl tricarbonate (UO2(CO3)34-
) [25]. First, the effect of sodium carbonate
concentration (0 - 7 wt %) was studied on the dissolution of UO2 (Appendix 1 and
Figure 2.1). In the absence of sodium carbonate i.e., 0 wt %, UO2 (with 0.15 wt %
H2O2 solution) did not significantly dissolve in solution but at Na2CO3 concentrations
of 1 to 5 wt %, UO2 dissolution increased (Figure 2.1). When only H2O2 solution is
used some compounds of UO4.xH2O2 may precipitate [26], which supports our results.

27
Results indicate a significant difference (p < 0.05) in UO2 particle dissolution (%)
between 1, 3, and 5 wt % carbonate concentrations in the solution. It was also
observed that UO2 does not significantly dissolve in carbonate solution in the absence
of the oxidant (Figure 2.3). It has been previously reported that UO2 partially
dissolves in carbonate solutions and that the highest solubility occurs when Na2CO3
and H2O2 are used in combination [26]. Therefore, H2O2 was used with carbonate to
oxidize U(IV) to U(VI) prior to the formation of uranium carbonate complexes. The
general reaction (equation 2.1) for the dissolution of UO2 in the carbonate and
hydrogen peroxide solution [23] is;
____________ (2.1)
Where M+ denotes an alkali metal cation and x and y are the molar stoichiometries of
H2O2 and CO32-
, respectively. This equation suggests that various compounds of
UO2(O2)x(CO3)y2-2x-2y
may coexist with different combinations of Na2CO3 and H2O2
concentrations. Results indicate a significant difference (p < 0.05) in UO2 particle
dissolution (%) between 0.025, 0.05, and 0.15 wt % but no significant difference (p >
0.05) between 0.15 and 0.3 wt% H2O2 concentration (with 5 wt % carbonate
concentrations) in the solution (Figure 2.3). The highest initial dissolution rate was
observed at 5 wt % sodium carbonate (at H2O2 concentrations of 0.15 or 0.30 wt %;
Table 2.2) with nearly 60% of the UO2 (100 mg) being dissolved within 20 minutes;
~95% of the UO2 particles were dissolved after one hour (Figure 2.1).
UF4 particles were more readily dissolved, even in the absence of sodium carbonate
(Figure 2.2). Approximately 80 % of the UF4 was dissolved after 60 minutes even in

28
sodium carbonate free solution with only a very low concentration (0.01 wt %) of
H2O2 in the solution (Appendix 2). Results indicate a significant difference (p < 0.05)
in UF4 particle dissolution (%) between zero and 1 wt % but no significant difference
(p > 0.05) between 1, 3 and 5 wt % sodium carbonate concentrations (with 0.01 wt%
hydrogen peroxide concentrations) in the solution. Compared to UO2, rapid
dissolution of UF4 was observed with nearly 50% of the UF4 (100 mg) being
dissolved within the first 3 minutes. The highest initial dissolution rate for UF4 was
observed at 5 wt % sodium carbonate concentration, similar to the UO2 dissolution
results (Table 2.3). Therefore, a concentration of 5 wt % Na2CO3 was selected and
various concentrations of H2O2 were studied to obtain the solution concentration of
Na2CO3-H2O2 needed for maximum dissolution of UO2 and UF4 particles.
The dissolution results for 100 mg of UO2 or UF4 in 200 ml of 5 wt % of Na2CO3 and
various concentrations of H2O2 are shown in Figure 2.3 and Figure 2.4, respectively.
In the solution containing only sodium carbonate (i.e. H2O2 = 0 wt %) there was no
dissolution of UO2 particles (Appendix 1); however UO2 dissolution appears to
increase with an increase in hydrogen peroxide concentration (Figure 2.3). At H2O2
concentrations of 0.15 and 0.3 wt % there is the same initial dissolution rate of the
UO2 particles (Table 2.2, Figure 2.3). UF4 particles were dissolved more rapidly i.e.,
higher initial dissolution rate (Table 2.3, Figure 2.4) than UO2 particles. Within 3
minutes, complete dissolution of 100 mg of UF4 was achieved in 200 ml of 5 wt %
Na2CO3 and 0.15 wt % of H2O2 at room temperature (Figure 2.4 and Appendix 2).

29
Table 2.2 and Table 2.3 also show pH values of the Na2CO3-H2O2 solutions. The
variation in the solution pHs used in this study were too small to determine the effect
of solution pH on the dissolution of UF4 particles, but Pierce et al. [24] reported that
the rate of UO2 dissolution increased with an increase in solution pH.
Dissolution Time (minutes)
0 10 20 30 40 50 60 70
UO
2 Dissolution (%)
0
20
40
60
80
100
120
Na2CO3 = 0 wt %
Na2CO3 = 1 wt %
Na2CO3 = 3 wt %
Na2CO3 = 5 wt %
Na2CO3 = 7 wt %
H2O2 = 0.15 wt %
Figure 2.1: UO2 dissolution (%) in sodium carbonate (0 - 7 wt %) / hydrogen peroxide
(0.15 wt %) as a function of time.
Dissolution Time (minutes)
0 10 20 30 40 50 60 70
UF4 Dissolution (%)
0
20
40
60
80
100
120
Na2CO3 = 0 wt %
Na2CO
3 = 1 wt %
Na2CO3 = 3 wt %
Na2CO3 = 5 wt %
H2O2 = 0.01 wt %
Figure 2.2: UF4 dissolution (%) in sodium carbonate (0 - 5 wt %) / hydrogen peroxide
(0.01 wt %) as a function of time.
30
Dissolution Time (minutes)
0 10 20 30 40 50 60 70
UO
2 Dissolution (%)
0
20
40
60
80
100H2O2 = 0.000 wt %
H2O2 = 0.025 wt %
H2O2 = 0.050 wt %
H2O2 = 0.150 wt %
H2O2 = 0.300 wt %
Na2CO3 = 5.0 wt %
Figure 2.3: UO2 dissolution (%) in sodium carbonate (5 wt %) / hydrogen peroxide (0
- 0.3 wt %) as a function of time.
Dissolution Time (minutes)
0 10 20 30 40 50 60 70
UF
4 D
issolu
tion (%
)
0
20
40
60
80
100
120
H2O2 = 0.000 wt %
H2O2 = 0.005 wt %
H2O2 = 0.010 wt %
H2O2 = 0.025 wt %
H2O2 = 0.050 wt %
H2O2 = 0.150 wt %
H2O2 = 0.300 wt %
Na2CO3 = 5.0 wt %
Figure 2.4: UF4 dissolution (%) in sodium carbonate (5 wt %) / hydrogen peroxide (0
- 0.3 wt %) as a function of time.

31
Table 2.1. UO2 and UF4 particle size distribution.
Diameter (µm) UO2
Mass finer (%)
UF4
Mass finer (%)
60.0 94.4 97.5
40.0 92.2 96.1
20.0 79.4 95.2
10.0 56.3 93.9
8.0 49.0 92.1
6.0 40.9 89.9
4.0 31.5 89.0
2.0 20.1 65.5
1.0 12.5 28.3
0.5 3.5 5.0
Table 2.2. UO2 - initial dissolution rate and solution pH as a function of various
combinations of sodium carbonate and hydrogen peroxide solution.
Na2CO3-H2O2 solution UO2 - Initial dissolution
ratea
Na2CO3 conc. (wt %) H2O2 conc. (wt %) Solution pH % dissolved / minute
0 0.150 05.55 0.0
1 0.150 10.74 2.3
3 0.150 10.87 2.3
5 0.000 11.29 0.0
5 0.025 11.16 0.5
5 0.050 11.09 1.5
5 0.150 10.93 3.6
5 0.300 10.80 3.6
7 0.150 10.98 1.9 a= dissolution during the first minute.
Table 2.3. UF4 - initial dissolution rate and solution pH as a function of various
combinations of sodium carbonate and hydrogen peroxide solution.
Na2CO3-H2O2 solution UF4 - Initial dissolution
ratea
Na2CO3 conc. (wt %) H2O2 conc. (wt %) Solution pH % dissolved / minute
0 0.010 05.68 06.13
1 0.010 11.15 22.5
3 0.010 11.21 28.8
5 0.000 11.29 06.8
5 0.005 11.25 23.3
5 0.010 11.22 32.6
5 0.025 11.16 41.7
5 0.050 11.09 63.7
5 0.150 10.93 86.9
5 0.300 10.80 90.6 a= dissolution during the first minute.

32
In the present study, the dissolution of UO2 (Figure 2.1) is faster within the first 20
minutes for all the concentrations of Na2CO3 and then slows down through time, most
likely due to the decreasing concentration of free carbonate in solution, which appears
to be rate limiting at this point [23]. The initial dissolution rate of UO2 with 5 wt % of
Na2CO3 is the highest while it is the lowest for the 7 wt % of Na2CO3. Similarly,
Peper et al. [23] reported that the dissolution rate of UO2 decreases above 5 wt % of
Na2CO3, and suggest that this might be as a result of increased ionic strength or an
increased rate of H2O2 degradation.
UF4 particles were dissolved more rapidly i.e., higher initial dissolution rate than UO2
particles. Complete dissolution of 100 mg of UF4 particles was achieved (in 3 minutes)
compared to ~95% of the UO2 particles (in one hour) in 200 ml of 5 wt % Na2CO3 and
0.15 wt % of H2O2 at room temperature. The solution (5 wt % Na2CO3 and 0.15 wt %
of H2O2) was used with the PILS system as sample transport liquid. The particle-into-
liquid sampler system restricted our study for the higher concentration of H2O2 in
Na2CO3-H2O2 solution. A high concentration of H2O2 in the transport solution under a
high temperature steam may result in corrosion of the mesh and other parts of the
PILS system. In this study, UO2 particles show low initial dissolution rate at room
temperature but Pierce et al. [24] reported that the rate of UO2 dissolution increased
by an order of magnitude with a 30oC increase in temperature. The UO2 and UF4
particle diameter (particle size distribution; Table 2.1) used in this dissolution study
were much bigger than those used with the PILS optimization (smaller than 10 µm).
The smaller the particle (larger surface area) the faster the dissolution rate because
dissolution takes place at the surface. The PILS operates with steam (~100oC), so it
was anticipated that Na2CO3-H2O2 solution would dissolve uranium tetrafluoride and
33
uranium dioxide particle within the system as demonstrated by the elimination of
deposits and blockages in the PILS (Figure 4.4). Thus the Na2CO3-H2O2 solution can
be used for the sample transport liquid in the particle-into-liquid sampler for
continuous emission monitoring.
2.5 Conclusions
The dissolution of UO2 and UF4 particles in Na2CO3-H2O2 solutions was studied. The
sodium carbonate and hydrogen peroxide concentrations were optimized for higher
initial dissolution rates and maximum dissolution of UO2 and UF4 particles. UF4
particles had higher initial dissolution rates and high solubility (completely dissolved
within 3 minutes) in Na2CO3-H2O2 solutions compared to UO2 particles. A sodium
carbonate (5 wt %) / hydrogen peroxide (0.15 wt %) solution was found to be the
most favorable combination for the dissolution of UO2 and UF4 particles at room
temperature.

34
2.6 References
1. Li, W.; Skinner, R.; Megna, K.; Chen, J.; Perera, S.; Murimboh, J.; Waller, E.;
Erhardt, L.; Cornett, R. J., In vitro dissolution study of uranium dioxide and
uranium ore with different particle sizes in simulated lung fluid. Journal of
Radioanalytical and Nuclear Chemistry 2009, 279, 209-218.
2. Bleise, A.; Danesi, P. R.; Burkart, W., Properties, uses and health effects of
depleted uranium (DU): a general overview Journal of Environmental
Radioactivity 2003, 64, 93-112.
3. WNA Fact and Figures - Uranium Production Figures: 1999 – 2009.
http://www.world-nuclear.org/infomap.aspx]
4. Zavodska, L.; Kosorinova, E.; Scerbakova, L.; Lesny, J., Environmental
chemistry of uranium In Hungarian Electronic Journal of Sceicne - HU ISSN
1418-7108: HEJ Manuscript no.: ENV-081221-A, 2008.
5. Wise, W. M.; Soehnlin, H. R.; McBride, C. H., An improved method for
dissolution of uranium tetrafluoride. Analytical Chemistry 1962, 34, 1035.
6. Lukyanychev, Y. A.; Nikolaev, N. S., The solubility of uranium tetrafluoride in
aqueous solutions of acids. Atomic Energy 1963, 15, 1184-1187.
7. Stromatt, R. W.; Connally, R. E., Determination of the stoichiometry of uranium
dioxide by controlled potential coulometry. Analytical Chemistry 1961, 33, 345-
346.
8. Takeishi, H.; Muto, H.; Aoyagi, H.; Adachi, T.; Izawa, K.; Yoshida, Z.;
Kawamura, H., Determination of oxygen/uranium ratio in irradiated uranium
dioxide based on dissolution with strong phosphoric acid. Analytical Chemistry
1986, 58, 458-462.
9. Habashi, F.; Thurston, G. A., Kinetics and mechanism of the dissolution of
uranium dioxide. Energia Nuclearel 1967, 14, 238-244.
10. Shying, M. E., Oxide dissolution mechanisms – III: Surface activation in the
system uranium dioxide – sulphuric acid. Journal of Inorganic and Nuclear
Chemistry 1973, 35, 3299-3305.
11. Murty, B. N.; Yadav, R. B.; Ramamurthy, C. K.; Syamundar, S.,
Spectrophotometric determination of the oxygen to uranium ratio in uranium
oxides based on dissolution in sulphuric acid. Talanta 1991, 38, 1335-1340.
12. Shabbir, M.; Robins, R. G., Kinetics of the dissolution of uranium dioxide in
Nitric acid - I. Journal of Applied Chemistry 1968, 18, 129-134.
13. Shabbir, M.; Robins, R. G., Kinetics of the dissolution of uranium dioxide in
Nitric acid - II. Journal of Applied Chemistry 1969, 19, 52-56.
14. Ikeda, Y.; Yasuike, Y.; Takashima, Y.; Park, Y.-Y.; Asano, Y.; Tomiyasu, H., 17
O NMR study on dissolution reaction of UO2 in nitric acid mechanism of
electron transfer. Journal of Nuclear Science and Technology 1993, 30, 962-964.
15. Asano, Y.; Kataoka, M.; Ikeda, Y.; Hasegawa, S.; Takashima, Y.; Tomiyasu, H.,
New method for dissolving UO2 using ozone. Progress in Nuclear Energy 1995,
29, 243-249.
16. Ikeda, Y.; Yasuika, Y.; Nishimura, K.; Hasegawa, S.; Takashima, Y., Kinetics
study on dissolution of UO2 powders in nitric acid. Journal of Nuclear Materials
1995, 224, 266-272.
17. Sasaki, S.; Wada, Y.; Tomiyasu, H., Basic study of photochemistry for
application to advanced nuclear fuel cycle technology. Progress in Nuclear
Energy 1998, 32, 403-410.
35
18. Kim, E.-H.; Hwang, D.-S.; Yoo, J.-H., Dissolution mechanism of UO2 in nitric
acid solution by photochemical reaction. Journal of Radioanalytical and
Nuclear Chemistry 2000, 245, 567-570.
19. Tomioka, O.; Meguro, Y.; Enokida, Y.; Yamamoto, I.; Yoshida, Z., Dissolution
behavior of uranium oxide with supercritical CO2 using HNO3-TBP complex as
a reactant. Journal of Nuclear Science and Technology 2001, 328, 1097-1102.
20. Samsonov, M. D.; Wai, C. M.; Lee, S.-C.; Kulyako, Y.; Smart, N. G.,
Dissolution of uranium dioxide in supercritical fluid carbon dioxide. Chemical
Communications 2001, 18, 1868-1869.
21. Grambow, B. Spent fuel, dissolution and oxidation: An evaluation of literature
data; Svensk Kӓrnbrӓnslehantering AB (Swedish Nuclear fuel and waste
management Co) - Report SKB TR 89-13 - Sweden: 1989.
22. McKenzie, W. F. UO2 dissolution rates: A review; Lawrence Livermore
National Laboratory Report UCRL-ID-111663: 1992.
23. Peper, S. M.; Brodnax, L. F.; Field, S. E.; Zehnder, R. A.; Valdez, S. N.; Runde,
W. H., Kinetic study of oxidative dissolution of UO2 in aqueous carbonate
media. Industrial and Engineering Chemistry Research 2004, 43, 8188-8193.
24. Pierce, E. M.; Icenhower, J. P.; Serne, R. J.; Catalano, J. G., Experimental
determination of UO2(cr) dissolution kinetics: effects of solution saturation state
and pH. Journal of Nuclear Materials 2005, 345, 206-218.
25. Turney, W. R.; Mason, C. F. V.; Longmire, P.; Dander, D. C.; York, D. A.;
Chisholm-Brause, C. J.; Thomson, B. M., Carbonate heap leach of uranium-
contaminated soil. Radioactive Waste Management and Environmental
Restoration 1994, 3, 2087-2090.
26. Lee, E. H.; Lim, J. K.; Chung, D. Y.; Yang, H. B.; Yoo, J. H.; Kim, K. W., The
oxidative-dissolution behavior of fission products in a Na2CO3-H2O2 solution.
Journal of Radioanalytical and Nuclear Chemistry 2009, 281, 339-346.

36
Chapter 3
Determination of trace level rare earth
elements using microwave digestion
and inductively coupled plasma mass
spectrometry

37
3.1 Abstract
A closed vessel microwave digestion method was developed for the digestion of six
rare earth oxide powders (praseodymium oxide, neodymium oxide, samarium oxide,
gadolinium oxide, dysprosium oxide and ytterbium oxide). Twenty mg of rare earth
oxide samples were digested at 100oC for 30, 45, 60 and 90 minutes in 20 ml of nitric
acid (2 % v/v). The recoveries of the REEs in digested samples using microwave and
hot plate digestion were compared. Statistically significant differences (p < 0.05) were
observed between the microwave and hot plate methods. A combination of closed
vessel with microwave heating, 20 ml of nitric acid (2 % v/v) at 100oC for 60 minutes
yields greater than 90±5% recoveries of all six REEs. The results indicate that
microwave heating is preferable to the hot plate for the digestion of rare earth oxide
powder samples.
Keywords: High purity earth oxides, microwave digestion, hot plate digestion,
inductively coupled plasma mass spectrometry (ICP-MS), nitric acid.
38
3.2 Introduction
Air quality and human exposure to airborne pollutants has gained much attention. It is
of special concern to those living in cities where there is the potential for exposure to
greater amounts of pollutants. Atmospheric particulate matter (PM) is one of the
major pollutants of concern in ambient air. Exposure to PM has been shown to cause
adverse effects on human health in cities throughout the world in both developed and
developing countries [1]. In particular, PM with an aerodynamic size less than 10 µm
(PM10) can be inhaled by humans and cause lung damage. Previous studies have
found that morbidity and mortality rates were positively related to high PM10 levels
[2].
Rare earth elements (REEs) consist of 17 elements, including the15 lanthanides (Z=
57 - 71), and scandium (Sc) and yttrium (Y). The elemental forms of REEs are iron-
grey to silvery metals; they are soft, malleable and ductile, and they react with oxygen
to form rare earth oxides when exposed to air [3, 4]. Since the 1980s, REEs have been
used in industry as high-efficiency magnetic materials, solid metal hydrides, and high-
intensity luminescence materials [5]. Nowadays, rare earth elements are widely used,
for example, in magnets, NiMH batteries, auto catalysts, fluid cracking catalysts,
polishing powders and glass additives, colored plastics, oxygen sensors, capacitors,
cathodes, photography equipment, and in the nuclear industry [6-12]. As a result,
industrial demand for REEs has increased rapidly; global production of rare earth
elements increased from 41,047 to 94,381 metric tons from 1985 to 2001 [7].
Furthermore, large quantities of REEs are emitted into the atmosphere from industry

39
and pose potential risks to human health [13-16]. For example, significant quantities
of rare earth oxides are found in tailings of uranium ore, shale and loparite mining
[17]. Those REE particles could be suspended and transported in the air, which is
found to be the major route of REE transportation [18, 19]. Along with a worldwide
use of REEs in different industries, their emissions into the atmosphere have been
increasing. Since humans are always breathing air this may cause serious problems
for human health; therefore, it is of importance to continuously monitor REE
concentrations in air [20-22] as well as their release from the industrial stacks for
emission control purposes. Thus, we needed to develop a microwave flow digestion
method for the analysis of rare earth elements in collected samples.
To date, measurements of atmospheric PM composition are typically performed off-
line by collecting particles onto filters using a low or high volume air sampler, for a
long period of time depending on the sample air flow rate and particle concentration.
Sample analyses are conducted off-site in distant laboratories leading to transportation,
handling and time-related constraints. To overcome these constraints, continuous
emission monitoring is an important tool and would more rapidly confirm compliance
or non-compliance with regulatory permit limits. These measurements can provide
real-time feedback to control the industrial emissions of pollutants. The particle-into-
liquid sampler (PILS) [23] is a useful instrument for continuous monitoring of particle
composition, that continuously collects particles into a small volume of liquid;
however collected sample requires continuous dissolution prior to analysis.

40
Rare earth elements are usually present in the air at trace levels. Several analytical
techniques, including neutron activation analysis (NAA) [24, 25], isotope dilution
mass spectrometry (ID-MS) [26], X-ray fluorescence (XRF) [27, 28], atomic
absorption spectrometry (AAS) [29], and inductively coupled plasma atomic emission
spectrometry (ICP-AES) [30, 31] have been used for the determination of rare earth
elements. However, NAA has high cost, slow analysis time, poor precision, and
several interferences, while ID-MS cannot be used for the determination of Pr, Tb, Ho,
and Tm because these elements do not have multiple stable isotopes [30]. In addition,
other techniques such as ICP-AES and XRF are not appropriate for rare REEs
determination due to errors induced by the spectral interferences [32], and high
detection limits and poor sensitivity [33], respectively. Consequently, inductively
coupled plasma mass spectrometry (ICP-MS) is considered to be the most effective
analytical technique for the determination of REEs [8-12, 34-38]. ICP-MS has several
advantages over other techniques, including wide dynamic range, low detection limits,
isotopic information and higher sample throughput.
Most analytical techniques including ICP-MS require injection of liquid samples; thus
a dissolution or digestion step is needed for solid samples, such as atmospheric
particulate REEs. Due to their low solubility [18, 19], dissolution of REEs should be
done before analysis by ICP-MS. Normally, the dissolution procedure for rare earth
oxide samples used in most ICP-MS analysis involves open vessel digestion using
conventional heating (hot plate / oven) with concentrated nitric acid. However, high
acid concentrations in samples may decrease signal intensity and damage the cones
inside the mass spectrometer. For continuous monitoring of atmospheric REEs, it is
preferable to use low or moderate acid concentrations for sample digestion, so that

41
digested liquid samples can be introduced directly into the ICP-MS without further
dilution. Abu-Samra and co-workers [39] first reported the use of microwaves as a
heating source for sample digestion. Microwave heating offers several advantages
over conventional heating, e.g., increased temperature control, no heat waste, shorter
digestion time, minimal sample contamination and less acid required for sample
digestion.
The main purpose of this study is to develop a microwave digestion method for six
commonly used rare earth oxides, including praseodymium oxide (Pr6O11),
neodymium oxide (Nd2O3), samarium oxide (Sm2O3), gadolinium oxide (Gd2O3),
dysprosium oxide (Dy2O3) and ytterbium oxide (Yb2O3), for analysis by ICP-MS.
Recoveries of REEs using microwave digestion versus hot plate digestion are
compared as well.
3.3 Materials and Methods
3.3.1 Chemicals and standards
Milli-Q® water (18.2 MΩ.cm) was used in the preparation of all solutions. All bottles,
containers and volumetric flasks used in preparing solutions were soaked in 10%
nitric acid (HNO3) overnight and rinsed with Milli-Q water prior to use. Double
distilled nitric acid, prepared from 67 – 70% trace metal grade nitric acid (VWR,

42
West Chester, PA, USA) was used in sample preparation and dilution. Single element
calibration standards, 1000 µg ml-1
; (PlasmaCAL, SCP Science) of praseodymium
(Pr), neodymium (Nd), samarium (Sm), gadolinium (Gd), dysprosium (Dy) and
ytterbium (Yb)were used to prepare working standard solutions. High purity rare
earth oxides powders of praseodymium oxide (Pr6O11), neodymium oxide (Nd2O3),
samarium oxide (Sm2O3), gadolinium oxide (Gd2O3), dysprosium oxide (Dy2O3) and
ytterbium oxide (Yb2O3) were purchased from Hefa Rare Earth Canada Co. Ltd
(Richmond, British Columbia Canada).
3.3.2 Sample preparation
The Teflon® vessels used in microwave digestion (Ethos PRO, Milestone Inc.,
Sorisole (BG)) were washed with soap and Milli-Q water, soaked in 10% nitric acid
overnight, rinsed with Milli-Q water and air dried before use. To test various
digestion conditions and optimize the microwave digestion procedure, the REE oxide
powder sample sizes, acid concentrations and digestion time were modified. Different
amounts of rare earth oxide powder (80, 60, 40 or 20 mg) were put into the Teflon
digestion vessels. Twenty ml of nitric acid (50, 20, 15, 10, 5, and 2 % v/v) were added
to the digestion vessels and the samples digested for 15, 30, 45, 60 minutes at 100oC.
After microwave digestion, the Teflon vessels were removed from the microwave
oven and allowed to cool in a fume hood for 30 minutes. All digested REE solutions
were then diluted (if needed) until the nitric acid concentrations were lowered to 2%
and stored prior to analysis by ICP-MS.

43
For samples digested using conventional heating, twenty mg of rare earth oxide
powder samples (Pr6O11, Nd2O3, Sm2O3, Gd2O3, Dy2O3 and Yb2O3) were weighed
and transferred into Teflon tubes. Samples were then dissolved with 20 ml of 2% (v/v)
nitric acid and heated on a hotplate at 100oC for 30, 60 or 90 minutes.
3.3.3 Determination of REEs by ICP-MS
Following microwave and/or hot plate digestion, prepared samples were analyzed for
REE concentrations using a PerkinElmer (ELAN DRC II) ICP-MS. Prior to use, the
machine was optimized using a tuning solution. The operating conditions of the ICP-
MS are summarized in Table 3.1. Standard solutions for calibration curves were
prepared from the 1000 µg ml-1
stock solutions by diluting them with 2% nitric acid.
Table 3.1:
Instrumental operating conditions and data acquisition parameters.
Parameters / Conditions Results
RF Power (W) 1225
Plasma gas flow rate (l min-1
) 15
Auxiliary gas flow rate (l min-1
) 1.2
Nebulizer gas flow rate (l min-1
) 0.86
Sampler and skimmer cone composition Nickel
Scan mode Peak Hopping
Dwell time (ms) 50
Sample replicates 5

44
3.4 Results and discussion
Sample digestion is a critical step in any analytical processes. Elemental or isotopic
analysis of a majority of organic and inorganic matrices requires complete sample
digestion prior to instrumental analysis. Sample digestion can be performed in open,
closed or flow-through digestion systems using a conventional, ultraviolet or
microwave heating source. Frequently, hot plate digestion with nitric acid is used to
digest rare earth oxide samples for trace metal analysis [8-12]. We have tested the
effects of variables including sample size, digestion time and different acid
concentrations on the recovery of REEs using microwave and hot plate digestion
methods.
3.4.1 Effect of sample size - Microwave digestion:
The effect of sample size was studied by applying the microwave-digestion procedure
to various masses of sample. Sample size was varied between 20 mg and 80 mg (5
replicates for each mass) and digested using 20 ml of 50 % (v/v) nitric acid at 100oC
for 15 minutes. Statistical significance for REE elements between the different sample
sizes was performed using t-tests (Figure 3.1). For each element, the same letters on
different bars indicate no significant difference (p > 0.05) between them, whereas
different letters on different bars indicate a significant difference (p < 0.05) between
them. Recovery of REEs increased as the sample size decreased (Figure 3.1). Highest
REE recoveries were obtained when the sample weight was as low as 20 mg and
decreased as the sample weight was increased (Appendix 3). This could be due to the

45
limited volume of nitric acid used [40]. Highest recovery was obtained for Pr
(97.9±1.1%; based on 5 replicates) and lowest for the Nd (60.6±1.4%; based on 5
replicates) (Appendix 3).
Rare earth elements
Pr Nd Sm Gd Dy Yb
Recovery (%)
40
50
60
70
80
90
10020 mg
40 mg
60 mg
80 mg
a b c c
a b b b
a b a c
a a b b
a a b b a b b b
Figure 3.1: Effect of sample size (20, 40, 60 and 80 mg) on recovery, 20 ml (50% HNO3), 100oC,
15 min microwave digestion. For each element, the same letters on different bars indicate no
significant difference (p > 0.05) between them, whereas different letters on different bars indicate
a significant difference (p < 0.05) between them.
3.4.2 Effect of acid concentration - Microwave digestion:
The effect of nitric acid concentration was also studied on the recovery of rare earth
elements. The effect of nitric acid concentration (2, 5 and 20% v/v) on the recovery of
REEs for 45 minutes digestion time (Figure 3.2a) indicates that the recovery of REEs
increases with an increase in nitric acid concentration (based on 5 replicates for each
46
concentration); the highest recovery was obtained with 20 % nitric acid. This suggests
that increasing the nitric acid concentration increases the dissolution of the rare earth
oxide powders. Samples prepared with the higher acid concentrations, had to be either
diluted with water (in order to reduce the acid concentration to 2%), or evaporated to
dryness and then re-dissolved in weak nitric acid, before ICP-MS analysis. This is
because samples containing nitric acid concentrations above 5%, can decrease ICP-
MS signal intensity and accelerate corrosion of the cones [41].
Thus for the continuous monitoring of trace quantities of REEs, it is useful to digest
samples in dilute nitric acid, so instrumental analysis can be done without further
sample dilution. In addition, water is an excellent dipole molecule with the ability to
convert microwave energy efficiently into heat and the use of dilute solutions thus
improves the efficiency of microwave heating [42]. Rare earth element recoveries at
lower acid concentrations (2 and 5%) and a longer digestion time (60 minutes; Figure
3.2b) indicate no significant difference in REE recoveries (p > 0.05) except for
neodymium at 2 % HNO3 versus 5 % HNO3. Highest recovery (Appendix 3) was
obtained for Dy (97.7±2.7%) and lowest for Nd (90.2±1.4%). There was less than 4%
variation in recovery of the REEs when using 2% versus 5 % HNO3.

47
Recovery (%)
60
70
80
90
100 2%
5%
20%
45 min
Rare earth elements
Pr Nd Sm Gd Dy Yb
60
70
80
90
10060 min
2a
2b
a a a ba a
a a
a a a a
a a a
a b ba a a
a a a
a b b a b b
Figure 3.2: Effect of acid concentration (2, 5 or 20% v/v) on recovery. 20 mg sample, 20 ml
HNO3, 100oC microwave digestion. For each element, the same letters on different bars indicate
no significant difference (p > 0.05) between them, whereas different letters on different bars
indicate a significant difference (p < 0.05) between them.

48
3.4.3 Effect of digestion time - Microwave and hotplate digestions:
Digestion time is very important in online monitoring of REEs. Twenty mg of rare
earth oxide sample was mixed with 20 ml of 2% nitric acid and the digestion time was
varied between 30 and 90 minutes. Using microwave digestion (Figure 3.3), recovery
of the six REEs (5 replicates for each digestion time) ranged between ~85% and 95%
(Appendix 3) and there was a trend towards increasing recovery with increasing
digestion time. While there is no significant difference (p > 0.05) in REE recoveries
with digestion time (between 30 and 45 minutes) (Figure 3.3) except praseodymium
(p < 0.05), the best rare earth element recoveries appear to be obtained after a 60
minute digestion. The maximum variation in recovery is only 7% (for gadolinium)
among the various REEs for digestion times of 30 and 60 minutes. Similarly, using
hot plate digestion (Figure 3.4) there is no difference in REE recoveries between
digestion times of 30, 60 and 90 minutes except for ytterbium. Recoveries range
between ~74% and 88% (Appendix 3). These results indicate that rare earth oxide
samples digested with microwave heating for only 30 minutes yield higher REEs
recoveries than using hot plate digestion for 90 minutes (Appendix 3), suggesting that
microwave digestion could be more appropriate for online monitoring of REEs.

49
Rare earth elements
Pr Nd Sm Gd D
yYb
Recovery (%)
60
70
80
90
10030 min
45 min
60 min
a b b
a a b
a a,b b
a a,b b
a a a a a,b b
Figure 3.3: Effect of digestion time (30, 45 or 60 min) on recovery. 20 mg sample, 20 ml (2%
HNO3), 100oC, microwave digestion. For each element, the same letters on different bars indicate
no significant difference (p > 0.05) between them, whereas different letters on different bars
indicate a significant difference (p < 0.05) between them.
Rare earth elements
Pr Nd
Sm Gd D
yYb
Recovery (%)
60
70
80
90
10030 min
60 min
90 mina a a
a a a
a a a
a a a
a a aa a,b b
Figure 3.4: Effect of digestion time (30, 60 or 90 min) on recovery. 20 mg sample, 20 ml (2%
HNO3), 100oC, Hot plate digestion. For each element, the same letters on different bars indicate
no significant difference (p > 0.05) between them, whereas different letters on different bars
indicate a significant difference (p < 0.05) between them.
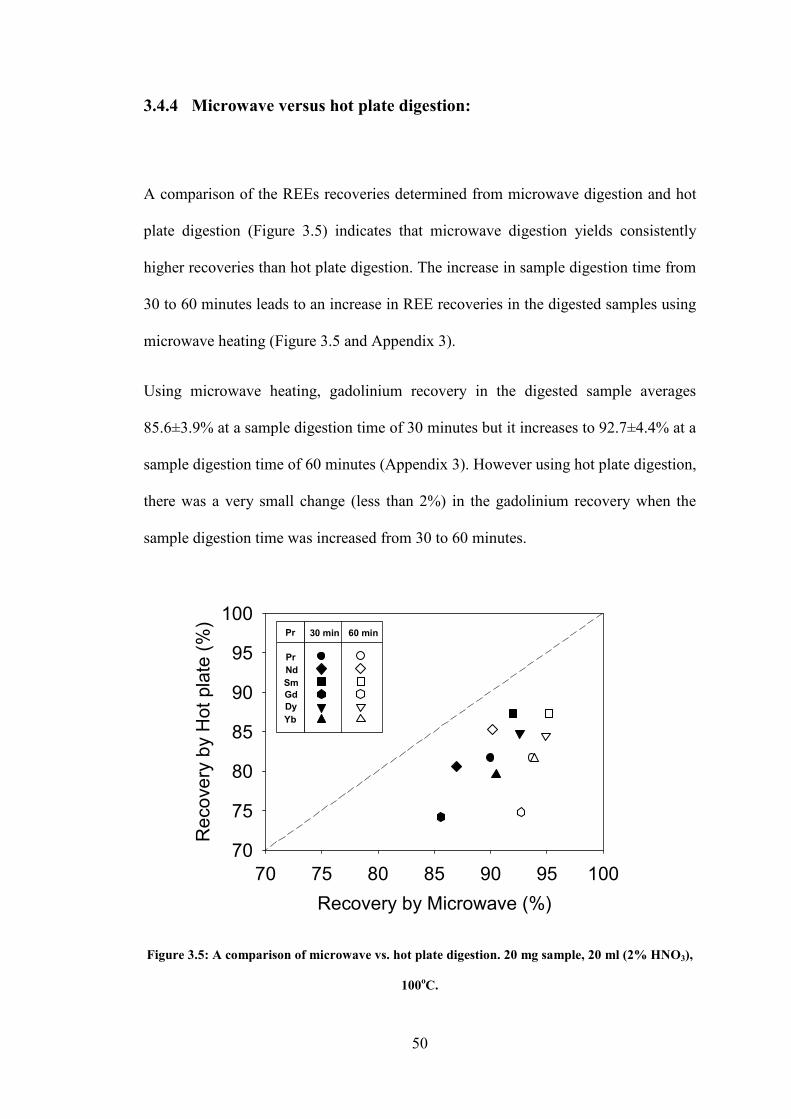
50
3.4.4 Microwave versus hot plate digestion:
A comparison of the REEs recoveries determined from microwave digestion and hot
plate digestion (Figure 3.5) indicates that microwave digestion yields consistently
higher recoveries than hot plate digestion. The increase in sample digestion time from
30 to 60 minutes leads to an increase in REE recoveries in the digested samples using
microwave heating (Figure 3.5 and Appendix 3).
Using microwave heating, gadolinium recovery in the digested sample averages
85.6±3.9% at a sample digestion time of 30 minutes but it increases to 92.7±4.4% at a
sample digestion time of 60 minutes (Appendix 3). However using hot plate digestion,
there was a very small change (less than 2%) in the gadolinium recovery when the
sample digestion time was increased from 30 to 60 minutes.
Recovery by Microwave (%)
70 75 80 85 90 95 100
Recovery by Hot plate (%)
70
75
80
85
90
95
100 30 min 60 min
Pr
Nd
Sm
Gd
Dy
Yb
Pr
Figure 3.5: A comparison of microwave vs. hot plate digestion. 20 mg sample, 20 ml (2% HNO3),
100oC.

51
Results indicate a significant difference (p < 0.05) in REE recoveries at different
digestion times between microwave and hot plate digestion. Hot plates conductively
heat the digestion tubes and then transfer the heat to the solution. This indirect heating
technique is relatively slow. However, microwave radiation passes through the
digestion tube walls and causes the solution molecules to oscillate, generating heat.
Microwave heating is more efficient than conventional heating because heating takes
place within the solution and no heat is lost to the environment during digestion
process.
Microwave heating was found to be preferable to hot plate digestion for the rare earth
oxide powder samples (Figure 3.5 and Appendix 3). A flow through digestion system,
the key part of which is a microwave heating section, could be used for sample
digestion, in order to continuously monitor atmospheric REEs. A flow through
digestion system such as this would continuously uptake samples (e.g., from the PILS
system), and automatically mix the sample with acid. Sample/acid mixtures would
then flow into the microwave heating section, be digested for the set residence time
and temperature, and then continuously flow out. Those digested samples could
subsequently be introduced into the ICP-MS to determine real-time REE
concentrations. According to our results, microwave digestion of REEs by nitric acid
(2 % v/v) at 100oC for 60 min would guarantee higher than 90% recoveries for all six
rare earth elements. Thus we may expect that a similar setup for a continuous flow
digestion system would also result in high recoveries of REEs, which may be used for
the continuous monitoring of REEs released from industry to control industrial
emissions and conform with compliance regulations.

52
Atmospheric rare earth element concentrations in ambient air are between 0.22 to 36
ng m-3
[20, 43]. If ambient air is sampled (e.g. REE concentration = 0.22 ng m-3
) for
10 minutes using the PILS with a transport liquid flow rate of 0.3 ml min-1
, the
particulate REE concentrations in the liquid sample will be higher than the ICP-MS
detection limits [35]. Therefore a sample collection time of 10 minutes would be
sufficient to collect enough particles into a sample volume of liquid using the PILS
system. The collected sample would be ready for ICP-MS analysis after sample
digestion (for 1hour) using 2 % nitric acid.
3.5 Conclusions
A relatively simple, effective and rapid microwave digestion method was developed
for high purity rare earth oxide powders. A combination of microwave heating at
100oC for 60 minutes, using 20 ml of nitric acid (2 % v/v) yields greater than 90%
recoveries of all six REEs. The results indicate that microwave heating is preferable to
hot plate digestion for these rare earth oxide powder samples. This method can be
used for the continuous monitoring of trace quantities of REEs without further sample
dilution because the digestions were conducted using 2% (v/v) nitric acid.

53
3.6 References
1. Samet, J.; Krewski, D.; Krzyzanowski, M.; Lorraine, Air quality and human
health. In air pollution and public health: A guidance document for risk
managers. In Network for environmental risk assessment and management,
NERAM V Colloquium: 2007.
2. Giri, D.; Murthy, V. K.; Adhikary, P. R.; Khanal, S. N., Ambient air quality of
Kathmandu valley as reflected by atmospheric particulate matter concentration
(PM10). International Journal of Environmental Science and Technology
2006, 3, 403-410.
3. Whitehouse, J., Industrial mineral opportunities in New South Wales (Geology
Bulletin no.33). Primary Industries, Minerals and Petroleum: 2007.
4. Lundin, R.; Wilson, J. R. The Application of Rare Earth Metals Is Widening:
Despite Lack of Engineering Data. R & D on Mischmetal; Jiangxi Xinji
Metals Co., LTD.
http://doc.diytrade.com/docdvr/316680/4567042/1193710377.pdf (July 24,
2011),
5. Takaya, M.; Shinohara, Y.; Serita, F.; Ono-Ogasawara, M.; Otaki, N.; Toya,
T.; Takata, A.; Yoshida, K.; Kohyama, N., Dissolution of functional materials
and rare earth oxides into Pseudo Alveolar fluid. Industrial Health 2006, 44,
639-644.
6. Sinton, C. W. Study of rare earth resources and markets for the Mt. Weld
Complex; BCC Research for Lynas Corporation Ltd.: 2006.
7. Castor, S. B.; Hedrick, J. B., Rare Earth Elements. In Industrial Minerals &
Rocks: Commodities, Markets, and Uses, 7th ed.; Kogel, J. E.; Trivedi, N. C.;
Barker, J. M.; Krukowski, S. T., Eds. Society of Mining, Metallurgy, and
Exploration, Inc. (SME): Colorado, 2006; pp 769-792.
8. Pedreira, W. R.; Sarkis, J. E. S.; Rodrigues, C.; Tomiyoshi, I. A.; Queiroz, C.
A. d. S.; Abrao, A., Determination of trace amounts of rare earth elements in
highly pure praseodymium oxide by double focusing inductively coupled
plasma mass spectrometry and high-performance liquid chromatography.
Journal of Alloys and Compounds 2001, 323-324, 49-52.
9. Pedreira, W. R.; Sarkis, J. E. S.; Rodrigues, C.; Tomiyoshi, I. A.; Queiroz, C.
A. d. S.; Abrao, A., Determination of trace amounts of rare earth elements in
high pure lanthanum oxide by sector field inductively coupled plasma mass
spectrometry (HR ICP-MS) and high-performance liquid chromatography
(HPLC) techniques. Journal of Alloys and Compounds 2002, 344, 17-20.
10. Pedreira, W. R.; Sarkis, J. E. S.; Queiroz, C. A. d. S.; Rodrigues, C.;
Tomiyoshi, I. A.; Abrao, A., Determination of trace amounts of rare-earth
elements in highly pure neodymium oxide by sector field inductively coupled
plasma mass spectrometry (ICP-SFMS) and high-performance liquid
chromatography (HPLC) techniques. Journal of Solid State Chemistry 2003,
171, 3-6.
11. Pedreira, W. R.; Queiroz, C. A. d. S.; Abrao, A.; Pimentel, M. M.,
Quantification of trace amounts of rare earth elements in high purity
gadolinium oxide by sector field inductively coupled plasma mass
spectrometry (ICP-MS). Journal of Alloys and Compounds 2004, 374, 129-
132.

54
12. Pedreira, W. R.; Queiroz, C. A.; Abrao, A.; Rocha, S. M.; Vasconcellos, M. E.
d.; Boaventura, G. R.; Pimentel, M. M., Trace amounts of rare earth elements
in high purity samarium oxide by sector field inductively coupled plasma mass
spectrometry after separation by HPLC. Journal of Alloys and Compounds
2006, 418, 247-250.
13. Fan, G.; Yuan, Z.; Zheng, H.; Liu, Z., Study on the effects of exposure to rare
earth elements and health-responses in children aged 7-10 years. Wei Sheng
Yan Jiu 2004, 33, 23-28.
14. Zhu, W.; Xu, S.; Shao, P.; Zhang, H.; Wu, D.; Yang, W.; Feng, J.,
Bioelectrical activity of the central nervous system among populations in a
rare earth element area. Biological Trace Element Research 1997, 57, 71-77.
15. Zhu, W.; Xu, S.; Shao, P.; Zhang, H.; Wu, D.; Yang, W.; Feng, J.; Feng, L.,
Investigation on liver function among population in high background of rare
earth area in South China. Biological Trace Element Research 2005, 104, 1-7.
16. Zhang, H.; Feng, J.; Zhu, W.; Liu, C.; Xu, S.; Shao, P.; Wu, D.; Yang, W.; Gu,
J., Chronic toxicity of rare-earth elements on human beings : Implications of
blood biochemical indices in REE-high regions, South Jiangxi. Biological
Trace Element Research 2000, 73, 1-17.
17. Rofer, C. K.; Kaasik, T., Turning a Problem Into a Resource: Remediation
and Waste Management at the Sillam E Site, Estonia. 2000; Vol. Disarmament
technologies: 28.
18. Krachler, M.; Mohl, C.; Emons, H.; Shotyk, W., Two thousand years of
atmospheric rare earth element (REE) deposition as revealed by an
ombrotrophic peat bog profile, Jura Mountains, Switzerland. Journal of
Environmental Monitoring 2003, 5, 111-121.
19. Chiarenzelli, J.; Aspler, L.; Dunn, C.; Cousens, B.; Ozarko, D.; Powis, K.,
Multi-element and rare earth element composition of lichens, mosses, and
vascular plants from the Central Barrenlands, Nunavut, Canada. Applied
Geochemistry 2001, 16, 245-270.
20. Wang, C.; Zhu, W.; Wang, Z.; Guicherit, R., Rare earth elements and other
metals in atmospheric particulate matter in the western part of the Netherlands.
Water, Air, and Soil Pollution 2000, 121, 109-118.
21. Wang, C. X.; Zhu, W.; Peng, A.; Guichreit, R., Comparative studies on the
concentration of rare earth elements and heavy metals in the atmospheric
particulate matter in Beijing, China, and in Delft, the Netherlands.
Environment International 2001, 26, 309-313.
22. Suzuki, Y.; Suzuki, T.; Furuta, N., Determination of Rare Earth Elements
(REEs) in Airborne Particulate Matter (APM) Collected in Tokyo, Japan, and
a Positive Anomaly of Europium and Terbium. Analytical Sciences 2010, 26,
929-935.
23. Weber, R. J.; Orsini, D.; Daun, Y.; Lee, Y.-N.; Klotz, P. J.; Brechtel, F., A
Particle-into-Liquid collector for rapid measurement of aerosol bulk chemical
composition. Aerosol Science and Technology 2001, 35, 718-727.
24. Suc, N. V.; Desai, H. B.; Parthasarathy, R.; Gangadharan, S., Rare earth
impurities in high purity lanthanum oxide determined by neutron activation
analysis. Journal of Radioanalytical and Nuclear Chemistry; Letters 1992,
164, 321-325.
25. Orvini, E.; Speziali, M.; Salvini, A.; Herborg, C., Rare earth elements
determination in environmental matrices by INNA. Microchemical Journal
2000, 67, 97-104.

55
26. Perna, L.; Bocci, F.; Heras, L. A. d. l.; Pablo, J. D.; Betti, M., Studies on
simultaneous separationand determination of lanthanides and actinides by ion
chromatography inductively coupled plasma mass spectrometry combined
with isotope dilution mass spectrometry. Journal of Analytical Atomic
Spectrometry 2002, 17, 1166-1171.
27. Vito, I. E. D.; Masi, A. N.; Olsina, R. A., Determination of trace rare earth
elements by X-ray fluorescence spectrometry after preconcentration on a new
chelating resin loaded with thorin. Talanta 1999, 49, 929-935.
28. Dixit, P. M., Characterization of high purity rare-earth oxides by x-ray
fluorescence method. Bulletin of Material Science 1981, 3, 371-374.
29. Gupta, J. G. S., Determination of yttrium and rare-earth elements in rocks by
graphite-furnace atomic-absorption spectrometry. Talanta 1981, 28, 31-36.
30. Yoshida, K.; Haraguchi, H., Determination of rare earth elements by liquid
chromatography / inductively coupled plasma atomic emission spectrometry.
Analytical Chemistry 1984, 56, 2580-2585.
31. Zuleger, E.; Erzinger, J., Determination of the REE and Y in silicate materials
with ICP-AES. Fresenius Zeitschrift fur Analytische Chemie (Fresenius’
Journal of Analytical Chemistry) 1988, 332, 140-143.
32. Cai, B.; Hu, B.; Jiang, Z., Direct determination of trace rare earth elements in
high purity Y2O3 using fluorination assisted electrothermal vaporization
inductively coupled plasma atomic emission spectrometry with slurry
sampling. Fresenius' Journal of Analytical Chemistry 2000, 367, 259-263.
33. Xiang, G.; Jiang, Z.; He, M.; Hu, B., Direct determination of trace rare earth
elements in ancient porcelain samples with slurry sampling electrothermal
vaporization inductively coupled plasma mass spectrometry. Spectrochimica
Acta Part B: Atomic Spectroscopy 2005, 60, 1342-1348.
34. Shibata, N.; Fudagawa, N.; Kubota, M., Electrothermal vaporization using a
tungsten furnace for the determination of rare-earth elements by inductively
coupled plasma mass spectrometry. Analytical Chemistry 1991, 63, 636-640.
35. Kawabata, K.; Kishi, Y.; Kawaguchi, O.; Watanabe, Y.; Inoue, Y.,
Determination of rare-earth elements by inductively coupled plasma mass
spectrometry with ion chromatography. Analytical Chemistry 1991, 63, 2137-
2140.
36. Li, B.; Zhang, Y.; Yin, M., Determination of trace amounts of rare earth
elements in high-purity cerium oxide by inductively coupled plasma mass
spectrometry after separation by solvent extraction. Analyst 1997, 122, 543-
547.
37. Zhang, S.-X.; Murachi, S.; Imasaka, T.; Watanabe, M., Determination of rare
earth impurities in ultrapure europium oxide by inductively-coupled plasma
mass spectrometry. Analytica Chimica Acta 1995, 314, 193-201.
38. He, M.; Hu, B.; Zeng, Y.; Jiang, Z., ICP-MS direct determination of trace
amounts of rare earth impurities in various rare earth oxides with only one
standard series. Journal of Alloys and Compounds 2005, 390, 168-174.
39. Abu-Samra, A.; Morries, J. S.; Koirtyohann, S. R., Wet ashing of some
biological samples in microwave ove. Analytical Chemistry 1975, 47, 1475-
1477.
40. Zhao, Q.-X.; Chen, Y.-W.; Belzile, N.; Wang, M., Low volume microwave
digestion and direct determination of selenium in biological samples by
hydride generation-atomic fluorescence spectrometry. Analytic Chemica Acta
2010, 665, 123-128.

56
41. Kulkarni, P.; Chellam, S.; Flanagan, J. B.; Jayanty, R. K. M., Microwave
digestion – ICP-MS for the elemental analysis in ambient airborne fine
particulate matter: Rare earth elements and validation using a filter borne fine
particle certified reference material. Analytic Chemica Acta 2007, 599, 170-
176.
42. Kingston, H. M. S.; Haswell, S. J., Microwave-Enhanced Chemistry;
Fundamentals, Sample preparation and Applications. American Chemical
Society: Washington, 1997.
43. Wang, Z.; Wang, C.; Lu, P.; Zhu, W., Concentrations and flux of rare earth
elements in a semifield plot as influenced by their agricultural application.
Biological Trace Element Research 2001, 84, 213-216.

57
Chapter 4
Particle-into-liquid sampler (PILS)
optimization for the continuous
monitoring of uranium dioxide (UO2)
and uranium tetrafluoride (UF4)
particles in high particle concentration
environments

58
4.1 Abstract
The need to accurately and continuously monitor the release of industrial heavy
metals into the environment for control and compliance with emission standards
cannot be over-emphasized. A particle-into-liquid sampler (PILS) was used for
continuous monitoring of particulate uranium emissions (UO2 or UF4) in a high
particle concentration environment. A fluidized bed aerosol generator was used to
generate high purity uranium dioxide or uranium tetrafluoride aerosols at a rate of 1-5
mg h-1
to simulate stack conditions. Sodium carbonate (5 wt %) / hydrogen peroxide
(0.15 wt %) solution was found to be preferable to water as the sample transport
liquid to collect UO2 particles using the PILS. The sodium carbonate / hydrogen
peroxide solution enhances UO2 or UF4 recovery while the particle build-up on the
impaction surface and blockage in liquid transport lines were eliminated. The data
collected in experiments show that the sample air flow rate (l min-1
) has a significant
effect on particle collection efficiency. The combination of a sample air flow rate of
10 l min-1
(for UO2) or 16.7 l min-1
(for UF4), a steam flow rate of 1.5 ml min-1
and a
sample transport solution flow rate of 0.5 ml min-1
demonstrated greater than 89%
recovery of the particle mass of UO2 and greater than 92% recovery for UF4 in the
sample plus impactor drain lines. The results demonstrate that the particle-into-liquid
sampler (PILS) is a suitable technology for UO2 and UF4 particle sampling in high
particle concentration environments.
Keywords: Particle-into-liquid sampler; uranium tetrafluoride; uranium dioxide;
continuous monitoring; aerosol

59
4.2 Introduction
Air quality control plays a crucial role in the protection of the environment. It is of
special concern to those living in proximity to industrial and manufacturing facilities,
where there is potential for exposure to a greater amount of pollutants. Particulate
matter (PM) is the term for particulates found in the air. Exposure to particulate
matter consistently shows adverse effects on human health in cities throughout the
world in both developed and developing countries [1].
Electricity consumption is increasing rapidly in the world. Electricity generation
increased from 6116 TWh to 19771 TWh from 1973 to 2007. In 2007, nuclear power
contributed ~14 % of the total world’s electricity production [2]. Canada is one of the
leading electricity-consuming countries in the world and every year its electricity
demand is increasing. Most of the electricity in Canada is generated by hydroelectric,
natural gas, coal and nuclear power. Nuclear power contributes ~14.7 % of the total
electricity supply for Canada. Uranium production is increasing too for the
preparation of nuclear fuel for electricity generation. In 1999, the world’s uranium
production was ~31065 tonnes, which increased to ~50772 tonnes in 2009 (~ 63 %
increase); the forecasted uranium requirement for the year 2010 is 68646 tonnes [3].
Uranium is the heavy, silvery-white, metallic, naturally radioactive element with
atomic number 92; it belongs to the actinides group and is found generally as an oxide.
Natural uranium is composed of three isotopes 234
U (0.005%), 235
U(0.711%) and 238
U
(99.284%) [4]. Uranium is used mainly for nuclear power plants as fuel, where the

60
energy released from a controlled nuclear fission reaction is used to generate
electricity. Tri-uranium octoxide (U3O8, i.e., yellowcake) is refined into uranium
trioxide (UO3) and then converted into uranium dioxide (UO2) for use in heavy water
reactors. In the case of light water reactors, first purified uranium trioxide (UO3) is
converted into uranium dioxide (UO2) and then to uranium tetrafluoride (UF4). The
uranium tetrafluoride is then converted into uranium hexafluoride (UF6) using
elemental fluorine; then it undergoes 235
U enrichment and subsequent conversion into
enriched uranium dioxide (UO2).
Almost all energy production methods involve the possibility of some form of
contamination to the environment; from fossil fuel to nuclear energy, pollution occurs
in different ways and to different degrees. Exposure to uranium can cause lung cancer,
kidney damage, and respiratory diseases [5]. The nuclear regulatory commission
(NRC) in the USA has set atmospheric uranium release limits at 0.09µg m-3
[6] and
the Canadian Nuclear Regulatory Commission (CNSC) has a Naturally Occurring
Radioactive Material (NORM) release limit for 238
U series isotopes of 0.24µg m-3
(0.003 Bq m-3
) [7]. For the nuclear industry it is very important to continuously
monitor uranium release into the environment for control and compliance with these
emission standards.
The most commonly used technique for measuring PM involves filtration. Filters are
weighed before and after sampling and the PM concentration is determined from the
increase in filter mass divided by the volume of air sampled. Different types of filters
including fiber, membrane and granular bed filters made from a variety of materials

61
are used to collect aerosols [8-10]. The material of choice depends on different factors
such as mechanical, chemical and temperature stability, blank concentration, flow
resistance and loading capacity [8]. Artifacts associated with filter measurements
include: adsorption of vapors on the substrate (positive artifact) [11-16], evaporation
losses of semi-volatile compounds during and after sampling (negative artifact) [8,
17-23], contamination of filters during filter loading in the field [8] and reactions
between collected particles, gases and the filter substrate [20].
To overcome these artifacts several real-time or near real-time methods for the
measurement of aerosol mass concentrations have been investigated. Buhr et al. [24]
developed an automated method that collects PM on a frit surface, which is
continuously flushed with de-ionized water. Anders et al. [25] developed a method
where the water-soluble particles were directly impacted on flowing liquid. In
addition, aerosols can be charged and collected on the surface of an electrode and
periodically washed with de-ionized water for sample collection and analysis [26].
The Aerosol-to-Liquid Particle Extraction System (ALPES), developed by the
Savannah River National Laboratory (SRNL) is another promising device for
continuous PM monitoring [27].
It is known that very small particles are difficult to collect by impaction [28]. To
overcome this problem, the concept of growing aerosol particle size with steam prior
to particle collection was introduced. Simon and Dasgupta [29, 30] introduced an
aerosol particle collection system in which aerosol particles were grown with steam
under supersaturation, followed by condensation of the water vapors with a
62
thermoelectric cooler in a stainless steel maze. The condensed water-containing
particles from the stainless steel maze were collected and separated from the air using
an air/liquid separator. The design was later improved and simplified by removing the
thermoelectric cooler from the maze [31]. At the same time Khlystov et al. [32, 33]
developed a technique to collect droplets using a cyclone while Zellweger et al. [34,
35] and Löflund et al. [36] used a mist chamber / cooling device and air liquid
separator to collect droplets.
More recently, the particle-into-liquid sampler (PILS), was developed by Weber et al.
[37], which is a modified form of the particle size magnifier (PSM) design of
Okuyama et al. [38]. Later the particle-into-liquid sampler (PILS) was improved for
particle collection at higher air sample flow rates and for both ground and airborne
measurements of water-soluble aerosol composition [39]. Sample air is introduced
into the PILS system using a vacuum pump and the flow rate is controlled by a critical
orifice, which is placed at the exit of PILS system. At the entrance of the PILS the air
is mixed with steam to obtain a supersaturated environment in which particles grow.
This is followed by collection of particles by inertial impaction on a quartz plate, (the
impaction plate), which is continuously washed with a steady stream of water.
Originally the PILS was coupled only to two ion chromatographs for separate anion
and cation analysis, but it has the ability to connect with other analytical instruments
for online analyte concentration determination. Analysis of a given element can be
accomplished using nondestructive methods such as x-ray fluorescence [40-44] and
instrumental neutron activation analysis [45] or by destructive techniques such as
inductively coupled plasma mass spectrometry [46].

63
The particle-into-liquid sampler was designed for continuous measurement of ambient
aerosol composition. The PILS has proven successful for the measurements of water
soluble aerosols at high air sample flow rates. There is no information available about
the PILS particle collection efficiency in high particle concentration environments,
especially for particles with high particle density, or those that are hygroscopic / non-
hygroscopic and insoluble in water, such as UF4 and UO2. In the PILS, the impacted
liquid sample on the impaction plate is wicked away using a 62 µm stainless steel
mesh. UF4 and UO2 are insoluble in water and could cause clogging in a stainless
steel mesh and the liquid sample transport line when running in a high particle
concentration environment.
In this study, the utility of the PILS was assessed and optimized for the collection of
UF4 and UO2 particles into a liquid stream at higher particle concentrations. A
fluidized bed aerosol generator was used to generate high purity UF4 or UO2 aerosols
and to simulate stack conditions. UF4 and UO2 particles were captured into a liquid
stream using the PILS and collected samples were analyzed off-line using ED-XRF.
The PILS operating parameters, such as sample air flow rate, steam flow rate,
transport liquid flow rate and sample transport solution were optimized for maximum
particle mass recovery in the sample line and minimum recovery in the growth
chamber drain as a percentage of the total mass of particles collected.
64
4.3 Experiments
4.3.1 Reagents and standards
Hydrogen peroxide (H2O2) (30% W/W ACS grade; EMD chemicals Inc, Gibbstown,
NJ, USA) and sodium carbonate (Na2CO3) (Mallinkrodt Baker, Phillipsburg, NJ, USA)
were used to prepare all the samples and uranium dioxide (UO2) and uranium
tetrafluoride (UF4) standards. For the preparation of solutions, distilled de-ionized
water (18.2 MΩ) was used. High purity UO2 and UF4 powder with particle sizes
smaller than 10 µm (Table 4.1) (Cameco Corporation, Port Hope, Ontario Canada)
were used to generate aerosols.
4.3.2 Aerosol generator
A fluidized bed aerosol generator (Model-3400A, TSI Corporation, MN, USA) was
used to generate UF4 and UO2 aerosols (Figure 4.1). The instrument is designed for an
aerosol output range of 10 - 100 mg m-3
with a powder feed rate of 3 to 30 mm3 min
-1
i.e., a feed rate of 180 - 1800 mg h-1
assuming a powder with unit density. UF4
(density = 6.7 g cm-3
) or UO2 (density = 10.96 g cm-3
) powder was placed in the
powder reservoir and then transported into the fluidized bed chamber using a bead
chain. The fluidized bed consists of 100 µm bronze beads supported by a porous plate.
The clean and dry air is introduced from the bottom of the porous plate to create a
boiling action, which de-agglomerates the powder moving upward with the airflow
through the elutriator. Aerosols were generated using a low air flow rate to minimize

65
aerosol output rate. A filter, pressure gauge, flow meter and pressure relief valve
were attached at the outlet of the aerosol generator to achieve different aerosol
particle rates (1 - 5 mg h-1
).
Figure 4.1. TSI fluidized bed aerosol generator with particle removal setup to control
aerosol output rate to 1-5 mg h-1
.

66
Figure 4.2. Schematic diagram of the PILS for the continuous collection of UO2 and
UF4 particles into the liquid stream.
Table 4.1. UO2 and UF4 particle size distribution.
Diameter (µm) UO2
Mass finer (%)
UF4
Mass finer (%)
10.0 100.0 100.0
8.0 93.3 99.2
6.0 85.2 98.4
4.0 75.3 97.9
2.0 60.0 83.0
1.0 42.9 42.6
0.5 12.9 7.8

67
4.3.3 Particle-into-liquid sampler (PILS)
The particle-into-liquid sampler (Model: ADI 2081, Applikon Analytical BV,
Schiedam, The Netherlands) was used to capture UF4 and UO2 particles into a liquid
stream. The PILS unit was coupled to the TSI fluidized bed aerosol generator, as well
as three separate peristaltic pumps and a vacuum pump (Figure 4.2). Separate
peristaltic pumps were used for better control over liquid flow rates. Pump 1 was used
to control water flow rate for steam generation and peristaltic pump 2 was used to
collect liquids from the growth chamber drain and impactor drain. The third peristaltic
pump was used to control the flow rate of the transport liquid over the impaction plate
and the flow rate of sample collection out of the PILS impactor cavity. Generated
aerosols were introduced to the PILS using a vacuum pump. Inside the PILS, the
aerosol stream is mixed with steam as a result of which the particles grow larger,
followed by collection of the particles by inertial impaction onto the impaction plate.
Particles too small for collection on the inertial impactor leave the system with the
exhaust air flow; those particles were collected using a cold trap and filter installed
between the critical orifice and the vacuum pump.
The sample transport liquid (water or sodium carbonate/ hydrogen peroxide solution)
is continuously pumped over the impaction plate to collect particles into the liquid
stream. Different transport liquid flow rates (speeds of peristaltic pumps) were tested
in order to optimize the particle-into-liquid sampler for the UO2 / UF4 aerosols. Liquid
flow rates were maintained using two different sizes of tubing. Transport liquid flow
rates (0.5 and 0.7 ml min-1
) were controlled using 0.89 mm (I.D) tubing. Tubing with

68
an inner diameter of 1.42 mm was used to collect samples from the PILS impactor
cavity. Because of droplet and condensation effects on the impactor plate, larger inner
diameter tubing was used to ensure that all the liquid sample was removed from the
impactor plate base. Flow rates for the growth chamber drain (1.0 ml min-1
), impactor
drain (1.0 ml min-1
) and steam flow (1.5 ml min-1
) were controlled using 1.42 mm
(I.D) peristaltic pump tubing.
Different sample air flow rates were tested in order to optimize the particle-into-liquid
sampler for the UO2 aerosol. The Applikon particle-into-liquid sampler (Model ADI
2081) was optimized (from the supplier) for an air flow rate of 16.7 l min-1
with a
critical orifice placed at the outlet of the PILS (downstream of the sampling device,
PILS and upstream of the sampling vacuum pump). To achieve other sampled air flow
rates with the PILS, the critical orifice was removed from the outlet and a flow
controller was installed to control different sample air flow rates. The PILS’s
condensation chamber was kept at a slight angle to collect wall condensate and UF4
and UO2 particles lost from the growth chamber drain line.
The PILS was optimized using aerosol particle rates between 1 - 5 mg h-1
, two levels
of sample air flow rates (16.7 l min-1
and 10.0 l min-1
), two different transport liquid
flow rates (0.5 ml min-1
and 0.7 ml min-1
) and different solutions for the sample
transport liquid.

69
4.3.4 Pre-treatment of PILS samples
The PILS samples were collected from the growth chamber drain, the impactor drain,
the cold trap, the filter and from the sample line. Initially the PILS was operated with
water as the sample transport liquid and liquid collected from the growth chamber,
impactor drain, cold trap and sample line, as well as particles collected on the filter
needed pretreatment prior to XRF analysis. The sodium carbonate (Na2CO3) /
hydrogen peroxide (H2O2) solution was added to all liquid samples to make a final
solution concentration of 5 wt % Na2CO3 and 0.15 wt % H2O2 to dissolve uranium
particles. Filters were soaked in 10 ml of the same Na2CO3/H2O2 solution before
sample analysis.
4.3.5 ED-XRF analysis
The Innov- X-50 mobile XRF spectrometer has the capability to analyze liquid,
powder and solid samples combined with simultaneous measurements of up to 30
elements from phosphorous (Z=15) to uranium (Z=92). UF4 and UO2 standards (0 –
200 mg UO2 l-1
and 0 – 200 mg UF4 l-1
) were prepared to generate standard curves.
The XRF measures uranium concentration in weight percentage; it was then
converted to parts per million (mg U l-1
) to generate the calibration curve. All the
liquid samples collected from the sample line, impactor drain, growth chamber, cold
trap and filter were analyzed for uranium concentrations using XRF and the
concentrations were recorded in weight percent. They were then converted into mg U

70
l-1
and compared with the UF4 and UO2 calibration curves to calculate UF4 and UO2
particle mass recovery in each line.
4.4 Results and discussion
4.4.1 Water as the transport liquid
In these laboratory experiments the first step was to modify and calibrate the fluidized
bed aerosol generator for the UF4 and UO2 powder. As outlined in the Methods
(above), powder was fed into the sample powder chamber and a chain conveyor (ball
chain) transported the powder from the sample chamber to the fluidized bed at a
constant rate (Figure 4.1). The instrument should run at a minimum chain speed of 20
(arbitrary units of the instrument control) or higher (necessary for stirring action of
the rake inside the sample chamber) to insure that the chain does not create a channel
in the powder chamber. This would result in depletion of the fluidized bed and lead to
unstable/reduced aerosol output concentration over time. At a chain speed of 20,
there is uniform transfer of powder to the fluidized bed resulting in a constant aerosol
output concentration. Fluidized bed aerosol generator disperses powders at a feed rate
range of 180 to 1800 mg h-1
(assuming unit density). A filter holder, pressure gauge,
flow meter and pressure relief valve were attached at the outlet of the aerosol
generator to achieve different aerosol particle rates. Aerosol output rate was reduced
to obtain three different levels (low, medium and high) by removing a fraction of the
particles from the air flow using a series of filter papers. For the low level, particles
were removed by three separate filter papers. The remaining particles were collected

71
on the fourth filter paper and subsequently weighed on an analytical balance. For the
medium level, particles were removed by two separate filter papers. The remaining
particles were collected on the third filter and subsequently weighed on an analytical
balance. Finally for the high particle rate, particles were removed using a single filter
paper. The remaining particles were collected on a second filter and subsequently
weighed on an analytical balance. The filter paper also helped to remove all the larger
particles (> 10 µm) from the aerosol stream. Fluidizing action of the bronze beads de-
agglomerates the powder and generates charged aerosols due to mechanical friction
within the fluidized bed; aerosol charge increases with increasing fluidization air flow
rate and also changes with the length of operating time [47, 48]. To minimize aerosol
losses in the aerosol transport line, a conductive tube was used to transport the aerosol
from the fluidized bed generator to the PILS.
Experimental Run
0 1 2 3 4
UO2 distribution (%)
0
25
50
75
100Impactor drain
Impactor wash
Filter + Cold trap + Growth chamber
Sample line
Figure 4.3. PILS running with water as sample transport liquid: UO2 particle mass
recovery (%) in different lines during four successive experimental run at the sample
air flow rate of 10 l min-1
, water flow rate for steam generation of 1.5 ml min-1
and
transport liquid flow rate of 0.4 ml min-1
.
72
Initially the PILS was operated with water as the sample transport liquid for the
collection of the uranium dioxide particles, followed by the dissolution of particles
prior to sample off-line analysis using XRF. Initial tests (Appendix 4) were carried
out with a transport liquid flow rate of 0.4 ml min-1
and a water flow rate for steam
generation of 1.5 ml min-1
. Results (Figure 4.3) show a low percentage uranium
dioxide particle mass recovery in the sample line. The maximum percentage of
uranium dioxide particle mass recovery (68%) from sample line was achieved in a
sample collected from experimental run 1 but it is reduced to 39 % in experimental
run 4. After each experimental run the impaction plate was removed from the PILS
unit and washed to collect all the particles for a particle mass balance; we found that
for each successive experimental run the percentage of uranium dioxide particle mass
recovered in the sample line decreased whereas it increased in all the drain lines as
well as on filter. The PILS ran continuously and during operation, particle build-up
was clearly observed on the impaction plate and blockage was evident in drain lines
(Figure 4.4). Thus water was ineffective as a liquid for the transport of uranium
dioxide particles out of the sampler, at concentrations typical of normal stack
operations.

73
Figure 4.4. PILS running with water: particle build-up on impaction surface and
blockage in liquid collection lines.
4.4.2 Optimization of PILS system for UO2 and UF4
Uranium dioxide is insoluble in water but dissolves in aqueous carbonate media;
hydrogen peroxide increases the rate of uranium oxidation [49]. Therefore, to improve
the particle mass collection efficiency of uranium in the sample line, a sodium
carbonate (5 wt %) and hydrogen peroxide (0.15 wt %) solution was used as the
sample transport liquid. It was anticipated that this solution would dissolve uranium
tetrafluoride and uranium dioxide particles within the system because uranium forms
carbonate complexes in solutions. This transport liquid solution also reduces chances
of particle build-up on the impaction surface and blockages in the liquid lines. To our
knowledge, this is the first time that a liquid other than water has been used as a
74
sample transport liquid in a particle-into-liquid sampler. The particle-into-liquid
sampler tip temperature was optimized at a temperature of approximately 90oC
because at this temperature steam flow transitions from spitting to a steady steam jet
with no water drops coming out of steam injection tip. The PILS tip temperature was
maintained at approximately 90oC for all experiments, which resulted in good steam
generation for proper particle-into-liquid sampler operation.
Two separate pumps were used to control the water flow rate for steam generation and
sample transport. During the PILS-UO2 experiments, the average collected volume
from the sample line (Pump 3) was 0.51±0.06 ml min-1
and 0.72±0.04 ml min-1
for a
liquid transport flow rate of 0.5 and 0.7 ml min-1
, respectively. During the PILS-UF4
experiments, the average collected volume from the sample line (Pump 3) was
0.54±0.05 ml min-1
and 0.75±0.05 ml min-1
for a liquid transport flow rate of 0.5 and
0.7 ml min-1
, respectively. The sample was collected at a higher flow rate than the rate
at which transport liquid was introduced at the top of impaction surface. A tube with a
larger inner diameter was necessary to collect the sample at the bottom of impaction
surface (Figure 4.2) because the total flow is the sum of transport liquid flow,
collected water droplets and condensed water vapor in the impactor cavity. The
volumes of the collected samples were significantly different because of the tubing
used in the peristaltic pumps. The peristaltic pumps did not provide a constant flow
of liquid due to deformation in the tubing, which takes place over time, but also
because air temperature and supersaturated conditions in the PILS can affect the
liquid volumes collected. When doing on-line analysis, it is very important to know
the exact sample flow rate in order to accurately calculate the concentration of the
element of interest in ambient air. Considering variations in sample flow rates, Weber

75
et al. [37, 39] added a known quantity of lithium fluoride to the sample flow to correct
for differences in sample volume during on-line analysis. In our study, analyses of
samples were done off-line, and so the addition of a calibrant was not required
because final volumes of the samples were measured.
4.4.2.1 PILS – Sample line plus impactor drain
Several experiments were performed (Appendix 5 and Appendix 8) to determine the
influence of the variation in particle mass concentration (low, medium and high),
transport liquid flow rate (0.5 and 0.7 ml min-1
), and sample air flow rate (10 and 16.7
l min-1
) on the particle mass collection efficiency of the PILS. Experiments to
optimize the PILS for uranium dioxide and uranium tetrafluoride particles were
carried out at the industrial project partner’s research lab (Cameco Corporation, Port
Hope, Ontario Canada). It was decided to optimize the PILS at three different aerosol
flow rates (low, medium and high) for UO2 (total of 24 experimental runs - Appendix
5) and two different aerosol flow rates (low and high) for UF4 (total of 16
experimental runs - Appendix 8) because of time and budgetary constraints. We
performed eight different experiments for each aerosol flow rate (for both of UO2 and
UF4). For the aerosol flow rate experiments, statistical analyses for UO2 results
(Appendix 7) show an average particle mass collection recovery of 85.4 % in the
sample plus impactor drain, with a variance of 168.7. For the high aerosol flow rate,
statistical results show an average particle mass collection recovery of 85.9 % in the
sample plus impactor drain, with a variance of 114.0. Statistical analysis for UF4
results (Appendix 10) show a mean particle mass collection recovery of 89.2 % in the
sample plus impactor drain, with a variance of 14.4 for the low aerosol flow rate, and
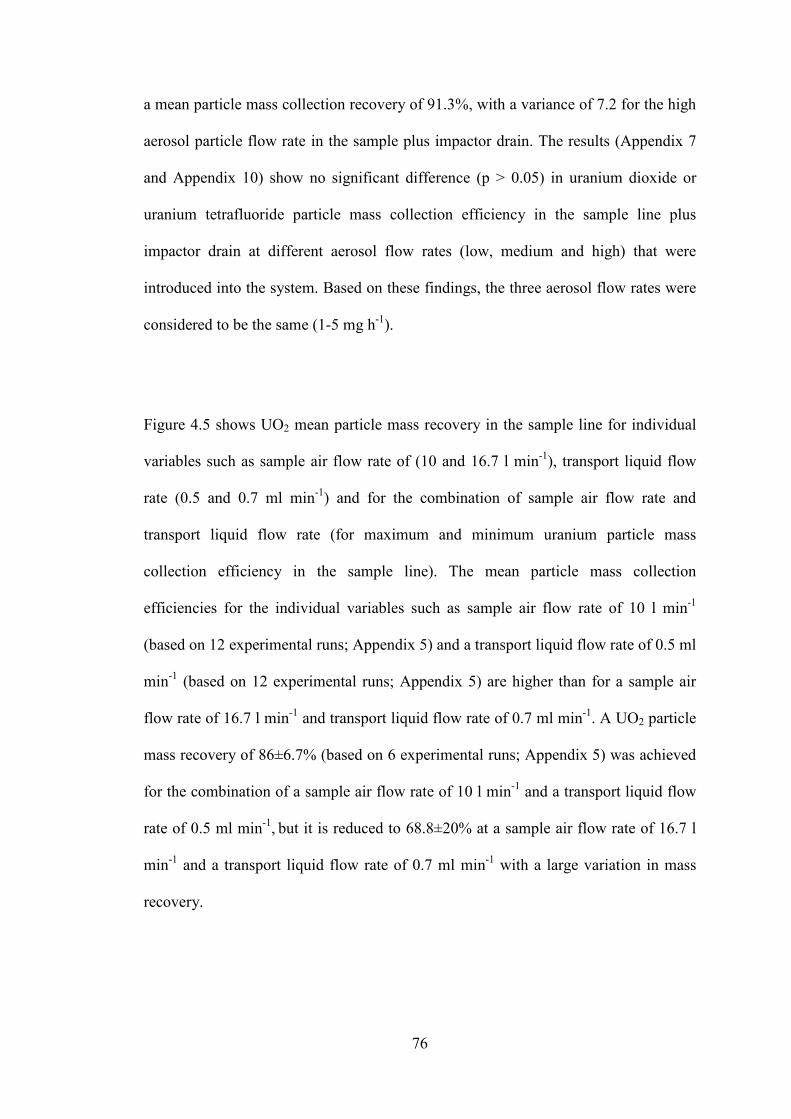
76
a mean particle mass collection recovery of 91.3%, with a variance of 7.2 for the high
aerosol particle flow rate in the sample plus impactor drain. The results (Appendix 7
and Appendix 10) show no significant difference (p > 0.05) in uranium dioxide or
uranium tetrafluoride particle mass collection efficiency in the sample line plus
impactor drain at different aerosol flow rates (low, medium and high) that were
introduced into the system. Based on these findings, the three aerosol flow rates were
considered to be the same (1-5 mg h-1
).
Figure 4.5 shows UO2 mean particle mass recovery in the sample line for individual
variables such as sample air flow rate of (10 and 16.7 l min-1
), transport liquid flow
rate (0.5 and 0.7 ml min-1
) and for the combination of sample air flow rate and
transport liquid flow rate (for maximum and minimum uranium particle mass
collection efficiency in the sample line). The mean particle mass collection
efficiencies for the individual variables such as sample air flow rate of 10 l min-1
(based on 12 experimental runs; Appendix 5) and a transport liquid flow rate of 0.5 ml
min-1
(based on 12 experimental runs; Appendix 5) are higher than for a sample air
flow rate of 16.7 l min-1
and transport liquid flow rate of 0.7 ml min-1
. A UO2 particle
mass recovery of 86±6.7% (based on 6 experimental runs; Appendix 5) was achieved
for the combination of a sample air flow rate of 10 l min-1
and a transport liquid flow
rate of 0.5 ml min-1
, but it is reduced to 68.8±20% at a sample air flow rate of 16.7 l
min-1
and a transport liquid flow rate of 0.7 ml min-1
with a large variation in mass
recovery.

77
10 16.7 0.5 0.7 10 & 0.5 16.7 & 0.7
Particle mass collection efficiency (%)
0
20
40
60
80
100
Sample air flow rate
(l min-1)
Transport liquid flow rate
(ml min-1)
Sample air flow rate (l min-1)
and
Transport liquid flow rate (ml min-1)
Sample Line
Figure 4.5. UO2 particle mass collection efficiency (%) in the sample line at different
sample air flow rates and transport liquid flow rates.
10 16.7 0.5 0.7 10 & 0.7 16.7 & 0.5
Particle mass collection efficiency (%)
50
60
70
80
90
100
Sample air flow rate
(l min-1)
Transport liquid flow rate
(ml min-1)
Sample air flow rate (l min-1)
and
Transport liquid flow rate (ml min-1)
Sample Line
Figure 4.6. UF4 particle mass collection efficiency (%) in the sample line at different
sample air flow rates and transport liquid flow rates.
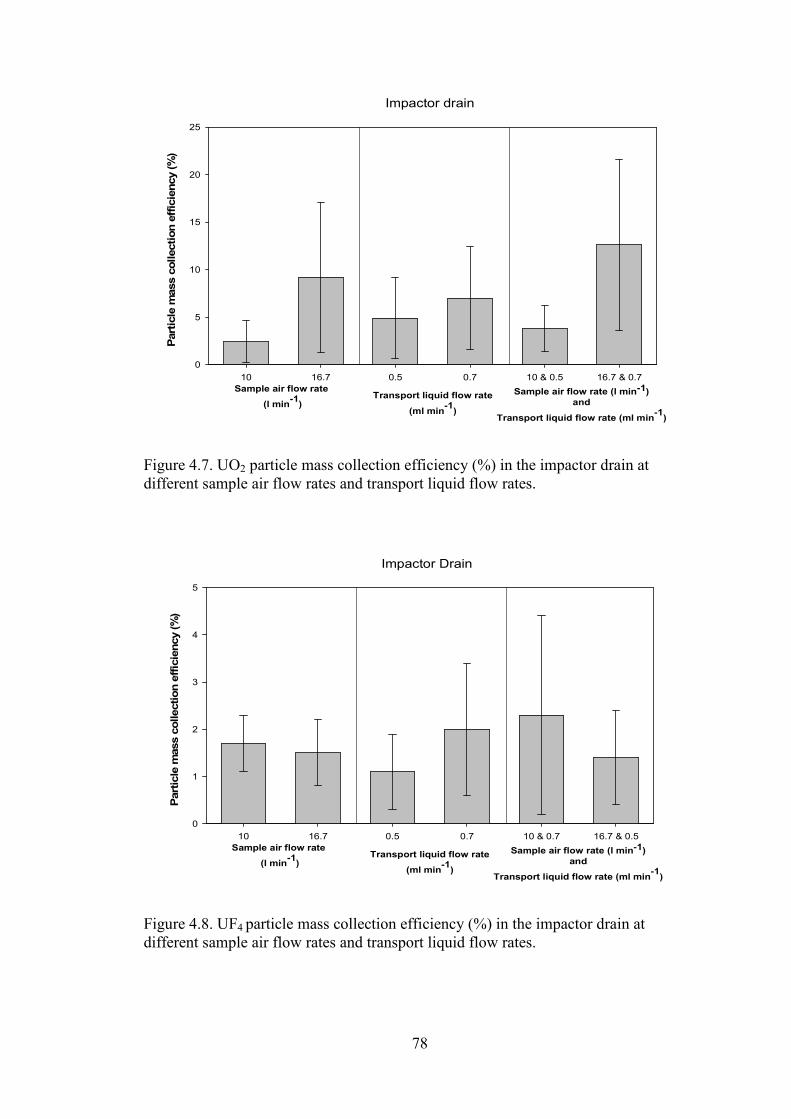
78
Sample air flow rate
(l min-1)
Sample air flow rate (l min-1)
and
Transport liquid flow rate (ml min-1)
Impactor drain
Transport liquid flow rate
(ml min-1)
10 16.7 0.5 0.7 10 & 0.5 16.7 & 0.7
Particle mass collection efficiency (%)
0
5
10
15
20
25
Figure 4.7. UO2 particle mass collection efficiency (%) in the impactor drain at
different sample air flow rates and transport liquid flow rates.
Sample air flow rate
(l min-1)
Sample air flow rate (l min-1)
and
Transport liquid flow rate (ml min-1)
Impactor Drain
Transport liquid flow rate
(ml min-1)
10 16.7 0.5 0.7 10 & 0.7 16.7 & 0.5
Particle mass collection efficiency (%)
0
1
2
3
4
5
Figure 4.8. UF4 particle mass collection efficiency (%) in the impactor drain at
different sample air flow rates and transport liquid flow rates.

79
The UF4 particle mass collection efficiencies for the individual variables (8
experimental runs for each individual variable) in the sample line are higher at a
sample air flow rate of 16.7 l min-1
and a transport liquid flow rate of 0.5 ml min-1
than for the sample air flow rate of 10 l min-1
and transport liquid flow rate of 0.7 ml
min-1
(Figure 4.6 and Appendix 9). The data collected in these experiments show that
sample air flow rate (l min-1
) has a significant effect (p < 0.05) (Appendix 10) on UF4
particle collection efficiency. Using the PILS, UF4 particle collection efficiency in the
sample line averages 91.1±1.6% using a sample air flow rate of 16.7 l min-1
with the
combination of a transport liquid flow rate of 0.5 ml min-1
, but it is reduced to
84±6.6% at a sample air flow rate of 10 l min-1
and a transport liquid flow rate of 0.7
ml min-1
(Figure 4.6 and Appendix 9).
Figure 4.7 demonstrates mean uranium dioxide (UO2) particle mass recovery in the
impactor drain line for individual variables such as sample air flow rate (l min-1
) and
transport liquid flow rate (ml min-1
). The sample air flow rate and transport liquid
flow rate should be optimized to minimize the loss of particles into the impactor drain.
The mean particle mass collection efficiency in the impactor drain for a sample air
flow rate of 10 l min-1
and transport liquid flow rate of 0.5 ml min-1
is lower than that
measured for a sample air flow rate of 16.7 l min-1
and transport liquid flow rate of
0.7 ml min-1
(Figure 4.7). UO2 particle collection efficiency in the impactor drain is
3.8±2.4% at a sample air flow rate of 10 l min-1
and a transport liquid flow rate of 0.5
ml min-1
but it is increased to 12.6±9 % at a sample air flow rate of 16.7 l min-1
and a
transport liquid flow rate of 0.7 ml min-1
. Results show that the mean particle mass
losses in the impactor drain increase (also large standard deviation) (Figure 4.7) with
an increase in sample air flow rate. UF4 particle mean collection efficiency (Figure

80
4.8) in the impactor drain is approximately 1.4±1% at a sample air flow rate of 16.7 l
min-1
and a transport liquid flow rate of 0.5 ml min-1
but it increases to 2.3±2.1% at a
sample air flow rate of 10 l min-1
and a transport liquid flow rate of 0.7 ml min-1
.
The UO2 particle mass collection is increased in the impactor drain (Figure 4.7) and
decreased in the sample line (Figure 4.5) with an increase in the sample air flow rate.
UF4 particle mass collection in the impactor drain is decreased with an increase in the
sample air flow rate (Figure 4.8) but particle mass collection in the sample line is
increased with the increase in sample air flow rate (Figure 4.6). It is important to
minimize particle mass collection in the impactor drain because too many particles in
the impactor drain can cause blockage in the drain line. Theoretically, all particles in
the impactor will be collected upon striking the collection surface but in practice this
is not always true. One of the reasons is that particles bounce off the particle
collection surface. Orsini et al. [39] explained that small liquid drops are produced
from larger droplets upon impaction on a collection surface and bounce back off as
small drops, reducing the collection efficiency in the sample line. Our system
operated at a sample air flow rate of 16.7 l min-1
and 10 l min-1
with corresponding
nozzle velocities. At controlled relative humidity, the fraction of particle bounce
increases with nozzle velocity [50]. This evidence supports our experimental results;
at high sample air flow rate, particle bounce back increases from the impactor, wall
losses increase and UO2 mass collection in the sample line is reduced [51], all of
which results in an increase in UO2 mass collection in the impactor drain line.
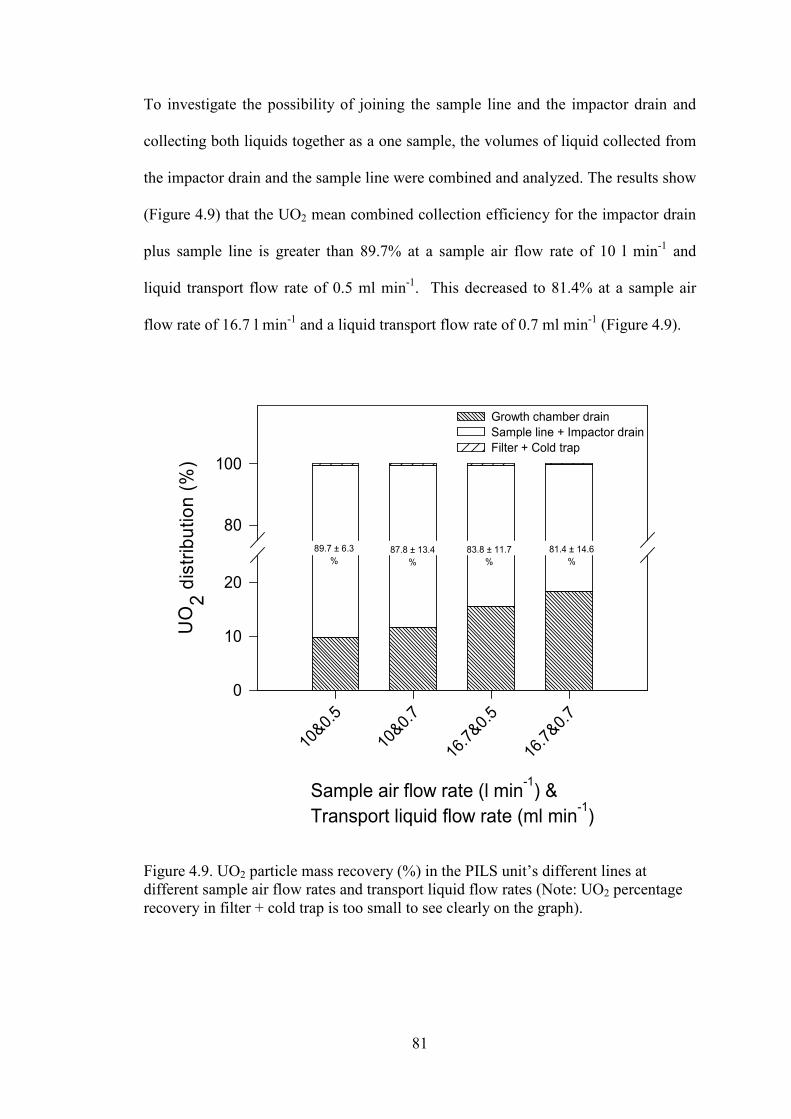
81
To investigate the possibility of joining the sample line and the impactor drain and
collecting both liquids together as a one sample, the volumes of liquid collected from
the impactor drain and the sample line were combined and analyzed. The results show
(Figure 4.9) that the UO2 mean combined collection efficiency for the impactor drain
plus sample line is greater than 89.7% at a sample air flow rate of 10 l min-1
and
liquid transport flow rate of 0.5 ml min-1
. This decreased to 81.4% at a sample air
flow rate of 16.7 l min-1
and a liquid transport flow rate of 0.7 ml min-1
(Figure 4.9).
Sample air flow rate (l min-1) &
Transport liquid flow rate (ml min-1)
10&0.5
10&0.7
16.7&0.5
16.7&0.7
UO2 distribution (%)
0
10
20
80
100
Growth chamber drain
Sample line + Impactor drain
Filter + Cold trap
89.7 ± 6.3
%
87.8 ± 13.4
%
83.8 ± 11.7
%
81.4 ± 14.6
%
Figure 4.9. UO2 particle mass recovery (%) in the PILS unit’s different lines at
different sample air flow rates and transport liquid flow rates (Note: UO2 percentage
recovery in filter + cold trap is too small to see clearly on the graph).

82
Sample air flow rate (l min-1) &
Transport liquid flow rate (ml min-1)
16.7&0.5
16.7&0.7
10&0.5
10&0.7
UF4 distribution (%)
0
10
20
80
100
Growth chamber drain
Sample line + Impactor drain
Filter + Cold trap
89.3 ± 1.0
%
86.8 ± 4.6
%92.5 ± 1.9
%
92.3 ± 1.2
%
Figure 4.10. UF4 particle mass recovery (%) in the PILS unit’s different lines at
different sample air flow rates and transport liquid flow rates.
The UF4 results show that the combined mean collection efficiency (Figure 4.10 and
Appendix 9) for the sample line plus impactor drain is 92 % at a sample air flow rate
of 16.7 l min-1
in combination with both transport liquid flow rates (0.5 and 0.7 ml
min-1
) but this is decreased to 86.8 % at a sample air flow rate of 10 l min-1
and a
liquid flow rate of 0.7 ml min-1
. By using the carbonate and hydrogen peroxide
solution as the sample transport liquid, particle build-up on the impaction surface and
blockage in the sample line or the impactor drain was eliminated.

83
4.4.2.2 PILS - Growth chamber drain
The UO2 particle mass collection efficiency in the growth chamber drain results
(Figure 4.9; Appendix 6) demonstrate higher particle losses at higher sample air flow
and transport liquid flow rates. UO2 particle loss in the growth chamber drain line is
18.3±14.7 % for a combination of a sample air flow rate of 16.7 l min-1
and a
transport liquid flow rate of 0.7 ml min-1
but it is reduced to 9.8±6.4% at a sample air
flow rate of 10 l min-1
and a transport liquid flow rate of 0.5 ml min-1
. The UF4
particle mean mass collection efficiency (Figure 4.10; Appendix 9) is increased in the
growth chamber with the decrease in the sample air flow rate. UF4 particle loss in the
growth chamber drain line is 11.2±4.1% for a combination of a sample air flow rate of
10 l min-1
and a transport liquid flow rate of 0.7 ml min-1
but it is reduced to
6.4±1.2 % at a sample air flow rate of 16.7 l min-1
and a transport liquid flow rate of
0.5 ml min-1
. Physical and chemical properties of the UO2 and UF4 particles also play
a crucial role in particle mass losses in the growth chamber corresponding to
operating parameters of the PILS. Sample air flow rate and size of the growth
chamber are important because they are related to particle residence time in the
growth chamber, whereas particle residence time and steam flow rate are related to
particle growth rate. Particle residence time, τ (in seconds), can be calculated based on
sample air flow rate (Qa in l min-1
), inside diameter (Di) and length (L) (in centimeters)
of growth chamber using equation 4.1 [52]:
a
i
Q
LD .4
2λ
τ = (4.1)
84
Possible reasons for particle mass losses in the growth chamber may include
gravitational settling, turbulent inertia deposition and losses in both conical sections at
the beginning and end of the growth chamber. The inside diameter and length of the
growth chamber are fixed for the Applikon ADI-2081 PILS; the only parameter that
can affect particle residence time is sample air flow rate. According to equation (4.1),
as sample air flow rate increases, residence time decreases. If the residence time is too
short, very small particles do not grow to a size that is big enough to be captured on
the impactor plate. However, if residence time is too long, particles grow to an
excessively large size resulting in droplet losses in the conical section leading to the
impactor jet. Steam flow rate and the particle-into-liquid sampler tip temperature also
affect particle growth; these parameters were optimized at a steam flow rate of 1.5 ml
min-1
and a tip temperature of ~90oC. UF4 particles are hygroscopic and require
shorter residence time in the growth chamber (higher sample air flow rate, i.e 16.7 l
min-1
) compared to non-hygroscopic UO2 particles (lower sample air flow rate, i.e 10
l min-1
) to grow particles to a size that is big enough to be captured on the impactor
plate and maximize the particle mass collection in the sample line (minimize the
particle mass collection in the growth chamber). There is a critical range in the sample
air flow rate (l min-1
) within which the PILS provides maximum particle mass
recovery. However, we do not know what the PILS operating range limits are (range
of sample air flow) because we used a sample air flow rate of 16.7 and 10 l min-1
to
optimize PILS for UO2 and UF4 particle collection. The results indicate that UO2 and
UF4 require different optimum sample air flow rates in order to minimize losses in the
growth chamber drain and maximize recovery in the sample line; i.e. 10 l min-1
for
UO2 and 16.7 l min-1
for UF4.
85
4.4.2.3 PILS - Filter plus cold trap
After the aerosol particles are grown in the PILS’s growth chamber they are focused
on to the impactor using a single nozzle. Droplets large enough are collected on the
impaction surface and droplets too small to be collected follow the airflow streamlines,
remaining in the air until they leave the system. Particles entrained in the venting air
were collected using a cold trap and filter at the exit of the particle-into-liquid sampler.
The percentage of UO2 particle mass recovery from the cold trap plus the filter was
less than 0.6% (for UO2 , Figure 4.9) and 2% (for UF4, Figure 4.10) of the total
particle mass collected from all other lines for both sample air flow rates (16.7 l min-1
and 10 l min-1
).
4.5 Conclusions
A particle-into-liquid sampler was optimized for the collection of UO2 and UF4
aerosols. The sampling set-up includes a fluidized bed aerosol generator. Sample air
flow rate, steam flow rate, liquid transport flow rate and sample transport solution
were optimized for the maximum recovery of UO2 and UF4 particles in the sample
line. The fluidized bed aerosol generator was optimized to generate aerosol at a rate of
1- 5 mg h-1
. A sodium carbonate/hydrogen peroxide solution was used as a sample
transport liquid to collect UO2 and UF4, and was found to be preferable to water for
the collection of UO2 and UF4; particle build-up on the impaction surface and

86
blockage in the liquid transport lines were eliminated. The combination of a sample
air flow rate of 10 l min-1
(for UO2) or 16.7 l min-1
(for UF4), a steam flow rate of 1.5
ml min-1
and a sample transport solution flow rate of 0.5 ml min-1
demonstrated
greater than 89% recovery of the particle mass of UO2 and greater than 92% recovery
for UF4 in the sample plus impactor drain lines. Our results demonstrate that the PILS
is suitable technology for UO2 and UF4 particle sampling in high particle
concentration environments.
We optimized the PILS system for a high particle concentration environment and for
water-insoluble particles such as uranium dioxide and uranium tetrafluoride thus
extending the range and application of the PILS system. An aqueous carbonate
medium was used successfully as a sample transport liquid for the collection of UO2
and UF4 particles. This opens the door for the collection of water-insoluble particles
by changing the chemistry of transport liquids. A PILS unit can be installed on an
industrial stack for continuous emission monitoring with the appropriate transport
solution, and by adjusting the transport liquid flow rate and sample air flow rate. It is
an effective instrument for aerosol collection into a liquid; it is very reproducible,
easy to use, and will provide a better understanding of aerosol composition including
time-dependent data.

87
4.6 References
1. Samet, J.; Krewski, D.; Krzyzanowski, M.; Lorraine, Air quality and human
health. In air pollution and public health: A guidance document for risk
managers. In Network for environmental risk assessment and management,
NERAM V Colloquium: 2007.
2. IEA Key World Energy Statistics; International Energy Agency - Head of
Communication and Information Office - Paris, 2009.
3. WNA Fact and Figures - Uranium Production Figures: 1999 – 2009.
http://www.world-nuclear.org/infomap.aspx (April 2010),
4. ATSDR, Draft - Toxicological profile of uranium. In Agency for toxic
substances and disease registry (ATSDR); U.S. Department of Health and
Human Services, Public Health Service: Atlanta, GA, 2011.
5. Bleise, A.; Danesi, P. R.; Burkart, W., Properties, uses and health effects of
depleted uranium (DU): a general overview Journal of Environmental
Radioactivity 2003, 64, 93-112.
6. ATSDR, Toxicological profile of uranium. In Agency for toxic substances and
disease registry (ATSDR); U.S. Department of Health and Human Services,
Public Health Service: Atlanta, GA, 1999.
7. Health-Canada, Canadian guidelines for the management of naturally
occurring radioactive materials (NORM). In Canadian NORM Working Group
of the Federal Provincial Territorial - Radiation Protection Committee - ISBN:
0-662-29448-3: 2000.
8. Chow, J. C., Measurement methods to determine compliance with ambient air
quality standards for suspended particles. Journal of the Air & Waste
Management Association 1995, 45, 320-382.
9. Lee, K. W.; Mukund, R., Filter Collection. In Aerosol Measurement:
Principles, Techniques and Applications, 2nd ed.; Baron, P. A.; Willeke, K.,
Eds. A John Wiley & Sons, Inc: New Jersey, 2005; pp 197-228.
10. EPA, Selection, Preparation and extraction of Filter Material, Compendium
Method IO-3.1. In Environmental Protection Agency: 1999.
11. McMurry, P. H.; Zhang, X. Q., Size Distribution of Ambient Organic and
Elemental Carbon. Aerosol Science and Technology 1989, 10, 430-437.
12. Hering, S. V.; Appel, B. R.; Cheng, W.; Salaymeh, F.; Cadle, S. H.; Mulawa,
P. A.; Cahill, T. A.; Eldred, R. A.; Surovik, M.; Fitz, D.; Howes, J. E.; Knapp,
K. T.; Stockburger, L.; Turpin, B. J.; Huntzicker, J. J.; Zhang, X.-Q.;
McMurry, P. H., Comparison of Sampling Methods for Carbonaceous
Aerosols in Ambient Air. Aerosol Science and Technology 1990, 12, 200-213.
13. Volckens, J.; Leith, D., Filter and electrostatic samplers semivolatile aerosols:
Physical artifacts. Environmental Science and Technology 2002, 36, 4613-
4617.
14. McDow, S. R.; Huntzicker, J. J., Vapor Adsorption Artifacts in the Sampling
of Organic aerosol: Face Velocity Effects. . Atmospheric Environment 1990,
24A, 2563-2571.

88
15. Eatough, D. J.; Aghdale, N.; Cottam, M.; Gammon, T.; Hansen, L. D.; Lewis,
E. A.; Farber, R. J., Loss of semi-volatile Organic compounds from particles
during sampling on filters. In Transactions: Visibility and fine particles,
Mathai, C. V., Ed. Air and waste management Association: Pittsburgh, PA,
1990; pp 146-156.
16. Turpin, B. J.; Huntzicker, J. J.; Hering, S. V., Investigation of organic aerosol
sampling artifacts in the Los Angeles basin. Atmospheric Environment 1994,
28, 3061-3071.
17. McMurry, P. H., A review of atmospheric aerosol measurements. Atmospheric
Environment 2000, 34, 1959-1999.
18. Appel, B. R.; Tokiwa, Y., Atmospheric particulate nitrate sampling errors due
to reactions with particulate and gaseous strong acids. Atmospheric
Environment 1981, 15, 1087-1089.
19. Dunwoody, C. L., Rapid Nitrate Loss from PM-10 Filters. Journal of Air
Pollution Control Association 1986, 36, 817-818.
20. Smith, J. P.; Grosjean, D.; James. N. Pitts Jr., Observation of significant losses
of particulate nitrate and ammonium from high volume glass fiber filter
samples stored at room temperature. Journal of Air Pollution Control
Association 1978, 28, 930-933.
21. Wang, H.-C.; John, W., Characteristics of the Berner Impactor for Sampling
Inorganic Ions. Aerosol Science and Technology 1988, 8, 157-172.
22. Witz, S.; Eden, R. W.; Wadley, M. W.; Dunwoody, C.; Papa, R. P.; Torre, K.
J., Rapid loss of particulate nitrate, chloride, and ammonium on quartz filters
during stroge. Journal of Air Waste Management Association 1990, 40, 53-61.
23. Eatough, D. J.; Wadsworth, A.; Eatough, D. A.; Crawford, J. W.; Hansen, L.
D.; Lewis, E. A., A Multiple-system, multi-channel diffusion denuder sampler
for the determination of fine-particulate organic material in the Atmosphere.
Atmospheric Environment 1993, 27A, 1213-1219.
24. Buhr, S. M.; Buhr, M. P.; Fehsenfeld, F. C.; Holloway, J. S.; Karst, U.; Norton,
R. B.; Parrish, D. D.; Sievers, R. E., Development of a semi-continuous
method for the measurement of nitric acid vapor and particulate nitrate and
sulfate. Atmospheric Environment 1995, 29, 2609-2624.
25. Karlsson, A.; Irgum, K.; Hansson, H.-C., Single-stage flowing liquid film
impactor for continuous on-line particle analysis. Journal of Aerosol science
1997, 28, 1539-1551.
26. Liu, S.; Dasgupta, P. K., Automated System for Chemical Analysis of
Airborne Particles based on Corona-Free Electrostatic collection. Analytical
Chemistry 1996, 68, 3638-3644.
27. Cable-Dunlap, P.; DeGange, J. J.; Nichols, L. S.; Duckworth, D. C.; Park, S.
H.; Berkel, G. J. v., Interface of a particle collector with an on-line
electrochemically-modulated separation system for analysis for airborne
radioisotopes. Journal of Radioanalytical and Nuclear Chemistry 2005, 263,
177-181.
28. McKenna, J. D.; Turner, J. H.; Jr, J. P. M., Fine particle (2.5 microns)
emissions: regulations, measurement, and control. John Wiley & Sons, Inc:
Hoboken, New Jersey, 2008.
29. Simon, P. K.; Dasgupta, P. K., Continuous Automated Measurement of the
soluble fraction of Atmospheric Particulate matter. Analytical Chemistry 1995,
67, 71-78.

89
30. Simon, P. K.; Dasgupta, P. K., Continuous Automated Measurement of
gaseous and Nitrous and Nitric Acids and Particulate Nitrite and Nitrate.
Environmental Science and Technology 1995, 29, 1534-1541.
31. Poruthoor, S. K.; Dasgupta, P. K., Automated particle collection and analysis.
Near-real time measurement of aerosol cerium (III). Analytica Chimica Acta
1998, 361, 151-159.
32. Khlystov, A.; Wyers, G. P.; Slanina, J., The steam-jet aerosol collector.
Atmospheric Environment 1995, 29, 2229-2234.
33. Slanina, J.; Brink, H. M. t.; Otjes, R. P.; Even, A.; Jongejan, P.; Khlystov, A.;
Waijers-Ijpelaan, A.; Hu, M.; Lu, Y., The continuous analysis of nitrate and
ammonium in aerosols by the steam jet aerosol collector (SJAC): extension
and validation of the methodology. Atmospheric Environment 2001, 35, 2319-
2330.
34. Zellweger, C.; Baltensperger, U.; Ammann, M.; Kalberer, M.; Hofer, P.,
Continuous automated measurement of the soluble fraction of atmospheric
aerosol. Journal of Aerosol Science 1997, 28, S155-S156.
35. Zellweger, C.; Ammann, M.; Hofer, P.; Baltensperger, U., NOy speciation
with combined wet effluent diffusion denuder-aerosol collector coupled to ion
chromatography. Atmospheric Environment 1999, 33, 1131-1140.
36. Löflund, M.; Kasper-Giebl, A.; Tscherwenka, W.; Schmid, M.; Giebl, H.;
Hitzenberger, R.; Reischl, G.; Puxbaum, H., The performance of a gas and
aerosol monitoring system (GAMS) for the determination of acidic water
soluble organic and inorganic gases and ammonia as well as related particles
from the atmosphere. Atmospheric Environment 2001, 35, 2861-2869.
37. Weber, R. J.; Orsini, D.; Daun, Y.; Lee, Y.-N.; Klotz, P. J.; Brechtel, F., A
Particle-into-Liquid collector for rapid measurement of aerosol bulk chemical
composition. Aerosol Science and Technology 2001, 35, 718-727.
38. Okuyama, K.; Kousaka, Y.; Motouchi, T., Condensation growth of ultrafine
aerosol particles in a new particle size magnifier. Aerosol Science and
Technology 1984, 3, 353-366.
39. Orsini, D. A.; Ma, Y.; Sullivan, A.; Sierau, B.; Baumann, K.; Weber, R. J.,
Refinement to the particle-into-liquid sampler (PILS) for ground and airborne
measurements of water soluable aerosol composition. Atmospheric
Environment 2003, 37, 1243-1259.
40. Dragnev, T. N.; Karamanova, J.; Damianov, B., Precise non-destructive x-ray
fluorescence method for uranium and thorium concentration measurements.
Journal of Radioanalytical Chemistry 1979, 52, 439-448.
41. Berdikov, V. V.; Grigor’EV, O. I.; Iokhin, B. S., X-ray fluorescence
determination of uranium and neighbouring elements in solution. Journal of
Radioanalytical Chemistry 1982, 68, 181-192.
42. Hoffmann, P.; Pilz, N.; Lieser, K. H., Determination of uranium in a various
matrices using EDXRF and excitation by different radionuclides. Journal of
Radioanalytical and Nuclear Chemistry 1989, 132, 121-129.
43. Hanif, I.; Hanif, J.; Hasany, S. M.; Iqbal, M. Z., Studies of Uranium-Cerium
admixture solutions by EDXRF spectroscopy. X-Ray Spectrometry 1995, 24,
298-306.
44. Natarajan, V.; Kulkarni, M. J.; Porwal, N. K.; Dhawale, B. A.; Hon, N. S.;
Godbole, S. V.; Manchanda, V. K., Determination of uranium content in Th, U
mixed oxides using EDXRF. Nuclear instruments and methods in physics

90
research; section B: Beam interactions with material and atoms 2008, 266,
3290-3294.
45. Lange, P. W. D.; Venter, J. H.; Wet, W. J. D., Non-destructive neutron
activation analysis of gold and uranium in residue samples of different ore
bodies. Journal of Radioanalytical Chemistry 1969, 2, 219-228.
46. Boomer, D. W.; Powell, M. J., Determination of uranium in environmental
samples using inductively coupled plasma mass spectrometry. Analytical
Chemistry 1987, 59, 2810-2813.
47. Yeh, H. C.; Carpenter, R. L.; Cheng, Y. S., Electrostatic charge of aerosol
particles from fluidized bed aerosol gernerator. Journal of Aerosol Science
1988, 19, 147-151.
48. Prenni, A. J.; Siefert, R. L.; Onasch, T. B.; Tolbert, M. A.; DeMott, P. J.,
Design and characterization of a fluidized bed aerosol generator: A sources for
dry, submicrometer aerosol. Aerosol Science and Technology 2000, 32, 465-
481.
49. Peper, S. M.; Brodnax, L. F.; Field, S. E.; Zehnder, R. A.; Valdez, S. N.;
Runde, W. H., Kinetic study of oxidative dissolution of UO2 in aqueous
carbonate media. Industrial and Engineering Chemistry Research 2004, 43,
8188-8193.
50. Wang, H.-C.; John, W., Comparative bounce properties of particle material.
Aerosol Science and Technology 1987, 7, 285-299.
51. Cheng, Y.-S.; Yeh, H.-C., Particle bounce in cascade impactor. Environmental
Science and Technology 1979, 13, 1392-1396.
52. Ma, Y. Kinetic Developments and improvements to the particle-into-liquid
sampler (PILS) and its application to Asian outflow studies. Georgia Institute
of Technology, 2004.

91
Chapter 5
Determination of uranium (U) in
atmospheric aerosols using a Particle-
Into-Liquid sampler (PILS)

92
5.1 Abstract
A particle-into-liquid sampler (PILS) and high volume air sampler (filter) were used
to collect aerosols and atmospheric particles, respectively, and samples were analyzed
for uranium concentrations. Comparisons between particulate uranium concentrations
in the air using the high volume air sampler and the PILS indicate that uranium
collection efficiency with the high volume air sampler was consistently higher than
the PILS. Digested PILS samples and filter results were correlated (R2
= 0.98); on
average the concentration of uranium obtained using the PILS was 80% of the
concentration measured using the high volume sampler. The PILS is a promising
device for the collection of atmospheric aerosols. In addition it can provide detailed
information on the variation in ambient levels of uranium, through time.
Keywords: Particulate matter; uranium; particle-into-liquid sampler; high volume air
sampler; continuous monitoring.

93
5.2 Introduction
Atmospheric particulate-associated contaminants pose a risk to human health,
especially in cities. Among those particles, those with an aerodynamic size of less
than 10 microns (PM10), which could be inhaled by humans and cause lung damage,
are of special concern. Thus, the capture or monitoring of atmospheric particles,
especially PM10 is critical in protecting human health.
There is a growing interest in determining heavy metal concentrations in atmospheric
particles due to the toxic effects of heavy metals to humans and other organisms.
Among these metals, uranium is of special concern due to its risk to human health.
Uranium in the air is mainly present as particulate matter. Approximately 70% of the
uranium is associated with particles greater than 2 µm and 40–50% greater than 7 µm
[1]. Particulate uranium is released into the atmosphere both from natural and
anthropogenic sources. Uranium is introduced into the atmosphere primarily by re-
suspension of soil, volcanic eruptions, coal-burning power plants [2-4], and during the
nuclear fuel cycle including mining, milling, refining, fuel fabrication and fuel
processing [5].
There is limited information available about ambient atmospheric uranium
concentrations in particles, mainly due to the low metal concentration in the air and
the detection limit of monitoring systems. Atmospheric uranium concentrations as
high as 200 ng m-3
have been reported near nuclear fuel production plants [5-7].
Average particulate uranium concentrations ranged from 0.10 to 1.47 ng m-3
found in
94
the air at urban and rural locations within New York State [8]. For the Atlantic Ocean
air sampled in Northern Hemisphere, a mean particulate uranium content of 4.1 pg m-
3 was reported [9].
At present, measurements of concentrations of metals in airborne particulates are
typically performed off-line by collecting particles onto filters. Due to the very low
concentration of uranium associated with airborne particles, a large volume of air is
normally required to collect a sufficient mass of particles onto the filter for metal
analysis. A more sophisticated system, the particle-into-liquid sampler (PILS)
developed by Weber et al. [10, 11], which was modified from the particle size
magnifier (PSM) designed by Okuyama et al. [12], was designed for continuous
measurement of aerosol composition. However, the PILS sampler has not been
applied to the analysis of particulate uranium in ambient air.
Analysis of many elements in particles can be accomplished using destructive and
nondestructive methods such as Neutron Activation Analysis (NAA), X-ray
fluorescence (XRF) and inductively coupled plasma mass spectrometry (ICP-MS)
[13-18]. ICP-MS is able to detect trace elements at levels in the part per trillion (ppt)
ranges or lower. The analytical method of choice for the determination of uranium
concentration in the samples was ICP-MS due to its low detection limits, high
sensitivity and good measurement accuracy.

95
Atmospheric particle collection on filters using a high volume sampler is not suitable
for investigating variation in atmospheric trace metal concentrations since it takes a
long time to collect enough sample mass for analysis. However the PILS can provide
us with detailed, rapid information on the variation in ambient levels of particulate
uranium, because aerosols are collected into a small volume over a short period of
time. In this study, we compared measurements of uranium in particles collected from
a traditional high volume air sampler with those from the PILS. Our aim was to
evaluate the PILS as an easy and reliable analytical method for the continuous
monitoring of uranium in atmospheric aerosols.
5.3 Materials and Methods
5.3.1 Sampling location
Atmospheric particulate matter sampling was conducted on the roof of a three-story
building at Trent University, Peterborough, ON, Canada. The Trent University
campus in Peterborough (44o 21' 0" N, 78
o 18' 0" W) is located on the northern
boundary of a small city of 74,600 people, with limited heavy industry. The
immediate area of the campus is surrounded by agricultural land and forests. Wind
direction during the sampling period was approximately 60 % of the time from south
west and 40 % of the time from the north west. Peterborough, ON, is ~30 kilometers
north of the Port Hope Cameco Corporation nuclear fuel production facility. There are

96
no known point sources of particulate uranium in the immediate vicinity of
Peterborough.
5.3.2 Aerosol sampling
Atmospheric particulate matter samples were collected simultaneously using a high-
volume air sampler and PILS during days of no rain in July and August, 2010. The
weather during the sampling periods varied. It was generally hot and windy with a
minimum temperature of 18.2oC, maximum temperature of 29.5
oC, and relative
humidity between 37 - 65% during the sample collection period (0900-1700 hours).
5.3.2.1 Particle-into-liquid sampler (PILS)
A PILS (Model: ADI 2081, Applikon Analytical BV, Schiedam, The Netherlands)
was used to collect atmospheric particulate matter into a liquid stream. The PILS unit
was coupled to a PM10 inlet (BGI Incorporated, USA), as well as three separate
peristaltic pumps and a vacuum pump (Figure 5.1). Separate peristaltic pumps were
used for better control over liquid flow rates. Pump 1 was used to control the water
flow rate for steam generation, while peristaltic pump 2 was used to collect liquids
from the growth chamber drain and the impactor drain. The third peristaltic pump was
used to control the flow rate of the transport liquid over the impaction plate and thus,
the sample collection flow rate out of the PILS impactor cavity. Inside the PILS, the
aerosol stream is mixed with steam as a result of which the particles grow larger,
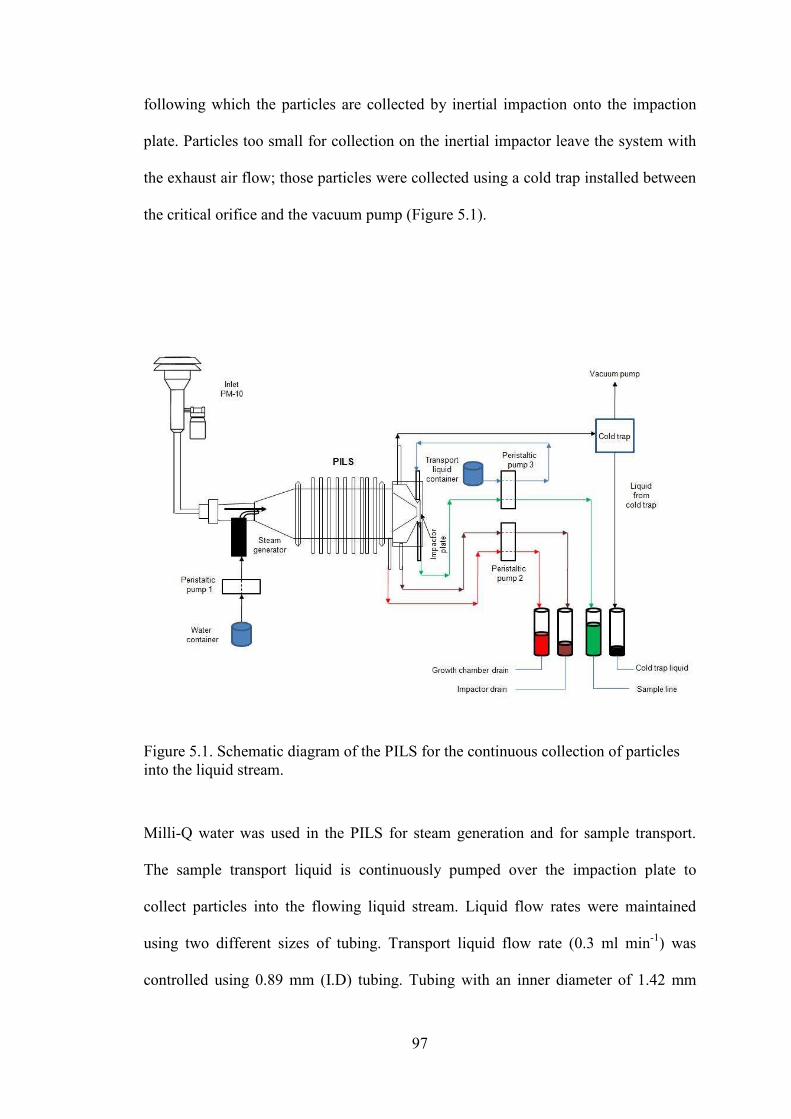
97
following which the particles are collected by inertial impaction onto the impaction
plate. Particles too small for collection on the inertial impactor leave the system with
the exhaust air flow; those particles were collected using a cold trap installed between
the critical orifice and the vacuum pump (Figure 5.1).
Figure 5.1. Schematic diagram of the PILS for the continuous collection of particles
into the liquid stream.
Milli-Q water was used in the PILS for steam generation and for sample transport.
The sample transport liquid is continuously pumped over the impaction plate to
collect particles into the flowing liquid stream. Liquid flow rates were maintained
using two different sizes of tubing. Transport liquid flow rate (0.3 ml min-1
) was
controlled using 0.89 mm (I.D) tubing. Tubing with an inner diameter of 1.42 mm

98
was used to collect samples from the PILS impactor cavity. The larger inner diameter
tubing was needed to ensure that all liquid sample was removed from the impactor
plate base because of droplet and condensation effects on the impactor plate. Flow
rates for the growth chamber drain (1.0 ml min-1
), impactor drain (1.0 ml min-1
) and
steam flow (1.5 ml min-1
) were controlled using 1.42 mm (I.D) peristaltic pump
tubing. The PILS’s condensation chamber was kept at a slight angle to collect wall
condensate and lost atmospheric particle mass from the growth chamber drain line.
5.3.2.2 High volume air sampler
A high-volume air sampler from HI-Q Environmental Products Company (Model
HVP-3300BRL) was used to collect atmospheric particulate matter onto glass-fiber
filters. The high-volume sampler holds a rectangular filter sized 8 x 10 inch (20.32 x
25.4 cm) supported by a wire mesh. This sampler entrains the air, using a flow
measurement control device, into the sampler through the filter by means of a blower,
so that particulate material collects on the filter surface. Particles with aerodynamic
diameter larger than 2.5 µm were collected on the filter during the 8-hour sampling
period on each sampling day. The sampler has a maximum entrainment rate of 50 ft3
min-1
(~84.95 m3 h
-1). However in this study, atmospheric particles were collected on
the filter at a sample air flow rate of 45 ft3
min-1
(~76.45 m3 h
-1) during the 8 hour
sampling period.
99
5.3.3 Reagents and standards
Milli-Q water (18.2 MΩ.cm) was used for preparation of all solutions and for the final
rinsing of containers. Doubled distilled nitric acid (prepared from 67 – 70 %, trace
metal grade, VWR, West Chester, PA, USA) and hydrochloric acid (prepared from 34
– 37%, trace metal grade, VWR, West Chester, PA, USA) were used for digestion of
the filter and PILS samples. A single element standard, 1000 mg U l-1
(Institute for
Reference Material and Measurement; IRMM-184) was diluted to prepare solutions
for the calibration curves.
5.3.4 Pre-treatment of the PILS and filter samples
5.3.4.1 Filter samples
Airborne particulate matter samples were collected on the filter paper in the high
volume air sampler. A piece (with an area of 20 in2) of filter paper loaded with
airborne particulates was cut from each filter and put into a Teflon tube. Particles
collected on the filter paper were dissolved by boiling in a mixture of 25% nitric acid
and 1% hydrochloric acid for 1 hour to ensure complete digestion of the particles on
the filter. An unused (clean) filter was treated in a similar manner to produce a
procedural blank. Afterwards, the digested samples were cooled and filtered through
a 0.45 µm pore size syringe filter (VWR International) to remove any undigested filter
100
material from the solution. Digested samples (in 25 % v/v nitric acid) were evaporated
and finally diluted with 2% nitric acid to 10 ml for ICP-MS analysis.
5.3.4.2 PILS samples
Samples were collected every thirty minutes and stored in screw-capped sample tubes
until analysis. The volume of the each sample collected was between 10 – 11.5 ml.
Each sample was diluted with Milli-Q water to a final volume of 12 ml. One half of
each sample was analyzed by ICP-MS for uranium concentration without any
pretreatment and the other half of the sample was digested with a mixture of 25 %
nitric acid and 1% hydrochloric acid using a laboratory microwave digestion system
(UltraCLAVE, Milestone Inc). Samples were put into Teflon digestion tubes and
digested by the microwave system using an initial ramping of heat for 20 minutes to
reach 160oC followed by digestion for 1 hour at 160
oC. After the digestion, samples
were removed from the Teflon tubes, evaporated, diluted with 2% nitric acid to 6 ml
and finally stored in screw-capped tubes until analysis.
5.3.5 Inductively coupled plasma mass spectrometric (ICP-MS) analysis
Prepared samples and blanks were analyzed for uranium concentration using a Varian
820 ICP-MS. The ICP-MS instrument was optimized using a 5 ppb tuning solution.
The operating conditions for the ICP-MS are summarized in Table 5.1.

101
Table 5.1:
Instrumental operating conditions and data acquisition parameters.
Parameters / Conditions Results
RF Power (KW) 1.40
Plasma gas flow rate (l min-1
) 18.00
Auxiliary gas flow rate (l min-1
) 1.80
Nebulizer gas flow rate (l min-1
) 0.95
Sampler and skimmer cone composition Nickel
Scan mode Peak hopping
Dwell time (µs) 10000
Sample replicates 5
Scan Segments 1 (238)
5.4 Results and discussion
5.4.1 Optimization of the PILS system
The PILS tip temperature was optimized at the temperature (approximately 90oC) at
which the steam flow transitioned from spitting to a steady steam jet i.e., with no
water drops coming out of steam injection tip. At 90oC, there was a clear star pattern
of the jet on the impactor plate indicating good steam generation for proper PILS
operation. Previously the PILS was optimized for the continuous monitoring of UO2
particles at concentrations typical of normal stack operations (Chapter 4). Results
showed that water was ineffective as a liquid for the transport of UO2 particles out of
the particle-into-liquid sampler system. Later, a sodium carbonate-hydrogen peroxide
solution was used for the PILS optimization for the continuous monitoring of UO2
particles. However, the concentration of particulate uranium is very low in the
ambient air compared to the concentrations typical of normal stack operations.
Therefore water was used as the sample transport liquid to collect all the particles out

102
of the PILS system and collected samples were digested using microwave digestion
method prior to analysis. When doing on-line elemental analysis using the PILS, it is
very important to know the exact sample flow rate in order to calculate the
concentration of the element of interest in ambient air. Weber et al. [10, 11] added a
known quantity of lithium fluoride to the sample flow to correct for differences in
sample volume during on-line analysis. In our study, analyses of samples were
conducted off-line, and so the addition of lithium fluoride was not required because
final volumes of the samples were measured directly.
5.4.2 Uranium concentrations in atmospheric particles
The concentration of uranium (Appendix 11) in digested samples varied from 6.7 pg
m-3
to 29.9 pg m-3
and from 3.1 to 12.7 pg m-3
in undigested samples (Figure 5.2),
when using the PILS during the sampling period (July- August 2010). The uranium
concentration varied from 9.9 pg m-3
to 36.7 pg m-3
in samples collected
simultaneously with filters (Appendix 11). For the Northern Hemisphere Atlantic
Ocean air a mean uranium content of 4.1 pg m-3
was reported [9] whereas at urban
and rural locations within New York State, average particulate uranium
concentrations in air ranged from 0.10 ng m-3
to 1.47 ng m-3
[8]. Atmospheric
uranium concentrations as high as 200 ng m-3
have been reported near nuclear fuel
production plants [5-7]. Uranium concentrations in our samples are thus lower than
the ambient uranium concentrations reported elsewhere.

103
Uranium ConcentrationJuly - August 2010
Sample Day
0 1 2 3 4 5 6 7 8 9
Uranium concentration (ug m
-3)
0.000001
0.000010
0.000100
0.100000
1.000000
10.000000PILS-digested samples
PILS- Un-digested samples
ATSDR MRL
WHO guidelines
Figure 5.2: Uranium concentrations during July and August 2010.
We collected three PILS samples (30 minutes for each sample, at 9 am, 12 am and 4
pm) over a period of 8 hours and used an average concentration of these samples to
compare with that of the high volume air sampler (one composite sample for 8 hours).
Total uranium concentrations in the air in all samples collected from Peterborough,
ON, Canada during July 2010 and August 2010 using the high volume air sampler
and the PILS (Figure 5.2) are well below World Health Organization (WHO)
guidelines (1 µg m-3
, [19]) and the U. S. Agency for Toxic Substances and Disease
Registry (ATSDR) minimum risk levels (MRLs; 0.3 µg m-3
, [3]) for uranium
exposure aimed to protect human health and aquatic life. The Ontario Ministry of
Environment (MOE) Canada has also identified the need to include uranium and
uranium compounds in air quality standards and has proposed a 24-hour average
standard of 0.03 µg m-3
in PM10 based on kidney toxicity associated with exposure in
air [20].

104
5.4.3 Monitoring of uranium in the air
The high volume air sampler is the most popular method for the collection of
suspended particulates in aerosols. In this study atmospheric particulate sampling was
carried out using both a high volume air sampler and the PILS. ICP-MS was used to
measure uranium concentrations in liquid samples.
High volume air sampler (pg m-3)
0 10 20 30 40
PILS after digestion (pg m
-3)
0
10
20
30
40
r2=0.98
y=0.816x-0.586
Figure 5.3: A comparison of uranium concentrations in atmospheric aerosols collected
using a high volume air sampler vs. the PILS
A comparison of uranium concentrations obtained from the PILS (after digestion) and
the filter (high volume air sampler) indicates a good relationship between the two
methods (R2
= 0.98; Figure 5.3). To our knowledge, this is the first time the PILS
(uranium) results have been compared directly with filter results. The uranium
measurements with the PILS (after digestion) were lower than those from the filter
(high volume air sampler). On average, the digested PILS uranium concentrations
were 80% of those collected using the high volume air sampler. This 20 % difference

105
maybe the result of several factors. First, particle sampling using a PM10 inlet is
designed to have a 50% cut-off point at 10 µm in wind speeds of up to 16 km h-1
, but
during the sampling period, wind velocity was as high as 20 km h-1
. Other possible
reasons could be passive deposition of windblown uranium containing dust particles
on the filter during filter installation and contamination of the filter during collection.
The comparison of the PILS and the filter results suggests that the PILS could be an
alternative method for monitoring uranium concentrations in atmospheric particles.
Until now, scientists have relied on the collection of atmospheric particles on filters
using a high volume air sampler over a long period of time. Filter sampling cannot
provide us with detailed information regarding the variation in atmospheric trace
metal concentrations in the short term (hours) because of long sampling times, sample
transport, sample storage and sample preparation before elemental analysis. However,
when using the PILS, the atmospheric particles can be continuously collected into a
small volume of liquid, and particulate elements can be rapidly monitored.
The collected particles on the filter using a high volume air sampler and also in the
small volume of liquid using the PILS, have to be dissolved in solution before
elemental analysis. Microwave digestion was not used for the digestion of the filter
paper because of the large size of the filter paper, which did not fit into the digestion
vessel. When the filter papers were cut into small pieces, which could be put into the
digestion vessels, the uranium concentrations were too low for measurement. In
contrast when using the PILS, particulate uranium was collected in a small volume of
liquid (10 – 11.5 ml per 30 minutes). This liquid could be digested with the
microwave system, making it possible for the accurate detection of uranium by ICP-

106
MS. This indicates the advantage of the PILS method over the filter method for
monitoring particulate uranium in air.
PILS without digestion (pg m-3)
0 10 20 30 40
PILS after digestion (pg m
-3)
0
10
20
30
40
Figure 5.4: Uranium concentrations measured using the PILS (with digestion vs.
without digestion)
Sample digestion is necessary to release uranium into the liquid prior to ICP-MS
analysis (Figure 5.4). There is no correlation between samples that were analyzed
without digestion versus those analyzed with digestion suggesting that only a small
fraction and constant amount of the uranium is easily extractable. Without digestion
uranium concentrations ranged between 2 and 12 pg m-3
representing 20 % - 96% of
the PILS digested samples (Appendix 11). Thus in this study 4 % - 80 % of uranium
in air is bound with particles. Therefore a sample digestion step is necessary to release
uranium into the liquid for analysis. In conclusion, considering that digested samples

107
from the PILS were well correlated with filter samples (Figure 5.3), we may infer that
our digestion process is appropriate to recover most of the particulate uranium.
For the inter-comparison study between the PILS and the high volume air sampler
(filter), all atmospheric particle sampling was carried out using 62 µm stainless steel
mesh (inside the PILS), A different mesh size (76µm; Appendix 11) also was tested
with the PILS to estimate the effect on particulate sampling efficiency. First of all, the
star pattern on the impactor, which is a good indicator of proper PILS operation, was
not as clear as it was with the 62 µm mesh. In addition, during sampling the sample
transport water passed through the mesh (rather than around the mesh) and was
unable to equally distribute transport liquid around the impactor plate. On average,
the PILS fitted with a mesh size of 76 µm collected only 46% of the uranium (in
digested samples) when compared to uranium collected using a high air volume
sampler.
The PILS is a very sensitive instrument and requires careful operation for proper
functioning. Steam flow rate is an important parameter for maintaining the PILS tip
temperature. Relative humidity is another factor that needs to be considered when
operating the PILS in different weather conditions; also the size of the stainless steel
mesh, which can affect the particle collection efficiency of the PILS. Another
important parameter of the PILS operation is ambient temperature. In our work we
installed the PILS on the roof enclosed in a small housing. On hot days (> 25oC), the
PILS heater overheated after a couple of hours of continuous use requiring that it be
turned off for short time (~30 min) and then started again for proper operation. For

108
continuous operation it is recommended that the PILS be installed in an air-
conditioned room (with controlled temperature and humidity).
Atmospheric particle collection on filters using a high volume sampler is not suitable
for investigating variations in atmospheric trace metal concentrations on shorter time
scales because of the long sampling time needed to collect enough sample for
measurement, sample transport, sample storage and sample preparation before sample
chemical analysis. However, the PILS collects aerosol particles from the airstream
and transfers them to a small volume of liquid that can be coupled with a flow
microwave digestion system to speed up the particle digestion process. Coupling it
with the analytical instrument eliminates problems in storing the samples and
guarantees contamination free analysis. Other advantages of the PILS system over
filter sampling include a reduction in sampling time and cost.
The PILS can be used for the continuous monitoring of metal emissions with the
appropriate transport solution, which is obtained by adjusting the transport liquid flow
rate and sample air flow rate. Assuming that ICP-MS measurements require a
minimal sample size of 3 ml (depending on pump intake rates of ICP-MS), the
minimal sampling time for the PILS could be as low as 10 minutes using a transport
liquid flow rate of 0.3 ml min-1
. Our results show that the lowest measured
concentration of particulate uranium in the ambient air was ~ 5.0 pg m-3
during the
sampling period. If the ambient air is sampled for 10 minutes using the PILS with a
transport liquid flow rate of 0.3 ml min-1
, the particulate uranium concentration in the
liquid sample will be higher than the detection limit of the ICP-MS [21]. Therefore a

109
sample collection time of 10 minutes would be sufficient to collect enough particles
into the liquid using the PILS system. The collected sample will be ready for ICP-MS
analysis after sample digestion (for one hour). It is thus an effective instrument for
aerosol collection into a liquid, very reproducible, and easy to use. When combined
with microwave flow digestion and ICP-MS, PILS can provide us with detailed
information on atmospheric metal concentrations.

110
5.5 References
1. CCME, Canadian soil quality guidelines for uranium: Environmental and
human health. In Canadian Council of Ministers of the Environment (CCME),
PN 1371, ISBN 978-1-896997-64-3 PDF.: 2007.
2. Kuroda, P. K.; Essien, I. O.; Sandoval, D.-N., Fallout of uranium isotopes
from the 1980 eruption of mount St. Helens. Journal of Radioanalytical and
Nuclear Chemistry 1984, 84, 23-32.
3. ATSDR, Toxicological profile of uranium. In Agency for toxic substances and
disease registry (ATSDR); U.S. Department of Health and Human Services,
Public Health Service: Atlanta, GA, 1999.
4. Tadmor, J., Atmosheric release of volatilized species of radioelements from
coal-fired plants. Health Physics 1986, 50, 270-273.
5. Tracy, B. L.; Meyerhof, D. P., Uranium concentration in air near a Canadian
uranium refinery. Atmospheric Environment 1987, 21, 165-172.
6. Ahier, B. A.; Tracy, B. L., Evaluating the radiological impact of uranium
emissions in Port Hope, Ontario – A comparison of monitoring and modeling.
Journal of Environmental Radioactivity 1997, 34, 187-205.
7. Al-Khayat, T. A. H.; Eygen, B. v.; Hewitt, C. N.; Kelly, M., Modelling and
measurement of the dispersion of radioactive emissions from a nuclear fuel
fabrication plant in the U.K. Atmospheric Environment 1992, 26A, 3079-3087.
8. McEachern, P.; Myers, W. G.; White, F. A., Uranium concentration in surface
air at rural and urban localities within New York State. Environmental Science
and Technology 1971, 5, 700-703.
9. Hamilton, E. I., The concentration of uranium in air from contrasted natural
environments. Health Physics 1970, 19, 511-520.
10. Weber, R. J.; Orsini, D.; Daun, Y.; Lee, Y.-N.; Klotz, P. J.; Brechtel, F., A
Particle-into-Liquid collector for rapid measurement of aerosol bulk chemical
composition. Aerosol Science and Technology 2001, 35, 718-727.
11. Orsini, D. A.; Ma, Y.; Sullivan, A.; Sierau, B.; Baumann, K.; Weber, R. J.,
Refinement to the particle-into-liquid sampler (PILS) for ground and airborne
measurements of water soluable aerosol composition. Atmospheric
Environment 2003, 37, 1243-1259.
12. Okuyama, K.; Kousaka, Y.; Motouchi, T., Condensation growth of ultrafine
aerosol particles in a new particle size magnifier. Aerosol Science and
Technology 1984, 3, 353-366.
13. Lange, P. W. D.; Venter, J. H.; Wet, W. J. D., Non-destructive neutron
activation analysis of gold and uranium in residue samples of different ore
bodies. Journal of Radioanalytical Chemistry 1969, 2, 219-228.
14. Dragnev, T. N.; Karamanova, J.; Damianov, B., Precise non-destructive x-ray
fluorescence method for uranium and thorium concentration measurements.
Journal of Radioanalytical Chemistry 1979, 52, 439-448.
15. Berdikov, V. V.; Grigor’EV, O. I.; Iokhin, B. S., X-ray fluorescence
determination of uranium and neighbouring elements in solution. Journal of
Radioanalytical Chemistry 1982, 68, 181-192.
16. Boomer, D. W.; Powell, M. J., Determination of uranium in environmental
samples using inductively coupled plasma mass spectrometry. Analytical
Chemistry 1987, 59, 2810-2813.

111
17. Bou-Rabee, F., Estimating the concentration of uranium in some
environmental samples in Kuwait after the 1991 Gulf War. Applied Radiation
and Isotopes 1995, 46, 217-220.
18. Santos, J. S.; Teixeira, L. S. G.; Santos, W. N. L. d.; Lemos, V. A.; Godoy, J.
M.; Ferreira, S. L. C., Uranium determination using atomic spectrometric
techniques: An overview. Analytica Chimica Acta 2010, 674, 143-156.
19. WHO, World Health Organization, Fact Sheet No. 257. In 2003.
20. MOE, Rationale for the development of Ontario air standards for uranium and
uranium compounds. In Ministry of Environment - Standards Development
Branch Ontario: 2009.
21. Becker, J. S., Inductively coupled plasma mass spectrometry (ICP-MS) and
laser ablation ICP-MS for isotope analysis of long-lived radionuclides.
International Journal of Mass Spectrometry 2005, 242, 183-195.

112
Chapter 6
General Discussion and Conclusions
113
6.1 General Discussion and Conclusions
Particulate matter (PM) is an air pollutant that is suspended in the air and represents a
complex mixture of organic and inorganic substances depending on the source. PM
can stay in the air from a few hours to several days and can be transported over long
distances. Exposure to particulate matter consistently shows adverse effects on human
health. For example, exposure to uranium and rare earths can cause lung cancer,
kidney damage, respiratory diseases, lower mental age and intelligence in children
and damage to the central nervous system; it also affects activities of some digestive
enzymes [1-4], etc.
Nowadays, uranium and rare earth elements are widely used in industry and as a
result, industrial demand has increased rapidly. Therefore global production of these
elements has increased every year. Along with worldwide use of these elements, large
quantities are emitted into the atmosphere from industry. Therefore, it is important to
continuously monitor the concentrations of these elements in ambient air, as well as
the release from industrial stacks for the emission control and compliance with
emission standards.
Most of the analytical instruments require sample dissolution before elemental
analysis. Therefore, dissolution of uranium dioxide (UO2) and uranium tetrafluoride
(UF4) particles was investigated in an aqueous carbonate medium at room temperature.
The goal was to determine experimentally the best combination of sodium carbonate
(wt %) and hydrogen peroxide (wt %) for the dissolution of uranium dioxide and
uranium tetrafluoride focusing on a high initial dissolution rate (considering the short

114
residence time for the transport of liquid in the PILS system). The optimal sodium
carbonate (Na2CO3) / hydrogen peroxide (H2O2) solution then can be used in the PILS
as a sample transport liquid for the continuous monitoring of uranium. Peper et al. [5]
studied the dissolution kinetics of UO2 powder in aqueous carbonate media at room
temperature using various oxidants and among those oxidants, hydrogen peroxide
(H2O2) showed the most rapid initial dissolution rate.
From dissolution experiments, it was found that UO2 dissolution increases with an
increase in carbonate concentration in the solution with maximum dissolution at 5
wt % of sodium carbonate concentration. It was also found that UO2 and UF4 particle
dissolution rates increase with an increase in H2O2 concentration, with a maximum
initial dissolution rate at 0.15 wt % of H2O2 in the solution. UF4 particles had higher
initial dissolution rates and high solubility (completely dissolved within 3 minutes) in
Na2CO3-H2O2 solutions compared to UO2 particles. A sodium carbonate (5 wt %) /
hydrogen peroxide (0.15 wt %) solution was found to be the most favorable
combination for the dissolution of UO2 and UF4 particles at room temperature.
A microwave digestion method was also developed for the digestion of six commonly
used rare earth oxides, including praseodymium oxide (Pr6O11), neodymium oxide
(Nd2O3), samarium oxide (Sm2O3), gadolinium oxide (Gd2O3), dysprosium oxide
(Dy2O3) and ytterbium oxide (Yb2O3) using nitric acid. Experimental results show
that a combination of a closed vessel with microwave heating and 2 % v/v nitric acid
at 100oC for 60 minutes yields greater than 90% recoveries of all six REEs.
A method for continuous monitoring of uranium-containing particles (UO2 and UF4)
in high particle concentration environments was developed for the control of

115
emissions and compliance with emission standards, and to provide timesaving cost
benefits, control of parameters and an improvement in process efficiency. A fluidized
bed aerosol generator was used to generate high purity UO2 and UF4 aerosols at a rate
of 1-5 mg h-1
to simulate stack conditions and the PILS was used to capture those
particles into the small volume of transport liquid. Initially the PILS was operated
with water as the sample transport liquid. However, during the PILS operation,
particle build-up was clearly observed on the impaction plate and blockage was
evident in drain lines, at concentrations typical of normal stack operations. This may
be due to the insolubility of uranium particles in water, a low transport liquid flow
rate (0.4 ml min-1
) and a higher particle concentration in sampled air. Particle build-up
and blockage in drain lines can be eliminated and the particle mass collection
efficiency in the PILS sample line can be improved by changing the chemistry of the
transport liquid or sample transport liquid flow. Therefore, it was decided to change
the transport liquid and transport liquid flow rate to eliminate blockage in the drain
line and improve particle mass collection in the sample line. Depending on the
composition of the particles, there are different possibilities for eliminating particle
build-up and blockage in drain lines including the use of acid and alkaline solutions as
transport liquids. The PILS body material restricted the use of acids or acid
combinations as transport liquids because they may result in high corrosion of the
mesh and other parts of the PILS system. Therefore, Na2CO3 (5 wt %) - H2O2 (0.15
wt %) solution was used as sample transport liquid to dissolve UO2 and UF4 particles
inside the PILS. The transport liquid flow rate was increased to 0.5 and 0.7ml min-1
to
reduce chances of particle blockage in transport lines and the PILS system was
optimized for maximum particle mass recovery in the sample line plus impactor drain.

116
The data collected during the PILS optimization experiments show that sample air
flow rate (l min-1
) has a significant effect on particle collection efficiency. The
combination of a sample air flow rate of 10 l min-1
(for UO2) or 16.7 l min-1
(for UF4),
a steam flow rate of 1.5 ml min-1
and a sample transport solution flow rate of 0.5 ml
min-1
demonstrated greater than 89% recovery of the particle mass of UO2 and greater
than 92% recovery for UF4 in the sample plus impactor drain lines. The sodium
carbonate / hydrogen peroxide solution was found to be preferable to water for the
collection of UO2 and UF4 because particle build-up on the impaction surface and
blockages in liquid transport lines were eliminated. Hygroscopic particles (UF4)
required a shorter residence time compared to non-hygroscopic particles (UO2) in the
growth chamber for the growth of smaller particle to a droplet size (> 1µm) necessary
to collect on the PILS impactor plate. Our results demonstrate that the PILS is suitable
technology for UO2 and UF4 particle sampling in high particle concentration
environments. A PILS unit can be installed on an industrial stack for the continuous
emission monitoring of different types of particles with the appropriate transport
solution, and by adjusting the transport liquid flow rate and sample air flow rate.
After optimization of the PILS for the continuous monitoring of UO2 and UF4
particles at concentrations typical of normal stack operations, the PILS system was
then used for continuous monitoring of atmospheric particulate uranium in ambient
air. Atmospheric particle collection also was carried out with a traditional high
volume air sampler (filter) and a comparison was made between particulate uranium
concentrations in particles collected by the PILS and the filter (high volume air
sampler). The concentration of uranium in digested samples varied from 6.7 pg m-3
to
29.8 pg m-3
, when samples were collected using the PILS during the sampling period

117
(July- August 2010) whereas the uranium concentration varied from 9.9 pg m-3
to
36.8 pg m-3
in samples collected with filters. Results showed that uranium
concentrations in particles collected with the high volume air sampler using filters
were consistently higher than in aerosols collected with the PILS. The PILS and filter
results show a good correlation (R2
= 0.98); on average the PILS collected 80% of
uranium found in the filter samples. However, the PILS system continuously collects
particles into a small volume of liquid and after microwave digestion, the sample can
be accurately analyzed for uranium concentration. This indicates the advantage of the
PILS method over the filter method for monitoring particulate uranium in air.
Initially, the PILS system was optimized for the monitoring of UO2 (density = 10.96 g
cm-3
, non-hygroscopic) and UF4 (density = 6.7 g cm-3
, hygroscopic). To test the
applicability of the PILS for continuous monitoring of different elements of interest in
ambient air or at an industrial stack, particles (rare earth oxides) with different
hygroscopic properties and densities were investigated. A microwave digestion
method using nitric acid was developed for the digestion of six commonly used rare
earth oxides, including Pr6O11, Nd2O3, Sm2O3, Gd2O3, Dy2O3 and Yb2O3. This sample
digestion method can be used for the continuous monitoring of trace quantities of
REEs using the PILS without further sample dilution because the digestions were
conducted using 2% (v/v) nitric acid. Future studies should investigate in greater
detail the effects of physical and chemical properties of the particles on the PILS
collection efficiency. Rare earth oxides powders, including Pr6O11, Nd2O3, Sm2O3,
Gd2O3, Dy2O3 and Yb2O3 with densities ranging from 6.7 – 9.2 g cm-3
(in between
UF4 and UO2 powder density) could be useful for the understanding collection
efficiency behavior of the PILS for different particles.

118
The PILS is a very sensitive instrument and requires careful operation for proper
functioning. Our experiments show that maintaining a constant liquid flow rate for
consistent steam generation is one of the key factors that affect particle growth.
Switching from peristaltic pumps to computer controlled syringe pumps will provide
better control over the liquid flow rates and improve measurement precision.
Changing the chemistry of the transport liquid or using warm transport liquid may
increase the solubility of particles in the system. Relative humidity is another factor
that needs to be considered when operating the PILS in different weather conditions.
Another important parameter of PILS operation is ambient temperature. In our work
we installed the PILS on the roof in a small wooden housing to minimize sample line
(transport losses). On hot days (> 25oC), the PILS heater overheated after a couple of
hours of continuous use requiring that it be turned off for short time (~30 min) and
restarted for proper operation. In future, for continuous operation, it is recommended
that the PILS be installed in an air-conditioned room (with controlled temperature and
humidity) in order to improve the PILS collection efficiency. Faster measurement is
more preferable and important for heavy metal releases from industry into the
environment for process control. The PILS can be directly coupled to an analytical
instrument to measure the miscible particles in aqueous and non aqueous media. In
the case of non-soluble particles, microwave flow digestion can be coupled between
the PILS and the analytical instrument for direct analysis of elements in the
environment, providing a better understanding and time-dependent information on
aerosol composition.

119
The Canadian Environmental Protection Act (CEPA) 1999 is an act for preventing
pollution and for the protection of the environment and human health. Each province
has its own environmental statutes. For example the Ontario Ministry of the
Environment (MOE), Ontario Regulation 127/01 (airborne contaminant discharge
monitoring and reporting) was introduced in 2001 under the Environmental Protection
Act for Ontario-based facilities that release certain quantities of specific substances,
requiring them to report their emissions to the government. This guideline also
addresses the installation and operation of continuous emission monitoring systems.
Another example, MOE Ontario Regulation 419/05, which came into effect on
November 2005 regulates industrial emissions of specific contaminants. In 2009, the
MOE proposed a amendment to Ontario regulation 419/05 and introduced new or
updated standards for 9 contaminants including uranium (Environmental Bill Rights;
EBR registry Number 010-7190); all the new or updated standards will be in effect as
of July 01, 2016. In 2009, the Ontario Toxic Reduction Act also was passed by the
Ontario legislature and will be phased in starting in 2012. Under this act, facilities
have to prepare a toxic substance reduction plan during phase one and have to track
and quantify toxic substances release into the environment during phase two.
Installation of an optimized PILS on industrial stacks for continuous emission
monitoring can help with emission control and compliance with the emission
standards imposed by regulatory agencies. Because the PILS can provide real-time
information about the concentrations of elements, it can flag potential non-compliance
situations or relate the effects of source emissions to ambient air quality. Continuous
emission monitoring can also help correlate industrial emission releases with process
variables, information that will also fulfill the Ontario Toxic Reduction Act 2009
requirements.

120
Continuous emission monitoring of toxic substances helps regulatory authorities
manage their impact on the environment. The continuous atmospheric monitoring of
elements of interest having very low concentrations in the environment requires an
instrument with very low detection limit with a fast response time. Assuming that
ICP-MS measurement requires a minimal sample size of 3 ml (depending on pump
intake rates of ICP-MS), the minimal sampling time for PILS could be as low as 10
minutes using a transport liquid flow rate of 0.3 ml min-1
. Our results show that
lowest measured concentration of particulate uranium in the ambient air was ~ 5.0 pg
m-3
during the sampling period. If ambient air is sampled for 10 minutes using the
PILS with a transport liquid flow rate of 0.3 ml min-1
, the particulate uranium
concentration in the liquid sample will be higher than ICP-MS detection limit.
Therefore a sample collection time of 10 minutes would be sufficient to collect
enough particles into the liquid using PILS system. This is not possible using a filter
system.
Collected samples need to be digested before sample analysis and this is the limiting
step towards fast and real-time quantification of aerosol composition. This can be
resolved by optimizing the appropriate transport solution for the dissolution of
particles within the PILS system, e.g. by changing the temperature of the transport
liquid and/or by using concentrated acid or a combination of both. The use of
concentrated acid in the PILS (as it is currently constructed) is not allowed, but by
changing the PILS body material, concentrated acid may be used to dissolve particles
within the system and thus provide real-time quantification of the aerosol composition
under ambient conditions. Upon successful installation of an optimized PILS unit at
an industrial stack or for PM measurements in ambient air, continuous online

121
monitoring of industrial wastes would result in time savings, cost benefits, greater
control of parameters, better evaluation of the maintenance needs of control
equipment and improved industrial process efficiency.

122
6.2 References
1. Bleise, A.; Danesi, P. R.; Burkart, W., Properties, uses and health effects of
depleted uranium (DU): a general overview Journal of Environmental
Radioactivity 2003, 64, 93-112.
2. Zhu, W. F.; Xu, S. Q.; Zhang, H.; Shao, P. P.; Wu, D. S.; Yang, W. J.; Feng, J.,
Investigation of children intelligence quotient in REE mining area: Bio-effect
study of REE mining area in South Jiangxi province. Chinese Science Bulletin
1996, 41, 914-916.
3. Zhu, W.; Xu, S.; Shao, P.; Zhang, H.; Wu, D.; Yang, W.; Feng, J.,
Bioelectrical activity of the central nervous system among populations in a
rare earth element area. Biological Trace Element Research 1997, 57, 71-77.
4. Zhu, W.; Xu, S.; Shao, P.; Zhang, H.; Wu, D.; Yang, W.; Feng, J.; Feng, L.,
Investigation on liver function among population in high background of rare
earth area in South China. Biological Trace Element Research 2005, 104, 1-7.
5. Peper, S. M.; Brodnax, L. F.; Field, S. E.; Zehnder, R. A.; Valdez, S. N.;
Runde, W. H., Kinetic study of oxidative dissolution of UO2 in aqueous
carbonate media. Industrial and Engineering Chemistry Research 2004, 43,
8188-8193.

123
Appendices

124
Appendix 1: Summary of UO2 dissolution tests – UO2 dissolution (%) in solutions of different sodium carbonate - hydrogen peroxide
concentrations as a function of time.
H2O2 = 0.15 wt%
Time (min) Na2CO3 = 0 wt% Na2CO3 = 1 wt% Na2CO3 = 3 wt% Na2CO3 = 5 wt% Na2CO3 = 7wt%
0 0.0 0.0 0.0 0.0 0.0
1 0.0 2.3 2.3 3.6 1.9
3 0.5 6.6 7.0 9.0 5.0
5 0.3 12.3 12.7 15.9 8.7
10 0.3 26.6 27.1 32.1 19.6
20 0.3 54.8 56.9 57.6 42.5
30 0.0 71.9 75.2 72.6 61.6
60 0.3 91.3 96.6 94.1 83.5
Na2CO3 = 5 wt%
Time (min) H2O2 = 0 wt% H2O2 = 0.025 wt% H2O2 = 0.05 wt% H2O2 = 0.15 wt% H2O2 = 0.3 wt%
0 0.0 0.0 0.0 0.0 0.0
1 0.0 0.5 1.5 3.6 3.6
3 0.0 1.9 9.0 9.7
5 0.5 2.7 4.6 15.9 17.4
10 0.3 5.3 9.5 32.1 36.9
20 0.0 11.7 21.2 57.6 62.7
30 0.5 18.7 33.0 72.6 74.4
60 0.4 36.0 57.8 94.1 93.7

125
Appendix 2: Summary of UF4 dissolution tests - UF4 dissolution (%) in solutions of different sodium carbonate - hydrogen peroxide
concentrations as a function of time.
H2O2 = 0.01 wt%
Time
(min) Na2CO3 = 0 wt% Na2CO3 = 1 wt% Na2CO3 = 3 wt% Na2CO3 = 5 wt%
0 0.0 0.0 0.0 0.0
1 6.1 22.5 28.8 32.6
3 8.2 47.8 51.1 51.1
5 8.9 73.9 64.0 61.6
10 17.2 91.4 79.2 76.0
20 32.2 96.2 91.2 89.3
30 51.8 98.2 95.1 91.3
60 78.9 100.8 99.7 94.4
Na2CO3 = 5wt%
Time
(min)
H2O2 = 0
wt%
H2O2 = 0.005
wt%
H2O2 = 0.01
wt%
H2O2 = 0.025
wt%
H2O2 = 0.05
wt%
H2O2 = 0.15
wt%
H2O2 = 0.3
wt%
0 0.0 0.0 0.0 0.0 0.0 0.0 0.0
1 6.8 23.3 32.6 41.7 63.6 86.9 94.6
3 6.9 35.2 51.1 67.2 88.8 100.0 102.3
5 7.5 41.8 61.6 81.6 96.3 101.0 104.7
10 7.8 51.1 76.0 87.9 102.3 102.6 105.5
20 9.3 55.3 89.2 90.1 103.3 102.3 101.5
30 10.6 56.0 91.3 94.7 103.1 104.5 104.1
60 12.9 62.5 94.4 96.3 108.6 107.0 101.2

126
Appendix 3: Summary of rare earth oxides powder digestion tests.
Microwave digestion: Percentage recovery (%) of rare earth elements using sample sizes of 20, 40, 60 and 80 mg (5 replicates for each mass)
and digested using 20 ml of 50 % (v/v) nitric acid at 100oC for 15 minutes.
Microwave Digestion
20 ml (50% HNO3), 15 min, 100oC
Rare Earth Element 20mg 40mg 60mg 80 mg
Praseodymium (Pr) Average 97.9 93.3 84.8 83.6
SD 1.1 1.4 2.0 1.6
Neodymium (Nd) Average 60.6 58.4 58.1 57.7
SD 1.4 1.5 1.1 0.8
Samarium (Sm) Average 87.5 91.7 88.1 83.0
SD 2.2 2.1 1.3 1.2
Gadolinium (Gd) Average 84.6 85.6 80.8 79.8
SD 2.4 2.8 1.2 2.2
Dysprosium (Dy) Average 89.8 87.9 84.8 84.9
SD 1.7 3.0 1.4 1.3
Ytterbium (Yb) Average 91.2 86.9 86.9 85.2
SD 1.7 2.4 1.2 2.2

127
Microwave digestion: Percentage recovery (%) of rare earth elements for various nitric acid concentrations and digestion times. Nitric acid
concentration varied between 2 and 20% (v/v) (5 replicates for each acid concentration). Digestion time varied between 30 minutes and 60
minutes (5 replicates for each time). Samples (20 mg) were digested using 20 ml of nitric acid at 100oC.
Microwave Digestion
20 mg, 20 ml (HNO3), 100oC
Rare Earth Element 30 min 45min 60 min
2% 2% 5% 20% 2% 5%
Praseodymium (Pr) Average 90.0 92.8 93.4 94.7 93.7 91.4
SD 1.8 2.7 3.1 2.6 1.9 3.4
Neodymium (Nd) Average 87.0 86.1 90.4 92.2 90.2 94.6
SD 2.1 4.3 1.7 1.4 1.4 2.6
Samarium (Sm) Average 92.0 93.5 93.4 93.7 95.2 94.1
SD 3.2 4.2 3.2 3.7 0.8 4.6
Gadolinium (Gd) Average 85.6 88.8 90.5 89.7 92.7 93.2
SD 3.9 4.1 1.5 2.7 4.4 3.7
Dysprosium (Dy) Average 92.6 91.4 97.9 97.4 94.9 97.7
SD 2.1 2.4 2.6 3.0 4.3 2.7
Ytterbium (Yb) Average 90.5 91.2 96.1 96.5 93.9 95.7
SD 2.9 2.9 1.6 3.7 1.5 5.1

128
Hot Plate digestion: Percentage recovery (%) of rare earth elements. Digestion time varied between 30 minutes and 90 minutes (5 replicates for
each time). Samples (20 mg) were digested using 20 ml of 2 % (v/v) nitric acid at 100oC.
Hot plate
20 mg, 20 ml (2% HNO3), 100oC
Rare Earth Element 30 min 60 min 90 min
Praseodymium (Pr) Average 81.7 81.7 81.9
SD 2.2 1.8 1.8
Neodymium (Nd) Average 80.6 85.3 84.0
SD 3.0 2.5 2.9
Samarium (Sm) Average 87.3 87.3 87.7
SD 1.2 2.1 1.9
Gadolinium (Gd) Average 74.2 74.8 75.9
SD 3.1 2.7 2.8
Dysprosium (Dy) Average 84.8 84.5 85.5
SD 2.9 2.6 2.1
Ytterbium (Yb) Average 79.6 81.6 84.6
SD 3.0 2.6 1.7

129
Appendix 4: PILS-UO2 optimization - initial tests.
Percentage of Uranium Recovered from Different Parts of the PILS
Test Mass (mg) Sample Impactor Impactor Filter Growth Chamber Cold Filter + Growth Cahmber
Line Wash Drain Drain Trap Cold Trap
1 0.33 68.2 10.6 9.1 12.1 0.0 0.0 12.1
2 0.36 67.6 8.5 11.3 12.7 0.0 0.0 12.7
3 0.28 56.4 12.7 12.7 18.2 0.0 0.0 18.2
4 0.18 38.9 22.2 19.4 19.4 0.0 0.0 19.4

130
Appendix 5: PILS - UO2 particle recovery (%) in different parts of the PILS (sample line, impactor drain, growth chamber, cold trap and
filter) during different experimental runs (total of 24 experimental runs). For example, run 1 was performed on day 1, using a medium aerosol
rate (i.e. conc. of particles), a transport liquid flow rate of 0.5 ml min-1
and sample air flow rate of 10 l min-1
.
Conc. Liquid flow Air flow Mass Uranium dioxide recovery (%) in different parts of the PILS
Run Rate Rate collected Sample Impactor Growth Sample + Cold Filter Cold Trap +
Day Levels ml min-1 l min
-1 mg Line Drain Chamber Impactor Trap Filter
1 1 Medium 0.5 10.0 1.6538 89.38 2.97 7.66 92.34 0.00 0.00 0.00
2 1 Low 0.5 16.7 0.9882 97.24 0.58 0.00 97.82 2.18 0.00 2.18
3 1 High 0.5 16.7 4.0883 99.11 0.47 0.42 99.58 0.00 0.00 0.00
4 1 High 0.5 10.0 2.4399 79.09 1.98 18.95 81.05 0.00 0.00 0.00
5 1 Low 0.7 10.0 1.4702 58.30 3.10 38.25 61.40 0.34 0.00 0.34
6 1 High 0.7 16.7 4.1976 67.64 12.59 19.57 80.23 0.20 0.00 0.20
7 1 High 0.7 10.0 3.2536 86.56 0.62 12.49 87.17 0.34 0.00 0.34
8 1 Medium 0.5 16.7 1.5890 94.43 5.01 0.56 99.44 0.00 0.00 0.00
9 1 Low 0.5 10.0 1.2664 82.19 7.93 9.87 90.13 0.00 0.00 0.00
10 1 Low 0.7 16.7 1.2920 97.63 2.37 0.00 100.00 0.00 0.00 0.00
11 1 Medium 0.7 16.7 1.5177 84.99 13.58 0.78 98.57 0.78 0.66 1.44
12 1 Medium 0.7 10.0 2.6266 95.54 0.54 3.67 96.09 0.24 0.00 0.24
13 2 Low 0.5 10.0 2.0180 83.28 3.69 11.34 86.97 0.69 0.99 1.68
14 2 High 0.7 10.0 3.6781 93.55 1.45 5.00 95.00 0.00 0.00 0.00
15 2 High 0.7 16.7 4.2901 66.28 6.15 27.33 72.44 0.23 0.00 0.23
16 2 Medium 0.7 10.0 1.5707 94.19 1.75 4.06 95.94 0.00 0.00 0.00
17 2 Low 0.5 16.7 1.3585 68.49 14.72 16.05 83.21 0.00 0.74 0.74
18 2 Medium 0.5 10.0 1.3240 95.95 2.19 1.12 98.13 0.75 0.00 0.75
19 2 Low 0.7 16.7 2.0303 43.57 28.68 27.06 72.25 0.69 0.00 0.69
20 2 Medium 0.5 16.7 1.6377 44.07 4.95 50.40 49.03 0.57 0.00 0.57
21 2 Medium 0.7 16.7 2.1384 52.81 12.38 34.82 65.18 0.00 0.00 0.00
22 2 Low 0.7 10.0 1.1489 90.01 1.27 6.24 91.28 1.61 0.87 2.48
23 2 High 0.5 10.0 2.9665 65.60 32.33 2.07 97.93 0.00 0.00 0.00
24 2 High 0.5 16.7 4.8625 64.81 9.05 26.14 73.86 0.00 0.00 0.00

131
Appendix 6: Effects of individual variables such as sample air flow rate (10 and 16.7 l min-1
; 12 experimental runs for each sample air flow
rate), transport liquid flow rate (0.5 and 0.7 ml min-1
; 12 experimental runs for each transport liquid flow rate) and for their combinations (6
experimental runs for each combination) on PILS-UO2 particle recovery (%) in different parts of the PILS (sample line, impactor drain, growth
chamber, cold trap and filter).
Individual variables Mass Uranium dioxide recovery (%) in different parts of the PILS
And collected Sample Impactor Growth Sample+ Cold Filter Cold Trap +
Combinations Mg Line Drain Chamber Impactor Trap Filter
10 l min-1
Average 2.1 89.0 2.4 8.0 91.4 0.4 0.1 0.5
SD 0.9 6.0 2.2 5.3 5.2 0.5 0.4 0.9
16.7 l min-1
Average 3.3 73.4 9.2 16.9 82.6 0.4 0.1 0.5
SD 3.1 20.8 7.9 16.8 16.7 0.6 0.3 0.7
0.5 ml min-1
Average 3.0 81.6 4.9 13.0 86.5 0.4 0.1 0.5
SD 3.1 16.9 4.3 15.1 15.0 0.7 0.4 0.8
0.7 ml min-1
Average 2.4 77.6 7.0 14.9 84.6 0.4 0.1 0.5
SD 1.1 18.9 8.4 13.8 13.8 0.5 0.3 0.7
10 l min-1 &
0.5 ml min-1
Average 1.9 86.0 3.8 9.8 89.7 0.2 0.2 0.4
SD 0.7 6.7 2.4 6.4 6.3 0.4 0.4 0.7
16.7 l min-1 &
0.7 ml min-1
Average 2.6 68.8 12.6 18.3 81.4 0.3 0.1 0.4
SD 1.3 20.0 9.0 14.7 14.6 0.3 0.3 0.6
10 l min-1 &
0.7 ml min-1
Average 2.3 86.4 1.5 11.6 87.8 0.4 0.2 0.6
SD 1.0 14.1 0.9 13.4 13.4 0.6 0.4 1.0
16.7 l min-1 &
0.5 ml min-1
Average 4.1 78.0 5.8 15.6 83.8 0.5 0.1 0.6
SD 4.3 22.4 5.4 20.1 11.7 0.9 0.3 0.8

132
Appendix 7: PILS-UO2 optimization – t-test results for recovery in sample line plus impactor drain.
Results of eight different experiments for each aerosol rate (low, medium and high) show an average particle mass collection recovery of
85.4 % in the sample plus impactor drain, with a variance of 168.6 for the low rate. For the high aerosol rate, the average particle mass
collection recovery is 85.9 % in the sample plus impactor drain, with a variance of 114.0. There is no significant difference (p > 0.05) in
uranium dioxide particle collection efficiency in the sample line plus impactor drain at different aerosol flow rates (low, medium and high)
that were introduced into the system. There is also no significant difference (p > 0.05) in uranium dioxide particle collection efficiency in the
sample line plus impactor drain at different transport liquid flow rates (between 0.5 and 0.7 ml min-1
) and sample air flow rates (between 10
and 16.7 l min-1
).
t-Test: Two-Sample Assuming Equal Variances t-Test: Two-Sample Assuming Equal Variances
No significant difference No significant difference
Aerosol rate Low medium Aerosol rate Low high
Mean 85.3825 86.84 Mean 85.3825 85.9075
Variance 168.64925 360.1701714 Variance 168.64925 114.0129
Observations 8 8 Observations 8 8
Pooled Variance 264.4097107 Pooled Variance 141.3310786
Hypothesized Mean Difference 0 Hypothesized Mean Difference 0
Df 14 Df 14
t Stat -0.179266797 t Stat -0.088322319
P(T<=t) one-tail 0.430148399 P(T<=t) one-tail 0.465435738
t Critical one-tail 1.761310115 t Critical one-tail 1.761310115
P(T<=t) two-tail 0.860296798 P(T<=t) two-tail 0.930871476
t Critical two-tail 2.144786681 t Critical two-tail 2.144786681

133
t-Test: Two-Sample Assuming Equal Variances
No significant difference
Aerosol rate Medium High
Mean 86.84 85.9075
Variance 360.1701714 114.0129071
Observations 8 8
Pooled Variance 237.0915393
Hypothesized Mean Difference 0
Df 14
t Stat 0.121121379
P(T<=t) one-tail 0.452658066
t Critical one-tail 1.761310115
P(T<=t) two-tail 0.905316133
t Critical two-tail 2.144786681
t-Test: Two-Sample Assuming Equal Variances t-Test: Two-Sample Assuming Equal Variances
No significant difference No significant difference
Transport liquid flow rate 0.5 0.7 Air flow rate 10 16.7
Mean 87.4575 84.62916667 Mean 89.4525 82.63417
Variance 215.7611841 189.7431902 Variance 104.1036023 280.4061
Observations 12 12 Observations 12 12
Pooled Variance 202.7521871 Pooled Variance 192.2548598
Hypothesized Mean Difference 0 Hypothesized Mean Difference 0
Df 22 Df 22
t Stat 0.486545481 t Stat 1.20452326
P(T<=t) one-tail 0.31569614 P(T<=t) one-tail 0.120593141
t Critical one-tail 1.717144335 t Critical one-tail 1.717144335
P(T<=t) two-tail 0.631392279 P(T<=t) two-tail 0.241186281
t Critical two-tail 2.073873058 t Critical two-tail 2.073873058
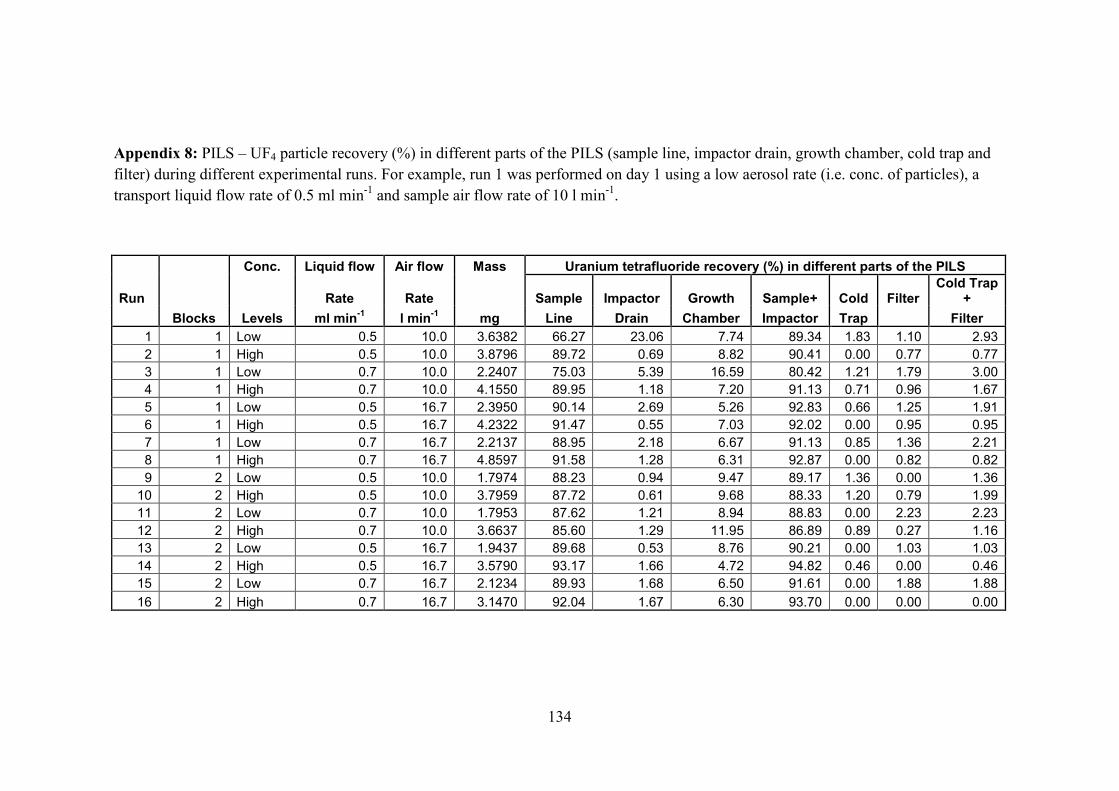
134
Appendix 8: PILS – UF4 particle recovery (%) in different parts of the PILS (sample line, impactor drain, growth chamber, cold trap and
filter) during different experimental runs. For example, run 1 was performed on day 1 using a low aerosol rate (i.e. conc. of particles), a
transport liquid flow rate of 0.5 ml min-1
and sample air flow rate of 10 l min-1
.
Conc. Liquid flow Air flow Mass Uranium tetrafluoride recovery (%) in different parts of the PILS
Run Rate Rate Sample Impactor Growth Sample+ Cold Filter Cold Trap
+
Blocks Levels ml min-1 l min
-1 mg Line Drain Chamber Impactor Trap Filter
1 1 Low 0.5 10.0 3.6382 66.27 23.06 7.74 89.34 1.83 1.10 2.93
2 1 High 0.5 10.0 3.8796 89.72 0.69 8.82 90.41 0.00 0.77 0.77
3 1 Low 0.7 10.0 2.2407 75.03 5.39 16.59 80.42 1.21 1.79 3.00
4 1 High 0.7 10.0 4.1550 89.95 1.18 7.20 91.13 0.71 0.96 1.67
5 1 Low 0.5 16.7 2.3950 90.14 2.69 5.26 92.83 0.66 1.25 1.91
6 1 High 0.5 16.7 4.2322 91.47 0.55 7.03 92.02 0.00 0.95 0.95
7 1 Low 0.7 16.7 2.2137 88.95 2.18 6.67 91.13 0.85 1.36 2.21
8 1 High 0.7 16.7 4.8597 91.58 1.28 6.31 92.87 0.00 0.82 0.82
9 2 Low 0.5 10.0 1.7974 88.23 0.94 9.47 89.17 1.36 0.00 1.36
10 2 High 0.5 10.0 3.7959 87.72 0.61 9.68 88.33 1.20 0.79 1.99
11 2 Low 0.7 10.0 1.7953 87.62 1.21 8.94 88.83 0.00 2.23 2.23
12 2 High 0.7 10.0 3.6637 85.60 1.29 11.95 86.89 0.89 0.27 1.16
13 2 Low 0.5 16.7 1.9437 89.68 0.53 8.76 90.21 0.00 1.03 1.03
14 2 High 0.5 16.7 3.5790 93.17 1.66 4.72 94.82 0.46 0.00 0.46
15 2 Low 0.7 16.7 2.1234 89.93 1.68 6.50 91.61 0.00 1.88 1.88
16 2 High 0.7 16.7 3.1470 92.04 1.67 6.30 93.70 0.00 0.00 0.00
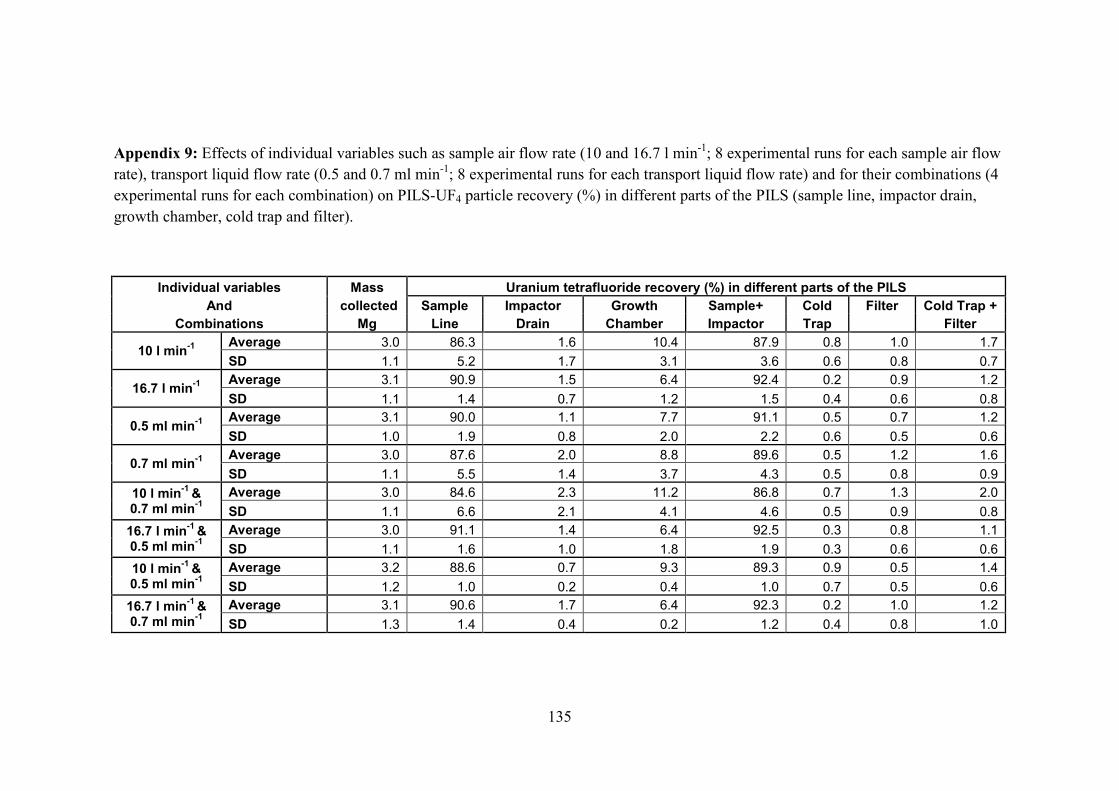
135
Appendix 9: Effects of individual variables such as sample air flow rate (10 and 16.7 l min-1
; 8 experimental runs for each sample air flow
rate), transport liquid flow rate (0.5 and 0.7 ml min-1
; 8 experimental runs for each transport liquid flow rate) and for their combinations (4
experimental runs for each combination) on PILS-UF4 particle recovery (%) in different parts of the PILS (sample line, impactor drain,
growth chamber, cold trap and filter).
Individual variables Mass Uranium tetrafluoride recovery (%) in different parts of the PILS
And collected Sample Impactor Growth Sample+ Cold Filter Cold Trap +
Combinations Mg Line Drain Chamber Impactor Trap Filter
10 l min-1
Average 3.0 86.3 1.6 10.4 87.9 0.8 1.0 1.7
SD 1.1 5.2 1.7 3.1 3.6 0.6 0.8 0.7
16.7 l min-1
Average 3.1 90.9 1.5 6.4 92.4 0.2 0.9 1.2
SD 1.1 1.4 0.7 1.2 1.5 0.4 0.6 0.8
0.5 ml min-1
Average 3.1 90.0 1.1 7.7 91.1 0.5 0.7 1.2
SD 1.0 1.9 0.8 2.0 2.2 0.6 0.5 0.6
0.7 ml min-1
Average 3.0 87.6 2.0 8.8 89.6 0.5 1.2 1.6
SD 1.1 5.5 1.4 3.7 4.3 0.5 0.8 0.9
10 l min-1 &
0.7 ml min-1
Average 3.0 84.6 2.3 11.2 86.8 0.7 1.3 2.0
SD 1.1 6.6 2.1 4.1 4.6 0.5 0.9 0.8
16.7 l min-1 &
0.5 ml min-1
Average 3.0 91.1 1.4 6.4 92.5 0.3 0.8 1.1
SD 1.1 1.6 1.0 1.8 1.9 0.3 0.6 0.6
10 l min-1 &
0.5 ml min-1
Average 3.2 88.6 0.7 9.3 89.3 0.9 0.5 1.4
SD 1.2 1.0 0.2 0.4 1.0 0.7 0.5 0.6
16.7 l min-1 &
0.7 ml min-1
Average 3.1 90.6 1.7 6.4 92.3 0.2 1.0 1.2
SD 1.3 1.4 0.4 0.2 1.2 0.4 0.8 1.0
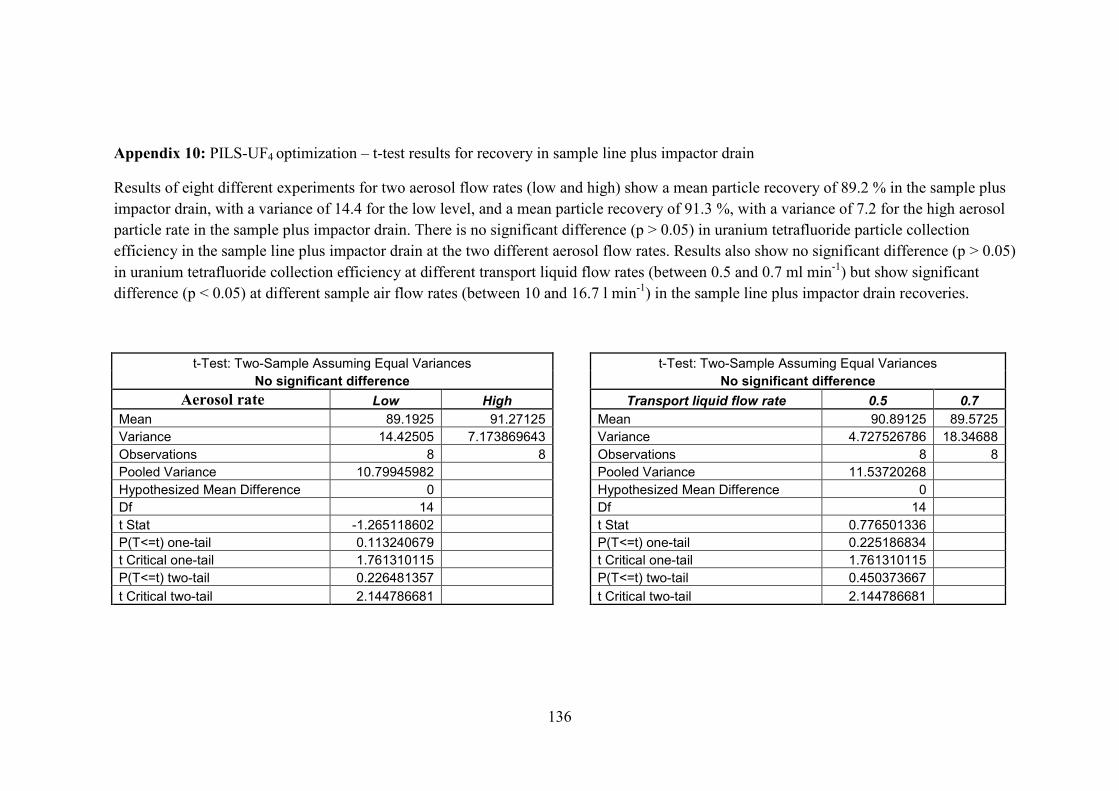
136
Appendix 10: PILS-UF4 optimization – t-test results for recovery in sample line plus impactor drain
Results of eight different experiments for two aerosol flow rates (low and high) show a mean particle recovery of 89.2 % in the sample plus
impactor drain, with a variance of 14.4 for the low level, and a mean particle recovery of 91.3 %, with a variance of 7.2 for the high aerosol
particle rate in the sample plus impactor drain. There is no significant difference (p > 0.05) in uranium tetrafluoride particle collection
efficiency in the sample line plus impactor drain at the two different aerosol flow rates. Results also show no significant difference (p > 0.05)
in uranium tetrafluoride collection efficiency at different transport liquid flow rates (between 0.5 and 0.7 ml min-1
) but show significant
difference (p < 0.05) at different sample air flow rates (between 10 and 16.7 l min-1
) in the sample line plus impactor drain recoveries.
t-Test: Two-Sample Assuming Equal Variances t-Test: Two-Sample Assuming Equal Variances
No significant difference No significant difference
Aerosol rate Low High Transport liquid flow rate 0.5 0.7
Mean 89.1925 91.27125 Mean 90.89125 89.5725
Variance 14.42505 7.173869643 Variance 4.727526786 18.34688
Observations 8 8 Observations 8 8
Pooled Variance 10.79945982 Pooled Variance 11.53720268
Hypothesized Mean Difference 0 Hypothesized Mean Difference 0
Df 14 Df 14
t Stat -1.265118602 t Stat 0.776501336
P(T<=t) one-tail 0.113240679 P(T<=t) one-tail 0.225186834
t Critical one-tail 1.761310115 t Critical one-tail 1.761310115
P(T<=t) two-tail 0.226481357 P(T<=t) two-tail 0.450373667
t Critical two-tail 2.144786681 t Critical two-tail 2.144786681

137
t-Test: Two-Sample Assuming Equal Variances
Significant difference
Air flow rate 10 16.7
Mean 88.065 92.39875
Variance 11.17457143 2.161383929
Observations 8 8
Pooled Variance 6.667977679
Hypothesized Mean Difference 0
Df 14
t Stat -3.356578293
P(T<=t) one-tail 0.00235101
t Critical one-tail 1.761310115
P(T<=t) two-tail 0.00470202
t Critical two-tail 2.144786681

138
Appendix 11: Uranium concentrations in atmospheric aerosols using the PILS and a filter system.
Filter PILS Uranium
Date Digested Without Digestion Digested samples Digested Non-digested
Mean SD Mean SD
pg m-3
pg m-3
pg m-3
pg m-3
pg m-3
% %
22-Jul-10 9.88 8.14 2.40 6.74 1.05 68.21 82.38
26-Jul-10 10.66 8.47 1.87 8.84 1.09 82.90 79.43
27-Jul-10 19.69 12.68 2.66 16.18 1.24 82.17 64.40
29-Jul-10 36.69 6.89 3.35 29.95 5.30 81.64 18.78
30-Jul-10 20.32 3.11 0.90 15.78 7.34 77.67 15.31
3-Aug-10 26.04 6.77 1.82 21.70 2.40 83.33 26.00
5-Aug-10 32.26 8.17 3.02 24.17 7.60 74.92 25.32
6-Aug-10 14.96 2.62 0.80 11.09 3.54 74.13 17.51
17-Aug-10 15.89 1.19 0.28 7.34 0.96 46.19 7.49
mesh(76um)