A Nine Year Study of File System and Storage Benchmarking 5 · · 2012-09-075 A Nine Year Study...
56
5 A Nine Year Study of File System and Storage Benchmarking AVISHAY TRAEGER and EREZ ZADOK Stony Brook University and NIKOLAI JOUKOV and CHARLES P. WRIGHT IBM T. J. Watson Research Center Benchmarking is critical when evaluating performance, but is especially difficult for file and stor- age systems. Complex interactions between I/O devices, caches, kernel daemons, and other OS components result in behavior that is rather difficult to analyze. Moreover, systems have differ- ent features and optimizations, so no single benchmark is always suitable. The large variety of workloads that these systems experience in the real world also adds to this difficulty. In this article we survey 415 file system and storage benchmarks from 106 recent papers. We found that most popular benchmarks are flawed and many research papers do not provide a clear indication of true performance. We provide guidelines that we hope will improve future performance evaluations. To show how some widely used benchmarks can conceal or overemphasize overheads, we conducted a set of experiments. As a specific example, slowing down read operations on ext2 by a factor of 32 resulted in only a 2–5% wall-clock slowdown in a popular compile benchmark. Finally, we discuss future work to improve file system and storage benchmarking. Categories and Subject Descriptors: D.4.8 [Operating Systems]: Performance—Measurements; C.4 [Computer Systems Organization]: Performance of Systems—Measurement techniques; per- formance attributes General Terms: Design, Experimentation, Measurement, Performance Additional Key Words and Phrases: Benchmarks, file systems, storage systems ACM Reference Format: Traeger, A., Zadok, E., Joukov, N., and Wright, C. P. 2008. A nine year study of file system and storage benchmarking. ACM Trans. Storage 4, 2, Article 5 (May 2008), 56 pages. DOI = 10.1145/ 1367829.1367831 http://doi.acm.org/ 10.1145/1367829.1367831 This work was made possible partially thanks to NSF awards CNS-0133589 (CAREER), CCR- 0310493 (CyberTrust), CNS-0614784 (CSR), and CCF-0621463 (HECURA), and well as two HP/Intel gifts numbers 87128 and 88415.1. Authors’ addresses: A. Traeger (corresponding author), E. Zadok, Computer Science Department, Stony Brook University, Stony Brook, NY 11794; email: [email protected]; N. Joukov, C. P. Wright, IBM TJ Watson Research Center, PO Box 704, Yorktown Heights, NY 10598. Permission to make digital or hard copies of part or all of this work for personal or classroom use is granted without fee provided that copies are not made or distributed for profit or direct commercial advantage and that copies show this notice on the first page or initial screen of a display along with the full citation. Copyrights for components of this work owned by others than ACM must be honored. Abstracting with credit is permitted. To copy otherwise, to republish, to post on servers, to redistribute to lists, or to use any component of this work in other works requires prior specific permission and/or a fee. Permissions may be requested from Publications Dept., ACM, Inc., 2 Penn Plaza, Suite 701, New York, NY 10121-0701 USA, fax +1 (212) 869-0481, or [email protected]. C 2008 ACM 1550-4859/2008/05-ART5 $5.00 DOI = 10.1145/1367829.1367831 http://doi.acm.org/ 10.1145/1367829.1367831 ACM Transactions on Storage, Vol. 4, No. 2, Article 5, Publication date: May 2008.
Transcript of A Nine Year Study of File System and Storage Benchmarking 5 · · 2012-09-075 A Nine Year Study...

5
A Nine Year Study of File Systemand Storage Benchmarking
AVISHAY TRAEGER and EREZ ZADOK
Stony Brook University
and
NIKOLAI JOUKOV and CHARLES P. WRIGHT
IBM T. J. Watson Research Center
Benchmarking is critical when evaluating performance, but is especially difficult for file and stor-age systems. Complex interactions between I/O devices, caches, kernel daemons, and other OScomponents result in behavior that is rather difficult to analyze. Moreover, systems have differ-ent features and optimizations, so no single benchmark is always suitable. The large variety ofworkloads that these systems experience in the real world also adds to this difficulty.
In this article we survey 415 file system and storage benchmarks from 106 recent papers. Wefound that most popular benchmarks are flawed and many research papers do not provide a clearindication of true performance. We provide guidelines that we hope will improve future performanceevaluations. To show how some widely used benchmarks can conceal or overemphasize overheads,we conducted a set of experiments. As a specific example, slowing down read operations on ext2 bya factor of 32 resulted in only a 2–5% wall-clock slowdown in a popular compile benchmark. Finally,we discuss future work to improve file system and storage benchmarking.
Categories and Subject Descriptors: D.4.8 [Operating Systems]: Performance—Measurements;C.4 [Computer Systems Organization]: Performance of Systems—Measurement techniques; per-
formance attributes
General Terms: Design, Experimentation, Measurement, Performance
Additional Key Words and Phrases: Benchmarks, file systems, storage systems
ACM Reference Format:
Traeger, A., Zadok, E., Joukov, N., and Wright, C. P. 2008. A nine year study of file system andstorage benchmarking. ACM Trans. Storage 4, 2, Article 5 (May 2008), 56 pages. DOI = 10.1145/1367829.1367831 http://doi.acm.org/ 10.1145/1367829.1367831
This work was made possible partially thanks to NSF awards CNS-0133589 (CAREER), CCR-0310493 (CyberTrust), CNS-0614784 (CSR), and CCF-0621463 (HECURA), and well as twoHP/Intel gifts numbers 87128 and 88415.1.Authors’ addresses: A. Traeger (corresponding author), E. Zadok, Computer Science Department,Stony Brook University, Stony Brook, NY 11794; email: [email protected]; N. Joukov, C. P.Wright, IBM TJ Watson Research Center, PO Box 704, Yorktown Heights, NY 10598.Permission to make digital or hard copies of part or all of this work for personal or classroom use isgranted without fee provided that copies are not made or distributed for profit or direct commercialadvantage and that copies show this notice on the first page or initial screen of a display alongwith the full citation. Copyrights for components of this work owned by others than ACM must behonored. Abstracting with credit is permitted. To copy otherwise, to republish, to post on servers,to redistribute to lists, or to use any component of this work in other works requires prior specificpermission and/or a fee. Permissions may be requested from Publications Dept., ACM, Inc., 2 PennPlaza, Suite 701, New York, NY 10121-0701 USA, fax +1 (212) 869-0481, or [email protected]© 2008 ACM 1550-4859/2008/05-ART5 $5.00 DOI = 10.1145/1367829.1367831 http://doi.acm.org/10.1145/1367829.1367831
ACM Transactions on Storage, Vol. 4, No. 2, Article 5, Publication date: May 2008.

5:2 • A. Traeger et al.
1. INTRODUCTION
Benchmarks are most often used to provide an idea of how fast some piece ofsoftware or hardware runs. The results can significantly add to, or detract from,the value of a product (be it monetary or otherwise). For example, they may beused by potential consumers in purchasing decisions, or by researchers to helpdetermine a system’s worth.
When a performance evaluation of a system is presented, the results andimplications must be clear to the reader. This includes accurate depictions ofbehavior under realistic workloads and in worst-case scenarios, as well as ex-plaining the reasoning behind benchmarking methodologies. In addition, thereader should be able to verify the benchmark results, and compare the per-formance of one system with that of another. To accomplish these goals, muchthought must go into choosing suitable benchmarks and configurations, andaccurate results must be conveyed.
Ideally, users could test performance in their own settings using real work-loads. This transfers the responsibility of benchmarking from author to user.However, this is usually impractical because testing multiple systems is timeconsuming, especially in that exposing the system to real workloads implieslearning how to configure the system properly, possibly migrating data andother settings to the new systems, as well as dealing with their respective bugs.In addition, many systems developed for research purposes are not released tothe public. Although rare, we have seen performance measured using actualworkloads when they are created for in-house use [Ghemawat et al. 2003] orare made by a company to be deployed [Schmuck and Haskin 2002; Eisler et al.2007]. Hence, the next best alternative is for some party (usually the authors)to run workloads that are representative of real-world use on commodity hard-ware. These workloads come in the form of synthetic benchmarks, executingreal programs, or using traces of some activity. Simulating workloads raisesconcerns about how accurately these benchmarks portray the end-user’s work-load. Thus, benchmarks must be well understood so as to not have unknownside-effects, and should provide a good approximation of how the program wouldperform under different loads.
Benchmarking file and storage systems requires extra care, which exacer-bates the situation. Even though these systems share the goal of providingaccess to data via a uniform API, they differ in many ways, such as type of un-derlying media (e.g., magnetic disk, network storage, CD-ROM, volatile RAM,flash RAM, etc.), storage environment (e.g., RAID, LVM, virtualization, etc.),the workloads for which the system is optimized, and in their features (e.g.,journals, encryption, etc.).
In addition, complex interactions exist between file systems, I/O devices, spe-cialized caches (e.g, buffer cache, disk cache), kernel daemons (e.g., kflushd),and other OS components. Some operations may be performed asynchronously,and this activity is not always captured in benchmark results. Because of thiscomplexity, many factors must be taken into account when performing bench-marks and analyzing the results.
In this article we concentrate on file and storage system benchmarks in theresearch community. Specifically, we comment on how to choose and create
ACM Transactions on Storage, Vol. 4, No. 2, Article 5, Publication date: May 2008.

A Nine Year Study of File System and Storage Benchmarking • 5:3
benchmarks, how to run them, and how to analyze and report the results. Wehave surveyed a selection of recent file and storage system papers and havefound several poor benchmarking practices, as well as some good ones. Weclassify the benchmarks into three categories and discuss them in turn. Thecategories are as follows.
—Macrobenchmarks. The performance is tested against a particular workloadthat is meant to represent some real-world workload.
—Trace Replays. A program replays operations which were recorded in a realscenario, with the hope that it is representative of real-world workloads.
—Microbenchmarks. A few (typically one or two) operations are tested to isolatetheir specific overheads within the system.
The rest of this article is organized as follows. In Section 2 we describe thecriteria for selecting publications for our survey and list the papers we ana-lyze. Section 3 provides suggested guidelines to use when benchmarking andSection 4 discusses how well the surveyed papers have followed those sugges-tions. In Section 5 we give an overview of related research. We describe thesystem configuration- and benchmarking procedures that were used in our ex-periments in Section 6.
Section 7 reviews the pros and cons of the macrobenchmarks used in thesurveyed papers; we also include a few other notable benchmarks for complete-ness. In Section 8 we examine how the papers that we surveyed used traces, andwe describe four main problems that arise when using traces for performanceanalysis. Section 9 describes the widely used microbenchmarks, and Section 10discusses some of the more popular workload generators.
Section 11 describes a suite of tools for benchmarking automation. Section 12shows the benchmarks that we performed. We conclude in Section 13, summa-rizing our suggestions for choosing the proper benchmark, and offering ourideas for the future of file and storage system benchmarking.
2. SURVEYED PAPERS
Research papers have used a variety of benchmarks to analyze the performanceof file and storage systems. This article surveys the benchmarks and bench-marking practices from a selection of the following recent conferences.
—the Symposium on Operating Systems Principles (SOSP 1999, 2001, 2003,and 2005);
—the Symposium on Operating Systems Design and Implementation (OSDI2000, 2002, 2004, and 2006);
—the USENIX Conference on File and Storage Technologies (FAST 2002, 2003,2004, 2005, and 2007); and
—the USENIX Annual Technical Conference (USENIX 1999, 2000, 2001, 2002,2003, 2004, 2005, and 2006).
Research papers relating to file systems and storage often appear in the pro-ceedings of these conferences, which are considered to be of high quality. Wedecided to consider only full-length papers from conferences that have run for
ACM Transactions on Storage, Vol. 4, No. 2, Article 5, Publication date: May 2008.

5:4 • A. Traeger et al.
at least five years. In addition, we consider only file systems and storage papersthat have evaluated their implementations (no simulations), and from those,only papers whose benchmarks are used to measure performance in terms oflatency or throughput. For example, precluded from our work are those paperswhose benchmarks were used to verify correctness or report on the amount ofdisk space used. Studies similar to ours have been performed in the past [Smallet al. 1997; Mogul 1999], and so we believe that this cross-section of conferencepapers is adequate to make some generalizations. We surveyed 106 papers intotal, 8 of which are our own. The surveyed papers are marked with asterisksin the References section.
3. RECOMMENDED BENCHMARKING GUIDELINES
We now present a list of guidelines to consider when evaluating the performanceof a file or storage system. A Web-version summary of this document can befound at www.fsl.cs.sunysb.edu/project-fsbench.html.
The two underlying themes of these guidelines are the following.
(1) Explain What Was Done in as Much Detail as Possible. For example, if onedecides to create one’s own benchmark, the paper should detail what wasdone. If replaying traces, one should describe where they came from, howthey were captured, and how they were replayed (what tool? what speed?).This can help others understand and validate the results.
(2) In Addition to Saying What Was Done, Say Why It Was Done That Way. Forexample, while it is important to note that one is using ext2 as a baselinefor the analysis, it is just as important (or perhaps even moreso) to discusswhy it is a fair comparison. Similarly, it is useful for readers to know whyone ran that random-read benchmark so that they know what conclusionsto draw from the results.
3.1 Choosing The Benchmark Configurations
The first step of evaluating a system is to pose questions that will reveal the per-formance characteristics of the system, such as “how does my system compareto current similar systems?”, “how does my system behave under its expectedworkload?”, and “what are the causes of my performance improvements or over-heads?” Once these questions are formulated, one must decide on what baselinesystems, system configurations, and benchmarks should be used to best answerthem. This will produce a set of 〈system, configuration, benchmark〉 tuples thatwill need to be run. It is desirable for the researcher to have a rough idea ofthe possible expected results for each configuration at this point; if the actualresults differ from these expectations, then the causes of the deviations shouldbe investigated.
Since a system’s performance is generally more meaningful when comparedto the performance of existing technology, one should find existing systemsthat provide fair and interesting comparisons. For example, for benchmarkingan encryption storage device, it would be useful to compare its performance to
ACM Transactions on Storage, Vol. 4, No. 2, Article 5, Publication date: May 2008.

A Nine Year Study of File System and Storage Benchmarking • 5:5
those of other encrypted storage devices, a traditional device, and perhaps somealternate implementations (user-space, file system, etc.).
The system under test may have several configurations that will need to beevaluated in turn. In addition, one may create artificial configurations where acomponent of the system is removed to determine its overhead. For example, inan encryption file or storage system, one can use a null cipher (copy data only),rather than encryption, to isolate the overhead of encryption. Determining thecause of overheads may also be done using profiling techniques. Showing thisincremental breakdown of performance numbers helps the reader to betterunderstand a system’s behavior.
There are three main types of benchmark that one can choose from: mac-robenchmarks, trace replaying, and microbenchmarks.
—Macrobenchmarks. These exercise multiple file system operations, and areusually good for an overall view of the system’s performance, though theworkload may not be realistic. These benchmarks are described further inSection 7.
—Trace-Based. Replaying traces can also provide an overall view of the sys-tem’s performance. Traces are usually meant to exercise the system witha representative real-world workload, which can help to better understandhow a system would behave under normal use. However, one should ensurethat the trace is in fact representative of that workload (e.g., the trace shouldcapture a large enough sample), and that the method used to replay the tracepreserves the characteristics of the workload. Section 8 provides more infor-mation about trace-based benchmarking.
—Microbenchmarks. These exercise few (usually one or two) operations. Theseare useful if one is measuring a very small change to better understandthe results of a macrobenchmark, to isolate the effects of specific parts ofthe system, or to show worst-case behavior. In general, these benchmarksare more meaningful when presented together with other benchmarks. SeeSection 9 for more information.
Useful file system benchmarks should highlight the high-level as well as low-level performance. Therefore, we recommend using at least one macrobench-mark or trace to show a high-level view of performance, along with several mi-crobenchmarks to highlight more focused views. In addition, there are severalworkload properties that might be considered. We describe here five which webelieve are important. First, benchmarks may be characterized by how CPU orI/O bound they are. File and storage system benchmarks should generally be I/Obound, but a CPU-bound benchmark may also be run for systems that exercisethe CPU. Second, if the benchmark records its own timings, it should use accu-rate measurements. Third, the benchmark should be scalable, meaning that itexercises each machine the same amount, independent of hardware or softwarespeed. Fourth, multithreaded workloads may provide more realistic scenarios,and may help to saturate the system with requests. Fifth, the workloads shouldbe well understood. Although the code of synthetic benchmarks can be read andtraces analyzed, it is more difficult to understand some application workloads.
ACM Transactions on Storage, Vol. 4, No. 2, Article 5, Publication date: May 2008.

5:6 • A. Traeger et al.
For example, compile benchmarks can behave rather differently depending onthe testbed’s architecture, installed software, and the version of software beingcompiled. The source-code for ad hoc benchmarks should be publicly released,as it is the only truly complete description of the benchmark that would allowothers to reproduce it (including any bugs or unexpected behavior).
3.2 Choosing The Benchmarking Environment
The state of the system during the benchmark’s runs can have a significanteffect on results. After determining an appropriate state, it should be createdaccurately and reported along with the results. Some major factors that canaffect results are cache state, ZCAV effects, file system aging, and nonessentialprocesses running during the benchmark.
The state of the system’s caches can affect the code paths that are testedand thus affect benchmark results. It is not always clear whether benchmarksshould be run with “warm” or “cold” caches. On one hand, real systems do notgenerally run with completely cold caches. On the other hand, a benchmarkthat accesses too much cached data may be unrealistic as well. Because re-quests are mainly serviced from memory, the file or storage system will notbe adequately exercised. Further, not bringing the cache back to a consistentstate between runs can cause timing inconsistencies. If cold-cache results aredesired, caches should be cleared before each run. This can be done by allocat-ing and freeing large amounts of memory, remounting the file system, reloadingthe storage driver, or rebooting. We have found that rebooting is more effectivethan the other methods [Wright et al. 2005]. When working in an environmentwith multiple machines, the caches on all necessary machines must be cleared.This helps create identical runs, thus ensuring more stable results. If, however,warm-cache results are desired, this can be achieved by running the experimentN+1 times, and discarding the first run’s result.
Most modern disks use zoned constant angular velocity (ZCAV) to store data.In this design, the cylinders are divided into zones where the number of sectorsin a cylinder increases with the distance from the center of the disk. There-fore the transfer rate varies from zone to zone [Van Meter 1997]. It has beenrecommended to minimize ZCAV effects by creating a partition of the smallestpossible size on the outside of the disk [Ellard and Seltzer 2003b]. However, thismakes the results less realistic and may not be appropriate for all benchmarks(e.g., long seeks may be necessary to show the effectiveness of the system). Werecommend simply specifying the location of the test partition in the paper, soas to help reproducibility.
Most file system and storage benchmarks are run on an empty system, whichcould make the results different than in a real-world setting. A system maybe aged by running a workload based on system snapshots [Smith and Seltzer1997]. However, aging a 1GB file system by seven months using this method re-quired writing 87.3GB of data. The amount of time required to age a file systemwould make this impractical for larger systems. TBBT has a faster, configurableaging technique but is somewhat less realistic, as it is purely synthetic [Zhuet al. 2005a]. Other methods to age a system before running a benchmark are
ACM Transactions on Storage, Vol. 4, No. 2, Article 5, Publication date: May 2008.

A Nine Year Study of File System and Storage Benchmarking • 5:7
to run a long-term workload, copy an existing raw image, or to replay a tracebefore running the benchmark. It should be noted that for some systems andbenchmarks, aging is not a concern. For example, aging will not have any effectwhen replaying a block-level trace on a traditional storage device, since thebenchmark will behave identically regardless of the disk’s contents.
To ensure reproducibility of the results, all nonessential services and pro-cesses should be stopped before running the benchmark. These processes cancause anomalous results (outliers) or higher-than-normal standard deviationsfor a set of runs. However, processes such as cron will coexist with the systemwhen used in the real world, and so it must be understood that these results aremeasured in a sterile environment. Ideally, we would be able to demonstrateperformance with the interactions of other processes present; however, this isdifficult because the set of processes is specific to a machine’s configuration.Instead, we recommend using multithreaded workloads because they more ac-curately depict a real system, which normally has several active processes. Inaddition, we recommend to ensure that no users log into the test machinesduring a benchmark run, and to also ensure that no other traffic is consumingone’s network bandwidth while running benchmarks that involve the network.
3.3 Running The Benchmarks
We recommend four important guidelines to running benchmarks properly.First, one should ensure that every benchmark run is identical. Second, eachtest should be run several times to ensure accuracy, and standard deviationsor confidence levels should be computed to determine the appropriate numberof runs. Third, tests should be run for a period of time sufficient for the systemto reach steady state for the majority of the run. Fourth, the benchmarkingprocess should preferably be automated using scripts or available tools suchas Auto-pilot [Wright et al. 2005] to minimize the mistakes associated withmanual repetitive tasks. This is discussed further in Section 11.
3.4 Presenting The Results
Once results are obtained, they should be presented appropriately so that accu-rate conclusions may be derived. Aside from the presented data, the benchmarkthe configurations and environment should be accurately described. Propergraphs should be displayed, with error bars, where applicable.
We recommend using confidence intervals rather than standard deviation topresent results. The standard deviation is a measure of the amount of variationbetween runs. The half-width of the confidence interval describes how far thetrue value may be from the captured mean with a given degree of confidence(e.g., 95%). This provides a better sense of the true mean. In addition, as morebenchmark runs are performed, the standard deviation may not decrease, butthe width of confidence intervals generally will.
For experiments with fewer than 30 runs, one should be careful not to usethe normal distribution for calculating confidence intervals. This is becausethe central-limit theorem no longer holds with a small sample size. Instead,one should use the student’s t-distribution. This distribution may also be used
ACM Transactions on Storage, Vol. 4, No. 2, Article 5, Publication date: May 2008.

5:8 • A. Traeger et al.
for experiments with at least 30 runs, since in this case it is similar to thenormal distribution.
Large confidence-interval widths or nonnormal distributions may indicate asoftware bug or benchmarking error. For example, the half-widths of confidenceintervals are recommended to be less than 5% of the mean. If the results arenot stable, then either there is a bug in the code or the instability should beexplained. Anomalous results (e.g., outliers) should never be discarded. If theyare due to programming or benchmarking errors, the problem should be fixedand the benchmarks rerun to gather new and more stable results.
3.5 Validating Results
Other researchers may wish to benchmark one’s software for two main reasons:(1) to reproduce or confirm the results, or (2) to compare their system to one’sown.
First, it is considered good scientific practice to provide enough informationfor others to validate the results. This includes detailed hardware and softwarespecifications about the testbeds. Although it is usually not practical to includesuch large amounts of information in a conference paper, these details can bepublished in an online appendix. Although it can be difficult for a researcherto accurately validate another’s results without the exact testbed, it is stillpossible to see whether the results generally correlate.
Second, there may be a case where a researcher creates a system with similarproperties to one’s own (e.g., they are both encryption file systems), and it wouldbe logical for the researcher to compare the two systems. However, if one’s ownpaper showed an X% overhead over ext2 and the new file system has a Y%overhead over ext2 no claim can be made about which of the two file systemsis better because the benchmarking environment is different. The researchershould benchmark both research file systems using a setup as similar as pos-sible to that of the original benchmark. This way, both file systems are testedunder the same conditions. Moreover, since they are running the benchmark inthe same way as one’s own paper did, no claim can be made that they chose aspecific case in which their file system might perform better.
To help solve these two issues, enough information should be made availableabout one’s testbed (both hardware and any relevant software) so that an out-side researcher can validate the results. If possible, one’s software should bemade available to other researchers so that they can compare their system toone’s own. Releasing the source is preferred, but a binary release can also behelpful if there are legal issues preventing the release of source-code. Membersof the SOSP 2007 program committee attempted to improve this situation byasking authors in the submission form if they will make the source-code andraw data for their system and experiments available so that others can repro-duce the results more easily. If enough authors agree to this sharing and otherconferences follow suit, it may in the future become easier to compare similarsystems and reproduce results. Similarly, any benchmarks written and tracescollected should be made available to others.
ACM Transactions on Storage, Vol. 4, No. 2, Article 5, Publication date: May 2008.

A Nine Year Study of File System and Storage Benchmarking • 5:9
Fig. 1. (a) Cumulative distribution function (CDF) for the number of runs performed in the sur-veyed benchmarks; (b) CDF of the same data categorized by conference. A value of –1 was used forbenchmarks where the number of runs was not specified.
4. COMPLIANCE WITH THE GUIDELINES
We now examine how well the surveyed papers followed the benchmarkingpractices that were discussed in Section 3. We cannot expect past papers tocomply with guidelines that had not yet been published. However, before settingnew guidelines for the future, it is important to see how far we are from them atthe present. We also feel that a certain degree of scientific rigor in benchmarkingshould be a goal in one’s research, even with no guidelines present.
Number of runs. Running benchmarks multiple times is important for en-suring accuracy and presenting the range of possible results. Reporting thenumber of runs allows the reader to determine the benchmarking rigor. Wenow examine the number of runs performed in each surveyed experiment. Toensure accuracy, we did not include experiments where one operation was exe-cuted many times and the per-operation latency was reported, because it wasnot clear whether to count the number of runs as the number of times theoperation was executed, or as the number of times the entire benchmark wasrun. Figure 1 shows the results from the 388 benchmarks that were counted.We found that two papers [Wang et al. 2002; Wright et al. 2003b] ran theirbenchmarks more than once (since they included error bars or confidence in-tervals), but did not specify the number of runs. These are shown as two runs.The figure shows that the number of runs was not specified for the majorityof benchmarks. Assuming that papers not specifying the number of runs rantheir experiments once, we can break down the data by conference, as shownin Table I.
The per-conference values are presented for informational value and we feelthey may of interest to the reader. However, we caution the reader againstdrawing conclusions based on these statistics, as benchmarking rigor alonedoes not determine the quality of a conference, and the number of runs alonedoes not determine benchmarking rigor.
Statistical dispersion. After performing a certain number of runs, it is im-portant to inform the reader about the statistical dispersion of the results.
ACM Transactions on Storage, Vol. 4, No. 2, Article 5, Publication date: May 2008.

5:10 • A. Traeger et al.
Table I. Percentage of Papers that Discussed StandardDeviations or Confidence Intervals (classified by conference)
FAST OSDI SOSP USENIX
Number of papers 12 21 51 23Standard deviations 8.3% 28.6% 27.5% 69.6%Confidence intervals 16.7% 19.1% 7.8% 8.7%Total 25.0% 47.6% 35.3% 78.3%
Conference Mean Standard Deviation Median
SOSP 2.1 2.4 1
FAST 3.6 3.6 1
OSDI 3.8 4.3 2
USENIX 4.7 6.2 3
34.6% of the surveyed papers included at least a general discussion of standarddeviation, and 11.2% included confidence intervals. The percentage of papersdiscussing either of these aspects varied between 35.7% and 83.3% per year,but there was no upward or downward trend over time. Interestingly, we didnotice significant differences between conferences, shown in Table I, but wedo not suggest that this is indicative of the overall quality of any particularconference. In addition to informing the reader about the overall deviations orintervals for the paper, it is important to show statistical dispersion for eachresult. This can be done with error bars in graphs, by augmenting tables, orby mentioning it in the text. From all of the surveyed benchmarks, only 21.5%included this information.
Benchmark runtimes. To achieve stable results, benchmarks must run fora long enough time to reach steady state and exercise the system. This is espe-cially important as benchmarks must scale with increasingly faster hardware.We looked at the runtimes of the 198 experiments that specified the elapsedtime of the benchmark. Most benchmarks that reported only per-operation la-tency or throughput did not specify their runtime. For each experiment, wetook the longest elapsed time of all configurations, and rounded them up to thenearest minute. For benchmarks with multiple phases, times were added tocreate a total time. The results are summarized in Figure 2. We can see in thefigure that 28.6% of benchmarks ran for less than one min., 58.3% ran for lessthan five, and 70.9% ran for less than ten.
Number of benchmarks. The number of benchmarks used for performanceevaluations in each paper is shown in Figure 3. We can see that 37.7% of thepapers used only one or two benchmarks, which in most cases is not sufficientfor a reader to fully understand the performance of a system.
System descriptions. To gain some idea of the testbed specifications pub-lished in the surveyed papers, we now present the number of parameters thatwere listed. It must be noted that not all parameters are equally important,and that some parameters are actually a subset of others. For example, a disk’sspeed is counted as one parameter, but a disk’s model number is counted asone parameter as well, even though the disk’s speed and several other disk
ACM Transactions on Storage, Vol. 4, No. 2, Article 5, Publication date: May 2008.

A Nine Year Study of File System and Storage Benchmarking • 5:11
Fig. 2. CDF of the number of benchmarks run in the surveyed papers with a given elapsed time.Note the log scale on the x-axis.
Fig. 3. CDF of the number of benchmarks run in the surveyed papers.
parameters can be found from the model specifications. Since it is not clearhow to weigh each parameter, we will instead caution that these results shouldbe used only as rough estimates. An average of 7.3 system parameters werereported per paper, with a standard deviation of 3.3. The median was 7. Whilethis is not a small number, it is not sufficient for reproducing results. In addi-tion, only 35.9% of the papers specified the cache state during the benchmarkruns. We specify the testbed used in this article in Section 6, which we believeshould be sufficient to reproduce our results.
5. RELATED WORK
A similar survey was conducted in 1997, covering more general systems pa-pers [Small et al. 1997]. The survey included ten conference proceedings from
ACM Transactions on Storage, Vol. 4, No. 2, Article 5, Publication date: May 2008.

5:12 • A. Traeger et al.
the early to mid ‘90’s. The main goals of that survey were to determine howreproducible and comparable the benchmarks were, as well as to discuss statis-tical rigor. We do not discuss statistical rigor in more detail in this article, sincethere is a good discussion presented there. The aforementioned paper wenton to advise on how to build good benchmarks and report them with properstatistical rigor. Some results from its survey are that over 90% of file systembenchmarks run were ad hoc, and two-thirds of the experiments presented asingle number as a result, without any statistical information.
In 1999, Mogul presented a similar survey of general OS research papers andcommented on the lack of standardization of benchmarks and metrics [Mogul1999]. He conducted a small survey of two conference proceedings and came tothe conclusion that the operating system community is in need of good stan-dardized benchmarks. Of the eight file system papers he surveyed, no two usedthe same benchmark to analyze performance.
Chen and Patterson concentrated on developing an I/O benchmark that canshed light on the causes for the results, that scales well, has results that arecomparable across machines, is general enough that it can be used by a widerange of applications, and is tightly specified so that everyone follows the samerules [Chen and Patterson 1993]. This benchmark does not perform metadataoperations, and is designed to benchmark drivers and I/O devices. The authorsgo on to discuss how they made a self-scaling benchmark with five parameters:data size, average size of an I/O request, fraction of read operations (the fractionof write operations is 1 minus this value), fraction of sequential accesses (thefraction of random accesses is 1 minus this value), and the number of processesissuing I/O requests. Their benchmark keeps four of these parameters constantwhile varying the fifth, producing five graphs. Because self-scaling will producedifferent workloads on different machines, the paper discusses how to predictperformance so that results can be compared, and shows reasonable ability toperform the predictions.
A paper by Tang and Seltzer from the same research group, entitled “Lies,Damned Lies, and File System Benchmarks” [Tang and Seltzer 1994], was onesource for some of our observations about the Andrew (Section 7.3), LADDIS(Section 7.5), and Bonnie (Section 9.1) benchmarks, as well as serving as aninspiration for this larger study.
Tang later expanded on the ideas of that paper, and introduced a benchmarkcalled dtangbm [Tang 1995]. This benchmark consists of a suite of microbench-marks called fsbench and a workload characterizer. Fsbench has the four phasesnext described.
(1) It measures disk performance so that it can be known whether improve-ments are due to the disk or the file system.
(2) It estimates the size of the buffer cache, attribute cache, and name transla-tion cache. This information is used by the next two phases to ensure properbenchmark scaling.
(3) It runs the microbenchmarks, whose results are reported. The benchmarktakes various measurements within each microbenchmark, providing muchinformation about the file system’s behavior. The reported metric is in
ACM Transactions on Storage, Vol. 4, No. 2, Article 5, Publication date: May 2008.

A Nine Year Study of File System and Storage Benchmarking • 5:13
KB/sec. The first two microbenchmarks in this phase test block allocationto a single file for sequential- and random-access patterns. The third mi-crobenchmark tests how blocks are allocated to files that are in the samedirectory. The fourth microbenchmark measures the performance of com-mon metadata operations (create, delete, mkdir, rmdir, and stat).
(4) It performs several tests to help file system designers to pinpoint perfor-mance problems. It isolates latencies for attribute (inode) creation, directorycreation, attribute accesses, and name lookups by timing different metadataoperations and performing some calculations on the results. It also uses avariety of read patterns to find cases where read-ahead harms performance.Finally, it tests how well the file system handles concurrent requests.
The second component of dtangbm, namely the workload characterizer, takesa trace as input and prints statistics about the operation mix, sequential versusrandom accesses, and the average number of open files. This information couldtheoretically be used in conjunction with the output from fsbench to estimatethe file system’s performance for any workload, although the authors of dtangbmwere not able to accurately do so in that work.
Another paper from Seltzer’s group [Seltzer et al. 1999] suggests that notonly are the currently used benchmarks poor, but the types of benchmarks rundo not provide much useful information. The current metrics do not provide aclear answer as to which system would perform better for a given workload.The common and simple workloads are not adequate, and so they discuss threeapproaches to application-specific benchmarking. In the first, system propertiesare represented in one vector and the workload properties are placed in another.Combining the two vectors can produce a relevant performance metric. Thesecond approach involves using traces to develop profiles that can stochasticallygenerate similar loads. The third uses a combination of both methods.
According to Ruwart, not only are the current benchmarks ill suited for test-ing today’s systems, they will fare even worse in the future because of thesystems’ growing complexities (e.g., clustered, distributed, and shared file sys-tems) [Ruwart 2001]. He discusses an approach to measuring file system perfor-mance in a large-scale, clustered supercomputer environment, while describingwhy current techniques are insufficient.
Finally, Ellard and Seltzer describe some problems they experienced whilebenchmarking a change to an NFS server [Ellard and Seltzer 2003b]. First, theydescribe ZCAV effects, which were previously documented only in papers thatdiscuss file system layouts [Van Meter 1997] (not in performance evaluations).Since the inner tracks on a disk have fewer sectors than the outer tracks, theamount of data read in a single revolution can vary greatly. Most papers do notdeal with this property. Aside from ZCAV effects, they also describe other factorsthat can affect performance, such as SCSI command queuing, disk schedulingalgorithms, and differences between transport protocols (i.e., TCP and UDP).
6. BENCHMARKING METHODOLOGY
In this section, we present the testbed and benchmarking procedures that weused for conducting the experiments considered throughout the remainder of
ACM Transactions on Storage, Vol. 4, No. 2, Article 5, Publication date: May 2008.
5:14 • A. Traeger et al.
this article. Next, we describe the hardware and software configuration of thetest machine as well as our benchmarking procedure.
System configuration. We conducted all our experiments on a machine witha 1.7 GHz Pentium 4 CPU, 8KB of L1 cache, and 256KB of L2 cache. The moth-erboard was an Intel Desktop Board D850GB with a 400 MHz system bus. Themachine contained 1GB of PC800 RAM. The system disk was a 7200 RPM WDCaviar (WD200BB) with 20GB capacity. The benchmark disk was a MaxtorAtlas (Maxtor-8C018J0) 15,000 RPM, 18.4GB, Ultra320 SCSI disk. The SCSIcontroller was an Adaptec AIC-7892A U160.
The operating system was Fedora Core 6, with patches as of March 07, 2007.The system was running a vanilla 2.6.20 kernel and the file system was ext2 un-less otherwise specified. Some relevant program versions, obtained by passingthe --version flag on the command line, along with the Fedora Core pack-age and version are GCC 4.1.1 (gcc.i386 4.1.1-51.fc6), GNU ld 2.17.50.0.6-2.fc6(binutils 2.17.50.0.6-2.fc6), GNU autoconf 2.59 (autoconf.noarch 2.59-12), GNUautomake 1.9.6 (automake.noarch 1.9.6-2.1), GNU make 3.81 (make 1:3.81-1.1),and GNU tar 1.15.1 (tar 2:1.15.1-24.fc6).
The kernel configuration file and full package listing are available atwww.fsl.cs.sunysb.edu/project-fsbench.html.
Benchmarking procedure. We used the Autopilot v.2.0 [Wright et al. 2005]benchmarking suite to automate the benchmarking procedure. We configuredAuto-pilot to run all tests at least ten times, and compute 95% confidence inter-vals for the mean elapsed, system, and user times using the student-t distribu-tion. In each case, the half-width of the interval was less than 5% of the mean.We report the mean of each set of runs. In addition, we define “wait time” to bethe time that the process was not using the CPU (mostly due to I/O).
Auto-pilot rebooted the test machine before each new sequence of runs tominimize the influence of different experiments on each other. Auto-pilot au-tomatically disabled all unrelated system services to prevent them from influ-encing the results. Compilers and executables were located on the machine’ssystem disk, so the first run of each set of tests was discarded to ensure that thecache states were consistent. We configured Auto-pilot to unmount, recreate,and then remount all tested file systems before each benchmark run. To mini-mize ZCAV effects, all benchmarks were run on a partition located toward theoutside of the disk, and this partition was just large enough to accommodatethe test data [Ellard and Seltzer 2003b]. However, the partition size was bigenough to avoid the file system’s space-saving mode of file system operation. Inthe space-saving mode, file systems optimize their operation to save disk spaceand thus have different performance characteristics [Van Meter 1997].
7. MACROBENCHMARKS
In this section we describe the macro-, or general purpose, benchmarks thatwere used in the surveyed research papers. We point out the strengths andweaknesses in each. For completeness, we also discuss several benchmarks thatwere not used. Macrobenchmark workloads consist of a variety of operations
ACM Transactions on Storage, Vol. 4, No. 2, Article 5, Publication date: May 2008.

A Nine Year Study of File System and Storage Benchmarking • 5:15
and aim to simulate some real-world workload. The disadvantage of mac-robenchmarks is that this workload may not be representative of the workloadthat the reader is interested in, and it is very difficult to extrapolate from theperformance of one macrobenchmark to a different workload.
Additionally, there is no agreed-upon file system benchmark that everyonecan use. Some computer science fields have organizations that create bench-marks and keep them up to date (e.g., TPC in the database community). Thereis no such organization specifically for the file system community, althoughthe Standard Performance Evaluation Corporation (SPEC) has one benchmarktargeted for a specific network file system protocol; see Section 7.5. For stor-age, the Storage Performance Council [SPC 2007] has created two standardizedbenchmarks which we describe in Section 7.6. We have observed that many re-searchers use the same benchmarks, but they often neither explain the reasonsfor using them nor elucidate what the benchmarks show about the systemsthey are testing. From the 148 macrobenchmark experiments performed in thesurveyed papers, 20 reported having used a benchmark because it was popularor standard, and 28 provided no reason at all. Others described what real-worldworkload the given benchmark was mimicking, but did not say why it was im-portant to show these results. In total, inadequate reasoning was given for atleast 32.4% of the macrobenchmark experiments performed. This leads us tobelieve that many researchers use the benchmarks that they are used to andthat are commonly used, regardless of suitability.
In this section we describe the Postmark, various compile, Andrew, TPC,SPEC, SPC, NetNews, and other macrobenchmarks.
7.1 Postmark
Postmark [Katcher 1997; VERITAS Software 1999], created in 1997, is a single-threaded synthetic benchmark that aims at measuring file system perfor-mance over a workload composed of many short-lived, relatively small files.Such a workload is typical of electronic mail, NetNews, and Web-based com-merce transactions as seen by ISPs. The workload includes a mix of data- andmetadata-intensive operations. However, the benchmark only approximates filesystem activity; it does not perform any application processing, and so the CPUutilization is less than that of an actual application.
The benchmark begins by creating a pool of random text files with uniformlydistributed sizes within a specified range. After creating the files, a sequence of“transactions” is performed (in this context a transaction is a Postmark term,and unrelated to the database concept). The number of files, number of subdi-rectories, file-size range, and number of transactions are all configurable. EachPostmark transaction has two parts: a file creation or deletion, operation, pairedwith a file read or append. The ratios of reads-to-appends and creates-to-deletesare configurable. A file creation operation creates and writes random text to afile. A file deletion operation removes a randomly chosen file from the activeset. A file read operation reads a random file in its entirety and a file writeoperation appends a random amount of data to a randomly chosen file. It isalso possible to choose whether or not to use buffered I/O.
ACM Transactions on Storage, Vol. 4, No. 2, Article 5, Publication date: May 2008.

5:16 • A. Traeger et al.
Table II. Postmark Configuration Details
Parameter Default Value Number Disclosed (out of 30)
File sizes 500–10,000 bytes 21Number of files 500 28Number of transactions 500 25Number of subdirectories 0 11Read/write block size 512 bytes 7Operation ratios equal 16Buffered I/O yes 6Postmark version - 7
The default Postmark v1.5 configuration and the number of research papers that disclosed each
piece of information (from the 30 papers that used Postmark in the papers we surveyed).
One drawback of using Postmark is that it does not scale well with the work-load. Its default workload, shown in Table II, does not exercise the file sys-tem enough. This makes it no longer relevant to today’s systems, and as aresult researchers use their own configurations. On the machine described inSection 6, the default Postmark configuration takes less than a tenth of onesec. to run, and barely performs any I/O. One paper [Nightingale et al. 2005]used the default configuration over NFS rather than updating it for currenthardware, and the benchmark completed in under seven sec. It is unlikelythat any accurate results can be gathered from such short benchmark runs. InSection 12.2, we show how other Postmark configurations behave very differ-ently from each other. Rather than having the number of transactions to beperformed as a parameter, it would be more beneficial to run for a specifiedamount of time and report the peak transaction rate achieved. Benchmarkssuch as Spec SFS and AIM7 employ a similar methodology.
Having outdated default parameters creates two problems. First, there isno standard configuration, and since different workloads exercise the systemdifferently, the results across research papers are not comparable. Second, notall research papers precisely describe the parameters used, and so results arenot reproducible.
Few research papers specify all the parameters necessary for reproducing aPostmark benchmark. From the 106 research papers that we surveyed, 29 usedPostmark as one of their methods for performance evaluation [Ng et al. 2002;Sarkar et al. 2003; Sivathanu et al. 2006, 2004a, 2004b; Radkov et al. 2004;Tan et al. 2005; Anderson et al. 2002; Nightingale et al. 2006, 2005; Wang et al.2002; Seltzer et al. 2000; MacCormick et al. 2004; Abd-El-Malek et al. 2005;Thereska et al. 2004; Magoutis et al. 2002; Aranya et al. 2004; Muniswamy-Reddy et al. 2004; Zhang and Ghose 2003; Wright et al. 2003b; Strunk et al.2000; Prabhakaran et al. 2005a; Stein et al. 2001; Soules et al. 2003; Denehyet al. 2005; Weddle et al. 2007; Schindler et al. 2002; Magoutis et al. 2003; Wangand Merchant 2007]. Table II shows how many of these papers disclosed eachpiece of information. Papers that use configurable benchmarks should includeall the parameters to make results meaningful; only 5 did so. These 5 papersspecified that any parameters not mentioned were the defaults (Table II givesthem credit for specifying all parameters).
ACM Transactions on Storage, Vol. 4, No. 2, Article 5, Publication date: May 2008.

A Nine Year Study of File System and Storage Benchmarking • 5:17
In addition to failing to specify parameters, Table II shows that only 5 outof 30 research papers mentioned the version of Postmark used. This is espe-cially crucial with Postmark due to its major revisions that make results fromdifferent versions incomparable. The biggest changes were made in version1.5, where the benchmark’s pseudorandom number generator was overhauled.Having a generator in the program itself is a good idea, as it makes the bench-marks across various platforms more comparable. There were two key bugswith the previous pseudorandom number generator. First, it did not providenumbers that were random enough. Second, and more importantly, it did notgenerate sufficiently large numbers, so the files created were not as large as theparameter specified, causing results to be inaccurate at best. Having a built-inpseudorandom number generator is an example of a more general rule: Libraryroutines should be avoided unless the goal of the benchmark is to measure thelibraries because this introduces more dependencies on the machine setup (OS,architecture, and libraries).
Another lesson that Postmark teaches us is to make an effort to keep bench-marking algorithms scalable. The algorithm that Postmark uses to randomlychoose files is O(N ) on the number of files, which does not scale well with theworkload. It would be trivial to modify Postmark to fix this, but would make theresults incomparable with others. While high levels of computation are not nec-essarily a bad quality, they should be avoided for benchmarks that are meantto be I/O bound.
An essential feature for a benchmark is accurate timing. Postmark uses thetime(2) system call internally, which has a granularity of one sec. There are bet-ter timing functions available (e.g., gettimeofday) that have much finer gran-ularity and therefore provide more meaningful and accurate results.
One of the future directions considered for Postmark is allowing differentnumbers of readers and writers, instead of just one process that does both.Four of the surveyed papers [Aranya et al. 2004; Anderson et al. 2004, 2002;Wang and Merchant 2007] ran concurrent Postmark processes. Seeing howmultiple processes affect results is useful for benchmarking most file systems,as this reflects real-world workloads more closely. However, since Postmark isnot being maintained (no updates have been made to Postmark since 2001),this will probably not be done.
One research paper introduces Filemark [Bryant et al. 2002], which is amodified version of Postmark 1.5. It differs from its predecessor in five respects.First, it adds multithreading so that it can produce a heavier and more realisticworkload. Second, it uses gettimeofday instead of time, so that timing is moreaccurate. Third, it uses the same set of files for multiple transaction phases.This makes the runtime faster, but culminates in fewer writes, and extra caremust be taken to ensure that data is not cached if this is not desired. Fourth, itallows the read-write and create-delete ratios to be specified to the nearest 1%,instead of 10% as with Postmark. Fifth, it adds an option to omit performanceof the delete phase, a phase which the Filemark authors claim as having ahigh variation and being almost meaningless. We suggest instead that if someoperation has a high variation, it should be further investigated and explainedrather than discarded.
ACM Transactions on Storage, Vol. 4, No. 2, Article 5, Publication date: May 2008.

5:18 • A. Traeger et al.
Postmark puts file systems under heavy stress when the configuration islarge enough, and is a fairly good benchmark. It has good qualities such as abuilt-in pseudorandom number generator, but also has some deficiencies. It isimportant to keep in mind its positive and negative qualities when runningthe benchmark and analyzing results. In sum, we suggest that Postmark beimproved to have a scalable workload, more accurate timing, and to allow formultithreaded workloads.
7.2 Compile Benchmarks
Of the papers we surveyed, 36 timed the compiling of some code to benchmarktheir projects. These papers are broken down as follows.
—Ten compiled SSH [Soules et al. 2003; Ng et al. 2002; Schindler et al. 2002;Denehy et al. 2005; Strunk et al. 2000; Prabhakaran et al. 2005a; Seltzeret al. 2000; Kroeger and Long 2001; Stein et al. 2001; Weil et al. 2006].
—Eight compiled an OS kernel [Zhang and Ghose 2003; Mazieres et al. 1999;Tolia et al. 2004; Gulati et al. 2007; Radkov et al. 2004; Sivathanu et al. 2006;Papathanasiou and Scott 2004; Muniswamy-Reddy et al. 2006].
—Six papers (all from our research group) compiled Am-utils [Aranya et al.2004; Muniswamy-Reddy et al. 2004; Zadok and Nieh 2000; Zadok et al.2001, 1999; Wright et al. 2003b].
—Five compiled Emacs [Gulati et al. 2007; Li et al. 2004; Fu et al. 2000;Mazieres 2001; Muthitacharoen et al. 2001].
—Three compiled Apache [Peek and Flinn 2006; Nightingale et al. 2006, 2005].
—Five compiled other packages [Gulati et al. 2007; Sobti et al. 2002; Abd-El-Malek et al. 2005; Gniady et al. 2004; Lee et al. 1999].
—Two did not specify the source-code being compiled [Kroeger and Long 2001;Kim et al. 2000].
The main problem with compile benchmarks is that because they are CPUintensive, they can hide the overheads in many file systems. This issue is dis-cussed further in Section 12.2. However, a CPU-intensive benchmark may bea reasonable choice for a file system that already has a significant CPU com-ponent (such as an encryption or compression file system). Even so, a moreI/O-intensive benchmark should be run as well. Other issues relating to com-pile benchmarks affect the ability of readers to compare, fully understand, andreproduce benchmark results. These are presented next.
(1) Different machines may have different compiler tool chains. Specifically:—Different architectures produce different code.—Different compilers utilize different optimizations.—The source-code may not compile on all architectures, and older packages
often cannot compile on newer systems, so the workload becomes obsolete.
(2) Different machines are configured differently (with regard to both hard-ware and software), so the configuration phase will not be the same on allmachines, and the resulting code will be different as well.
ACM Transactions on Storage, Vol. 4, No. 2, Article 5, Publication date: May 2008.

A Nine Year Study of File System and Storage Benchmarking • 5:19
Table III. SSH 2.1.0, Am-Utils 6.1b3, and Linux Kernel 2.4.20Characteristics
SSH Am-Utils Linux Kernel
Directories 54 25 608Files 637 430 11,352Lines of Code 170,239 61,513 4,490,349Code Size (Bytes) 5,313,257 1,691,153 126,735,431Total Size (Bytes) 9,068,544 8,441,856 174,755,840
The total size refers to the precompiled package, since the total size after
compiling is system dependent.
(3) Some compilations (such as kernels) have different configuration options,resulting in a different configuration phase and different resulting code.Although default configuration files are sometimes included, using themcan result in compilation errors, as we have experienced when compilingsome versions of the Linux kernel.
(4) The operation mixes can change depending on which program is being com-piled, and even on its version.
(5) The compile process is perpetually growing more complex and there is muchvariation between programs. Most require explicit configuration phases,and some require phases that resolve dependencies. The amount of timespent in each phase can also vary significantly [Zadok 2002].
To allow a benchmark to be accurately reproduced, all parameters that couldaffect the benchmark must be reported. This is particularly difficult with acompile benchmark. From the 33 papers that used compile benchmarks, only1 specified the compiler and linker versions, and 1 specified compiler options.Moreover, 8 failed to specify the version of the code being compiled, and 19 failedto specify the compilation steps being measured. Although it is easy to reportthe source-code version, it is more difficult to specify the relevant programsand patches that were installed. For example, Emacs has dependencies on thegraphical environment, which may include dozens of libraries and their asso-ciated header files. However, this specification is feasible if a package managerhas been used that can provide information about all of the installed programversions. Because of the amount of information that needs to be presented, werecommend creating an online appendix with the detailed testbed setup.
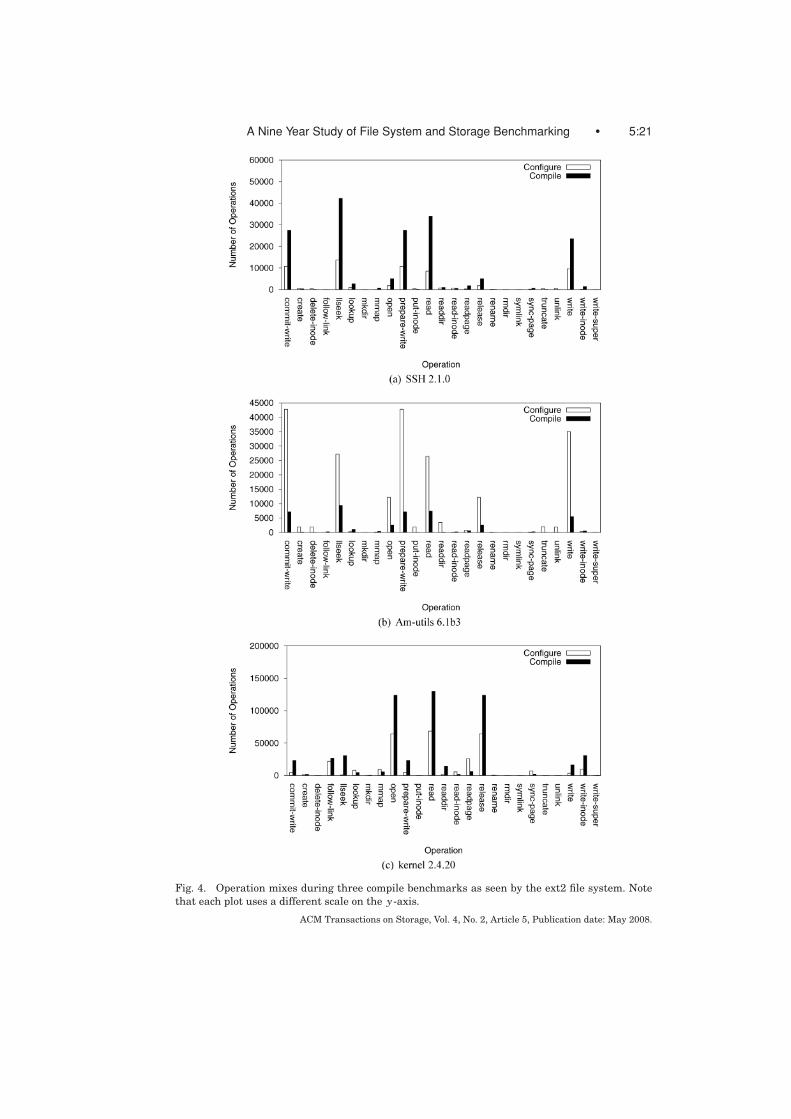
There is a common belief that file systems see similar loads, independent ofthe software being compiled. Using OSprof [Joukov et al. 2006], we profiled thebuild process of three packages commonly used as compile benchmarks: (1) SSH2.1.0; (2) Am-utils 6.1b3; and (3) the Linux 2.4.20 kernel with the default config-uration. Table III shows the general characteristics of the packages. The buildprocess of these packages consists of a configuration phase and a compilationphase. The configuration phase consists of running GNU configure scripts forSSH and Am-utils, and running “make defconfig dep” for the Linux kernel.We analyzed the configuration- and compilation phases both separately as wellas together. Before the configuration- and compilation phases, we remountedthe ext2 file system on which the benchmark was run, to reduce caching effects.
ACM Transactions on Storage, Vol. 4, No. 2, Article 5, Publication date: May 2008.

5:20 • A. Traeger et al.
Figure 4 shows the distribution of the total number of invocations of all ext2VFS operations used during the build processes. Note that each of the threegraphs uses different scales for the number of operations ( y-axis).
Figures 4(a) and 4(b) show that even though the SSH and Am-utils buildprocess sequences, source-file structures, and total sizes appear to be similar,their operation mixes are quite different; moreover, the fact that SSH has nearlythree times the lines of code of Am-utils is also not apparent from analyzing thefigures. In particular, the configuration phase dominates in the case of Am-utils,whereas the compilation phase dominates the SSH build. More importantly,the read-write ratio for the Am-utils build was 0.75:1, whereas it was 1.28:1for the SSH build. This can result in significant performance differences forread- versus write-oriented systems. Not surprisingly, the kernel-build processprofile differs from both SSH and Am-utils. As can be seen in Figure 4(c), both ofthe kernel-build phases are strongly read biased. In addition, the kernel-buildprocess is more intensive in file-open and file-release operations. As we can see,even seemingly similar compile benchmarks exercise the test file systems withlargely different operation mixes.
Now let us consider compilation of the same software with slightly differentversions. In the paper “Opportunistic Use of Content Addressable Storage forDistributed File Systems,” by Tolia et al. [2003], the authors show the com-monality found between versions of the Linux 2.4 kernel source-code (from2.4.0 to 2.4.20) and between several nightly snapshots of Mozilla binaries fromMarch 16th, 2003 to March 25th, 2003. The commonality for both examplesis measured as the percentage of identical blocks. The commonality betweenone version of the Linux source-code and the next ranges from approximately72% to almost 100%, and version 2.4.20 has only about 26% in common with2.4.0. The Mozilla binaries show us how much a normal user application canchange over the course of one day: Subsequent versions had approximately 42to 71% in common, and only about 30% of the binary remained unchanged overthe course of ten days. This illustrates the point that even when performinga compile benchmark on the same program, its version can greatly affect theresults.
Not only do the source-code and resulting binaries change, but the operationmixes change as well. To illustrate this point, we compiled three different, butrecent, versions of SSH on our reference machine, using the same testbed andmethodology described in Section 6. We used SSH because it is the most com-mon application that was compiled in the papers we surveyed, and specificallyOpenSSH because it compiles on modern systems.
Each test consisted of unpacking, configuring, and compiling the source-code,and then deleting it. The first and last steps are less relevant to our discussion,hence we do not discuss them further. The results for the configure- and com-pile phases are shown in Figure 5. Although the elapsed times for the configurephase of versions 3.5 and 3.7 are indistinguishable, there is a much larger dif-ference between versions 3.7 and 3.9 (42.3% more elapsed time, 55.6% moresystem time, and 25.1% more user time for the latter). There are differencesbetween all three versions for the compile phase, with increases ranging from6.0% to 8.4% between subsequent versions for all time components. We can see
ACM Transactions on Storage, Vol. 4, No. 2, Article 5, Publication date: May 2008.
A Nine Year Study of File System and Storage Benchmarking • 5:21
Fig. 4. Operation mixes during three compile benchmarks as seen by the ext2 file system. Notethat each plot uses a different scale on the y-axis.
ACM Transactions on Storage, Vol. 4, No. 2, Article 5, Publication date: May 2008.

5:22 • A. Traeger et al.
Fig. 5. Time taken to configure and compile OpenSSH versions 3.5, 3.7, and 3.9 on ext2. Note thaterror bars are shown, but are small and difficult to see.
that versions of the same program that closely resemble each other are yet verydifferent, and we can therefore infer that the difference will be greater betweenversions that are spread further apart, and moreso for different programs. Fi-nally, we see how small are the effects of I/O operations on the benchmarkresults.
7.3 The Andrew File System Benchmark
The Andrew benchmark was created in 1988 to evaluate the performance of theAndrew file system [Howard et al. 1988]. The benchmark script operates on a di-rectory subtree containing the source-code for a program. The operations chosenfor the benchmark were intended to be representative of an average user work-load [Howard et al. 1988], although this was not shown statistically accurate.Eight papers that we surveyed used this benchmark for performance analy-sis [Adya et al. 2002; Gronvall et al. 1999; Rhea et al. 2003; Gopal and Manber1999; Tolia et al. 2003; Kim et al. 2002; Aguilera et al. 2003; Saito et al. 2002].
The Andrew benchmark has the five phases next presented.
(1) MakeDir: constructs directories in a target subtree identical to the structureof the original subtree.
(2) Copy: copies all files from source subtree to target subtree.
(3) ScanDir: performs a stat operation on each file of the target subtree.
(4) ReadAll: reads every byte of every file in the target subtree once.
(5) Make: compiles and links all files in the target subtree.
This benchmark has two major problems. First, the final phase of the bench-mark (i.e., compilation) dominates the benchmark’s runtime, thus introducingall of the drawbacks of compile benchmarks (see Section 7.2). Second, the bench-mark does not scale. The default dataset will fit into the buffer cache of mostsystems today, so all read requests after the copy phase are satisfied withoutgoing to disk. Therefore, this does not provide an accurate picture of how thefile system would behave under workloads where data is not cached. In order
ACM Transactions on Storage, Vol. 4, No. 2, Article 5, Publication date: May 2008.
A Nine Year Study of File System and Storage Benchmarking • 5:23
to resolve the issue of scalability, four of the research papers used a sourceprogram larger than that which comes with the benchmark. This, however,causes results to be incomparable between papers.
Several research papers use a modified version of the Andrew benchmark(MAB) [Ousterhout 1990] from 1990. The modified benchmark uses the samecompiler so as to make the results more comparable between machines. Thissolves one of the issues we described when examining compile benchmarks inSection 7.2. Although using a standard compiler for all systems is a good solu-tion, it has a drawback: The tool chain is for a machine that does not exist, andit is therefore not readily available and not maintained. This could affect us-ability in future machines. Seven of the research papers that we surveyed usedthis benchmark [Mazieres et al. 1999; Muthitacharoen et al. 2002; Padioleauand Ridoux 2003; Santry et al. 1999; Nightingale and Flinn 2004; Cipar et al.2007; Sobti et al. 2002].
One of the papers [Sobti et al. 2002] further modified the benchmark byremoving the make phase and increasing the number of files and directories.Although this removes the complications associated with a compile benchmarkand takes care of scalability, data can still be cached depending on the packagesize. Another paper [Nightingale and Flinn 2004] used Apache for the sourcefiles, and measured the time to extract the files from the archive, configure andcompile the package, and remove the files. These two papers reported using a“modified Andrew benchmark,” but since the term “modified” is rather ambigu-ous, we could not determine whether they had used the MAB compiler, or if thebenchmark was called “modified” because it used a different package or haddifferent phases.
The Andrew benchmark basically combines a compile benchmark and amicrobenchmark. We suggest using separate compile benchmarks and mi-crobenchmarks as deemed appropriate (see Sections 7.2 and 9 for extensivediscussions on each, respectively).
Notable quotables. We believe some quotations from those papers that usedthe Andrew benchmark can provide some insight into the reasons for runningit, and into the type of workload that it performs. Six of the fifteen papersthat used the Andrew benchmark (or some variant) stated that it was becauseAndrew was popular or standard. One paper states that “primarily because itis customary to do so, we also ran a version of the Andrew benchmark” [Adyaet al. 2002]. Six others gave no explicit reason for running the benchmark.The remaining three papers claimed the reason as being that its workload wasrepresentative of a user- or software developer workload.
Running a benchmark because it is popular or a standard can help readerscompare results across papers. Unfortunately, this benchmark has several defi-ciencies. One paper states that “such Andrew benchmark results do not reflecta realistic workload” [Adya et al. 2002]. Another comments that because of thelack of I/O performed, the benchmark “will tend to understate the differencebetween alternatives” [Kim et al. 2002]. The authors of one paper describe thatthey “modified the benchmark because the 1990 benchmark does not gener-ate much I/O activity by today standard” [Sobti et al. 2002]. Finally, one paper
ACM Transactions on Storage, Vol. 4, No. 2, Article 5, Publication date: May 2008.

5:24 • A. Traeger et al.
describes the use of the Andrew benchmark and how most read requests aresatisfied from the cache.
The Andrew Benchmark has been criticized for being old benchmark, withresults that are not meaningful to modern systems. It is argued that the work-load being tested is not realistic for most users. Furthermore, original Andrew[b]enchmark used a source tree which is too small to produce meaningful re-sults on modern systems [citation removed]. However, as we stated above, the[b]enchmark’s emphasis on small file performance is still relevant to modernsystems. We modified the Andrew [b]enchmark to use a Linux 2.6.14 sourcetree [. . . ]. Unfortunately, even with this larger source tree, most of the databy the benchmark can be kept in the OS’s page cache. The only phase wherefile system performance has a significant impact is the copy phase [Cipar et al.2007].
It seems that researchers are aware of the benchmark’s drawbacks, but still useit because it has become a “standard,” because its what they are accustomedto, or because it is something that other researchers are accustomed to. It isunfortunate that an inadequate benchmark has achieved this status, and wehope that a better option will soon take its place.
7.4 TPC
The Transaction Processing Performance Council (TPC) is “a no[np]rofit cor-poration founded to define transaction processing and database benchmarksand to disseminate objective, verifiable TPC performance data to the indus-try” [TPC 2005]. The organization has strict guidelines about how benchmarksare run, requires submission of the full results and configurations, and auditsthe results to validate them. To certify benchmark results, companies musthave auditors who are accredited by the TPC board to stand by throughoutthe experiments. Whereas this sort of requirement is desirable in a commer-cial environment, it is not practical for writing academic papers. Therefore, thebenchmarks are used without the accompanying strict TPC guidelines. Thereare four TPC benchmarks currently in use by the database community: TPC-App, TPC-C, TPC-E, and TPC-H. Here we only describe those that were usedin the surveyed papers: TPC-B, TPC-C, TPC-D, TPC-H, and TPC-W.
TPC-B. This benchmark has been obsolete since 1995 because it wasdeemed too simplistic, but was used in one of the surveyed papers in2005 [Prabhakaran et al. 2005a]. Another paper [Denehy et al. 2005] created abenchmark modeled after this workload. The benchmark is designed to stress-test the core of a database system by having several benchmark programs si-multaneously submiting transactions of a single type as fast as possible. Themetric reported is in transactions per sec.
TPC-C. Created in 1992, this benchmark and adds some complexity thatwas lacking in the older TPC benchmarks TPC-A and TPC-B. It is a data-intensive benchmark, portraying the activity of a wholesale supplier where apopulation of users executes transactions against a database. The supplier hasa number of warehouses with stock, and deals with orders and payments. Five
ACM Transactions on Storage, Vol. 4, No. 2, Article 5, Publication date: May 2008.

A Nine Year Study of File System and Storage Benchmarking • 5:25
different transaction types are used, which are either executed immediatelyor set to be deferred. The database contains nine types of tables with variousrecord and population sizes. The performance metric reported is transactionsper min. for TPC-C (tpmC).
TPC-C was used in eight of the surveyed papers [Zhou et al. 2001; Sarkaret al. 2003; Radkov et al. 2004; Huang and Chiueh 2001; Thereska et al. 2004;Ng et al. 2002; Abd-El-Malek et al. 2005; Wachs et al. 2007]. In addition, onepaper [Nightingale et al. 2006] used an implementation of TPC-C created bythe Open-Source Development Lab (OSDL, which was merged into the LinuxFoundation in January 2007). The OSDL has developed implementations ofseveral TPC benchmarks [OSDL 2007]. TPC-C is being replaced by TPC-E,which is designed to be representative of current workloads and hardware, isless expensive to run because of its more practical storage requirements, andhas results that are less dependent on hardware- and software configurations.
TPC-D. This benchmark was the precursor to TPC-H (explained next), andhas been obsolete since 1999. This is because TPC-D was benchmarking bothad hoc queries as well as business support and reporting, and could not do bothadequately at the same time. TPC-D was split into TPC-H (ad hoc queries) andTPC-R (business support and reporting).
TPC-H. The workload for this benchmark consists of executing ad hocqueries against a database and performing concurrent data modifications.Rather than being only data intensive like TPC-C, this benchmark exercisesa larger portion of a database system. It uses queries and data relevant tothe database community. The benchmark examines large volumes of data, ex-ecutes queries with a high degree of complexity, and uses the data to give an-swers to critical business questions (dealing with issues such as supply anddemand, profit and revenue, and customer satisfaction). The performance met-ric reported is called the TPC-H composite query-per-hour performance metric(QphH@Size), and reflects multiple aspects of the capability of the system toprocess queries, including database size, query processing power, and through-put. This benchmark was used in three of the surveyed papers [Wachs et al.2007; Radkov et al. 2004; Gniady et al. 2004].
TPC-W. This benchmark was meant to recreate the workload seen in anInternet commerce environment. It provides little insight because it is overlycomplex, difficult to analyze, and does not recreate the behavior of specific ap-plications [Schmidt et al. 2001]. TPC-W was used in one of the surveyed pa-pers [Huang et al. 2005], but had been declared obsolete by TPC approximatelysix months earlier (in April 2005).
Using a benchmark that is highly regarded and monitored by a council ofprofessionals from the database community certainly adds to its credibility.The benchmarks are kept up-to-date with new version releases, and whenserious problems are found with a benchmark, it is declared obsolete. How-ever, none of the papers that used the benchmark had its results audited, andmost, if not all, did not run the benchmark according to the specifications.A drawback of using TPC benchmarks for performance analysis is that they
ACM Transactions on Storage, Vol. 4, No. 2, Article 5, Publication date: May 2008.
5:26 • A. Traeger et al.
utilize a database system, which introduces extra complexity. This makes theresults less comparable between papers and makes the benchmark more diffi-cult to set-up. Several papers opted to use traces of the workload instead (seeSection 8), and one paper [Lumb et al. 2002] used a synthetic benchmark whoseworkload was shown to be similar to the disk traces of a Microsoft SQL serverrunning TPC-C. Additionally, while most papers specified the database usedfor the experiment, barely any tuning parameters were specified, and nonespecified the database table layout, which can have dramatic effects on TPCbenchmark performance. Although databases are known to have many tuningparameters, one paper specified only two, while others specified only one oreven none. Some authors may have used the default settings since they may beless familiar with database systems than with file or storage systems, but onepaper [Sarkar et al. 2003] specified that the “database settings were fine-tunedfor performance” without indicating the exact settings.
7.5 SPEC
The Standard Performance Evaluation Corporation (SPEC) was founded in1988 by a small number of workstation vendors, with the aim of creatingrealistic, standardized performance tests. SPEC has grown to become a suc-cessful performance standardization body with more than 60 member compa-nies [SPEC 2005a].
SFS. The SPEC SFS benchmark [SPEC 2001; Robinson 1999] measuresthe performance of NFSv2 and v3 servers. It is the official benchmark for mea-suring NFS server throughput and response time. One of the surveyed pa-pers [Spadavecchia and Zadok 2002] used a precursor to this benchmark calledNFSSTONE [Shein et al. 1989], created in 1989 (not created by SPEC). NF-SSTONE performs a series of 45,522 file system operations, mostly executingsystem calls, to measure how many operations per sec. an NFS server can sus-tain. The benchmark performs a mix of operations intended to show typical NFSaccess patterns [Sandberg et al. 1985]: 53% lookups, 32% reads, 7.5% readlinks(symlink traversal), 3.2% writes, 2.3% getattrs, and 1.4% creates. This bench-mark performs these operations as fast as it can and then reports the averagenumber of operations performed per sec., or NFSSTONES. The problems withthis benchmark are that it only uses one client so that the server is not alwayssaturated, it relies on the client’s NFS implementation, and the file- and blocksizes are not realistic.
Another benchmark called nhfsstone was developed in 1989 by Legato Sys-tems, Inc. It was similar to NFSSTONE except that instead of the clients exe-cuting system calls to communicate with the server, they used packets createdby the user-space program. This reduces the dependency on the client, but doesnot eliminate it because the client’s behavior still depends on the kernel of themachine on which it runs.
LADDIS [Watson and Nelson 1992; Wittle and Keith 1993] was created in1992 by a group of engineers from various companies, and was further devel-oped when SPEC took the project over (this updated version was called SFS 1.0).LADDIS solved some of the deficiencies in earlier benchmarks by implementing
ACM Transactions on Storage, Vol. 4, No. 2, Article 5, Publication date: May 2008.

A Nine Year Study of File System and Storage Benchmarking • 5:27
the NFS protocol in user space, improving the operation mix, allowing multi-ple clients to generate load on the server simultaneously, providing a consis-tent method for running the benchmark, and porting the benchmark to severalsystems. Like the previous benchmarks, given a requested load (measured inoperations/sec.), LADDIS generates an increasing load of operations and mea-sures the response time until the server is saturated. This is the maximumsustained load that the server can handle under this requested load. As therequested load increases, response time diminishes. The peak throughput isreported.
LADDIS used an outdated workload, and only supported NFSv2 over UDP(no support for NFSv3 or TCP). SFS 2.0 fixed these shortcomings, but severalalgorithms dealing with request-rate regulation, I/O access, and the file set werefound defective. SPEC SFS 3.0 fixed the latter, and updated some importantfeatures such as the time measurement.
The SFS 3.0 benchmark is run by starting the script on all clients (one will bethe main client and direct the others). The number of load-generating processes,the requested load for each run, and the amount of read-ahead and write-behindare specified. For each requested load, SFS reports the average response time.The report is a graph with at least 10 requested loads on the x-axis, and theircorresponding response times on the y-axis.
SPEC SFS was used by two of the surveyed papers, one of which ran incompliance with SPEC standards [Eisler et al. 2007], and one in which thematter of compliance was not clear [Anderson et al. 2000]. In addition, one paperused a variant of SFS [Patterson et al. 2002], but did not specify how it varied.One issue with SFS is that the number of systems that can be tested is limitedto those that speak the NFSv2 and NFSv3 protocols. SFS cannot test changes toNFS clients, and cannot be used to compare an NFS system with a system thatspeaks another protocol. Whereas this benchmark is very useful for companiesthat sell filers, its use is limited in the research community. This limitation,combined with the fact that the benchmark is not free (it currently costs $900,or $450 for nonprofit or educational institutions), has probably impeded itswidespread use in the surveyed papers.
It is of interest to note that the operation mix for the benchmark is fixed.This is good because it more greatly, standardizes the results but is also badbecause the operation mix can become outdated and may not be appropriate forall settings. Some have claimed that SFS does not resemble any NFS workloadthey have observed, and that each NFS trace that they examined had uniquecharacteristics, raising the question of whether one can construct a standardworkload [Zhu et al. 2005a]. One can change the operations mix for SFS, soin some sense it can be used as a workload generator. However, the default,standard operations mix must be used to report any standard results that canbe compared with other systems. It seems this may be the end for the SFSbenchmark because NFSv4 is already being deployed, and SPEC has not statedany plans to release a new version of SFS. In addition, Spencer Shepler, oneof the chairs of the NFSv4 IETF working group, has stated that SPEC SFS is“unlikely to be extended to support NFSv4,” and that FileBench (see Section 10)will probably be used instead [Shepler 2005].
ACM Transactions on Storage, Vol. 4, No. 2, Article 5, Publication date: May 2008.

5:28 • A. Traeger et al.
SDM. The SPEC SDM benchmarking suite [SPEC 2004] was made in 1991and produces a workload that simulates a software development environmentwith a large number of users. It contains two subbenchmarks, 057.SDET and061.Kenbus1, both of which feed randomly ordered scripts to the shell withcommands like make, cp, diff, grep, man, mkdir, spell, etc. Both use a largenumber of concurrent processes to generate significant file system activity.
The measured metric consists of the number of scripts completed per hour.One script is generated for each “user” before the timing begins, and each con-tains separate subtasks executed in a random order. Each user is then given ahome directory that is populated with the appropriate directory tree and files.A shell is started for each user that uses its own execution script. The timer isstopped when all scripts have completed execution.
There are two main differences between these two benchmarks. First,Kenbus simulates users typing at a rate of three characters per sec., as op-posed to SDET which reads as fast as possible. Second, the command set usedin SDET is a lot richer and many of the commands do a lot more work than inKenbus.
The SDET benchmark was used in two surveyed papers [Ng et al. 2002;Seltzer et al. 2000] to measure file system performance, but not all commandsexecuted by the benchmark exercise the file system. The benchmark is meantto measure the performance of the system as a whole, and not any particularsubsystem. In addition, the benchmark description states that it exercises thetmp directories heavily, which means that either the benchmark needs to bechanged or the file system being tested must be mounted as the system disk.However, the benchmark does give a reasonable idea of how a file system wouldaffect everyday workloads. This benchmark is currently being updated andis being called SMT (system multitasking) [SPEC 2003], with the main goalof ensuring that all systems perform the same amount of work regardless ofconfiguration. However, the SMT description has not been updated since 2003,so it is unknown as to whether it will be deployed.
Viewperf. The SPECviewperf benchmark [SPEC 2007] is designed to mea-sure the performance of a graphics subsystem, and was used in one of thesurveyed research papers [Gniady et al. 2004]. However, we will not delve intothis benchmark’s details because it is inappropriate to use it as a file systembenchmark, as it exercises many parts of the OS other than the file system.
Web99. The SPECweb99 benchmark [SPEC 2005b], replaced bySPECweb2005 in 2005, is used for evaluating the performance of Webservers. One of the surveyed research papers [Nightingale et al. 2006] used it.Its workload is comprised of dynamic and static GET operations, as well as POST
operations. We omit further discussion because it is a Web server benchmark,and was used by the authors of the surveyed paper to specifically measuretheir file system using a network-intensive workload.
7.6 SPC
The Storage Performance Council (SPC) [SPC 2007] develops benchmarksfocusing on storage subsystems. Its goal is to have more vendors use
ACM Transactions on Storage, Vol. 4, No. 2, Article 5, Publication date: May 2008.

A Nine Year Study of File System and Storage Benchmarking • 5:29
industry-standard benchmarks and to publish their results in a standard way.The council consists of several major vendors in the storage industry, as well assome academic institutions. The SPC currently has two benchmarks availableto its members: SPC-1 and SPC-2. Neither were used in the surveyed papers,but both are clearly noteworthy.
SPC-1. This benchmark’s workload is designed to perform typical functionsof business-critical applications. The workload is comprised of predominatelyrandom I/O operations, and performs both queries and update operations. Thistype of workload is typical of online transaction processing (OLTP) systems,database systems, or mail server applications. SPC-1 is designed to accuratelymeasure performance and price/performance on both direct attach- or networkstorage subsystems. It includes three tests.
The first test phase, called “Primary Metrics,” has three phases. In the first,throughput sustainability is tested for three hours at steady state. The secondphase lasts for ten min. and tests the maximum attainable throughput in I/Osper sec. The third phase lasts fifty min. and maps the relationship betweenresponse time and throughput by measuring latencies at various load levels,defined as percentages of the throughput achieved in the previous phase. Thethird phase also determines the optimal average response time of a lightlyloaded storage configuration.
The second test was designed to prove that the maximum I/O requestthroughput results determined in the first test are repeatable and reproducible.It does so by running similar but shorter workloads than those of the first testto collect the same metrics. In the third and final test, SPC-1 demonstratesthat the system provides nonvolatile and persistent data storage. It does so bywriting random data to random locations over the total capacity of the storagesystem for at least ten min. The writes are recorded in a log. The system isshut-down, and caches that employ battery backup are flushed or emptied. Thesystem is then restarted, and the written data verified.
SPC-2. This benchmark is characterized by a predominantly sequentialworkload (in contrast to SPC-1’s random one). The workload is intended todemonstrate the performance of business-critical applications that requirelarge-scale, sequential data transfers. Such applications include large file pro-cessing (scientific computing, large-scale financial processing), large databasequeries (data mining, business intelligence), and on-demand video. SPC-2 in-cludes four tests and it measures the throughput.
The first test checks data persistence, similar to the third test of SPC-1. Thesecond test measures large file processing. It has three phases (write-only, read-write, read-only), each consisting of two run sequences, and each of these runsequences are composed of five runs (thirty runs in total). Each run consistsof a certain-sized transfer with a certain number of streams. The third test isthe large database query test, which has two phases (1,024KiB transfer sizeand 64KiB transfer size). Each phase consists of two run sequences (the firstsequence consisting of four outstanding requests and the second of one out-standing request), and each sequence consists of five runs where the number
ACM Transactions on Storage, Vol. 4, No. 2, Article 5, Publication date: May 2008.

5:30 • A. Traeger et al.
of streams is varied (ten runs total). The fourth and final test is the video-on-demand delivery test, in which several streams of data are transferred.
Since the Storage Performance Council has many prominent storage vendorsas members, it is likely that its benchmarks will be widely used in industry.However, their popularity in academia is yet to be seen, as the benchmarks arecurrently only available to SPC members, or for a cost of $500 for nonmemberacademic institutions. Of course, academic institutions will probably not followall of the strict benchmark guidelines and pay the expensive result filing fees,but the benchmarks would still allow for good comparisons.
7.7 NetNews
The NetNews benchmark [Swartz 1996], created in 1996, is a shell script thatperforms a small-file workload comparable to that which is seen on a USENETNetNews server. It performs some setup work, and then executes the followingthree phases multiple times.
(1) Unbatch: measures the receiving and storing of new articles. Enoughdata is used to ensure that all caches are flushed.
(2) Batch: measures the sending of backlogged articles to other sites. Ar-ticles are batched on every third pass so as to reduce the runtime of thebenchmark, but should be large enough such that they will not be cachedwhen reused.
(3) Expire: measures the removal of “expired” articles. Since article times-tamps are not relevant in a benchmark setting, the number of history en-tries is recorded after each unbatch phase. This information is used to deleteexpired articles from more than some number of previous passes. The listof articles to be deleted is written to one file, while the modified history fileis written to another.
One of the surveyed papers [Seltzer et al. 2000] used this benchmark withoutthe batch phase to analyze performance. It is a good benchmark in the sensethat it is metadata intensive, and stresses the file system (given a large enoughworkload). However, while the data size used in the surveyed paper was con-sidered by the authors to be large (270MB for the unbatch phase, and 250MBfor the expire phase), it is much smaller than sizes seen in the real world. Thepaper states that “two years ago, a full news feed could exceed 2.5GB of data,or 750,000 articles per day. Anecdotal evidence suggests that a full news feedtoday is 15–20GB per day.” This shows how a static workload from 1996 is nolonger realistic just four years later. In addition to the unrealistic workloadsize, a USENET NetNews server workload is not very common these days, andit may be difficult to extrapolate results from this benchmark to applicationsthat more people use.
7.8 Other Macrobenchmarks
This section describes two infrequently used macrobenchmarks that appearedin the surveyed research papers.
ACM Transactions on Storage, Vol. 4, No. 2, Article 5, Publication date: May 2008.

A Nine Year Study of File System and Storage Benchmarking • 5:31
NetBench and Dbench. NetBench [VeriTest 2002] is a benchmark used tomeasure the performance of file servers. It uses a network of PCs to generatefile I/O requests to a file server. According to the dbench README file [Tridgell1999], NetBench’s main drawback is that properly running it requires a lab with60–150 PCs running Windows, connected with switched fast Ethernet and ahigh-end server. The dbench README file also states that since the benchmarkis “very fussy,” the machines should be personally monitored. Because of thesefactors, this benchmark is rarely used outside of the corporate world.
Dbench is an open-source program that runs on Linux machines and pro-duces the same file system load as NetBench would on a Samba server, butwithout making any networking calls. It was used in one surveyed paper tomeasure performance [Schmuck and Haskin 2002]. The metrics reported bydbench are true throughput and the throughput expected on a Win9X machine.
Because there is no source-code or documentation available for NetBench,we were limited to analyzing the dbench source-code. The dbench program isrun with one parameter: the number of clients to simulate. It begins by creat-ing a child process for each client. There is a file that uses commands from aWindows trace of NetBench, and which each child process reads one line at-a-time. The benchmark executes the Linux equivalent of each Windows commandfrom the trace, and the file is processed repeatedly for ten min. The main pro-cess is signaled every sec. to calculate and print the throughput up to thatpoint, and to signal to the child processes to stop when the benchmark is over.The first two min. of the run is a warm-up period, and the statistics collectedduring this time are kept separate from those collected during the remainder ofthe run.
The main question with dbench is how closely it approximates NetBench.There are three problems we have discovered. First, there is no one-to-onecorrespondence between Windows and Linux operations, and the file systemsnatively found on each of these OSs are quite different, so it is unknown howaccurate the translations. Second, NetBench has each client running on a sepa-rate machine, while Linux has the main process and all child processes runningon the same machine. The added computation needed for all of the process man-agement plus the activities of each process may affect the results. In addition,if there are many concurrent processes, the benchmark may be analyzing theperformance of other subsystems (e.g., the scheduler) more than the file sys-tem. Third, dbench processes the trace file repeatedly and does not considertimings. The source of the trace file is not clear, and so it is unknown how wellthe operations in the trace reflect the NetBench workload. Caching of the tracefile may also affect the results, since it is processed multiple times by severalclients on the same machine.
8. REPLAYING TRACES
Traces are logs of operations that are collected and later replayed to gener-ate the same workload (if done correctly). They have the same goal as mac-robenchmarks have (see Section 7): to produce a workload which represents areal-world environment. However, although it may be uncertain as to whether
ACM Transactions on Storage, Vol. 4, No. 2, Article 5, Publication date: May 2008.

5:32 • A. Traeger et al.
a macrobenchmark succeeds at this, a trace will definitely recreate the work-load that was traced if it is captured and played back correctly. One must en-sure, however, that the captured workload is representative of the system’sintended real-world environment. Of the surveyed papers, 19 used traces aspart of their performance analysis [Adya et al. 2002; Sivathanu et al. 2004a,2004b; Nightingale and Flinn 2004; Weil et al. 2006; Rowstron and Druschel2001; Arpaci-Dusseau et al. 2003; Zhang et al. 2002; Lu et al. 2002; Lumb et al.2003; Dimitrijevic et al. 2003; Flinn et al. 2003; Schindler et al. 2004; Toliaet al. 2004, 2003; Weddle et al. 2007; Peterson et al. 2007; Tian et al. 2007;Prabhakaran et al. 2005b].
Some use traces of machines running macrobenchmarks such as TPC-C [Dimitrijevic et al. 2003; Zhang et al. 2002], TPC-H [Schindler et al. 2004],or compile benchmarks [Weil et al. 2006]. These traces differ from the norm inthat they are traces of a synthetic workload rather than a real-world environ-ment. It is unclear why a trace of a compile benchmark was used, rather thanrunning the compile benchmark itself. However, since the actual TPC bench-marks require a database system and have rather complicated setups, authorsmay opt to use traces of the TPC benchmark instead. However, it is importantto replay the trace in an environment similar to where the trace was gathered.For example, one paper [Dimitrijevic et al. 2003] used a trace of a TPC run thatused a file-system-based database, but the authors replayed it in an environ-ment that bypassed the file system to access the block device directly. For moreinformation on TPC benchmarks, see Section 7.4.
There are four problem areas with traces today, as described next in detail:the capture method, the replay method, trace realism, and trace availability.
Capture method. There is no accepted way to capture traces, and this lackcan be a source of confusion. Traces can be captured at system call-, VFS-,networking-, and driver levels.
The most popular way is to capture traces at the system-call level, primar-ily because it is easy and the system call API is portable [Akkerman 2002;Mummert and Satyanarayanan 1994; Ousterhout et al. 1985]. One benefit ofcapturing at the system-call level is that this method does not differentiate be-tween requests that are satisfied from the cache and those that are not. Thisallows one to test changes in caching policies. An important drawback of cap-turing at the system-call level is that memory-mapped operations cannot becaptured. Traces captured at the VFS level contain cached and noncached re-quests, as well as memory-mapped requests. However, VFS tracer portability islimited even between different versions of the same OS. Existing VFS tracersare available for Linux [Aranya et al. 2004] and Windows NT [Vogels 1999;Roselli et al. 2000].
Network-level traces contain only those requests that were not satisfiedfrom the cache. Network-level capturing is only suitable for network file sys-tems. Network packet traces can be collected using specialized devices, or soft-ware tools like tcpdump. Specialized tools can capture and preprocess only thenetwork-file-systems-related packets [Ellard and Seltzer 2003a; Blaze 1992].Driver-level traces contain only noncached requests and cannot correlate the
ACM Transactions on Storage, Vol. 4, No. 2, Article 5, Publication date: May 2008.

A Nine Year Study of File System and Storage Benchmarking • 5:33
requests with the associated metadata without being provided with or inferringadditional information. For example, read requests to file metadata and data-read requests cannot be easily distinguished [Ruemmler and Wilkes 1993].
The process by which the trace is captured must be explained, and should bedistributed along with the trace if others will be using it. In five of the surveyedpapers, the authors captured their own traces, but four of them did not specifyhow this was done.
When collecting file system traces for studies, many papers use tracing toolsthat are customized for a single study. These systems are either built in anad hoc manner [Ousterhout et al. 1985; Roselli et al. 2000], modify standardtools [Roselli et al. 2000; Ellard et al. 2003], or are not well documented inresearch texts. Their emphasis is on studying the characteristics of file sys-tem operations and not on developing a systematic or reusable infrastructurefor tracing. Often, the traces used excluded useful information for others con-ducting new studies; information excluded could concern the initial state ofthe machines or hardware on which the traces were collected, some file systemoperations and their arguments, pathnames, and more.
Replay method. Replaying a file system trace correctly is not as easy asit may appear. Before one can start replaying, the trace itself may need to bemodified. Any missing operations have to be guessed so that operations thatoriginally succeeded do not fail (and those that failed should not succeed) [Zhuet al. 2005a]. For example, files must be created before they are accessed. Inaddition, the trace may be scaled spatially or temporally [Zhu et al. 2005a]. Forparallel applications, finding internode dependencies and inter-I/O computetimes in the trace improves replay correctness [Mesnier et al. 2007]. Once thetrace is ready, the target file system must be prepared. Files assumed to exist inthe trace must exist on the file system with at least the size of the largest offsetaccessed in it. This will ensure that the trace can be replayed, but the resultingfile system will have no fragmentation and will only include those files thatwere accessed in the trace, which is not realistic. The solution here is to age thefile system. Of course, the aging method should be described because the replaywill then differ from the original run, as well as from replays that aged the filesystem differently. There are fewer issues with preparing block-level traces forreplay on traditional storage devices, since block accesses generally do not haveassociated context. In this case, missing operations cannot be known and agingthe storage system will not affect the behavior of the benchmark, since theblocks specified by the trace will be accessed regardless of the storage system’sprevious state.
It is natural to replay traces at the level at which the traces were captured.However, replaying file system traces at the system-call level makes it impos-sible to replay high I/O-rate traces with the same speed as they were capturedon the same hardware. This is because replaying adds overheads associatedwith system calls (context switches, verifying arguments, copies between userspace and kernel space [Anderson et al. 2004]). VFS-level replaying requireskernel-mode development, but can use the time normally spent on execut-ing system calls to prefetch and schedule future events [Joukov et al. 2005].
ACM Transactions on Storage, Vol. 4, No. 2, Article 5, Publication date: May 2008.

5:34 • A. Traeger et al.
Network-level replaying is popular because it can be done entirely from theuser level. Unfortunately, it is only applicable to network file systems. Driver-level replaying allows one to control the physical data position on the disk, andis often done from user level.
Replay speed is an important consideration, and is subject to some debate.Some believe that the trace should be replayed with the original timings, al-though none of the surveyed papers specified having done so. There are re-playing tools such as Buttress [Anderson et al. 2004] that have been shown tofollow timings accurately. However, with the advent of faster machines, it wouldbe unreasonable to replay an older trace with the same timings. On the otherhand, if the source of the trace was a faster machine, it may not be possible touse the same timings.
There is another school of thought that believes that the trace should beplayed as fast as possible, ignoring the timings. Five of the surveyed papersdid so [Flinn et al. 2003; Tolia et al. 2004; Peterson et al. 2007; Nightingaleand Flinn 2004; Prabhakaran et al. 2005b]. Any trace replay speed will mea-sure something slightly different than the original system’s behavior when thetrace was being captured. However, replaying a trace as fast as possible changesthe behavior more than other speeds do, due to factors such as caching, read-ahead, and interactions with page write-back and other asynchronous eventsin the OS. It assumes an I/O bottleneck, and ignores operation dependencies.
A compromise between using the original timings and ignoring them isto play back the trace with some speedup factor. Three of the surveyed pa-pers [Zhang et al. 2002; Sivathanu et al. 2004b; Weddle et al. 2007] replayedwith both the original timings as well as at increased speeds. By doing so theywere able to observe the effects of increasing the pressure on the system. Al-though this is better than replaying at only one speed, it is not clear whatscaling factors to choose.
We believe that currently the best option is to replay the trace as fast aspossible and report the average operations per sec. However, it is crucial torespect dependencies in file system traces, and not simply run one operationafter the other. For example, TBBT [Zhu et al. 2005a] has one replay modecalled “conservative order” which sends out a request only after all previousoperations have completed, and another called “FS dependency order” whichapplies some file system orderings to the operations (e.g., it will not write to afile before receiving a reply that the file was created).
An ideal way of recreating a traced workload would be to first normalize thethink times using both the hardware- and software (e.g., OS, libraries, relevantprograms) specifications of the system that produced the trace, and then tocalibrate it using specifications of the machine being used to replay the trace.How to do this accurately is still an open question, and the best we can do rightnow is take the results with a degree of skepticism.
However replaying is done, the method should be clearly stated along withthe results. Of the 19 surveyed papers that utilized tracing for performanceanalysis, we found that 15 did not specify the tool used to replay and 11 didnot specify the speed. Not specifying the replay tool hinders the reader fromjudging the accuracy of the replay. For those that did not specify the speed, one
ACM Transactions on Storage, Vol. 4, No. 2, Article 5, Publication date: May 2008.

A Nine Year Study of File System and Storage Benchmarking • 5:35
can guess that traces were replayed as fast as possible since this is commonand easy, but it is still possible that other timings were used.
Trace availability. Researchers may collect traces themselves, request themdirectly from other researchers, or obtain them from some third party thatmakes traces publicly available. Reusing traces, where appropriate, can encour-age comparisons between papers and allow results to be reproduced. However,traces can become unavailable for several reasons, some of which are discussedhere. One surveyed paper [Rowstron and Druschel 2001] used traces that areavailable via FTP, but the company that captures and hosts the traces statesthat they remove traces after seven days. In some cases, those who capturedthe traces have moved on and are unavailable. Additionally, since trace filesare usually very large (traces from HP Labs, which are commonly used, canbe up to 9GB), researchers may not save them for future use. Some traces areeven larger (approximately 1TB, compressed 20–30:1), so even if the authorsstill have the trace, they may insist on transferring it by shipping a physicaldisk. To resolve these types of issues, traces should be stored in centralized,authoritative repositories of traces for all to use. In 2003, the Storage NetworkIndustry Association (SNIA) created a technical working group called IOTTA(I/O traces, tools and analysis) to attack this problem. They have established aworldwide trace repository, with several traces in compatible formats and withall of the necessary tools [SNIA 2007]. There are also two smaller repositorieshosted by universities [LASS 2006; PEL 2001].
Privacy and anonymization is a concern when collecting and distributingtraces, but it should be done while not harming the usability of the traces. Forexample, one could encrypt sensitive fields, each with a different encryption key.Different mappings for each field remove the possibility of correlation betweenrelated fields. For example, UID = 0 and GID = 0 usually occur together intraces, but this cannot be easily inferred from anonymized traces in which thetwo fields have been encrypted using different keys. Keys could be given out inprivate to decrypt certain fields if desired [Aranya et al. 2004]. Although thisdoes not hide all the important information, such as the number of users on thesystem, it should provide enough privacy for most scenarios.
Realism. Whether a trace accurately portrays the intended real-world en-vironment is an important issue to consider. One aspect of this problem is thatof traces becoming stale. For traces whose age we could determine, the aver-age age was 5.7 years, with some as old as 11 years. Studies have shown thatcharacteristics such as file sizes, access patterns, file system size, file types,and directory size distribution have changed over the years [Roselli et al. 2000;Agrawal et al. 2007]. While it is acceptable to use older traces for comparisonsbetween papers, we recommend that researchers include results that use newtraces as well. We hope that new traces will be continuously collected and madeavailable to the public via trace repositories.
Additionally, the trace should ideally be of many users executing similarworkloads (preferably unaware that the trace is being collected so that theirbehavior is not biased). For example, one of the surveyed papers [Adya et al.
ACM Transactions on Storage, Vol. 4, No. 2, Article 5, Publication date: May 2008.

5:36 • A. Traeger et al.
2002] used a one-hour-long trace of one developer as the backbone of their eval-uation. Such a small sample may not accurately represent a whole population.
9. MICROBENCHMARKS
In this section we describe the microbenchmarks used in the surveyed researchpapers, and reflect on their positive qualities, drawbacks, and how appropriatethey were in the context of the papers in which they appeared.
In contrast to the macrobenchmarks described in Section 7, microbenchmarkworkloads usually consist of a small number of types of operations and serveto highlight some specific aspect of the file system.
We discuss Bonnie and Bonnie++, the Sprite benchmarks, ad hoc microbench-marks, as well as using system utilities to create workloads.
9.1 Bonnie and Bonnie++
Bonnie, developed in 1990, performs a series of tests on a single file which is100KB by default [Bray 1996]. For each test, Bonnie reports the number ofbytes processed per elapsed sec. the number of bytes processed per CPU sec.and the percentage of CPU usage (user and system). The tests are as follows.
—Sequential Output. The file is created one character at-a-time, and thenrecreated one 8KB chunk at-a-time. Each chunk is then read, dirtied, andrewritten.
—Sequential Input. The file is read once one character at-a-time, and thenagain one chunk at-a-time.
—Random Seeks. A number of processes seek to random locations in the fileand read a chunk of data. The chunk is modified and rewritten 10% of thetime. The documentation states that the default number of processes is four,but we have checked the source-code and only three are created (this showsthe benefit of having open-source benchmarks). The default number of seeksfor each process is 4,000 and is one of several hard-coded values.
Even though this is a fairly well-known benchmark [Bryant et al. 2001], of allthe papers that we surveyed, only one [Zadok et al. 2001] used it. Care must betaken to ensure that the working file size is larger than the amount of memoryon the system so that not all read requests are satisfied from the page cache.The Bonnie documentation recommends using a file size that is at least 4 timesbigger than the amount of available memory. However, the biggest file size thatwas used in the surveyed research paper was equal to the amount of memoryon the machine. The small number of papers using Bonnie may be due to thethree drawbacks it has, explained next.
First, unlike Postmark (see Section 7.1), Bonnie does not use a single pseu-dorandom number generator for all OSs. This injects some variance betweenbenchmarks run on different OSs, and results may not be comparable.
Second, the options are not parameterized [Bryant et al. 2001]. Of all of thevalues mentioned before, only file size is configurable from the command line;the rest of the values are hard-coded in the program. In addition, Bonnie doesnot allow the workload to be fully customized. A mix of sequential and random
ACM Transactions on Storage, Vol. 4, No. 2, Article 5, Publication date: May 2008.

A Nine Year Study of File System and Storage Benchmarking • 5:37
access is not possible, and the number of writes can never exceed the numberof reads (because a write is done only after a chunk is read and modified).
Third, reading and writing one character at-a-time tests the library callthroughput more than the file system because the function that Bonnie calls(getc) uses buffering.
Bonnie++ [Coker 2001] was created in 2000 and used in one of the surveyedpapers [Peterson et al. 2005]. It differs from Bonnie in three ways. First, it iswritten in C++ rather than C. Second, it uses multiple files to allow accessingdatasets larger than 2GB. Third, it adds several new tests that benchmark theperformance of create, stat, and unlink. Although it adds some useful featuresto Bonnie, Bonnie++ still suffers from the same three drawbacks of Bonnie.
9.2 Sprite LFS
Two microbenchmarks from the 1992 Sprite LFS file system [Rosenblum 1992]are sometimes used in research papers for performance analysis: the large-filebenchmark and the small-file benchmark.
Sprite LFS Large-File Benchmark. Three papers [Mazieres et al. 1999;Wang et al. 2002, 1999] included this benchmark in their performance eval-uation. The benchmark has five phases.
(1) creates a 100MB file using sequential writes;
(2) reads the file sequentially;
(3) writes 100MB randomly to the existing file;
(4) reads 100MB randomly from the file; and
(5) reads the file sequentially.
The most apparent fault with this benchmark is that it uses a fixed-sizefile and therefore does not scale. It also uses the random library routine ratherthan having a built-in pseudorandom number generator (as Postmark does;see Section 7.1), which may make results incomparable across machines withdifferent implementations.
Another of its faults is that the caches are not cleaned between each phase,and so some number of operations in a given phase may be serviced from thecache (the amount would actually depend on the pseudorandom number gener-ator for phases 3 and 4, further emphasizing the need for a common generator).However, two of the papers did specify that caches were cleaned after each writephase. It should be noted that for the random-read phase, the benchmark endsup reading the entire file, and so the latency of this phase depends on the filesystem’s read-ahead algorithm (and the pseudorandom number generator).
One of the good points of the benchmark is that each stage is timed separatelywith a high level of accuracy, and only relevant portions of the code are timed.For example, when performing random writes, it first generates the randomorder (though it uses a poorly designed algorithm which is O(N 2) in the worstcase), and then starts timing the writes.
ACM Transactions on Storage, Vol. 4, No. 2, Article 5, Publication date: May 2008.

5:38 • A. Traeger et al.
Fig. 6. Time taken to execute various versions of the Sprite LFS small-file benchmark. Note thaterror bars are shown, but are small and difficult to see.
Sprite LFS Small-File Benchmark. This benchmark was used in six pa-pers [Wang et al. 2002, 1999; Denehy et al. 2005; Mazieres et al. 1999; Kaminskyet al. 2003; Li et al. 2004]. It has three phases:
(1) creating 10,000 1KB files by creating and opening a file, writing 1KB ofdata, and closing the file;
(2) reading the files; and
(3) deleting the files.
Some papers varied the number of files and their sizes, and two specified thatthe caches were flushed after the write phase. We could not obtain the source-code for this benchmark, so it seems that each author may rewrite it becauseit is so simple. This would make it difficult to compare results across papersbecause the source-code may be different. To show this, we have developed thefollowing five versions of the code.
—LFS-SH1. This is a bash script that creates the files by coping data from/dev/zero using the dd program (with a block size of 1 byte and count of1,024), reads the files using cat, and deletes them with rm.
—LFS-SH2. This version is similar to LFS-SH1, but dd uses a 1,024-byte blocksize, and a count of 1.
—LFS-SH3. This code is the same as LFS-SH1, but uses cp instead of dd tocreate the files.
—LFS-C. This is a C implementation of the code.
—LFS-PL. This is a Perl code implementation.
The source-code for all five versions is available at www.fsl.cs.sunysb.edu/project-fsbench.html. The results, shown in Figure 6, clearly demonstratethat different implementations yield significantly different results. The three
ACM Transactions on Storage, Vol. 4, No. 2, Article 5, Publication date: May 2008.

A Nine Year Study of File System and Storage Benchmarking • 5:39
bash script versions are much slower than the others because every operationin the benchmark forks a new process. In addition, all of the implementationsexcept for LFS-SH3 have insignificant wait-time components, showing that filesystem activity is minimal.
9.3 Ad Hoc MicroBenchmarks
Until now, we have been discussing widely available benchmarks in isolation.In contrast, ad hoc benchmarks are written by the authors for in-house use. Inthis section, we describe ad hoc microbenchmarks in the context of the papers inwhich they appear, since the benchmarks alone are usually not very interesting.62 of the 106 surveyed research papers used ad hoc microbenchmarks for atleast one of their experiments (191 total ad hoc microbenchmarks).
These benchmarks all have a general drawback. Because they are not madeavailable to other researchers, they are not reproducible. Even if they are de-scribed in detail (which is usually not the case), another implementation willcertainly differ (see Section 9.2 for experimental evidence). In addition, sincethese benchmarks are not widely used, they are not tested as much as widelyavailable benchmarks, and therefore are more prone to bugs. One good aspectwe have noticed about these benchmarks is that usually some reasoning behindthe benchmark is described.
Because microbenchmarks test the performance of a file system under veryspecific circumstances, they should not be used alone to describe general per-formance characteristics. The only exception to this rule is if a minor change ismade in some code and there is a clear explanation as to why no other executionpaths are affected.
We have identified three reasonable ways of using microbenchmarks. Thefirst acceptable way of using ad hoc microbenchmarks is for the purpose ofbetter understanding the results of other benchmarks. For example, one pa-per [Ng et al. 2002] measured the throughput of reads and writes for sequential-,random-, and identical-block access for this purpose. Because the results arenot meant to be compared across papers, the reproducibility is no longer muchof an issue. Sequential access may show the best case because of its short disk-head seeks and predictable nature, a domain where read-ahead and prefetch-ing shine. The random-read microbenchmark is generally used to measure readthroughput in a scenario where there is no observable access pattern and disk-head seeks are common. This type of behavior has been observed in databaseworkloads. The random aspect of the benchmark inherently inhibits its re-producibility across machines, as discussed in Section 7.1. Since the aforesaidpaper involved network storage, repeatedly reading from the same block gives atime for issuing a request over the network that results in a cache hit. The rea-son for writing to the same block, however, was not explained. Nevertheless,using ad hoc microbenchmarks to explain other results is a good technique.Another paper [Fu et al. 2000] used the read phases of LFS benchmarks toexamine performance bottlenecks.
A second method for using these benchmarks is to employ several ad hoc mi-crobenchmarks to analyze the performance of a variety of operations, as eight
ACM Transactions on Storage, Vol. 4, No. 2, Article 5, Publication date: May 2008.

5:40 • A. Traeger et al.
papers did. This can provide a sense of how the system would perform com-pared to some baseline for commonly used operations, and may allow readersto estimate the overheads for other workloads.
The third way to acceptably use the microbenchmark is in order to isolatea specific aspect of the system. For example, a tracing file system used anad hoc microbenchmark to exercise the file system by producing large tracesthat general-purpose benchmarks such as Postmark could not produce, therebyshowing worst-case performance [Aranya et al. 2004]. Another used a simplesequential-read benchmark to illustrate different RPC behaviors [Magoutiset al. 2003]. Others used ad hoc microbenchmarks to show how the systembehaves under specific conditions. Most of these papers focused on the read-,write-, and stat operations, varying the access patterns, number of threads,and number of files. However, most did not use the microbenchmarks to showworst-case behavior.
In addition, ad hoc microbenchmarks can be used in the initial phases ofbenchmarking to explore the behavior of a system. This can provide usefuldata about code that requires optimization, or to make decisions about whatadditional benchmarks would most effectively show the system’s behavior.
9.4 System Utilities
Some papers use standard utilities to create workloads instead of creating work-loads from scratch, as discussed in Section 9.3. Some examples of benchmarksof this type that were used in the surveyed papers are next provided.
—wc [Van Meter and Gao 2000] and grep [Van Meter and Gao 2000; Fraser andChang 2003] sequentially read from one or more files.
—cp [Zadok et al. 2001; Padioleau and Ridoux 2003; Schindler et al. 2002;Santry et al. 1999; Muniswamy-Reddy et al. 2004] sequentially reads fromone file while copying to another.
—diff [Schindler et al. 2002] sequentially reads two files and compares them.
—tar [Lee et al. 1999; Anderson et al. 2000] and gzip [DeBergalis et al. 2003]sequentially read from a file and append to a set of files while consumingCPU.
Using these utilities is slightly better than creating ad hoc benchmarks be-cause the former are widely available and there is no misunderstanding aboutwhat the benchmark does. However, none of the papers specified what versionthe authors were using, which could lead to some (possibly minor) changesin workloads; for example, different versions of grep use different I/O strate-gies. However, researchers can easily specify their tool version and thus elim-inate all ambiguity. Nonetheless, an important flaw in using these utilities isthat the benchmarks do not scale, and depend on input files which are notstandardized.
10. CONFIGURABLE WORKLOAD GENERATORS
Configurable workload generators generally have lower flexibility when com-pared to creating custom benchmarks, but they require less setup time and are
ACM Transactions on Storage, Vol. 4, No. 2, Article 5, Publication date: May 2008.

A Nine Year Study of File System and Storage Benchmarking • 5:41
usually more reproducible. In addition, since they are more widely used andestablished than ad hoc benchmarks, it is likely that they contain fewer bugs.We discuss some of the more popular generators here.
Iometer. This workload generator and measurement tool was developed byIntel in 1998 and originally developed for Windows [OSDL 2004]. Iometer wasgiven to the Open-Source Development Lab in 2001, which open-sourced andported it to other OSs. The authors claim that it can be configured to emulatethe disk or network I/O load of any program or benchmark, and that it canbe used to generate entirely synthetic I/O loads. It can generate and measureloads on single- or multiple (networked) systems. Iometer can be used for mea-surement and characterization of disk- and network controller performance,bus latency and bandwidth, network throughput to attached drives, shared-bus performance, and hard drive- and network performance.
The parameters for configuring tests include the following: the runtime, theamount of time to run the benchmark before collecting statistics (useful for en-suring that the system is in a “steady state”), the number of threads; number oftargets (i.e., disks or network interfaces), number of outstanding I/O operations,and the workload to run.
The parameters for a thread’s workload include: the percent of transfersof a given size, the ratio of reads-to-writes, the ratio of random-to-sequentialaccesses, number of transfers in a burst, time to wait between bursts, the align-ment of each I/O on the disk, and the size of the reply (if any) to each I/O request.The test also includes a large selection of metrics to use when displaying results,and can save and load configuration files.
Iometer has four qualities not found in many other benchmarks. First, itscales well, since the user gives as input the amount of time the test shouldrun, rather than the amount of work to be performed. Second, allowing thesystem to reach steady state is a good practice, although it may be more usefulto find this point by statistical methods rather than by trusting the user toinput a correct time. Third, it allows for easily distributing and publicizing theconfiguration files by saving them so that benchmarks can be run with exactlythe same workloads. Although researchers can publicize parameters for otherbenchmarks, there is no standard format so some parameters are bound to beleft unreported. Fourth, having a suite that runs multiple tests with varyingparameters saves time and reduces errors. However, there are tools such asAuto-pilot [Wright et al. 2005] that can automate benchmarks with greatercontrol (e.g., the machine can reboot automatically between runs, run helperscripts, etc.).
A drawback of Iometer is that it does not leave enough room for customiza-tion. Although it can recreate most commonly used workloads, hard-coding thepossibilities for workload specification- and performance metrics reduces itsflexibility. For example, the percentage of random reads is not sufficient to de-scribe all read patterns. One read pattern suggested for testing read-ahead isreading blocks from a file in the following patterns: 1, 51, 101, . . . ; 1, 2, 51, 52,101, 102, . . . ; 1, 2, 3, 51, 52, 53, 101, 102, 103, . . . [Tang 1995]. Such patternscannot be recreated with Iometer.
ACM Transactions on Storage, Vol. 4, No. 2, Article 5, Publication date: May 2008.

5:42 • A. Traeger et al.
Surprisingly, even though Iometer has many useful features, only two papersused it [Sarkar et al. 2003; Yu et al. 2000]. This may be because Iometer wasunable to generate the desired workload, as described earlier. However, mostworkloads are fairly straightforward, so this is less of a factor. More likely,researchers simply may not know about or be familiar with it. This may bewhy researchers prefer to write their own microbenchmarks rather than usinga workload generator. Furthermore, it does not seem that the ability to saveconfiguration files improved the reporting of workloads in the research papersthat used Iometer (neither paper fully described their microbenchmarks).
Buttress. The goal of Buttress is to issue I/O requests with a high accu-racy, even when high throughputs are requested [Anderson et al. 2004]. This isimportant for Buttress’s trace replay capability, as well for obtaining accurateinter-I/O times for its workload generation capability. Accurate I/O issuing isnot present in most benchmarks, and the authors show how important this isto have. The Buttress toolkit issues read- and write requests close to their in-tended issue time, can achieve close to the maximum possible throughput, andcan replay I/O traces as well as generate synthetic I/O patterns. Several inter-esting techniques were employed to ensure these properties. In addition, thetoolkit is flexible (unlike Iometer) because users can specify their own work-loads using a simple event-based programming interface. However, this alsomakes it more difficult to reproduce benchmarks from other papers (it is easierto specify simple parameters, as with Iometer). Two of the surveyed researchpapers, both from HP Labs, have used this toolkit [Lumb et al. 2003; Lu et al.2002]. Unfortunately, Buttress is only available by special request from HP.
FileBench. This workload generator from Sun Microsystems [McDougalland Mauro 2005] is configured using a scripting language. FileBench includesscripts that can generate application-emulating or microbenchmark workloads,and users may write their own scripts for custom benchmarks. The applicationworkloads it currently emulates consist of an NFS mail server (similar to Post-mark; see Section 7.1), a file server (similar to SPEC SFS; see Section 7.5), adatabase server, a Web server, and a Web proxy.
FileBench also generates several microbenchmark workloads, some of whichare similar to Bonnie (see Section 9.1) or the copy phase of the Andrew bench-mark (see Section 7.3). In addition to the workloads that come with FileBench,it has several useful features: (1) workload scripts that can easily be reusedand published, (2) the ability to choose between multiple threads or processes,(3) microsec. accurate latency- and cycle counts per system call, (4) thread syn-chronization, (5) warm-up and cool-down phases to measure steady-state activ-ity, (6) configurable directory structures, and (7) database emulation features(e.g., semaphores, synchronous I/O, etc.).
Only one of the surveyed papers [Gulati et al. 2007] used FileBench, possiblybecause Filebench was made publicly available only in 2005 on Solaris, thougha Linux port was created soon after. However, it is highly configurable, andit is possible that researchers will be able to use it for running many of theirbenchmarks.
ACM Transactions on Storage, Vol. 4, No. 2, Article 5, Publication date: May 2008.

A Nine Year Study of File System and Storage Benchmarking • 5:43
Fstress. This workload generator has similar parameters to other genera-tors [Andrerson 2002]. One can specify the following: the distributions for file,directory, and symlink counts, the maximum directory-tree depth, popularityin accesses for newly created objects, and file sizes, operation mixes, I/O sizes,and load levels. Like SPEC SFS (see Section 7.5), it only runs over NFSv3,and constructs packets directly rather than relying on a client implementa-tion. However, NFSv3 is currently being replaced by NFSv4, so supporting thisprotocol would be necessary to ensure relevance. Like Iometer, it has limitedworkload configuration parameters. Another drawback is that requests are sentat a steady rate, so bursty I/O patterns cannot be simulated. Fstress was notused in any of the surveyed papers.
11. BENCHMARKING AUTOMATION
Proper benchmarking is an iterative process. In our experience, there are fourprimary reasons for this. First, when running a benchmark against a givenconfiguration, one must run each test a sufficient number of times to gain con-fidence that the results are accurate. Second, most software does not exist in avacuum; there is at least one other related system or a system that serves as abaseline for comparison. In addition to one’s own system, one must benchmarkthe other systems and compare one’s own system performance to those. Third,benchmarks often expose bugs or inefficiencies in one’s code, which requireschanges. After fixing these bugs (or simply adding new features), one must re-run the benchmarks. Fourth, after doing a fair number of benchmarks, you in-evitably run into unexpected, anomalous, or just interesting results. To explainthese results, one often needs to change configuration parameters or measureadditional quantities, necessitating additional iterations of one’s benchmark.Therefore, it is natural to automate the benchmarking process from start tofinish.
Auto-pilot [Wright et al. 2005] is a suite of tools that we developed for pro-ducing accurate and informative benchmark results. We have used Auto-pilotfor over five years on dozens of projects. As every project is slightly different,we continuously enhanced Auto-pilot and increased its flexibility for each. Theresult is a stable and mature package that saves days and weeks of repetitivelabor on each project. Auto-pilot consists of four major components: a tool toexecute a set of benchmarks described by a simple configuration language, acollection of sample shell scripts for file system benchmarking, a data extrac-tion and analysis tool, and a graphing tool. The analysis tool can perform all ofthe statistical tests that we described in Section 3.
12. EXPERIMENTAL EVALUATIONS
In this section we describe the methods we used to benchmark file systems toshow some of their qualities. Our goal is to demonstrate some of the commonpitfalls of file system benchmarks. We describe the file system that we usedfor the benchmarks and show some of the faults that exist in commonly usedbenchmarks.
ACM Transactions on Storage, Vol. 4, No. 2, Article 5, Publication date: May 2008.

5:44 • A. Traeger et al.
12.1 Slowfs
To reveal some characteristics of various benchmarks, we have modified theext2 file system to slow down certain operations. In the remainder of this article,we call this modified ext2 file system Slowfs. Rather than calling the normalfunction for an operation, we call a new function which does the following.
(1) start = getcc() [get current time in CPU cycles];
(2) calls the original function for the operation;
(3) now = getcc();
(4) goal = now + ((now − start) * 2N ) − (now − start); and
(5) while (getcc() ≤ goal) { schedule() }.
The net effect of this is a slowdown of a factor of 2N for the operation. Theoperations to slowdown and N are given as mount-time parameters. For thisarticle we slowed down the following operations.
—Read. Reads data from the disk.
—Prepare Write and Commit Write. These operations are used by the file systemto write data to disk for the write system call. We refer to these operationscollectively as WRITE for the remainder of the article.
—Lookup. Takes a directory and a file name, and returns an in-memory inode.
If no operation was slowed down, we call it EXT2. If all of the aforesaid operationswere slowed down we call it ALL. We experimented with the preceding threefunctions because they are among the most common found in benchmarks. Notethat this type of slowdown exercises the CPU and not I/O, and that a slowdownof a certain factor is as seen inside the file system, not by the user (the amountof overhead as seen by the user varies with each benchmark). For example,heavy use of the CPU can be found in file systems that perform encryption,compression, or checksumming for integrity or duplicate elimination.
The source-code for Slowfs is available at www.fsl.cs.sunysb.edu/project-fsbench.html.
12.2 Hiding Overheads
In this section we use Slowfs to prove some of the claims we have made in thisarticle.
Compile benchmarks. In our first experiment, we compared Slowfs and ext2for configuring and compiling OpenSSH versions 3.5, 3.7, and 3.9. We usedSlowfs with the read operation slowed down by several factors. The results areshown in Figure 7. Only the results for versions 3.5 and 3.7 are shown becausethey showed the highest overheads. We chose to slow down the read operationbecause, as shown in Section 7.2, it is the most time-consuming operation forthis benchmark. Because a compile benchmark is CPU intensive, such extraor-dinary overheads as a factor of 32 on read can go unnoticed (the factor of 32comes from setting N to 5, as described in Section 12.1). For all of these graphs,the half-widths were less than 1.5% of the mean, and the CPU% was always
ACM Transactions on Storage, Vol. 4, No. 2, Article 5, Publication date: May 2008.

A Nine Year Study of File System and Storage Benchmarking • 5:45
Fig. 7. Time taken to configure and compile OpenSSH versions 3.5 and 3.7 on ext2 and on Slowfswith the read operation slowed down by several factors. Note the different scales for the y-axes.The half-widths were always less than 1.5% of the mean.
more than 99.2%, where CPU% =timeuser + timesystem
timeelapsed× 100. In the following dis-
cussion, we do not include user or I/O times because they were always eitherstatistically indistinguishable or very close (these two values were not affectedby the Slowfs modifications).
For the configure phase, the highest overhead was 2.7% for elapsed time,and 10.1% for system time (both for version 3.7). For the compile phase, thehighest overhead was 4.5% for elapsed time and 59.2% for system time (bothfor version 3.5). Although 59.2% is a noticeable overhead, this can be hidden byonly reporting the elapsed time overhead.
We also conducted the same compile benchmarks with slowing down each ofthe operations listed in Section 12.1 by only a factor of five. We slowed themdown both separately as well as together. There was no statistical differencebetween ext2 and any of these slowed down configurations.
These results clearly show that even with extraordinary delays in critical filesystem operations, compile benchmarks show only marginal overheads becausethey are bound by CPU time spent in user space. As mentioned in Section 7.3,the deficiencies in compile benchmarks apply to the Andrew benchmark as well.
ACM Transactions on Storage, Vol. 4, No. 2, Article 5, Publication date: May 2008.

5:46 • A. Traeger et al.
Table IV. Postmark Configurations Used in Our Slowfs Experiments
PARAMETER FSL CVFS CVFS-LARGE
Number of Files 20,000 5,000 5,000Number of Subdirectories 200 50 50File Sizes 512 bytes–10KB 512 bytes–10KB 512–328,072 bytesNumber of Transactions 200,000 20,000 20,000Operation Ratios equal equal equalRead Size 4KB 4KB 4KBWrite Size 4KB 4KB 4KBBuffered I/O no no no
Fig. 8. Time taken to execute the Postmark benchmark with several configurations while slowingdown various file system operations using Slowfs. Note the different scales for the y-axes.
Postmark. We tested Slowfs with three different Postmark configurations(described in Table IV). The FSL configuration is the one we have been using inour laboratory [Aranya et al. 2004; Wright et al. 2003a], the CVFS configurationis from the CVFS research paper [Soules et al. 2003], and CVFS-LARGE issimilar to the CVFS configuration, but we used the median size of a mailboxon our campus’s large mail server for the file size. We have used a similarconfiguration before [Muniswamy-Reddy et al. 2004], but in these experimentswe updated the file size. We used Postmark version 1.5, and used Slowfs to slowdown each of the operations separately, as well as together, by a factor of four.The results are shown in Figure 8.
ACM Transactions on Storage, Vol. 4, No. 2, Article 5, Publication date: May 2008.

A Nine Year Study of File System and Storage Benchmarking • 5:47
The graphs show us two important features of this benchmark. First, if welook at the EXT2 bar in each graph, we can see how much changing the configu-rations can affect the results. The three are very different, and clearly incom-parable (FSL takes over 55 times longer than CVFS, and CVFS-LARGE is stillalmost twice as long as FSL). Second, we can see that different configurationsshow the effects of Slowfs in varying degrees.
For example, slowing down the reads yields an elapsed time overhead of3.6% for FSL (16.7% system time), 14.1% for CVFS (19.4% system time), and116% for CVFS-LARGE (2,055% system time) over ext2 (EXT2). We can seethat in the CVFS configuration, there is no wait time on the graph. This isbecause the configuration was so small that the benchmark finished before theflushing daemon could write to the disk. CVFS has larger overheads than FSLbecause writes are a smaller component of the benchmark, and so reads becomea larger component. CVFS-LARGE has higher overheads than the other twoconfigurations because it has much larger files, and so there is more data to beread. Similarly, when all operations are slowed down (ALL), there is an elapsedtime overhead of 12.3% for FSL (85.6% system time), 65.8% for CVFS (83.5%system time), and 183% for CVFS-LARGE (3,177% system time).
Depending on the characteristics of the file system being tested, it is pos-sible to choose a configuration that will yield low overheads. Even so, we seethat Postmark sufficiently exercises the file system and shows us meaningfuloverheads, so long as the workload is large enough to produce I/O (i.e., the work-ing set is larger than available memory and the benchmark runs for enoughtime). This is in contrast to the compile benchmarks, which barely show anyoverheads.
13. CONCLUSIONS
We have examined a range of file system and storage benchmarks and de-scribed their positive and negative qualities, with the hope of furthering theunderstanding of how to choose appropriate benchmarks for performance eval-uations. We have done this by surveying 106 file-system and storage-related re-search papers from a selection of recent conferences and by conducting our ownexperiments. We also provided recommendations for how benchmarks shouldpreferably be run and how results might be presented. This advice was sum-marized in our suggested guidelines (see Section 3).
We recommend that with the current set of available benchmarks, an ac-curate method of conveying a file or storage system’s performance is by usingat least one macrobenchmark or trace, as well as several microbenchmarks.Macrobenchmarks and traces are intended to give an overall idea of how thesystem might perform under some workload. If traces are used, then specialcare should be taken with regard to how they are captured and replayed, andhow closely they resemble the intended real-world workload. In addition, mi-crobenchmarks can be used to help understand the system’s performance, totest multiple operations to provide a sense of overall performance, or to high-light interesting features about the system (such as cases where it performsparticularly well or poor).
ACM Transactions on Storage, Vol. 4, No. 2, Article 5, Publication date: May 2008.

5:48 • A. Traeger et al.
Performance evaluations should improve the descriptions of what the au-thors did, as well as why they did it, which is equally important. Explainingthe reasoning behind one’s actions is an important principle in research, butis not being followed consistently in the fields of file system and storage per-formance evaluations. Ideally, there should be some analysis of the system’sexpected behavior, and various benchmarks either proving or disproving thesehypotheses. Such analysis may offer more insight into a behavior than just agraph or table.
We believe that the current state of performance evaluations, as seen in thesurveyed research papers, has much room for improvement. Computer scienceis still a relatively young field, and the experimental evaluations need to movefurther in the direction of precise science. One part of the solution is that stan-dards clearly need to be raised and defined. This will have to be done both byreviewers putting more emphasis on a system’s evaluation, and by researchersconducting experiments. Another part of the solution is that this informationneeds to be better disseminated to all. We hope that this article, as well as ourcontinuing work, will help researchers and others to understand the problemsthat exist with file and storage system benchmarking. The final aspect of thesolution to this problem is creating standardized benchmarks, or benchmarkingsuites, based on open discussion among file system and storage researchers.
We believe that future storage research can help alleviate the situation byanswering questions such as the following.
(1) How can we accurately portray various real-world workloads?
(2) How can we accurately compare results from benchmarks that were run ondifferent machines and systems and at different times?
To help answer the first question, we need a method of determining howclose two workloads are to each other. To answer the second, we believe thatbenchmark results can be normalized for the machine on which they were run.To standardize benchmarks, we believe that there is a need for a group suchas the SPC to standardize and maintain storage and file system benchmarks,and for such benchmarks to be more widely used by this community. We arecurrently working on some of these problems and there is still much work to bedone, but we hope that with time the situation will improve.
The project Web site (www.fsl.cs.sunysb.edu/project-fsbench.html) containsthe data collected for this survey, our suggestions for proper benchmarkingtechniques, and the source-code and machine configurations that we used inthe experiments throughout the article.
ACKNOWLEDGMENTS
We would like to thank all the people who helped review earlier drafts of thiswork, as well as attendees of the FAST 2005 BoF for their valuable comments.We would also like to thank the members of the File Systems and StorageLaboratory at Stony Brook for their helpful comments and advice.
ACM Transactions on Storage, Vol. 4, No. 2, Article 5, Publication date: May 2008.
A Nine Year Study of File System and Storage Benchmarking • 5:49
REFERENCES
Notes: Entries marked with asterisks are papers that were included in the survey.
∗ABD-EL-MALEK, M., II, W. V. C., CRANOR, C., GANGER, G., HENDRICKS, J., KLOSTERMAN, A. J., MESNIER,M., PRASAD, M., SALMON, B., SAMBASIVAN, R. R., SINNAMOHIDEEN, S., STRUNK, J. D., THERESKA, E.,WACHS, M., AND WYLIE, J. J. 2005. Ursa Minor: Versatile cluster-based storage. In Proceedings
of the 4th USENIX Conference on File and Storage Technologies, San Francisco, CA, 59–72.∗ADYA, A., BOLOSKY, W. J., CASTRO, M., CERMAK, G., CHAIKEN, R., DOUCEUR, J. R., HOWELL, J., LORCH, J. R.,
THEIMER, M., AND WATTENHOFER, R. P. 2002. FARSITE: Federated, available, and reliable storagefor an incompletely trusted environment. In Proceedings of the 5th Symposium on Operating
System Design and Implementation, Boston, MA, 1–14.AGRAWAL, N., BOLOSKY, W. J., DOUCEUR, J. R., AND LORCH, J. R. 2007. A five-year study of file-system
metadata. In Proceedings of the 5th USENIX Conference on File and Storage Technologies, SanJose, CA, 31–45.
∗AGUILERA, M. K., JI, M., LILLIBRIDGE, M., MACCORMICK, J., OERTLI, E., ANDERSEN, D., BURROWS, M.,MANN, T., AND THEKKATH, C. A. 2003. Block-Level security for network-attached disks. In Pro-
ceedings of the 2nd USENIX Conference on File and Storage Technologies, San Francisco, CA,159–174.
AKKERMAN, W. 2002. Strace software home page. www.liacs.nl/~wichert/strace/.∗ANDERSON, D. C., CHASE, J. S., AND VAHDAT, A. M. 2000. Interposed request routing for scalable
network storage. In Proceedings of the 4th USENIX Symposium on Operating System Design and
Implementation, San Diego, CA, 259–272.∗ANDERSON, E., HOBBS, M., KEETON, K., SPENCE, S., UYSAL, M., AND VEITCH, A. 2002. Hippodrome:
Running circles around storage administration. In Proceedings of the 1st USENIX Conference on
File and Storage Technologies, Monterey, CA, 175–188.∗ANDERSON, E., KALLAHALLA, M., UYSAL, M., AND SWAMINATHAN, R. 2004. Buttress: A toolkit for
flexible and high fidelity I/O benchmarking. In Proceedings of the 3rd USENIX Conference on
File and Storage Technologies, San Francisco, CA, 45–58.ANDRERSON, D. 2002. Fstress: A flexible network file service benchmark. Tech. Rep. TR-2001-
2002, Duke University. May.∗ARANYA, A., WRIGHT, C. P., AND ZADOK, E. 2004. Tracefs: A file system to trace them all. In Pro-
ceedings of the 3rd USENIX Conference on File and Storage Technologies, San Francisco, CA,129–143.
∗ARPACI-DUSSEAU, A. C., ARPACI-DUSSEAU, R. H., BURNETT, N. C., DENEHY, T. E., ENGLE, T. J., GUNAWI,H. S., NUGENT, J. A., AND POPOVICI, F. I. 2003. Transforming policies into mechanisms withInfokernel. In Proceedings of the 19th ACM Symposium on Operating Systems Principles (ACM
SIGOPS), Bolton Landing, NY, 90–105.BLAZE, M. 1992. NFS tracing by passive network monitoring. In Proceedings of the USENIX
Winter Conference, San Francisco, CA.BRAY, T. 1996. Bonnie home page. www.textuality.com/bonnie.BRYANT, R., FORESTER, R., AND HAWKES, J. 2002. Filesystem performance and scalability in Linux
2.4.17. In Proceedings of the Annual USENIX Technical Conference, FREENIX Track, Monterey,CA, 259–274.
BRYANT, R., RADDATZ, D., AND SUNSHINE, R. 2001. PenguinoMeter: A new file-I/O benchmark forLinux. In Proceedings of the 5th Annual Linux Showcase and Conference, Oakland, CA, 5–10.
CHEN, P. M. AND PATTERSON, D. A. 1993. A new approach to I/O performance evaluation—Self-Scaling I/O benchmarks, predicted I/O performance. In Proceedings of the ACM SIGMETRICS
International Conference on Measurement and Modeling of Computer Systems (ACM SIGOPS),Seattle, WA, 1–12.
∗CIPAR, J., CORNER, M. D., AND BERGER, E. D. 2007. TFS: A transparent file system for contributorystorage. In Proceedings of the 5th USENIX Conference on File and Storage Technologies, San Jose,CA, 215–229.
COKER, R. 2001. Bonnie++ home page. www.coker.com.au/bonnie++.∗CORBETT, P., ENGLISH, B., GOEL, A., GRCANAC, T., KLEIMAN, S., LEONG, J., AND SANKAR, S. 2004. Row-
Diagonal parity for double disk failure correction. In Proceedings of the 3rd USENIX Conference
on File and Storage Technologies, San Francisco, CA, 1–14.
ACM Transactions on Storage, Vol. 4, No. 2, Article 5, Publication date: May 2008.

5:50 • A. Traeger et al.
∗DABEK, F., KAASHOEK, M. F., KARGER, D., AND MORRIS, R. 2001. Wide-Area cooperative storagewith CFS. In Proceedings of the 18th ACM Symposium on Operating Systems Principles, Banff,Canada.
∗DEBERGALIS, M., CORBETT, P., KLEIMAN, S., LENT, A., NOVECK, D., TALPEY, T., AND WITTLE, M. 2003.The direct access file system. In Proceedings of the 2nd USENIX Conference on File and Storage
Technologies, San Francisco, CA, 175–188.∗DENEHY, T. E., ARPACI-DUSSEAU, A. C., AND ARPACI-DUSSEAU, R. H. 2002. Bridging the information
gap in storage protocol stacks. In Proceedings of the Annual USENIX Technical Conference,Monterey, CA, 177–190.
∗DENEHY, T. E., ARPACI-DUSSEAU, A. C., AND ARPACI-DUSSEAU, R. H. 2005. Journal-guided resynchro-nization for software RAID. In Proceedings of the 4th USENIX Conference on File and Storage
Technologies, San Francisco, CA, 87–100.∗DIMITRIJEVIC, Z., RANGASWAMI, R., AND CHANG, E. 2003. Design and implementation of semi-
preemptible IO. In Proceedings of the 2nd USENIX Conference on File and Storage Technologies,San Francisco, CA, 145–158.
∗EISLER, M., CORBETT, P., KAZAR, M., NYDICK, D. S., AND WAGNER, J. C. 2007. Data ONTAP GX:A scalable storage cluster. In Proceedings of the 5th USENIX Conference on File and Storage
Technologies, San Jose, CA, 139–152.ELLARD, D., LEDLIE, J., MALKANI, P., AND SELTZER, M. 2003. Passive NFS tracing of email and
research workloads. In Proceedings of the 2nd USENIX Conference on File and Storage Tech-
nologies, San Francisco, CA.ELLARD, D. AND SELTZER, M. 2003a. New NFS tracing tools and techniques for system analysis. In
Proceedings of the Annual USENIX Conference on Large Installation Systems Administration,San Diego, CA.
ELLARD, D. AND SELTZER, M. 2003b. NFS tricks and benchmarking traps. In Proceedings of the
Annual USENIX Technical Conference, FREENIX Track, San Antonio, TX, 101–114.∗FLINN, J., SINNAMOHIDEEN, S., TOLIA, N., AND SATYANARYANAN, M. 2003. Data staging on untrusted
surrogates. In Proceedings of the 2nd USENIX Conference on File and Storage Technologies, SanFrancisco, CA, 15–28.
∗FRASER, K. AND CHANG, F. 2003. Operating system I/O speculation: How two invocations arefaster than one. In Proceedings of the Annual USENIX Technical Conference. San Antonio, TX,325–338.
∗FU, K., KAASHOEK, M. F., AND MAZIERES, D. 2000. Fast and secure distributed read-only file system.In Proceedings of the 4th USENIX Symposium on Operating System Design and Implementation,San Diego, CA, 181–196.
∗GHEMAWAT, S., GOBIOFF, H., AND LEUNG, S. T. 2003. The Google file system. In Proceedings of the
19th ACM Symposium on Operating Systems Principles. (ACM SIGOPS), Bolton Landing, NY,29–43.
∗GNIADY, C., BUTT, A. R., AND HU, Y. C. 2004. Program-Counter-Based pattern classification inbuffer caching. In Proceedings of the 6th Symposium on Operating Systems Design and Imple-
mentation (ACM SIGOPS), San Francisco, CA, 395–408.∗GOPAL, B. AND MANBER, U. 1999. Integrating content-based access mechanisms with hierarchical
file systems. In Proceedings of the 3rd Symposium on Operating Systems Design and Implemen-
tation. (ACM SIGOPS), New Orleans, LA, 265–278.∗GRONVALL, B., WESTERLUND, A., AND PINK, S. 1999. The design of a multicast-based distributed file
system. In Proceedings of the 3rd Symposium on Operating Systems Design and Implementation
(ACM SIGOPS), New Orleans, LA, 251–264.∗GULATI, A., NAIK, M., AND TEWARI, R. 2007. Nache: Design and implementation of a caching proxy
for nfsv4. In Proceedings of the 5th USENIX Conference on File and Storage Technologies, SanJose, CA, 199–214.
∗HOWARD, J. H., KAZAR, M. L., MENEES, S. G., NICHOLS, D. A., SATYANARAYANAN, M., SIDEBOTHAM, R. N.,AND WEST, M. J. 1988. Scale and performance in a distributed file system. ACM Trans. Comput.
Syst. 6, 1 (Feb.), 51–81.∗HUANG, H., HUNG, W., AND SHIN, K. 2005. FS2: Dynamic data replication in free disk space for im-
proving disk performance and energy consumption. In Proceedings of the 20th ACM Symposium
on Operating Systems Principles, Brighton, UK, 263–276.
ACM Transactions on Storage, Vol. 4, No. 2, Article 5, Publication date: May 2008.

A Nine Year Study of File System and Storage Benchmarking • 5:51
HUANG, L. AND CHIUEH, T. 2001. Charm: An I/O-driven execution strategy for high-performancetransaction processing. In Proceedings of the Annual USENIX Technical Conference, Boston, MA,275–288.
∗JOGLEKAR, A., KOUNAVIS, M. E., AND BERRY, F. L. 2005. A scalable and high performance soft-ware iSCSI implementation. In Proceedings of the 4th USENIX Conference on File and Storage
Technologies, San Francisco, CA, 267–280.JOUKOV, N., TRAEGER, A., IYER, R., WRIGHT, C. P., AND ZADOK, E. 2006. Operating system profiling
via latency analysis. In Proceedings of the 7th Symposium on Operating Systems Design and
Implementation (ACM SIGOPS), Seattle, WA, 89–102.∗JOUKOV, N., WONG, T., AND ZADOK, E. 2005. Accurate and efficient replaying of file system traces.
In Proceedings of the 4th USENIX Conference on File and Storage Technologies, San Francisco,CA, 337–350.
∗KALLAHALLA, M., RIEDEL, E., SWAMINATHAN, R., WANG, Q., AND FU, K. 2003. Plutus: Scalable securefile sharing on untrusted storage. In Proceedings of the 2nd USENIX Conference on File and
Storage Technologies, San Francisco, CA, 29–42.KAMINSKY, M., SAVVIDES, G., MAZIERES, D., AND KAASHOEK, M. F. 2003. Decentralized user authenti-
cation in a global file system. In Proceedings of the 19th ACM Symposium on Operating Systems
Principles (ACM SIGOPS), Bolton Landing, NY.KATCHER, J. 1997. PostMark: A new filesystem benchmark. Tech. Rep. TR3022, Network Appli-
ance. www.netapp.com/tech_library/3022.html.∗KIM, J. M., CHOI, J., KIM, J., NOH, S. H., MIN, S. L., CHO, Y., AND KIM, C. S. 2000. A low-overhead,
high-performance unified buffer management scheme that exploits sequential and looping ref-erences. In Proceedings of the 4th USENIX Symposium on Operating System Design and Imple-
mentation, San Diego, CA, 119–134.∗KIM, M., COX, L., AND NOBLE, B. 2002. Safety, visibility, and performance in a wide-area file
system. In Proceedings of the 1st USENIX Conference on File and Storage Technologies. Monterey,CA.
∗KROEGER, T. M. AND LONG, D. D. E. 2001. Design and implementation of a predictive file prefetch-ing algorithm. In Proceedings of the Annual USENIX Technical Conference, Boston, MA, 105–118.
LASS. 2006. UMass trace repository. http://traces.cs.umass.edu.∗LEE, Y., LEUNG, K., AND SATYANARAYANAN, M. 1999. Operation-Based update propagation in a
mobile file system. In Proceedings of the Annual USENIX Technical Conference, Monterey, CA,43–56.
∗LI, J., KROHN, M., MAZIERES, D., AND SHASHA, D. 2004. Secure untrusted data repository (SUNDR).In Proceedings of the 6th Symposium on Operating Systems Design and Implementation, SanFrancisco, CA, 121–136.
∗LU, C., ALVAREZ, G. A., AND WILKES, J. 2002. Aqueduct: Online data migration with performanceguarantees. In Proceedings of the 1st USENIX Conference on File and Storage Technologies,Monterey, CA.
∗LUMB, C. R., MERCHANT, A., AND ALVAREZ, G. A. 2003. Facade: Virtual storage devices with perfor-mance guarantees. In Proceedings of the 2nd USENIX Conference on File and Storage Technolo-
gies, San Francisco, CA, 131–144.∗LUMB, C. R., SCHINDLER, J., AND GANGER, G. R. 2002. Freeblock scheduling outside of disk
firmware. In Proceedings of the 1st USENIX Conference on File and Storage Technologies, Mon-terey, CA, 275–288.
∗MACCORMICK, J., MURPHY, N., NAJORK, M., THEKKATH, C., AND ZHOU, L. 2004. Boxwood: Abstractionsas the foundation for storage infrastructure. In Proceedings of the 6th Symposium on Operating
Systems Design and Implementation, San Francisco, CA, 105–120.∗MAGOUTIS, K., ADDETIA, S., FEDOROVA, A., AND SELTZER, M. I. 2003. Making the most out of direct-
access network attached storage. In Proceedings of the 2nd USENIX Conference on File and
Storage Technologies, San Francisco, CA, 189–202.∗MAGOUTIS, K., ADDETIA, S., FEDOROVA, A., SELTZER, M. I., CHASE, J. S., GALLATIN, A. J., KISLEY, R.,
WICKREMESINGHE, R. G., AND GABBER, E. 2002. Structure and performance of the direct accessfile system. In Proceedings of the Annual USENIX Technical Conference, Monterey, CA.
∗MAZIERES, D. 2001. A toolkit for user-level file systems. In Proceedings of the Annual USENIX
Technical Conference, Boston, MA, 261–274.
ACM Transactions on Storage, Vol. 4, No. 2, Article 5, Publication date: May 2008.

5:52 • A. Traeger et al.
∗MAZIERES, D., KAMINSKY, M., KAASHOEK, M. F., AND WITCHEL, E. 1999. Separating key managementfrom file system security. In Proceedings of the 17th ACM Symposium on Operating Systems
Principles, Charleston, SC, 124–139.MCDOUGALL, R. AND MAURO, J. 2005. FileBench. www.solarisinternals.com/si/tools/
filebench/.∗MEMIK, G., KANDEMIR, M., AND CHOUDHARY, A. 2002. Exploiting inter-file access patterns using
multi-collective I/O. In Proceedings of the 1st USENIX Conference on File and Storage Technolo-
gies, Monterey, CA.MESNIER, M. P., WACHS, M., SAMBASIVAN, R. R., LOPEZ, J., HENDRICKS, J., GANGER, G. R., AND O’HALLARON,
D. 2007. //TRACE: Parallel trace replay with approximate causal events. In Proceedings of the
5th USENIX Conference on File and Storage Technologies, San Jose, CA, 153–167.∗MILLER, E., FREEMAN, W., LONG, D., AND REED, B. 2002. Strong security for network-attached
storage. In Proceedings of the 1st USENIX Conference on File and Storage Technologies, Monterey,CA, 1–13.
MOGUL, J. 1999. Brittle metrics in operating systems research. In Proceedings of the IEEE Work-
shop on Hot Topics in Operating Systems (HOTOS), Rio Rica, AZ, 90–95.MUMMERT, L. AND SATYANARAYANAN, M. 1994. Long term distributed file reference tracing: Imple-
mentation and experience. Tech. Rep. CMU-CS-94-213, Carnegie Mellon University, Pittsburgh,Pennsylvania.
∗MUNISWAMY-REDDY, K., HOLLAND, D. A., BRAUN, U., AND SELTZER, M. 2006. Provenance-Aware stor-age systems. In Proceedings of the Annual USENIX Technical Conference, Boston, MA, 43–56.
∗MUNISWAMY-REDDY, K., WRIGHT, C. P., HIMMER, A., AND ZADOK, E. 2004. A versatile and user-oriented versioning file system. In Proceedings of the 3rd USENIX Conference on File and Storage
Technologies, San Francisco, CA, 115–128.∗MUTHITACHAROEN, A., CHEN, B., AND MAZIERES, D. 2001. A low-bandwidth network file system. In
Proceedings of the 18th ACM Symposium on Operating Systems Principles, Banff, Canada.∗MUTHITACHAROEN, A., MORRIS, R., GIL, T. M., AND CHE, B. 2002. Ivy: A read/write peer-to-peer file
system. In Proceedings of the 5th Symposium on Operating System Design and Implementation,Boston, MA, 31–44.
∗NG, W. T., SUN, H., HILLYER, B., SHRIVER, E., GABBER, E., AND OZDEN, B. 2002. Obtaining highperformance for storage outsourcing. In Proceedings of the 1st USENIX Conference on File and
Storage Technologies, Monterey, CA, 145–158.∗NIGHTINGALE, E. B., CHEN, P., AND FLINN, J. 2005. Speculative execution in a distributed file
system. In Proceedings of the 20th ACM Symposium on Operating Systems Principles, Brighton,UK, 191–205.
∗NIGHTINGALE, E. B. AND FLINN, J. 2004. Energy-Efficiency and storage flexibility in the Blue filesystem. In Proceedings of the 6th Symposium on Operating Systems Design and Implementation,San Francisco, CA, 363–378.
∗NIGHTINGALE, E. B., VEERARAGHAVAN, K., CHEN, P. M., AND FLINN, J. 2006. Rethink the sync. InProceedings of the 7th Symposium on Operating Systems Design and Implementation, Seattle,WA, 1–14.
∗NUGENT, J., ARPACI-DUSSEAU, A., AND ARPACI-DUSSEAU, R. 2003. Controlling your PLACE in the filesystem with gray-box techniques. In Proceedings of the Annual USENIX Technical Conference,San Antonio, TX, 311–323.
OSDL. 2004. Iometer project. www.iometer.org/.OSDL. 2007. Database test suite. www.osdl.org/lab_activities/kernel_testing/osdl_
database_test_suite/.OUSTERHOUT, J. 1990. Why aren’t operating systems getting faster as fast as hardware? In Pro-
ceedings of the Summer USENIX Technical Conference, Anaheim, CA, 247–256.OUSTERHOUT, J., COSTA, H., HARRISON, D., KUNZE, J., KUPFER, M., AND THOMPSON, J. 1985. A trace-
driven analysis of the UNIX 4.2 BSD file system. In Proceedings of the 10th ACM Symposium on
Operating System Principles, Orcas Island, WA, 15–24.∗PADIOLEAU, Y. AND RIDOUX, O. 2003. A logic file system. In Proceedings of the Annual USENIX
Technical Conference, San Antonio, TX, 99–112.∗PAPATHANASIOU, A. E. AND SCOTT, M. L. 2004. Energy efficient prefetching and caching. In Pro-
ceedings of the Annual USENIX Technical Conference, Boston, MA, 255–268.
ACM Transactions on Storage, Vol. 4, No. 2, Article 5, Publication date: May 2008.

A Nine Year Study of File System and Storage Benchmarking • 5:53
∗PATTERSON, H., MANLEY, S., FEDERWISCH, M., HITZ, D., KLEINMAN, S., AND OWARA, S. 2002. SnapMir-ror: File system based asynchronous mirroring for disaster recovery. In Proceedings of the 1st
USENIX Conference on File and Storage Technologies, Monterey, CA, 117–129.∗PEEK, D. AND FLINN, J. 2006. EnsemBlue: Integrating distributed storage and consumer elec-
tronics. In Proceedings of the 7th Symposium on Operating Systems Design and Implementation,Seattle, WA, 219–232.
PEL. 2001. BYU trace distribution center. http://tds.cs.byu.edu/tds.∗PETERSON, Z. N. J., BURNS, R., ATENIESE, G., AND BONO, S. 2007. Design and implementation of
verifiable audit trails for a versioning file system. In Proceedings of the 5th USENIX Conference
on File and Storage Technologies, San Jose, CA, 93–106.∗PETERSON, Z. N. J., BURNS, R., J. HERRING, A. S., AND RUBIN, A. D. 2005. Secure deletion for a
versioning file system. In Proceedings of the 4th USENIX Conference on File and Storage Tech-
nologies, San Francisco, CA, 143–154.∗PRABHAKARAN, V., AGRAWAL, N., BAIRAVASUNDARAM, L. N., GUNAWI, H. S., ARPACI-DUSSEAU, A. C., AND
ARPACI-DUSSEAU, R. H. 2005a. IRON file systems. In Proceedings of the 20th ACM Symposium
on Operating Systems Principles, Brighton, UK, 206–220.∗PRABHAKARAN, V., ARPACI-DUSSEAU, A. C., AND ARPACI-DUSSEA, R. H. 2005b. Analysis and evolution
of journaling file systems. In Proceedings of the Annual USENIX Technical Conference, Anaheim,CA, 105–120.
∗QUINLAN, S. AND DORWARD, S. 2002. Venti: A new approach to archival storage. In Proceedings of
the 1st USENIX Conference on File and Storage Technologies, Monterey, CA, 89–101.∗RADKOV, P., YIN, L., GOYAL, P., SARKAR, P., AND SHENOY, P. 2004. A performance comparison of NFS
and iSCSI for IP-networked storage. In Proceedings of the 3rd USENIX Conference on File and
Storage Technologies, San Francisco, CA, 101–114.∗RHEA, S., EATON, P., GEELS, D., WEATHERSPOON, H., ZHAO, B., AND KUBIATOWICZ, J. 2003. Pond:
The OceanStore prototype. In Proceedings of the 2nd USENIX Conference on File and Storage
Technologies, San Francisco, CA, 1–14.ROBINSON, D. 1999. The advancement of NFS benchmarking: SFS 2.0. In Proceedings of the 13th
USENIX Systems Administration Conference, Seattle, WA, 175–185.ROSELLI, D., LORCH, J. R., AND ANDERSON, T. E. 2000. A comparison of file system workloads. In
Proceedings of the Annual USENIX Technical Conference, San Diego, CA, 41–54.ROSENBLUM, M. 1992. The design and implementation of a log-structured file system. Ph.D. the-
sis, Electrical Engineering and Computer Sciences, Computer Science Division, University ofCalifornia.
∗ROWSTRON, A. AND DRUSCHEL, P. 2001. Storage management and caching in PAST, a large-scale,persistent peer-to-peer storage utility. In Proceedings of the 18th ACM Symposium on Operating
Systems Principles, Banff, Canada.RUEMMLER, C. AND WILKES, J. 1993. UNIX disk access patterns. In Proceedings of the Winter
USENIX Technical Conference, San Diego, CA, 405–420.RUWART, T. M. 2001. File system performance benchmarks, then, now, and tomorrow. In Proceed-
ings of the 14th IEEE Symposium on Mass Storage Systems, San Diego, CA.∗SAITO, Y., KARAMANOLIS, C., KARLSSON, M., AND MAHALINGAM, M. 2002. Taming aggressive repli-
cation in the Pangaea wide-area file system. In Proceedings of the 5th Symposium on Operating
System Design and Implementation, Boston, MA, 15–30.SANDBERG, R., GOLDBERG, D., KLEIMAN, S., WALSH, D., AND LYON, B. 1985. Design and implementation
of the Sun network filesystem. In Proceedings of the Summer USENIX Technical Conference,Portland, Oregon, 119–130.
∗SANTRY, D. S., FEELEY, M. J., HUTCHINSON, N. C., VEITCH, A. C., CARTON, R. W., AND OFIR, J. 1999.Deciding when to forget in the Elephant file system. In Proceedings of the 17th ACM Symposium
on Operating Systems Principles, Charleston, SC, 110–123.∗SARKAR, P., UTTAMCHANDANI, S., AND VORUGANTI, K. 2003. Storage over IP: When does hardware
support help? In Proceedings of the 2nd USENIX Conference on File and Storage Technologies,San Francisco, CA, 231–244.
∗SCHINDLER, J., GRIFFIN, J. L., LUMB, C. R., AND GANGER, G. R. 2002. Track-Aligned extents: Match-ing access patterns to disk drive characteristics. In Proceedings of the 1st USENIX Conference
on File and Storage Technologies, Monterey, CA, 259–274.
ACM Transactions on Storage, Vol. 4, No. 2, Article 5, Publication date: May 2008.

5:54 • A. Traeger et al.
∗SCHINDLER, J., SCHLOSSER, S. W., SHAO, M., AND AILAMAKI, A. 2004. Atropos: A disk array volumemanager for orchestrated use of disks. In Proceedings of the 3rd USENIX Conference on File and
Storage Technologies, San Francisco, CA, 159–172.∗SCHLOSSER, S. W., SCHINDLER, J., PAPADOMANOLAKIS, S., SHAO, M., AILAMAKI, A., FALOUTSOS, C., AND
GANGER, G. R. 2005. On multidimensional data and modern disks. In Proceedings of the 4th
USENIX Conference on File and Storage Technologies, San Francisco, CA, 225–238.SCHMIDT, A., WAAS, F., KERSTEN, M., FLORESCU, D., CAREY, M. J., MANOLESCU, I., AND BUSSE, R. 2001.
Why and how to benchmark XML databases. ACM SIGMOD Rec. 30, 3 (Sept.), 27–32.∗SCHMUCK, F. AND HASKIN, R. 2002. GPFS: A shared-disk file system for large computing clusters.
In Proceedings of the 1st USENIX Conference on File and Storage Technologies, Monterey, CA,231–244.
∗SELTZER, M. I., GANGER, G. R., MCKUSICK, M. K., SMITH, K. A., SOULES, C. A. N., AND STEIN, C. A.2000. Journaling versus soft updates: Asynchronous meta-data protection in file systems. InProceedings of the Annual USENIX Technical Conference, San Diego, CA, 71–84.
SELTZER, M. I., KRINSKY, D., SMITH, K. A., AND ZHANG, X. 1999. The case for application-specificbenchmarking. In Proceedings of the IEEE Workshop on Hot Topics in Operating Systems
(HOTOS), Rio Rica, AZ, 102–107.SHEIN, B., CALLAHAN, M., AND WOODBURY, P. 1989. NFSSTONE: A network file server performance
benchmark. In Proceedings of the Summer USENIX Technical Conference, Baltimore, MD, 269–275.
SHEPLER, S. 2005. NFS version 4. In Proceedings of the Annual USENIX Technical Conference,Anaheim, CA. http://mediacast.sun.com/share/shepler/20050414_usenix_ext.pdf.
∗SHRIRA, L. AND XU, H. 2006. Thresher: An efficient storage manager for copy-on-write snapshots.In Proceedings of the Annual USENIX Technical Conference, Boston, MA, 57–70.
∗SIVATHANU, G., SUNDARARAMAN, S., AND ZADOK, E. 2006. Type-Safe disks. In Proceedings of the 7th
Symposium on Operating Systems Design and Implementation, Seattle, WA, 15–28.∗SIVATHANU, M., BAIRAVASUNDARAM, L. N., ARPACI-DUSSEAU, A. C., AND ARPACI-DUSSEAU, R. H. 2004a.
Life or death at block-level. In Proceedings of the 6th Symposium on Operating Systems Design
and Implementation, San Francisco, CA, 379–394.∗SIVATHANU, M., BAIRAVASUNDARAM, L. N., ARPACI-DUSSEAU, A. C., AND ARPACI-DUSSEAU, R. H. 2005.
Database-Aware semantically-smart storage. In Proceedings of the 4th USENIX Conference on
File and Storage Technologies, San Francisco, CA, 239–252.∗SIVATHANU, M., PRABHAKARAN, V., ARPACI-DUSSEAU, A. C., AND ARPACI-DUSSEAU, R. H. 2004b. Improv-
ing storage system availability with D-GRAID. In Proceedings of the 3rd USENIX Conference on
File and Storage Technologies, San Francisco, CA, 15–30.∗SIVATHANU, M., PRABHAKARAN, V., POPOVICI, F. I., DENEHY, T. E., ARPACI-DUSSEAU, A. C., AND ARPACI-
DUSSEAU, R. H. 2003. Semantically-Smart disk systems. In Proceedings of the 2nd USENIX
Conference on File and Storage Technologies, San Francisco, CA, 73–88.SMALL, C., GHOSH, N., SALEEB, H., SELTZER, M., AND SMITH, K. 1997. Does systems research measure
up? Tech. Rep. TR-16-97, Harvard University. November.SMITH, K. A. AND SELTZER, M. I. 1997. File system aging—Increasing the relevance of file system
benchmarks. In Proceedings of the ACM SIGMETRICS International Conference on Measurement
and Modeling of Computer Systems, Seattle, WA, 203–213.SNIA. 2007. SNIA—Storage network industry association: IOTTA repository. http://iotta.snia.org.
∗SOBTI, S., GARG, N., ZHANG, C., YU, X., KRISHNAMURTHY, A., AND WANG, R. 2002. PersonalRAID:Mobile storage for distributed and disconnected computers. In Proceedings of the 1st USENIX
Conference on File and Storage Technologies, Monterey, CA, 159–174.∗SOULES, C. A. N., GOODSON, G. R., STRUNK, J. D., AND GANGER, G. R. 2003. Metadata efficiency
in versioning file systems. In Proceedings of the 2nd USENIX Conference on File and Storage
Technologies, San Francisco, CA, 43–58.SPADAVECCHIA, J. AND ZADOK, E. 2002. Enhancing NFS cross-administrative domain access. In
Proceedings of the Annual USENIX Technical Conference, FREENIX Track, Monterey, CA, 181–194.
SPC. 2007. Storage performance council. www.storageperformance.org.SPEC. 2001. SPEC SFS97 R1 V3.0. www.spec.org/sfs97r1.
ACM Transactions on Storage, Vol. 4, No. 2, Article 5, Publication date: May 2008.

A Nine Year Study of File System and Storage Benchmarking • 5:55
SPEC. 2003. SPEC SMT97. www.spec.org/osg/smt97/.SPEC. 2004. SPEC SDM Suite. www.spec.org/osg/sdm91/.SPEC. 2005a. The SPEC organization. www.spec.org/.SPEC. 2005b. SPECweb99. www.spec.org/web99.SPEC. 2007. SPECviewperf 9. www.spec.org/gpc/opc.static/vp9info.html.∗STEIN, C. A., HOWARD, J. H., AND SELTZER, M. I. 2001. Unifying file system protection. In Proceed-
ings of the Annual USENIX Technical Conference, Boston, MA, 79–90.∗STRUNK, J. D., GOODSON, G. R., SCHEINHOLTZ, M. L., SOULES, C. A. N., AND GANGER, G. R. 2000.
Self-Securing storage: Protecting data in compromised systems. In Proceedings of the 4th
USENIX Symposium on Operating System Design and Implementation, San Diego, CA, 165–180.
SWARTZ, K. L. 1996. The brave little toaster meets Usenet. In Proceedings of the 10th USENIX
System Administration Conference (LISA), Chicago, IL, 161–170.∗TAN, Y., WONG, T., STRUNK, J. D., AND GANGER, G. R. 2005. Comparison-Based file server verifica-
tion. In Proceedings of the Annual USENIX Technical Conference, Anaheim, CA, 121–133.TANG, D. 1995. Benchmarking filesystems. Tech. Rep. TR-19-95, Harvard University.TANG, D. AND SELTZER, M. 1994. Lies, damned lies, and file system benchmarks. Tech. Rep. TR-
34-94, Harvard University. December. In VINO: The 1994 Fall Harvest.∗THERESKA, E., SCHINDLER, J., BUCY, J., SALMON, B., LUMB, C. R., AND GANGER, G. R. 2004. A frame-
work for building unobtrusive disk maintenance applications. In Proceedings of the 3rd USENIX
Conference on File and Storage Technologies, San Francisco, CA, 213–226.∗TIAN, L., FENG, D., JIANG, H., ZHOU, K., ZENG, L., CHEN, J., WANG, Z., AND SONG, Z. 2007. PRO: A
popularity-based multi-threaded reconstruction optimization for RAID-structured storage sys-tems. In Proceedings of the 5th USENIX Conference on File and Storage Technologies, San Jose,CA, 277–290.
∗TOLIA, N., HARKES, J., KOZUCH, M., AND SATYANARAYANAN, M. 2004. Integrating portable and dis-tributed storage. In Proceedings of the 3rd USENIX Conference on File and Storage Technologies,San Francisco, CA, 227–238.
∗TOLIA, N., KOZUCH, M., SATYANARAYANAN, M., KARP, B., BRESSOUD, T., AND PERRIG, A. 2003. Oppor-tunistic use of content addressable storage for distributed file systems. In Proceedings of the
Annual USENIX Technical Conference, San Antonio, TX, 127–140.TPC. 2005. Transaction processing performance council. www.tpc.org.TRIDGELL, A. 1999. Dbench-3.03 README. http://samba.org/ftp/tridge/dbench/README.VAN METER, R. 1997. Observing the effects of multi-zone disks. In Proceedings of the Annual
USENIX Technical Conference, Anaheim, CA, 19–30.∗VAN METER, R. AND GAO, M. 2000. Latency management in storage systems. In Proceedings of
the 4th USENIX Symposium on Operating System Design and Implementation, San Diego, CA,103–118.
∗VEERARAGHAVAN, K., MYRICK, A., AND FLINN, J. 2007. Cobalt: Separating content distribution fromauthorization in distributed file systems. In Proceedings of the 5th USENIX Conference on File
and Storage Technologies, San Jose, CA, 231–244.VERITAS SOFTWARE. 1999. VERITAS file server edition performance brief: A PostMark 1.11
benchmark comparison. Tech. Rep., Veritas Software Corporation. June. http://eval.veritas.com/webfiles/docs/fsedition-postmark.pdf.
VERITEST. 2002. NetBench. www.veritest.com/benchmarks/netbench/.∗VILAYANNUR, M., NATH, P., AND SIVASUBRAMANIAM, A. 2005. Providing tunable consistency for a
parallel file store. In Proceedings of the 4th USENIX Conference on File and Storage Technologies,San Francisco, CA, 17–30.
VOGELS, W. 1999. File system usage in Windows NT 4.0. In Proceedings of the 17th ACM Sympo-
sium on Operating Systems Principles, Charleston, SC, 93–109.∗WACHS, M., ABD-EL-MALEK, M., THERESKA, E., AND GANGER, G. R. 2007. Argon: Performance in-
sulation for shared storage servers. In Proceedings of the 5th USENIX Conference on File and
Storage Technologies, San Jose, CA, 61–76.∗WANG, A. A., REIHER, P., POPEK, G. J., AND KUENNING, G. H. 2002. Conquest: Better performance
through a disk/persistent-RAM hybrid file system. In Proceedings of the Annual USENIX Tech-
nical Conference, Monterey, CA, 15–28.
ACM Transactions on Storage, Vol. 4, No. 2, Article 5, Publication date: May 2008.

5:56 • A. Traeger et al.
∗WANG, R. Y., ANDERSON, T. E., AND PATTERSON, D. A. 1999. Virtual log based file systems for aprogrammable disk. In Proceedings of the 3rd Symposium on Operating Systems Design and
Implementation, New Orleans, LA, 29–44.∗WANG, Y. AND MERCHANT, A. 2007. Proportional-Share scheduling for distributed storage systems.
In Proceedings of the 5th USENIX Conference on File and Storage Technologies, San Jose, CA,47–60.
WATSON, A. AND NELSON, B. 1992. LADDIS: A multi-vendor and vendor-neutral SPEC NFS bench-mark. In Proceedings of the 6th USENIX Systems Administration Conference (LISA VI), LongBeach, CA, 17–32.
∗WEDDLE, C., OLDHAM, M., QIAN, J., WANG, A. A., REIHER, P., AND KUENNING, G. 2007. PARAID:A gear-shifting power-aware RAID. In Proceedings of the 5th USENIX Conference on File and
Storage Technologies, San Jose, CA, 245–260.∗WEIL, S., BRANDT, S., MILLER, E., LONG, D., AND MALTZAHN, C. 2006. Ceph: A scalable, high-
performance distributed file system. In Proceedings of the 7th Symposium on Operating Systems
Design and Implementation, Seattle, WA, 307–320.WITTLE, M. AND KEITH, B. E. 1993. LADDIS: The next generation in NFS file server benchmarking.
In Proceedings of the Summer USENIX Technical Conference, Cincinnati, OH, 111–128.WRIGHT, C. P., DAVE, J., AND ZADOK, E. 2003a. Cryptographic file systems performance: What
you don’t know can hurt you. In Proceedings of the 2nd IEEE International Security In Storage
Workshop. IEEE Computer Society, Washington, DC, 47–61.WRIGHT, C. P., JOUKOV, N., KULKARNI, D., MIRETSKIY, Y., AND ZADOK, E. 2005. Auto-Pilot: A platform
for system software benchmarking. In Proceedings of the Annual USENIX Technical Conference,
FREENIX Track, Anaheim, CA, 175–187.∗WRIGHT, C. P., MARTINO, M., AND ZADOK, E. 2003b. NCryptfs: A secure and convenient crypto-
graphic file system. In Proceedings of the Annual USENIX Technical Conference, San Antonio,TX, 197–210.
∗YU, X., GUM, B., CHEN, Y., WANG, R. Y., LI, K., KRISHNAMURTHY, A., AND ANDERSON, T. E. 2000. Trad-ing capacity for performance. In Proceedings of the 4th USENIX Symposium on Operating System
Design and Implementation, San Diego, CA, 243–258.∗YUMEREFENDI, A. R. AND CHASE, J. S. 2007. Strong accountability for network storage. In Pro-
ceedings of the 5th USENIX Conference on File and Storage Technologies, San Jose, CA, 77–92.∗ZADOK, E. 2002. Overhauling Amd for the ’00s: A case study of GNU autotools. In Proceedings
of the Annual USENIX Technical Conference, FREENIX Track, Monterey, CA, 287–297.∗ZADOK, E., ANDERSON, J. M., BADULESCU, I., AND NIEH, J. 2001. Fast indexing: Support for size-
changing algorithms in stackable file systems. In Proceedings of the Annual USENIX Technical
Conference, Boston, MA, 289–304.∗ZADOK, E., BADULESCU, I., AND SHENDER, A. 1999. Extending file systems using stackable tem-
plates. In Proceedings of the Annual USENIX Technical Conference, Monterey, CA, 57–70.∗ZADOK, E. AND NIEH, J. 2000. FiST: A language for stackable file systems. In Proceedings of the
Annual USENIX Technical Conference, San Diego, CA, 55–70.∗ZHANG, C., YU, X., KRISHNAMURTHY, A., AND WANG, R. Y. 2002. Configuring and scheduling an
eager-writing disk array for a transaction processing workload. In Proceedings of the 1st USENIX
Conference on File and Storage Technologies, Monterey, CA, 289–304.∗ZHANG, Z. AND GHOSE, K. 2003. yFS: A journaling file system design for handling large data
sets with reduced seeking. In Proceedings of the 2nd USENIX Conference on File and Storage
Technologies, San Francisco, CA, 59–72.∗ZHOU, Y., PHILBIN, J., AND LI, K. 2001. The multi-queue replacement algorithm for second level
buffer caches. In Proceedings of the Annual USENIX Technical Conference, Boston, MA, 91–104.∗ZHU, N., CHEN, J., AND CHIUEH, T. 2005a. TBBT: Scalable and accurate trace replay for file server
evaluation. In Proceedings of the 4th USENIX Conference on File and Storage Technologies, SanFrancisco, CA, 323–336.
∗ZHU, Q., CHEN, Z., TAN, L., ZHOU, Y., KEETON, K., AND WILKES, J. 2005b. Hibernator: Helpingdisk arrays sleep through the winter. In Proceedings of the 20th ACM Symposium on Operating
Systems Principles, Brighton, UK, 177–190.
Received May 2007; revised November 2007; accepted November 2007
ACM Transactions on Storage, Vol. 4, No. 2, Article 5, Publication date: May 2008.