A New Method for Optimal Placement of TCSC using ABC ...
7
Journal of Research in Science, Technology, Engineering and Management (JoRSTEM) ISSN: 2456-0197 © Malla Reddy Engineering College (Autonomous) 73 A New Method for Optimal Placement of TCSC using ABC Algorithm in Power Systems Mohammad Rafee Shaik 1 , Dr. A. Srinivasula Reddy 2 1 Asst. Professor, Department of Electrical Engineering, College of Engineering Technology, Jijiga University, Jijiga, Somali Regional State, Ethiopia 2 Principal & Professor, CMR Engineering College, Hyderabad, Telangana State, India. Abstract — In power systems because of uncertainty of the load curve and transfer of power between various utilities and loads create block out situations. In these situations the Flexible AC transmission system (FACTS) controllers play an important role in power system security enhancement. As the capital cost of these controllers is high, these controllers must be placed optimally. FACTS devices can regulate the active and reactive power control as well as adaptive to voltage-magnitude control simultaneously because of their flexibility and fast control characteristics. Placement of these devices at optimal location can lead to control in line flow and maintain bus voltages at required level and so improve the voltage profile, to improve load transfer capability, decreasing the losses in the system and operate the system within stable regions. This paper proposes a systematic method for finding optimal location of TCSC to improve voltage profile of a power system with Artificial Bee Colony (ABC) Algorithm. An OPF with/without TCSC using ABC algorithm is considered for healthy conditions in simulation and compared with existing literature. Effectiveness of the proposed method is demonstrated on IEEE 30-bus test system. Keywords — ABC algorithm, FACTS devices, Optimization, TCSC, IEEE 30 bus, Voltage profile I. I N TRO DUC TION In recent years power demand has increased substantially while the expansion of power generation and transmission has been limited due to limited resources and environmental restrictions. As a consequence some transmission lines are heavily loaded and system stability becomes a power transfer limiting factor. Flexible AC transmission system (FACTS) controllers are mainly used for solving various power system steady state control problems. However recent studies reveal that FACTS controllers could be employed to enhance power system stability in addition to their main function of power flow control. It is known that the power flow through an AC transmission line is a function of line impedance, the magnitude and the phase angle between the sending and the receiving end voltages. By proper coordination of FACTS devices in the power system network, both the active and reactive power flow in the lines can be controlled. FACTS devices improves power transmission capacity, voltage profile, enhancing power system stability [5].FACTS devices include static var compensator (SVC), thyristor controlled series compensator (TCSC), unified power flow controller (UPFC) etc. Like other FACTS devices, SVC is an expensive device; therefore it is important to find the optimal location and its size in a power system, so that voltage profile may be improved effectively. In [10], optimal placement of TCSC based on reactive power spot price is discussed.In [14], a method optimal placement of TCSC for static and dynamic voltage security enhancement has been developed. This paper focuses on the placement of TCSC for improving the voltage profile and reducing the real power losses. TCSC is a series FACTS device which is designed to maintain the voltage profile in a power system conditions. In practical power systems, all buses have different sensitivity to the power system stability, some buses are more and some are less. II. TCSC M O DELLING The model of a transmission line with a TCSC connected between the buses i and j. The change in the line flows due to series reactance. The real power injection at buses i and bus j (Pi (com)) and Pj(com)can be expressed as 2 i P( ) [ cos( ) sin( )] i ij i j ij ij ij com V G VV G B ij Δ Δ δ Δ δ (1)
Transcript of A New Method for Optimal Placement of TCSC using ABC ...
Journal of Research in Science, Technology, Engineering and Management (JoRSTEM) ISSN: 2456-0197
© Malla Reddy Engineering College (Autonomous) 73
A New Method for Optimal Placement of TCSC using
ABC Algorithm in Power Systems
Mohammad Rafee Shaik1, Dr. A. Srinivasula Reddy
2
1Asst. Professor, Department of Electrical Engineering, College of Engineering Technology,
Jijiga University, Jijiga, Somali Regional State, Ethiopia
2Principal & Professor, CMR Engineering College, Hyderabad, Telangana State, India.
Abstract— In power systems because of uncertainty of the load curve and transfer of power between
various utilities and loads create block out situations. In these situations the Flexible AC transmission
system (FACTS) controllers play an important role in power system security enhancement. As the capit al
cost of these controllers is high, these controllers must be placed optimally. FACTS devices can regulate
the active and reactive power control as well as adaptive to voltage-magnitude control simultaneously
because of their flexibility and fast control characteristics. Placement of these devices at optimal location
can lead to control in line flow and maintain bus voltages at required level and so improve the voltage
profile, to improve load transfer capability, decreasing the losses in the system and o perate the system
within stable regions. This paper proposes a systematic method for finding optimal location of TCSC to
improve voltage profile of a power system with Artificial Bee Colony (ABC) Algorithm. An OPF
with/without TCSC using ABC algorithm is considered for healthy conditions in simulation and
compared with existing literature. Effectiveness of the proposed method is demonstrated on IEEE 30 -bus
test system.
Keywords— ABC algorithm, FACTS devices, Optimization, TCSC, IEEE 30 bus, Voltage profile
I. INTRO DUCTION
In recent years power demand has increased substantially while the expansion of power generation and
transmission has been limited due to limited resources and environmental restrictions. As a consequence some transmission lines are heavily loaded and system stability becomes a power transfer limiting factor. Flexib le AC
transmission system (FACTS) controllers are mainly used for solving various power system steady state control problems. However recent studies reveal that FACTS controllers could be employed to enhance power system
stability in addition to their main function of power flow control. It is known that the power flow through an AC
transmission line is a function of line impedance, the magnitude and the phase angle between the sending and the receiving end voltages. By proper coordination of FACTS devices in the power system network, both the active and
reactive power flow in the lines can be controlled. FACTS devices improves power transmission capacity, voltage profile, enhancing power system stability [5].FACTS devices include static var compensator (SVC), thyristor
controlled series compensator (TCSC), unified power flow controller (UPFC) etc. Like other FACTS devices, SVC is an expensive device; therefore it is important to find the optimal location and its size in a power system, so that
voltage profile may be improved effectively. In [10], optimal placement of TCSC based on reactive power spot price is discussed.In [14], a method optimal p lacement of TCSC for static and dynamic voltage security enhancement has
been developed. This paper focuses on the placement of TCSC for improving the voltage profile and reducing the
real power losses. TCSC is a series FACTS device which is designed to maintain the voltage profile in a power system conditions. In practical power systems, all buses have different sensitivity to the power system stability,
some buses are more and some are less.
II. TCSC MO DELLING
The model of a transmission line with a TCSC connected between the buses i and j. The change in the lin e flows due to series reactance. The real power injection at buses i and bus j (Pi (com)) and Pj(com)can be expressed as
2
iP ( ) [ cos( ) sin( )]i ij i j ij ij ijcom V G VV G B ijΔ Δ δ Δ δ
(1)

Journal of Research in Science, Technology, Engineering and Management (JoRSTEM) ISSN: 2456-0197
© Malla Reddy Engineering College (Autonomous) 74
2jj ij i j ij ij ij ijP (com) =V G -VV [ G cos ( )- B sin ( )]
(2)
Similarly, the reactance power injected at bus i and j (Qi (com)) can be expressed as 2
i i ij i j ij ij ij ijQ (com) = -V B -VV [ G sin ( )- B cos ( )] (3)
2
j i ij i j ij ij ij ijQ (com) = -V B -VV [ G sin ( )- B cos ( )] (4)
Where,
csc csc
ij 2 2 2 2
csc
( 2 )G
( )( ( ) )
t ij t ij
ij ij ij ij t
X R X X
R X R X X
(5)
2 2
csc csc
ij 2 2 2 2
csc
( )B
( )( ( ) )
t ij ij t ij
ij ij ij ij t
X R X X X
R X R X X
(6)
III. PROBLEM FO RMULATION
The generation cost function for the real power (P) output of the generators is given as a second order polynomial
function as shown below
CP = α 2P2 + α1P + α 0 [US$/h] (7)
Where P is the output in MW and α0, α1 and α2 are cost coefficients. And the cost function of the reactive power
(Q) output of the generators is given by:
CQ = β 1 Q + β0[US$/h] (8)
As far as the cost of TCSC devices is concerned, only typical cost functions associated with the total investment and
infrastructure costs are considered. Cost function of TCSC is based on the Siemens AG Database which is shown
below.
(9)
The objective function (OF) considered here minimizes the generation cost while taking into consideration the cost
of FACTS devices, i.e.
(10)
CP , CQ and CFACTS are the costs of active and reactive power productions and the cost of allocated FACTS devices,
respectively. The indices n and m are the number of the generators and allocated FACTS devices, respectively.
A. ABC algorithm based optimization method
The TCSC is injected to all lines in 30 bus system and for each line we find power flow and cost of
generation.
The GA algorithm based optimization procedure is then applied to optimally allocate available FACTS
devices. There are two variables per device to be determined, the location and the rating.
A penalty factor is set to prevent the placement of two series connected devices in the same branch. The
penalty factor increases the cost of placing the second device at the same location and discards such
solution from further consideration
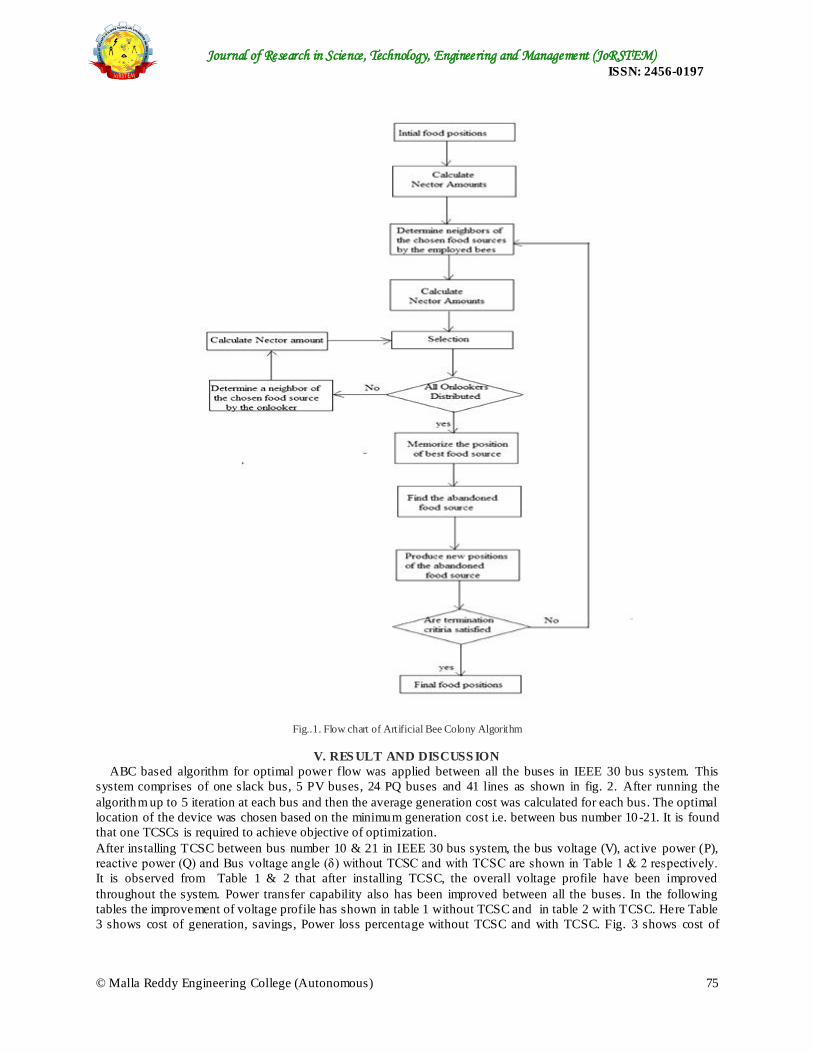
IV. ARTIFICIAL BEE COLONY ALGORITHM
In a real bee colony, some tasks are performed by specialized indiv iduals. These specialized bees try to maximize
the nectar amount stored in the hive using efficient self-organization. The Artificial Bee Colony (ABC) algorithm,
proposed by Karaboga [18] in 2005 fo r real-parameter optimization, is a recently introduced optimization algorithm
which simulates the foraging behavior of a bee colony .The minimal model of swarm-intelligent forage selection in
a honey bee colony which the ABC algorithm simulates consists of three kinds of bees: employed bees, onlooker
bees and scout bees. Half of the colony consists of employed bees, and the other half includes onlooker bees.
Employed bees are responsible for exploit ing the nectar sources explored before and giving informat ion to the
wait ing bees (onlooker bees) in the hive about the quality of the food source sites which they are exp loit ing.
Onlooker bees wait in the hive and decide on a food source to explo it based on the information shared by the
employed bees. Scouts either randomly search the environment in order to find a new food source depending on an
internal mot ivation or based on possible external clues .All these units and interactions between them are shown as a
flowchart in Figure 1.
Journal of Research in Science, Technology, Engineering and Management (JoRSTEM) ISSN: 2456-0197
© Malla Reddy Engineering College (Autonomous) 75
Fig..1. Flow chart of Artificial Bee Colony Algorithm
V. RES ULT AND DISCUSS ION
ABC based algorithm for optimal power flow was applied between all the buses in IEEE 30 bus system. This
system comprises of one slack bus, 5 PV buses, 24 PQ buses and 41 lines as shown in fig. 2. After running the
algorithm up to 5 iteration at each bus and then the average generation cost was calculated for each bus. The optimal
location of the device was chosen based on the minimum generation cost i.e. between bus number 10 -21. It is found
that one TCSCs is required to achieve objective of optimization.
After installing TCSC between bus number 10 & 21 in IEEE 30 bus system, the bus voltage (V), act ive power (P),
reactive power (Q) and Bus voltage angle (δ) without TCSC and with TCSC are shown in Table 1 & 2 respectively.
It is observed from Table 1 & 2 that after installing TCSC, the overall voltage profile have been improved
throughout the system. Power transfer capability also has been improved between all the buses. In the following
tables the improvement of voltage profile has shown in table 1 without TCSC and in table 2 with TCSC. Here Table
3 shows cost of generation, savings, Power loss percentage without TCSC and with TCSC. Fig. 3 shows cost of

Journal of Research in Science, Technology, Engineering and Management (JoRSTEM) ISSN: 2456-0197
© Malla Reddy Engineering College (Autonomous) 76
generation with TCSC graphs with GA. From tables 1 & 2 it is clear that TCSC placing optimally successfully
increased the voltage profile of the system.
Fig.2. IEEE 30 bus system
Table 1: Bus Data without TCSC
Bus no Active Power
(P)
Reactive Power
(Q)
Voltage Magnitude
(|V|)
Angle
(δ)
1 0.8912 1.1541 1.06 0
2 0.5682 -0.6222 1.045 -2.7224
3 -0.0226 -0.0673 1.0253 -2.5936
4 0.0417 -0.6832 1.0167 -4.3402
5 -0.5622 0.1093 1.01 -12.0198
6 0.0312 -0.1785 1.0134 -7.0137
7 -0.1222 -0.1134 1.0042 -10.2313
8 -0.3992 0.3445 1.01 -7.5761
9 -0.0344 -0.1654 1.0532 -11.2273
10 -0.2311 -0.1213 1.0479 -11.2503
11 0.1722 0.2314 1.082 -14.3235
12 -0.3123 -0.2254 1.06 -8.7249
13 0.1298 0.7272 1.071 -7.5378
14 -0.0011 -0.1001 1.0452 -10.5670
15 -0.0195 -0.0742 1.0405 -11.6460
16 0.0294 -0.1006 1.0472 -6.7433
17 0.0100 -0.1432 1.0427 -9.6044
18 0.0085 -0.0711 1.031 -7.7066
19 -0.0301 -0.0849 1.0285 -7.3543
20 -0.0154 -0.0110 1.0326 -7.8190
21 -0.5927 0.5225 1.0355 -14.3763
22 -0.3618 0.7839 1.036 -14.6590
23 -0.5426 0.4076 1.0299 -16.411
24 -0.5686 0.4886 1.0241 -16.6927
25 -0.1115 0.2188 0.9998 -13.1398
26 -0.2156 0.1753 1.0016 -16.6592
27 -0.0056 -0.0504 1.0248 -7.6956
28 0.0530 -0.0577 1.0093 -7.1758
29 0.3041 -0.1448 1.005 -2.8020
30 0.2529 -0.2902 0.9883 -2.4819

Journal of Research in Science, Technology, Engineering and Management (JoRSTEM) ISSN: 2456-0197
© Malla Reddy Engineering College (Autonomous) 77
Table 2: Bus Data with TCSC
Table 3: Cost of generation using TCSC
Without TCSC With TCSC
Location of TCSC Between buses 10 - 21
Cost of generation ( US $/ hr ) 831.4644 800.9543
Savings in US $/ hr 30.5101
% Ploss 7.34 7.04
Bus no Active Power
(P)
Reactive Power
(Q)
Voltage Magnitude
(|V|)
Angle
(δ)
1 0.9199 1.3674 1.06 0 2 0.5897 -0.6686 1.049 -2.7371
3 -0.0364 -0.0731 1.0267 -4.7133 4 -0.0492 -0.0858 1.0178 -5.6464
5 -0.0578 -0.1785 1.01 -6.4955
6 0.0325 -0.1232 1.0145 -6.4971 7 -0.1535 0.3887 1.0053 -8.0472
8 -0.0593 -0.1949 1.01 -8.5118 9 -0.0086 -0.1668 1.0548 -6.0639
10 -0.3281 0.4491 1.0487 -8.3018 11 0.1747 -0.3347 1.092 -6.0951
12 -0.3716 0.7178 1.062 -9.2411 13 0.1622 -0.1005 1.079 -8.0140
14 -0.0014 -0.0892 1.0465 -10.5737 15 -0.0200 -0.1100 1.0423 -10.5611
16 0.0304 -0.1852 1.0482 -10.9620 17 0.0111 -0.0721 1.0439 -10.8988
18 0.0095 -0.0849 1.042 -11.3504 19 -0.0301 -0.0113 1.029 -10.5818
20 -0.0174 -0.0919 1.0336 -6.9296
21 0.0651 -0.0667 1.036 -11.9044 22 -0.0422 0.0592 1.036 -10.8560
23 -0.0520 -0.0028 1.0349 -10.9620 24 -0.0457 0.0145 1.0251 -10.8988
25 -0.0158 -0.0501 1.0102 -11.3504 26 0.0142 -0.1123 1.0016 -10.1214
27 -0.0067 -0.0374 1.0248 -10.5818 28 0.0354 0.0368 1.0093 -6.9296
29 -0.0367 -0.0367 1.005 -11.9044 30 -0.0982 -0.0982 0.9898 -12.8560

Journal of Research in Science, Technology, Engineering and Management (JoRSTEM) ISSN: 2456-0197
© Malla Reddy Engineering College (Autonomous) 78
Fig. 3 Cost of generation graphs with TCSC (ABC) to with TCSC (GA)
VI. CONCLUSION
This paper presents a new approach which can be used to optimally locate the least TCSCs as power flow
controllers along system branches in an attempt to enhance both voltage profile and security margin of the system.
IEEE 30-bus test system has been used to evaluate the performance of the proposed approach. Optimally placing
TCSC with optimal cost has been improved the voltage profile and also decreased the cost of generation of power.
This method also decreased the total power losses.
REFERENCES
[1] Enhancement Of Steady-State Stability In Large Scale Power Systems,” IEEE Trans. Power System, Vol. 10, No. 3, 1401-1407, 1995.April 1955.
[2] P. Kundur, Paserba, V. Ajjarapu, A.Bose, G. Anderson, C.A. Canizares, N. HatziargYfiou, D. Hill, A.Stankovic, C. Taylor, T. Van Cutsem, and V. Vittal, "Definit ion and Classification of Power System Instability," IEEE Trans. On Power Systems , Vol.19, No.2, pp.1387-1401, May 2004.
[3] N.G.Hingorani and L.Gyugyi, “Understanding FACTS Concepts and Technology of Flexible AC Transmission Systems, IEEE Press, Power Engineering, 1999.
[4] E. Acha, C.R. Fuerte, H. Ambriz and C. Angeles.FACTS :Modelling and Simulation in Power Networks , John Willey & Sons, Ltd.
[5] Nazanin Hosseinipoor, Syed M.H Nabavi, “Optimal Locating and Sizing of TCSC Using Genetic Algorithm for
Congestion Management in Deregualted Power Markets ”, 9th
International Conference on Environment and
Electrical Engineering, 2010.
[6] A. K. Sahoo,S. S. Dash and T.Thyagarajan, “Power flo w study including FACTS devices”, Journal of applied
science, Vol. 10, No. 15, 2010.
[7] M. A. Abido, “Power system stability enhancement using FACTS controllers: A review”, The arabian journal for science and engineering, Vol. 34, 2008.
[8] M. Young, The Technical Writer’s Handbook. Mill Valley, CA: University Science, 1989.
[9] N. Yang, Q. Liu, and J.D. Mc Calley, “TCSC control design for damping inter-area oscillations”, IEEE Trans.Power Syst., vol. 13, pp. 1304-1310, Nov. 1998.
[10] SamehKamel Mena Kodsi, Claudio A. Canizares, “Modelling and simulation of IEEE 14 bus system with FACTS controllers,” Technical report, 2003.
[11] G. Madhusudhanarao, B. V. Sankerram, B. Sampath Kumar “TCSC designed optimal power flow using genetic algorithm,” International Journal of Engineering Science and Technology, Vol. 2, No. 9, pp. 4342-4349, 2010.
[12] A. Kazemi, and B. Badrzadeh, “Modeling and Simulat ion of SVC and TCSC to Study their Limits on Maximum Loadability Po int,” Electrical Power and Energy Systems, Vol. 26, pp. 619-626, Apr. 2004.
[13] S. Suresh Reddy, S. Sarat Kumar, Dr. S.V.J. Kumar. “Load flow solution for ill -conditioned power systems using Runge-Kutta method with FACTS devices”, Journal of theoretical and applied information technology, Vol. 5, No. 65, pp. 693-703, 2009.
[14] T.T. Lie, W.Deng, “Optimal flexible AC transmission systems (FACTS) devices allocation,” Int. Journal of Electic. Power Energy System, Vol. 19 pp. 125-134, 1999.
[15] Ramnarayan Patel, Vasundhara Mahajan, Vinay Panth “Modelling of TCSC Controller for Transient Stability Enhancement” International Journal of Emerg ing Electric Power Systems: Vol. 7 : Iss. 1, Article 6.
[16] E. J. De Oliveira, J. W. M. Lima, “Allocation of FACTS devices in a competitive environment,” 13th
PSCC, pp.1184-1190,1999.
780
790
800
810
820
830
840
1
Co
st o
f G
en
era
tio
n
Cost of generation Comparison with TCSC(ABC) to with TCSC(GA)
Cost of generation without TCSC
Cost of generation with TCSC (ABC)
Cost of generation with TCSC (GA)

Journal of Research in Science, Technology, Engineering and Management (JoRSTEM) ISSN: 2456-0197
© Malla Reddy Engineering College (Autonomous) 79
[17] Shraddha Udgir, Sarika Varshney and Laxmi Srivastava, “Optimal Placement and Sizing of SVC for Improving Voltage Profile of Power System,” International Journal of Power System Operation and Energy Management , ISSN:2231-4407, Vol. 1, Issue-2, 2011.
[18] Ray D. Zimmerman, Carlos E. Murillo-Sanchez & Deqiang (David) Gan, “A MATLAB Power System Simulation Package”.
[19] D. Karaboga, “An idea based on honey bee swarm for numerical optimizat ion,technical report -tr06”, Erciyes University, Engineering Faculty, Computer Engineering Department , 2005.