scv and tcsc integrations
12
POWER ENGINEERING AND ELECTRICAL ENGINEERING VOLUME: 12 | NUMBER: 1 | 2014 | MARCH Biplab BHATTACHARYYA, Vikash Kumar GUPTA, Sanjay KUMAR Department of Electrical Engineering, Indian School of Mines, Dhanbad, 826004 Jharkhand, India [email protected], [email protected], [email protected] Abstract. In this paper Genetic Algorithm (GA) is used as an evolutionary tecthniques for the opti- mal placement of flexible AC transmission systems (FACTS) devices in an interconnected power system. Here two types of FACTS devices has been discussed nemely, Thyristor Controlled Series Capacitor (TCSC) and Static Var Compensator (SVC) for the economic operation and to reduce the transmission loss. Reac- tively loading of the system is taken from base to 200 % of base loading and the system performance is observed without and with FACTS devices. Optimal placement of FACTS devices in the system is determined by calcu- lating active and reactive power flow in lines. FACTS devices along with reactive generation of generators and transformer tap setting are used for the power transfer capacity using GA. The proposed approach is applied on IEEE 14 and IEEE 30-bus test systems. Finally the effectiveness of the proposed GA based method of place- ment of FACTS devices is established by comparing the results with another standard method of optimization like Particle Swarm Optimization (PSO) technique. Keywords FACTS devices, genetic algorithm, line power Flow, optimal location of FACTS devices, par- ticle swarm optimization. 1. Introduction Due to increase in power demand, restriction on the construction of new lines, environment, unscheduled power flows in lines creates congestion in the transmis- sion network and increases transmission loss. Main- tenance of bus voltages and line loads within prede- fined limits is one of the challenging tasks in an inter- connected power system. Effective control of reactive compensation on weak nodes improves voltage profile, reduces power loss and improves both steady state & dynamic performance of the system. Power flow through an ac transmission line is a func- tion of line impedance, the magnitude and the phase angle between the sending end and the receiving end voltages. With the development of FACTS devices both the active and reactive power flow in the lines can be controlled. The concept of flexible AC transmission system (FACTS) was first introduced by Hingorani [1]. FACTS devices are solid-state converters having the capability of control of various electrical parameters in transmission circuits. Sensitivity analysis and linear programming tech- nique for the optimal location and size of Static Var Compensator (SVC) in a power system is discussed in [2]. Optimization techniques are widely used in the field of technology. Optimal placement of Thyris- tor Controlled Series Capacitor (TCSC) for increasing loadability and minimizing transmission loss by Ge- netic Algorithm (GA) is discussed in [3]. Optimal re- active power dispatch along with the setting of switch- able series & shunt FACTS devices is presented in [4]. Optimal placement of Var sources by loss sensitivity based method is presented in [5]. A hybrid Genetic Algorithmic approach with FACTS devices for optimal power flow is dealt in [6]. Solution of optimal power flow using GA is presented by Osman et al. in [7]. Authors have discussed Ge- netic Algorithm based approach for the placement of different types of FACTS devices in [8]. Computational Intelligence based algorithm is presented in [9] to de- termine the optimal placement and parameter setting of TCSC for enhancing the security of power system under single line contingency. Concept of comutational intelligence technique using FACTS controller is applied in [10] for the loadability enhancement in a restructured power system. In [11] GA based technique is discussed for the placement of FACTS devices in some test systems. Das et al. in [12] applied GA to minimize active power loss in a radial distribution network using SVC. About the modelling and selection of possible locations for the installation of FACTS devices have been discussed in [13]. An op- c 2014 ADVANCES IN ELECTRICAL AND ELECTRONIC ENGINEERING 1
-
Upload
mohamed-taleb -
Category
Documents
-
view
234 -
download
0
description
scv and tcsc integrations
Transcript of scv and tcsc integrations
POWER ENGINEERING AND ELECTRICAL ENGINEERING VOLUME: 12 | NUMBER: 1 | 2014 | MARCH
Reactive Power Optimization with SVC & TCSC
using Genetic Algorithm
Biplab BHATTACHARYYA , Vikash Kumar GUPTA , Sanjay KUMAR
Department of Electrical Engineering, Indian School of Mines, Dhanbad, 826004 Jharkhand, India
[email protected], [email protected], [email protected]
Abstract. In this paper Genetic Algorithm (GA)is used as an evolutionary tecthniques for the opti-mal placement of flexible AC transmission systems(FACTS) devices in an interconnected power system.Here two types of FACTS devices has been discussednemely, Thyristor Controlled Series Capacitor (TCSC)and Static Var Compensator (SVC) for the economicoperation and to reduce the transmission loss. Reac-tively loading of the system is taken from base to 200 %of base loading and the system performance is observedwithout and with FACTS devices. Optimal placementof FACTS devices in the system is determined by calcu-lating active and reactive power flow in lines. FACTSdevices along with reactive generation of generators andtransformer tap setting are used for the power transfercapacity using GA. The proposed approach is appliedon IEEE 14 and IEEE 30-bus test systems. Finally theeffectiveness of the proposed GA based method of place-ment of FACTS devices is established by comparing theresults with another standard method of optimizationlike Particle Swarm Optimization (PSO) technique.
Keywords
FACTS devices, genetic algorithm, line powerFlow, optimal location of FACTS devices, par-ticle swarm optimization.
1. Introduction
Due to increase in power demand, restriction on theconstruction of new lines, environment, unscheduledpower flows in lines creates congestion in the transmis-sion network and increases transmission loss. Main-tenance of bus voltages and line loads within prede-fined limits is one of the challenging tasks in an inter-connected power system. Effective control of reactivecompensation on weak nodes improves voltage profile,reduces power loss and improves both steady state &dynamic performance of the system.
Power flow through an ac transmission line is a func-tion of line impedance, the magnitude and the phaseangle between the sending end and the receiving endvoltages. With the development of FACTS devicesboth the active and reactive power flow in the lines canbe controlled. The concept of flexible AC transmissionsystem (FACTS) was first introduced by Hingorani [1].FACTS devices are solid-state converters having thecapability of control of various electrical parameters intransmission circuits.
Sensitivity analysis and linear programming tech-nique for the optimal location and size of Static VarCompensator (SVC) in a power system is discussedin [2]. Optimization techniques are widely used inthe field of technology. Optimal placement of Thyris-tor Controlled Series Capacitor (TCSC) for increasingloadability and minimizing transmission loss by Ge-netic Algorithm (GA) is discussed in [3]. Optimal re-active power dispatch along with the setting of switch-able series & shunt FACTS devices is presented in [4].Optimal placement of Var sources by loss sensitivitybased method is presented in [5]. A hybrid GeneticAlgorithmic approach with FACTS devices for optimalpower flow is dealt in [6].
Solution of optimal power flow using GA is presentedby Osman et al. in [7]. Authors have discussed Ge-netic Algorithm based approach for the placement ofdifferent types of FACTS devices in [8]. ComputationalIntelligence based algorithm is presented in [9] to de-termine the optimal placement and parameter settingof TCSC for enhancing the security of power systemunder single line contingency.
Concept of comutational intelligence technique usingFACTS controller is applied in [10] for the loadabilityenhancement in a restructured power system. In [11]GA based technique is discussed for the placement ofFACTS devices in some test systems. Das et al. in [12]applied GA to minimize active power loss in a radialdistribution network using SVC. About the modellingand selection of possible locations for the installationof FACTS devices have been discussed in [13]. An op-
c© 2014 ADVANCES IN ELECTRICAL AND ELECTRONIC ENGINEERING 1

POWER ENGINEERING AND ELECTRICAL ENGINEERING VOLUME: 12 | NUMBER: 1 | 2014 | MARCH
timization method is used in [14] that combines thereliability and the efficiency of radial power distribu-tion systems to reduce the active power loss, througha process of network reconfiguration. Effect of imple-mentation of Genetic Algorithm for the determinationof locations and size of the FACTS controller is dis-cussed in [15].
Nomenclature:
• XLine: reactance of line,
• S: operating range of FACTS devices,
• CTotal: total cost of system operation,
• C1 (E): cost due to energy loss,
• C2 (F): total investment cost of the FACTS De-vices,
• Pminni , Pmax
ni : lower and upper limit of nodal activepower in the i-th bus respectively,
• Pni, Qni: nodal active and reactive power outputof the i-th bus respectively,
• Qminni , Qmax
ni : lower and upper limit of nodal reac-tive power in the i-th bus respectively,
• Qmingi , Qmax
gi : lower and upper limit of existingnodal reactive capacity in the i-th bus respectively,
• Qgi: output of existing nodal reactive capacity inthe i-th bus,
• PGi, QGi: active and reactive power generation inthe i-th bus respectively,
• PDi, QDi: active and reactive power consumed byload in the i-th bus respectively,
• Pi, Qi (inj): real and reactive power flow changetakes place at the node i due to TCSC connectedto a particular line between the nodes i & j,
• QiL (inj): reactive power injection due to SVC,
• Vi, Vj: voltage of i-th and j-th bus respectively,
• N: number of lines,
• Gij, Bij: real and imaginary part of admittancebetween buses i & j respectively,
• θij: phase angle between Vi & Vj,
• V gen−1i : current velocity of agent i at previous
generation,
• w : weight function for velocity of agent i,
• rand: is the random number between 0 and 1,
• Sgen−1i : current position of agent i at previous
generation,
• Ci: weight coefficient for each term,
• pbesti: pbest of agent i,
• gbesti: gbest of agent i.
2. FACTS Devices
2.1. FACTS Devices & CostFunctions
Two types of FACTS devices namely thyristor con-trolled series capacitors (TCSC) and static VAr com-pensators (SVC) are used in the transmission network:
• TCSC: By modifying the line reactance TCSCacts as either inductive or capacitive compensator.The maximum value of the capacitance is fixed at−0.8XLine and 0.2XLine is the maximum value ofthe inductance.
• The SVC can be operated as either inductive orcapacitive compensation. It can be modeled as afixed capacitor and a thyristor controlled reactor.So the function of the SVC is either to inject reac-tive power to the bus or to absorb reactive powerfrom the bus where it is connected.
According to [18], cost functions for SVC and TCSCare given below:
• TCSC:
CTCSC (US$/kVar) =
= 0.0015 · S2 − 0.7130 · S + 153.75, (1)
• SVC:
CSVC (US$/kVar) =
= 0.0003 · S2 − 0.3051 · S + 127.38. (2)
Here, S is the operating range of the FACTS devices.
3. Optimal Placement ofFACTS Devices
Having made the decision to install a FACTS device inthe system, there are three main issues that are to beconsidered: types of device, its capacity and location.The decision where they are to be placed is largely de-pendent on the desired effect and the characteristics of
c© 2014 ADVANCES IN ELECTRICAL AND ELECTRONIC ENGINEERING 2
POWER ENGINEERING AND ELECTRICAL ENGINEERING VOLUME: 12 | NUMBER: 1 | 2014 | MARCH
the specific system. SVC’s are mostly suitable when re-active power flow or voltage support is necessary. Alsothe costs of the devices play an important role for thechoice of a FACTS devices. There are two distinctmeans of placing a FACTS device in the system forthe purpose of increasing the system’s ability to trans-mit power, thereby allowing for the use of more eco-nomic generating units. That is why FACTS devicesare placed in the more heavily loaded lines to limit thepower flow in that line. This causes more power tobe sent through the remaining portions of the systemwhile protecting the line with the device from beingoverloaded. This method which sites the devices in theheavily loaded line is the most effective. If reactivepower flow is a significant portion of the total flow ofthe limiting transmission line, either a TCSC device inthe line or a SVC device located at the end of the linethat receives the reactive power, may be used to reducethe reactive power flow, thereby increasing the activepower flow capacity.
4. The Proposed Approach
Here the main objective is to minimize the transmissionloss by incorporating FACTS devices at suitable loca-tions of the transmission network. Inclusion of FACTScontrollers also increase the system cost. So, optimalplacement of FACTS devices is required such that thegain obtained by reducing the transmission loss is sig-nificant even after the placement of costly FACTS de-vices. Installation costs of various FACTS devices andthe cost of system operation, namely, energy loss costare combined to form the objective function to be min-imized. The optimal allocation of FACTS devices canbe formulated as:
Ctotal = C1 (E) + C2 (F) , (3)
where C1 (E) is the cost due to energy loss and C2 (F) isthe total investment cost of the FACTS devices. Sub-ject to the nodal active and reactive power balance:
Pminni ≤ Pni ≤ Pmax
ni , (4)
Qminni ≤ Qni ≤ Qmax
ni (5)
and voltage magnitude constraints:
Vmini ≤ Vi ≤ Vmax
i (6)
and the existing nodal reactive capacity constraints:
Qmingi ≤ Qgi ≤ Qmax
gi . (7)
Superscripts min, max, are the minimum and maxi-mum limits of the variables. The power flow equationsbetween the nodes i–j after incorporating FACTS de-vices would appear as:
• TCSC:
PGi − PDi + Pi −−∑N−1
j=1 ViVj (Gijcosθij + Bijsinθij) = 0, (8)
QGi − QDi + Qi(inj) −
−∑N−1
j=1 ViVj (Gijsinθij + Bijcosθij) = 0, (9)
QGj − QDj + Qj −−∑N−1
j=1 ViVj (Gjjsinθjj + Bjjcosθjj) = 0,(10)
QGj − QDj + Qj(inj) −
−∑N−1
j=1 ViVj (Gjjsinθjj + Bjjcosθjj) = 0,(11)
• SVC:
QGi − QDi + QiL(inj) −
−∑N−1
j=1 ViVj (Gijsinθij + Bijcosθij) = 0.(12)
These changes in the power flow equations are takeninto consideration by appropriately modifying the busadmittance matrix for execution of load flow in evalu-ating the objective function for each individual popu-lation of generation of both Genetic Algorithm (GA)and Particle Swarm Optimization (PSO) based opti-mization technique.
In this approach, first the locations of FACTS de-vices are defined by calculating the power flow in thetransmission lines. Here we choose only four locationsin IEEE 14 bus and eight locations in IEEE 30 bussystem for the placement of FACTS devices. SVC’spositions are selected by choosing the lines carryinglargest reactive power. In IEEE 14 bus system, 10th,13th & 14th buses and in IEEE 30 bus system, 21st,7th, 17th & 15th buses are found as buses where suit-able reactive injection by SVC’s could improve the sys-tem performance. Line number 7th in IEEE 14 bus andlines 25th, 41thst, 28th & 5th in IEEE 30 bus system arefound as the lines for TCSC’s placement and simulta-neously series reactance of these lines are controlled.
In the proposed approach combined effect of SVC& TCSC is tested. Simultaneous use of shunt (SVC)and series (TCSC) FACTS controller has a better effectthan if either of the FACTS controller used singly. Weonly can connect SVC at buses where reactive injec-tions are required and also there is a limit of a numberof SVC’s that can be connected to a particular sys-tem. Similarly, modifying line reactance helps greatlyin reducing line loss & improving overall system per-formance. Application of series & shunt combinationof FACTS controller on a standard system is analyzedin the present work. We have taken only one numberof TCSC and three number of SVC’s in IEEE 14 bus
c© 2014 ADVANCES IN ELECTRICAL AND ELECTRONIC ENGINEERING 3
POWER ENGINEERING AND ELECTRICAL ENGINEERING VOLUME: 12 | NUMBER: 1 | 2014 | MARCH
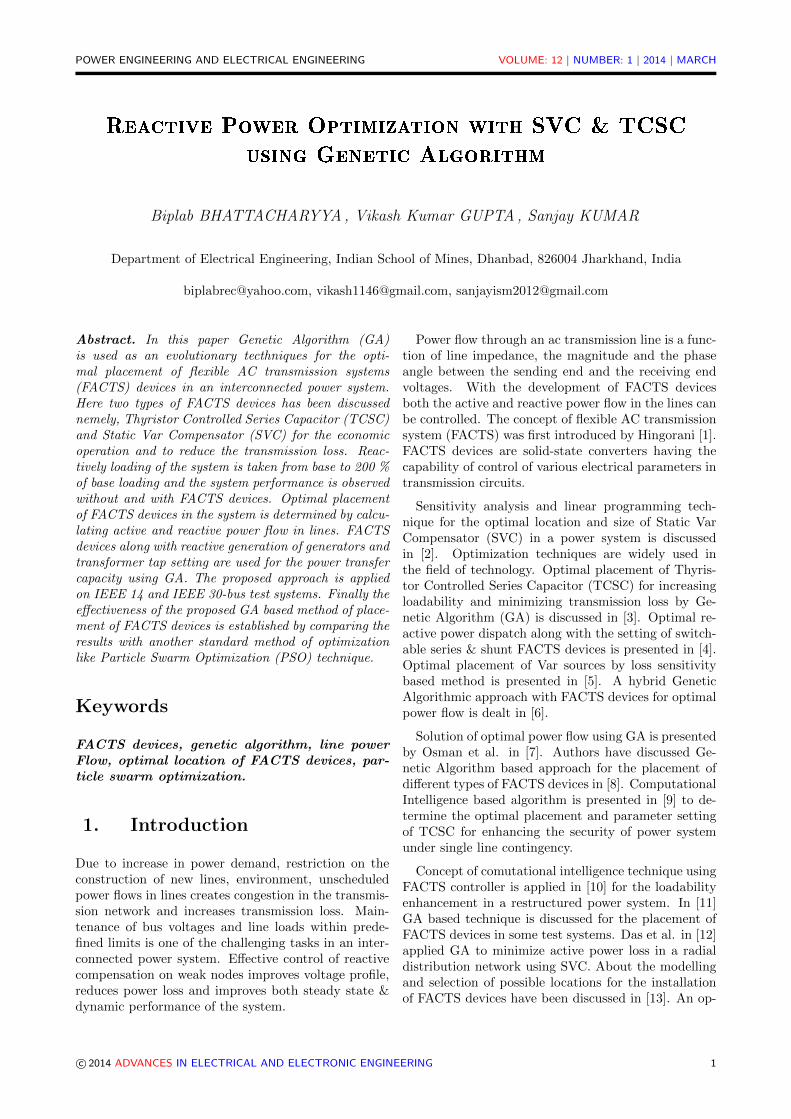
Fig. 1: Flowchart for the proposed approach.
system & four numbers of TCSC’s and four numbers ofSVC’s in IEEE 30 bus systemfor the purpose of anal-ysis in the present problem. The number of FACTScontroller depends also on the size of the system.
Maximum value of SVC is taken as 50 MVAr & maxi-mum value of TCSC is taken as 10 MVAr in the presentproblem. Fig. 1 shows a flowchart for the proposed ap-proach.
4.1. Genetic Algorithm in theProposed Method
The function of the GA is to find the optimum value ofthe different FACTS devices. Here two different typesof FACTS devices are used. The locations for the place-ment of different FACTS devices are determined onthe basis of power flow analysis. TCSC’s modifies re-actance of the lines and SVC’s are to control reactiveinjection at buses.
In addition transformer tap positions along with re-active generations of the generators are controlled. InIEEE 14 bus system there are three transformer tap po-sitions and four generator buses while in IEEE 30 bussystem there are four transformer tap positions andfive generator buses. So, as a whole all the control-ling parameters are to be optimized by Genetic Algo-
rithm [19]. These controlling parameters is representedwithin a string. This is shown in Tab. 1 for IEEE 14bus system and in Tab. 2 for IEEE 30 bus system. Ini-tially a population of N strings is randomly created intheir limits. Then the objective function is computedfor every individual of the population.
A biased roulette wheel is created such a way so thatthe parameter values are selected according to theirfitness obtained after computing the objective func-tion for all the individuals of the current population.Thereafter the usual Genetic operation such as Repro-duction, Crossover & Mutation takes place. Two indi-vidual are randomly selected from the current popula-tion for reproduction. Then crossover takes place witha probability close to one (here 0.8).
Finally mutation with a specific probability (verylow) completes one Genetic cycle and individuals ofthe same population with improved characters are cre-ated in the next generation. The objective function isthen again calculated for all the individuals of the newgeneration and all the genetic operations are again per-formed and the second generation of the same popula-tion size is produced. This procedure is repeated tillthe final goal is achieved. The population size is takenas 80 & GA is run for 100 generation.
4.2. PSO Approach in Brief
Particle swarm optimization (PSO) is a populationbased stochastic optimization technique developed byDr. Eberhart and Dr. Kennedy in 1995, inspired bysocial behavior of bird flocking or fish schooling.
A population is initialized of random feasible solu-tions and searches for optima by updating generations.In PSO, the potential solutions, called particles havetheir own positions and velocities move in the searchspace of an optimization problem by following the cur-rent optimum particles. Each particle tracks its ownbest position found so far in the exploration and eachparticle searches for better positions in the search spaceby updating its velocity. The movement of each par-ticle naturally evolves to an optimal or near-optimalsolution.
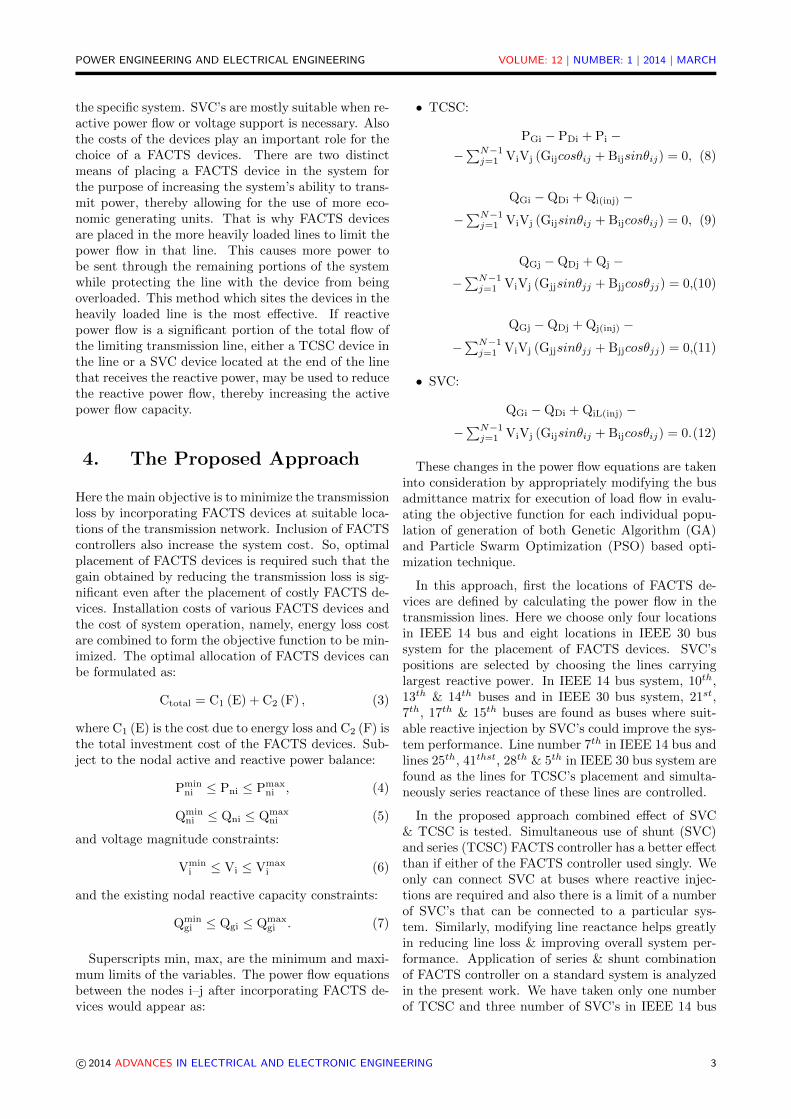
The position of each agent is represented by XY-axisposition and the velocity (displacement vector) is ex-pressed by Vx (the velocity along X-axis) and Vy (thevelocity along Y-axis). Modification of the agent posi-tion is realized by using the position and the velocityinformation. The behavior of particles in PSO is shownin Fig. 2.
Each agent or particle knows its best value so far(pbest) and its x, y position. Each agent knows thebest value so far in the group (gbest) among pbests.
c© 2014 ADVANCES IN ELECTRICAL AND ELECTRONIC ENGINEERING 4
POWER ENGINEERING AND ELECTRICAL ENGINEERING VOLUME: 12 | NUMBER: 1 | 2014 | MARCH
Tab. 1: String representing the control variables in IEEE 14 bus system.
TCSC SVCTransformer
Tap
ReactiveGenerations ofGenerators
1 Nos. 3 Nos. 3 Nos. 4 Nos.1 1 2 3 1 2 3 1 2 3 4
Tab. 2: String representing the control variables in IEEE 30 bus system.
TCSC SVCTransformer
Tap
ReactiveGenerations ofGenerators
4 Nos. 4 Nos. 4 Nos. 5 Nos.1 2 3 4 1 2 3 4 1 2 3 4 1 2 3 4 5
Fig. 2: Behavior of particles in PSO.
Each particle tries to modify their position using thefollowing information:
• the current positions (x, y),
• the current velocities (Vx, Vy),
• the distance between the current position andpbest,
• the distance between the current position andgbest.
The basic equation for the optimization of nonlinearfunctions using particle swarm optimization techniqueis:
V geni = w · V gen−1
i + C1rand(
pbesti − Sgen−1i
)+
+C2rand(
gbesti − Sgen−1i
), (13)
Sgeni = Sgen−1
i + V geni , (14)
where w is updated at each iteration:
w = wmax − wmax − wmin
genmaxgen. (15)
Tab. 3: Locations of different FACTS Devices in the Transmis-sion Network.
IEEE 14 bus IEEE 30 busTCSC in SVC in TCSC in SVC in
line buses line line7 10; 13; 14 25; 41; 28; 5 21; 7; 17; 15
Here wmax = 0.9; wmin = 0.4; genmax = 500 andgen = current iteration; C1 and C2 are set to 2.0.
In PSO, the gbest particle always improves its po-sition and finds the optimum solution and the rest ofthe population follows it. String representing controlvariables using PSO are shown in Tab. 1 and Tab. 2.
5. Results and Discussions
After detecting the locations of FACTS devices bypower flow analysis it becomes necessary to determinetheir magnitudes. GA & PSO based optimization tech-nique is run to serve this purpose. IEEE 14 & IEEE30 bus system is taken as standard test system. Bothtest systems are loaded (reactive loading is considered)from it’s base value to 200 % of it’s base value. Thelocations where different FACTS devices are placed isshown in Tab. 3.
Active power loss without and with FACTS devicesusing GA & PSO technique is shown in Tab. 4 & Tab. 5respectively for both systems. The magnitude andphase angle of the voltages of weak nodes without &with FACTS devices for highest reactive loading i.e.for 200 % is shown in Tab. 6 & Tab. 7. Phase anglesare given in radian. Here, we see that after connectingFACTS devices, voltage profile of all buses of the IEEE14 & IEEE 30 bus system improves, though questionmay arise why we connect FACTS devices if the volt-ages are in the acceptable range as seen from Tab. 6 &Tab. 7. Our main objective is to reduce overall system
c© 2014 ADVANCES IN ELECTRICAL AND ELECTRONIC ENGINEERING 5
POWER ENGINEERING AND ELECTRICAL ENGINEERING VOLUME: 12 | NUMBER: 1 | 2014 | MARCH
loss with the aid of the FACTS controller. In doingso, the voltage profile improves and transmission lossreduces significantly. A comparative study of the op-erating cost of the system without and with FACTSdevices using GA & PSO is given in Tab. 8 & Tab. 9for both the systems. From Tab. 8 & Tab. 9, we seethat large economic gain is achieved using GA & PSObased placement of FACTS devices in all cases of load-ing. Here, it is clearly observed from the result, there isa great saving in the system cost in various system load-ing condition. Table 10 & Tab. 11 shows the amount ofFACTS devices in p.u and controlled reactive sourcespresent in the network under different cases of loadingusing both the techniques and for both the systems.Reactive power flows in different lines before and afterthe placement of FACTS devices for 200 % loading areshown in Tab. 12 & Tab. 13 for IEEE 14 and IEEE 30bus system respectively.
It is observed from Tab. 3, that SVC’s are connectedat the buses 10th, 13th & 14th those are at the finish-ing ends of lines 13th, 19th & 20th respectively in IEEE14 bus system, while buses 21st, 7th, 17th & 15th areat the finishing ends of the lines 27th, 26th, 9th & 18th
respectively in IEEE 30 bus system, since these are thelines very high reactive power without FACTS devices.After connecting SVC’s at theses buses, voltage profileat these buses are improved, also reactive power flowis reduced in a large amount in the lines 13th, 19th &20th in IEEE 14 bus and in the lines 27th, 26th, 9th
& 18th in IEEE 30 bus for all cases of loading. Theplacement of TCSC’s in lines using both GA & PSOapproaches reduces reactive power flow in lines signifi-cantly for both the test systems. As transmission linecongestion is directly related with reactive power flowsin different lines, we may conclude that line congestionreduces heavily with the reduction of reactive powerflow in different lines.
It is also to be noticed that no FACTS device is con-nected in line 1 because of the fact that it is in betweenbus 1 and bus 2 though it carries very large activepower. Bus 1 is the slack bus and already a FACTSdevice regulates the voltage of the bus 2. Again in anyline or in a bus connected to the line, only one FACTSdevice can be placed. Tab. 4 & Tab. 5 shows that trans-mission loss is reduced in a considerable amount withthe FACTS devices connected in different loacations ofthe network, as a result operating cost reduces signif-icantly. This effect is observed with different sets ofloading values. Hence benefit in terms of saving usingboth GA & PSO is observed in each cases of loadingfor both systems as shown in Tab. 8 & Tab. 9. Here,energy cost is taken as 0.06 dollar/kWh.
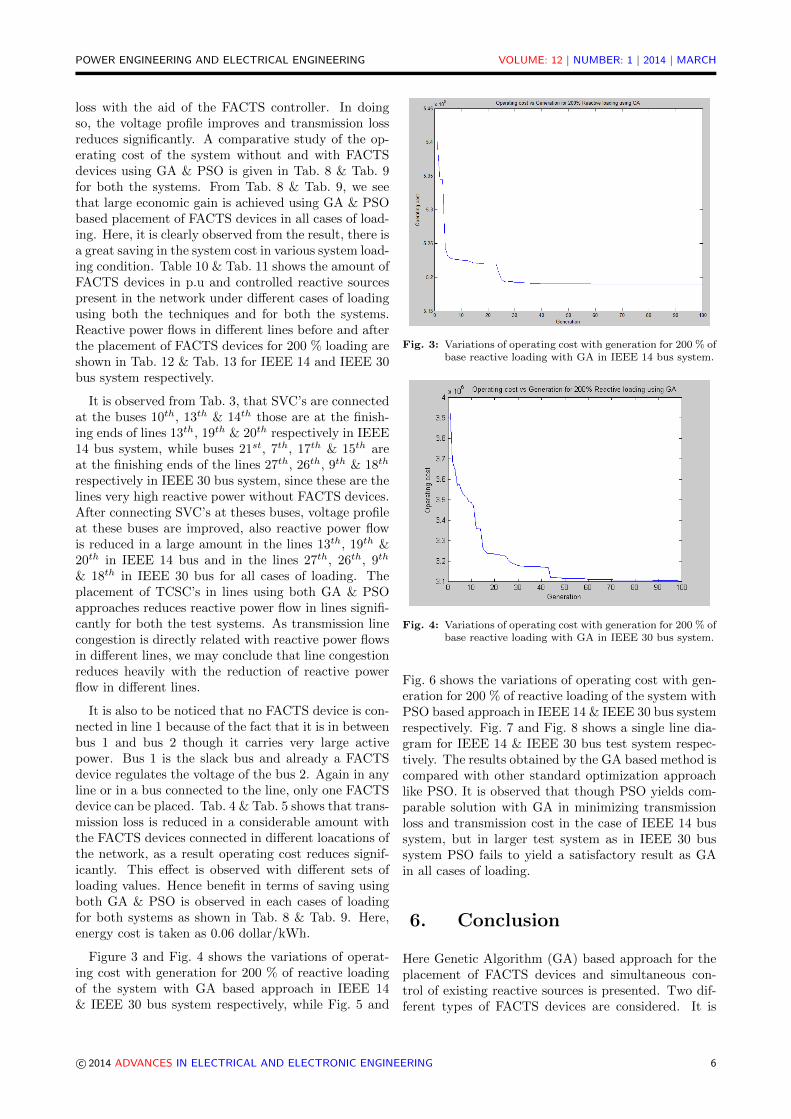
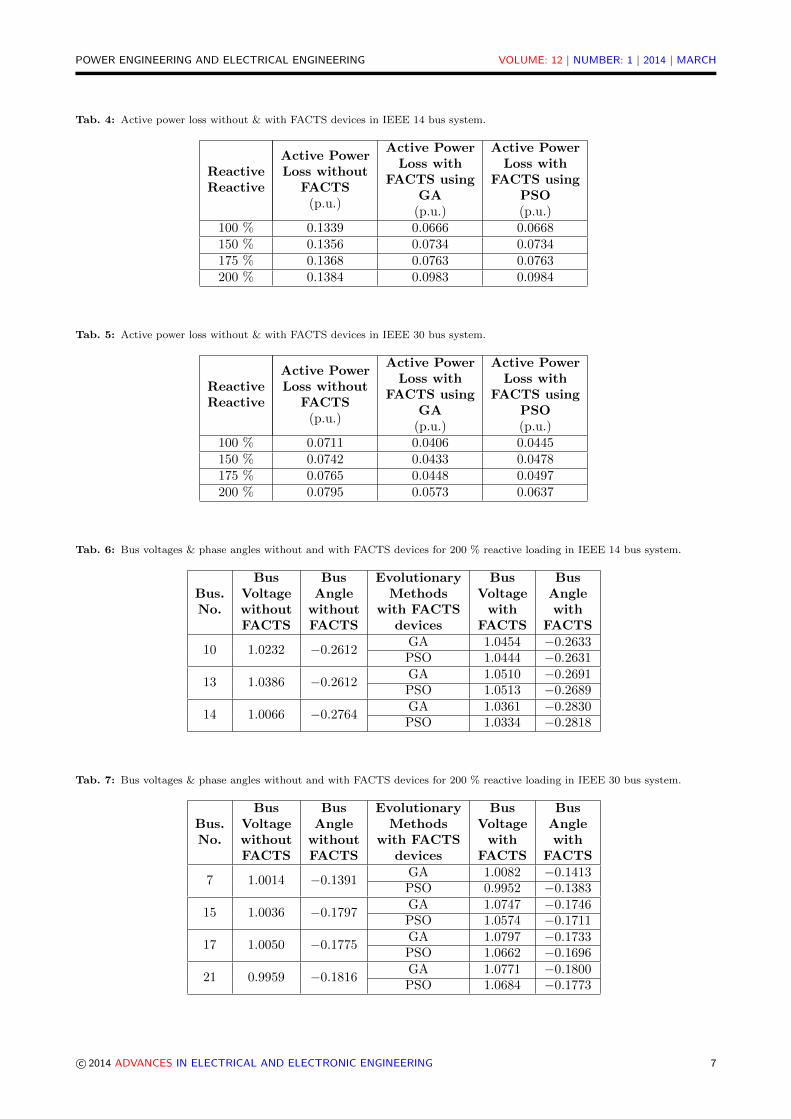
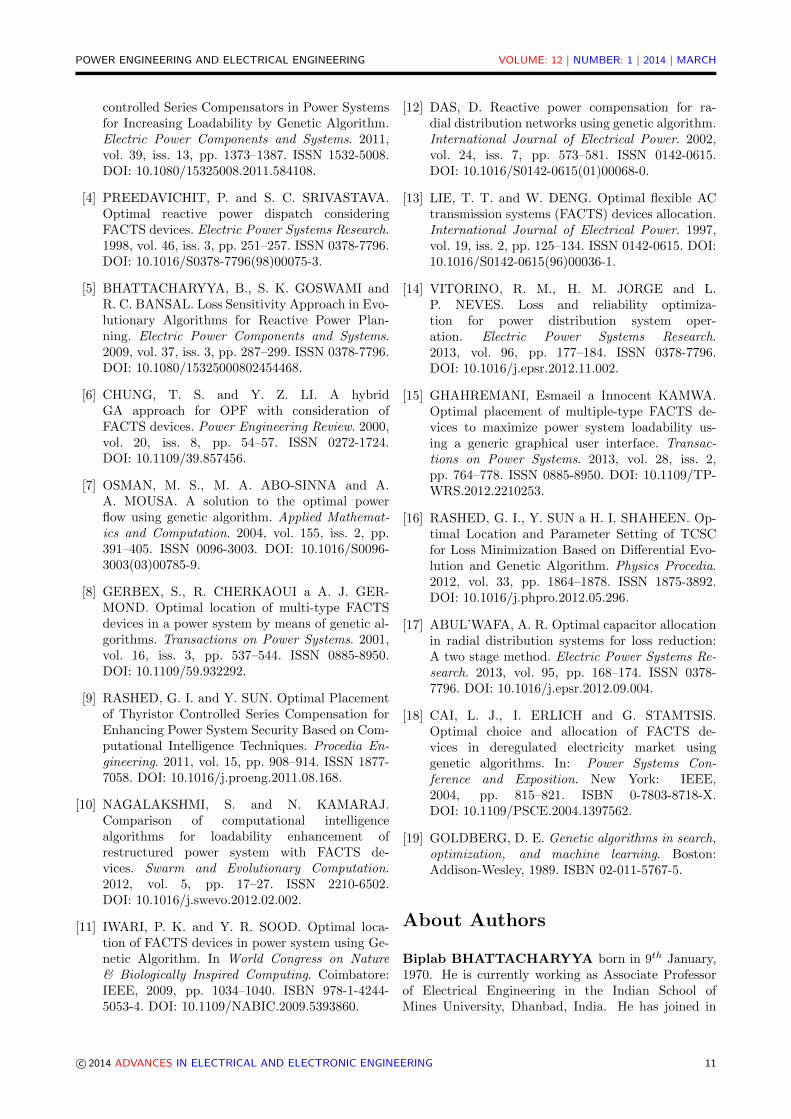
Figure 3 and Fig. 4 shows the variations of operat-ing cost with generation for 200 % of reactive loadingof the system with GA based approach in IEEE 14& IEEE 30 bus system respectively, while Fig. 5 and
Fig. 3: Variations of operating cost with generation for 200 % ofbase reactive loading with GA in IEEE 14 bus system.
Fig. 4: Variations of operating cost with generation for 200 % ofbase reactive loading with GA in IEEE 30 bus system.
Fig. 6 shows the variations of operating cost with gen-eration for 200 % of reactive loading of the system withPSO based approach in IEEE 14 & IEEE 30 bus systemrespectively. Fig. 7 and Fig. 8 shows a single line dia-gram for IEEE 14 & IEEE 30 bus test system respec-tively. The results obtained by the GA based method iscompared with other standard optimization approachlike PSO. It is observed that though PSO yields com-parable solution with GA in minimizing transmissionloss and transmission cost in the case of IEEE 14 bussystem, but in larger test system as in IEEE 30 bussystem PSO fails to yield a satisfactory result as GAin all cases of loading.
6. Conclusion
Here Genetic Algorithm (GA) based approach for theplacement of FACTS devices and simultaneous con-trol of existing reactive sources is presented. Two dif-ferent types of FACTS devices are considered. It is
c© 2014 ADVANCES IN ELECTRICAL AND ELECTRONIC ENGINEERING 6
POWER ENGINEERING AND ELECTRICAL ENGINEERING VOLUME: 12 | NUMBER: 1 | 2014 | MARCH
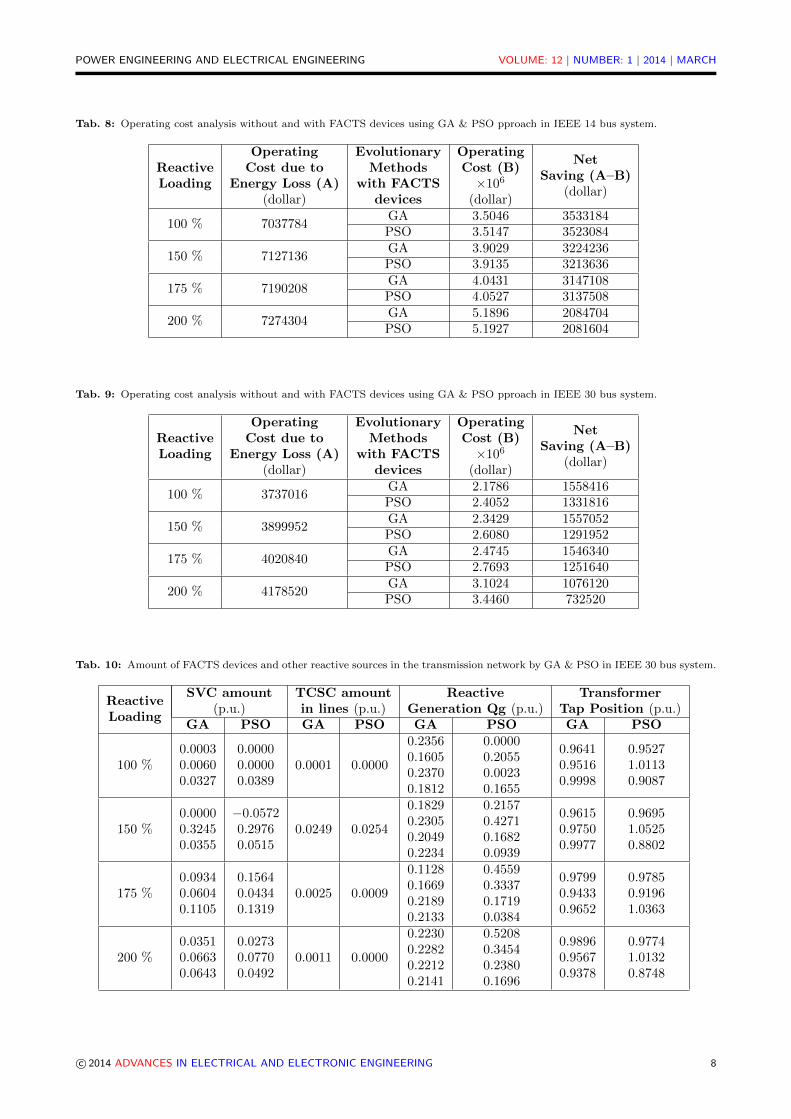
Tab. 4: Active power loss without & with FACTS devices in IEEE 14 bus system.
ReactiveReactive
Active PowerLoss without
FACTS(p.u.)
Active PowerLoss with
FACTS usingGA
(p.u.)
Active PowerLoss with
FACTS usingPSO(p.u.)
100 % 0.1339 0.0666 0.0668150 % 0.1356 0.0734 0.0734175 % 0.1368 0.0763 0.0763200 % 0.1384 0.0983 0.0984
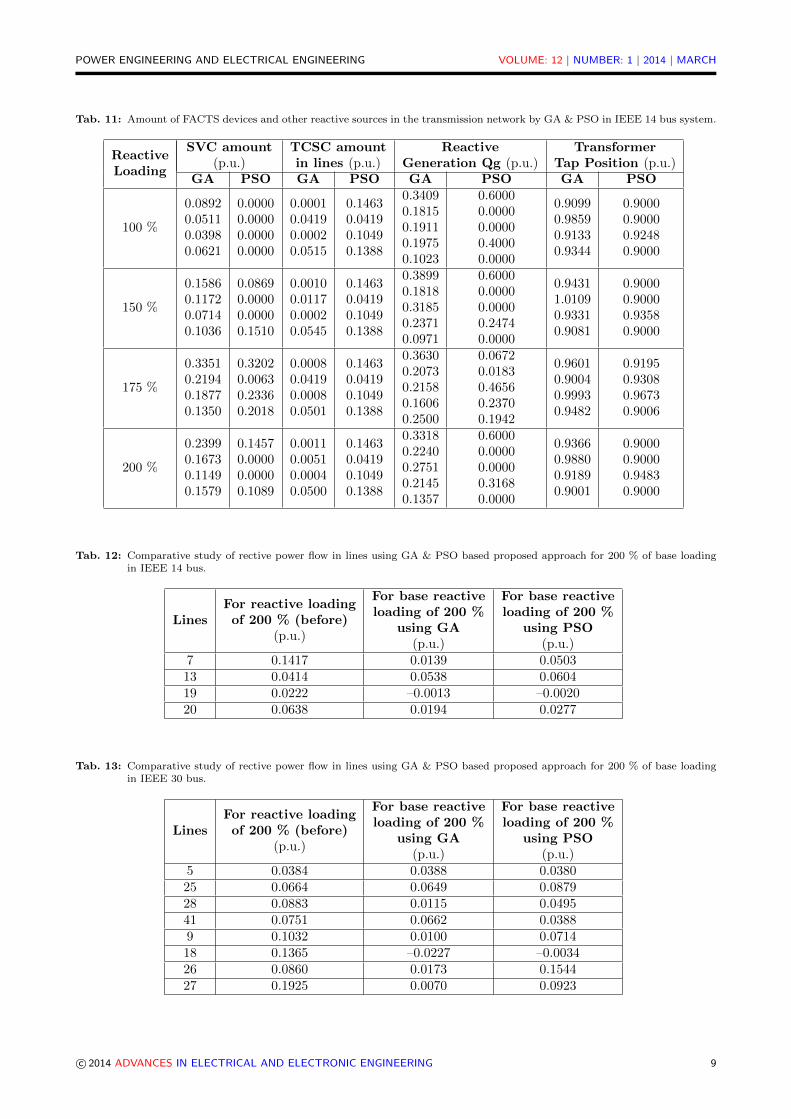
Tab. 5: Active power loss without & with FACTS devices in IEEE 30 bus system.
ReactiveReactive
Active PowerLoss without
FACTS(p.u.)
Active PowerLoss with
FACTS usingGA
(p.u.)
Active PowerLoss with
FACTS usingPSO(p.u.)
100 % 0.0711 0.0406 0.0445150 % 0.0742 0.0433 0.0478175 % 0.0765 0.0448 0.0497200 % 0.0795 0.0573 0.0637
Tab. 6: Bus voltages & phase angles without and with FACTS devices for 200 % reactive loading in IEEE 14 bus system.
Bus.No.
BusVoltagewithoutFACTS
BusAnglewithoutFACTS
EvolutionaryMethods
with FACTSdevices
BusVoltagewith
FACTS
BusAnglewith
FACTS
10 1.0232 −0.2612GA 1.0454 −0.2633PSO 1.0444 −0.2631
13 1.0386 −0.2612GA 1.0510 −0.2691PSO 1.0513 −0.2689
14 1.0066 −0.2764GA 1.0361 −0.2830PSO 1.0334 −0.2818
Tab. 7: Bus voltages & phase angles without and with FACTS devices for 200 % reactive loading in IEEE 30 bus system.
Bus.No.
BusVoltagewithoutFACTS
BusAnglewithoutFACTS
EvolutionaryMethods
with FACTSdevices
BusVoltagewith
FACTS
BusAnglewith
FACTS
7 1.0014 −0.1391GA 1.0082 −0.1413PSO 0.9952 −0.1383
15 1.0036 −0.1797GA 1.0747 −0.1746PSO 1.0574 −0.1711
17 1.0050 −0.1775GA 1.0797 −0.1733PSO 1.0662 −0.1696
21 0.9959 −0.1816GA 1.0771 −0.1800PSO 1.0684 −0.1773
c© 2014 ADVANCES IN ELECTRICAL AND ELECTRONIC ENGINEERING 7
POWER ENGINEERING AND ELECTRICAL ENGINEERING VOLUME: 12 | NUMBER: 1 | 2014 | MARCH
Tab. 8: Operating cost analysis without and with FACTS devices using GA & PSO pproach in IEEE 14 bus system.
ReactiveLoading
OperatingCost due to
Energy Loss (A)(dollar)
EvolutionaryMethods
with FACTSdevices
OperatingCost (B)
×106
(dollar)
NetSaving (A–B)
(dollar)
100 % 7037784GA 3.5046 3533184PSO 3.5147 3523084
150 % 7127136GA 3.9029 3224236PSO 3.9135 3213636
175 % 7190208GA 4.0431 3147108PSO 4.0527 3137508
200 % 7274304GA 5.1896 2084704PSO 5.1927 2081604
Tab. 9: Operating cost analysis without and with FACTS devices using GA & PSO pproach in IEEE 30 bus system.
ReactiveLoading
OperatingCost due to
Energy Loss (A)(dollar)
EvolutionaryMethods
with FACTSdevices
OperatingCost (B)
×106
(dollar)
NetSaving (A–B)
(dollar)
100 % 3737016GA 2.1786 1558416PSO 2.4052 1331816
150 % 3899952GA 2.3429 1557052PSO 2.6080 1291952
175 % 4020840GA 2.4745 1546340PSO 2.7693 1251640
200 % 4178520GA 3.1024 1076120PSO 3.4460 732520
Tab. 10: Amount of FACTS devices and other reactive sources in the transmission network by GA & PSO in IEEE 30 bus system.
ReactiveLoading
SVC amount(p.u.)
TCSC amountin lines (p.u.)
ReactiveGeneration Qg (p.u.)
TransformerTap Position (p.u.)
GA PSO GA PSO GA PSO GA PSO
100 %0.00030.00600.0327
0.00000.00000.0389
0.0001 0.0000
0.23560.16050.23700.1812
0.00000.20550.00230.1655
0.96410.95160.9998
0.95271.01130.9087
150 %0.00000.32450.0355
−0.05720.29760.0515
0.0249 0.0254
0.18290.23050.20490.2234
0.21570.42710.16820.0939
0.96150.97500.9977
0.96951.05250.8802
175 %0.09340.06040.1105
0.15640.04340.1319
0.0025 0.0009
0.11280.16690.21890.2133
0.45590.33370.17190.0384
0.97990.94330.9652
0.97850.91961.0363
200 %0.03510.06630.0643
0.02730.07700.0492
0.0011 0.0000
0.22300.22820.22120.2141
0.52080.34540.23800.1696
0.98960.95670.9378
0.97741.01320.8748
c© 2014 ADVANCES IN ELECTRICAL AND ELECTRONIC ENGINEERING 8
POWER ENGINEERING AND ELECTRICAL ENGINEERING VOLUME: 12 | NUMBER: 1 | 2014 | MARCH
Tab. 11: Amount of FACTS devices and other reactive sources in the transmission network by GA & PSO in IEEE 14 bus system.
ReactiveLoading
SVC amount(p.u.)
TCSC amountin lines (p.u.)
ReactiveGeneration Qg (p.u.)
TransformerTap Position (p.u.)
GA PSO GA PSO GA PSO GA PSO
100 %
0.08920.05110.03980.0621
0.00000.00000.00000.0000
0.00010.04190.00020.0515
0.14630.04190.10490.1388
0.34090.18150.19110.19750.1023
0.60000.00000.00000.40000.0000
0.90990.98590.91330.9344
0.90000.90000.92480.9000
150 %
0.15860.11720.07140.1036
0.08690.00000.00000.1510
0.00100.01170.00020.0545
0.14630.04190.10490.1388
0.38990.18180.31850.23710.0971
0.60000.00000.00000.24740.0000
0.94311.01090.93310.9081
0.90000.90000.93580.9000
175 %
0.33510.21940.18770.1350
0.32020.00630.23360.2018
0.00080.04190.00080.0501
0.14630.04190.10490.1388
0.36300.20730.21580.16060.2500
0.06720.01830.46560.23700.1942
0.96010.90040.99930.9482
0.91950.93080.96730.9006
200 %
0.23990.16730.11490.1579
0.14570.00000.00000.1089
0.00110.00510.00040.0500
0.14630.04190.10490.1388
0.33180.22400.27510.21450.1357
0.60000.00000.00000.31680.0000
0.93660.98800.91890.9001
0.90000.90000.94830.9000
Tab. 12: Comparative study of rective power flow in lines using GA & PSO based proposed approach for 200 % of base loadingin IEEE 14 bus.
LinesFor reactive loadingof 200 % (before)
(p.u.)
For base reactiveloading of 200 %
using GA(p.u.)
For base reactiveloading of 200 %
using PSO(p.u.)
7 0.1417 0.0139 0.050313 0.0414 0.0538 0.060419 0.0222 –0.0013 –0.002020 0.0638 0.0194 0.0277
Tab. 13: Comparative study of rective power flow in lines using GA & PSO based proposed approach for 200 % of base loadingin IEEE 30 bus.
LinesFor reactive loadingof 200 % (before)
(p.u.)
For base reactiveloading of 200 %
using GA(p.u.)
For base reactiveloading of 200 %
using PSO(p.u.)
5 0.0384 0.0388 0.038025 0.0664 0.0649 0.087928 0.0883 0.0115 0.049541 0.0751 0.0662 0.03889 0.1032 0.0100 0.071418 0.1365 –0.0227 –0.003426 0.0860 0.0173 0.154427 0.1925 0.0070 0.0923
c© 2014 ADVANCES IN ELECTRICAL AND ELECTRONIC ENGINEERING 9
POWER ENGINEERING AND ELECTRICAL ENGINEERING VOLUME: 12 | NUMBER: 1 | 2014 | MARCH
Fig. 5: Variations of operating cost with generation for 200 % ofbase reactive loading with PSO in IEEE 14 bus system.
Fig. 6: Variations of operating cost with generation for 200 % ofbase reactive loading with PSO in IEEE 30 bus system.
Fig. 7: Single line diagram of IEEE 14 bus system.
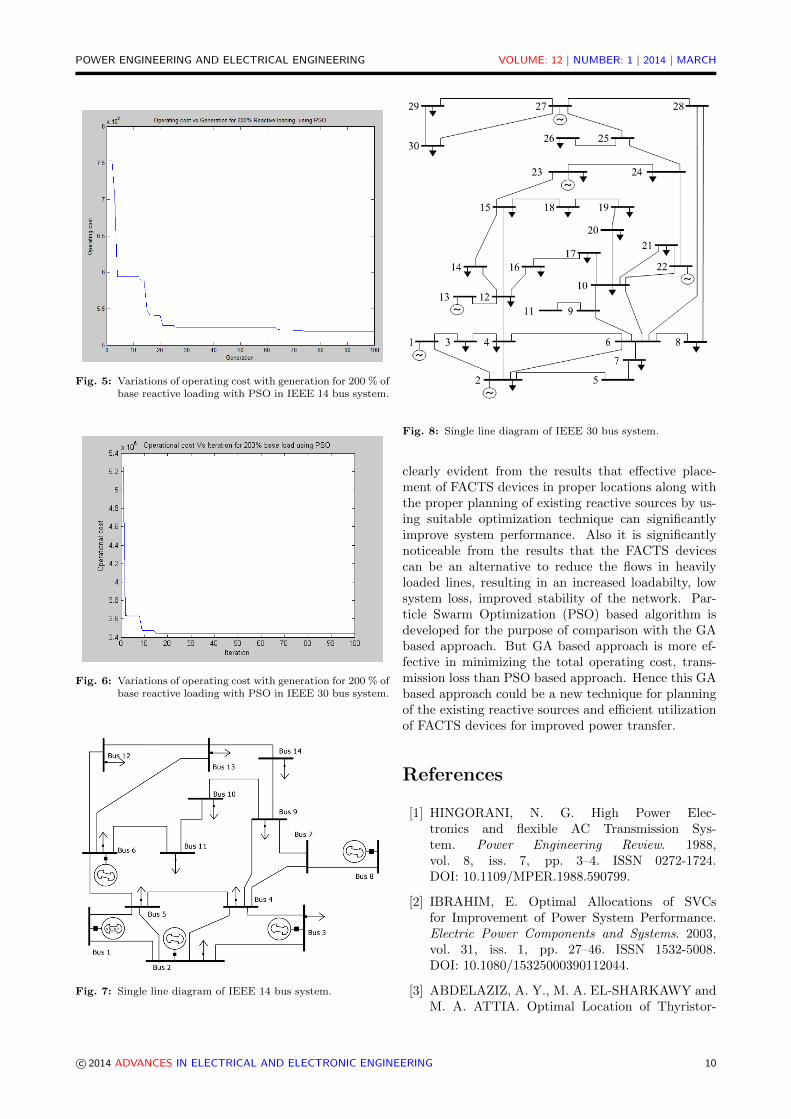
Fig. 8: Single line diagram of IEEE 30 bus system.
clearly evident from the results that effective place-ment of FACTS devices in proper locations along withthe proper planning of existing reactive sources by us-ing suitable optimization technique can significantlyimprove system performance. Also it is significantlynoticeable from the results that the FACTS devicescan be an alternative to reduce the flows in heavilyloaded lines, resulting in an increased loadabilty, lowsystem loss, improved stability of the network. Par-ticle Swarm Optimization (PSO) based algorithm isdeveloped for the purpose of comparison with the GAbased approach. But GA based approach is more ef-fective in minimizing the total operating cost, trans-mission loss than PSO based approach. Hence this GAbased approach could be a new technique for planningof the existing reactive sources and efficient utilizationof FACTS devices for improved power transfer.
References
[1] HINGORANI, N. G. High Power Elec-tronics and flexible AC Transmission Sys-tem. Power Engineering Review. 1988,vol. 8, iss. 7, pp. 3–4. ISSN 0272-1724.DOI: 10.1109/MPER.1988.590799.
[2] IBRAHIM, E. Optimal Allocations of SVCsfor Improvement of Power System Performance.Electric Power Components and Systems. 2003,vol. 31, iss. 1, pp. 27–46. ISSN 1532-5008.DOI: 10.1080/15325000390112044.
[3] ABDELAZIZ, A. Y., M. A. EL-SHARKAWY andM. A. ATTIA. Optimal Location of Thyristor-
c© 2014 ADVANCES IN ELECTRICAL AND ELECTRONIC ENGINEERING 10
POWER ENGINEERING AND ELECTRICAL ENGINEERING VOLUME: 12 | NUMBER: 1 | 2014 | MARCH
controlled Series Compensators in Power Systemsfor Increasing Loadability by Genetic Algorithm.Electric Power Components and Systems. 2011,vol. 39, iss. 13, pp. 1373–1387. ISSN 1532-5008.DOI: 10.1080/15325008.2011.584108.
[4] PREEDAVICHIT, P. and S. C. SRIVASTAVA.Optimal reactive power dispatch consideringFACTS devices. Electric Power Systems Research.1998, vol. 46, iss. 3, pp. 251–257. ISSN 0378-7796.DOI: 10.1016/S0378-7796(98)00075-3.
[5] BHATTACHARYYA, B., S. K. GOSWAMI andR. C. BANSAL. Loss Sensitivity Approach in Evo-lutionary Algorithms for Reactive Power Plan-ning. Electric Power Components and Systems.2009, vol. 37, iss. 3, pp. 287–299. ISSN 0378-7796.DOI: 10.1080/15325000802454468.
[6] CHUNG, T. S. and Y. Z. LI. A hybridGA approach for OPF with consideration ofFACTS devices. Power Engineering Review. 2000,vol. 20, iss. 8, pp. 54–57. ISSN 0272-1724.DOI: 10.1109/39.857456.
[7] OSMAN, M. S., M. A. ABO-SINNA and A.A. MOUSA. A solution to the optimal powerflow using genetic algorithm. Applied Mathemat-ics and Computation. 2004, vol. 155, iss. 2, pp.391–405. ISSN 0096-3003. DOI: 10.1016/S0096-3003(03)00785-9.
[8] GERBEX, S., R. CHERKAOUI a A. J. GER-MOND. Optimal location of multi-type FACTSdevices in a power system by means of genetic al-gorithms. Transactions on Power Systems. 2001,vol. 16, iss. 3, pp. 537–544. ISSN 0885-8950.DOI: 10.1109/59.932292.
[9] RASHED, G. I. and Y. SUN. Optimal Placementof Thyristor Controlled Series Compensation forEnhancing Power System Security Based on Com-putational Intelligence Techniques. Procedia En-gineering. 2011, vol. 15, pp. 908–914. ISSN 1877-7058. DOI: 10.1016/j.proeng.2011.08.168.
[10] NAGALAKSHMI, S. and N. KAMARAJ.Comparison of computational intelligencealgorithms for loadability enhancement ofrestructured power system with FACTS de-vices. Swarm and Evolutionary Computation.2012, vol. 5, pp. 17–27. ISSN 2210-6502.DOI: 10.1016/j.swevo.2012.02.002.
[11] IWARI, P. K. and Y. R. SOOD. Optimal loca-tion of FACTS devices in power system using Ge-netic Algorithm. In World Congress on Nature& Biologically Inspired Computing. Coimbatore:IEEE, 2009, pp. 1034–1040. ISBN 978-1-4244-5053-4. DOI: 10.1109/NABIC.2009.5393860.
[12] DAS, D. Reactive power compensation for ra-dial distribution networks using genetic algorithm.International Journal of Electrical Power. 2002,vol. 24, iss. 7, pp. 573–581. ISSN 0142-0615.DOI: 10.1016/S0142-0615(01)00068-0.
[13] LIE, T. T. and W. DENG. Optimal flexible ACtransmission systems (FACTS) devices allocation.International Journal of Electrical Power. 1997,vol. 19, iss. 2, pp. 125–134. ISSN 0142-0615. DOI:10.1016/S0142-0615(96)00036-1.
[14] VITORINO, R. M., H. M. JORGE and L.P. NEVES. Loss and reliability optimiza-tion for power distribution system oper-ation. Electric Power Systems Research.2013, vol. 96, pp. 177–184. ISSN 0378-7796.DOI: 10.1016/j.epsr.2012.11.002.
[15] GHAHREMANI, Esmaeil a Innocent KAMWA.Optimal placement of multiple-type FACTS de-vices to maximize power system loadability us-ing a generic graphical user interface. Transac-tions on Power Systems. 2013, vol. 28, iss. 2,pp. 764–778. ISSN 0885-8950. DOI: 10.1109/TP-WRS.2012.2210253.
[16] RASHED, G. I., Y. SUN a H. I. SHAHEEN. Op-timal Location and Parameter Setting of TCSCfor Loss Minimization Based on Differential Evo-lution and Genetic Algorithm. Physics Procedia.2012, vol. 33, pp. 1864–1878. ISSN 1875-3892.DOI: 10.1016/j.phpro.2012.05.296.
[17] ABUL’WAFA, A. R. Optimal capacitor allocationin radial distribution systems for loss reduction:A two stage method. Electric Power Systems Re-search. 2013, vol. 95, pp. 168–174. ISSN 0378-7796. DOI: 10.1016/j.epsr.2012.09.004.
[18] CAI, L. J., I. ERLICH and G. STAMTSIS.Optimal choice and allocation of FACTS de-vices in deregulated electricity market usinggenetic algorithms. In: Power Systems Con-ference and Exposition. New York: IEEE,2004, pp. 815–821. ISBN 0-7803-8718-X.DOI: 10.1109/PSCE.2004.1397562.
[19] GOLDBERG, D. E. Genetic algorithms in search,optimization, and machine learning. Boston:Addison-Wesley, 1989. ISBN 02-011-5767-5.
About Authors
Biplab BHATTACHARYYA born in 9th January,1970. He is currently working as Associate Professorof Electrical Engineering in the Indian School ofMines University, Dhanbad, India. He has joined in
c© 2014 ADVANCES IN ELECTRICAL AND ELECTRONIC ENGINEERING 11

POWER ENGINEERING AND ELECTRICAL ENGINEERING VOLUME: 12 | NUMBER: 1 | 2014 | MARCH
the Electrical Engineering department as AssistantProfessor in the year of 2007. Then he promoted tothe post of Associate Professor on 2010. He had serveddepartment of Electrical Engineering of National In-stitute of Technology, Durgapur, India for six years assenior Lecturer. He was in the position of Lecturer inthe Electrical Engineering department of BITS, Pilani,Rajasthan, India for nearly one year. He worked asAssistant Engineer (Electrical Test), in a reputed cableindustry for nearly three years. He obtained B.Sc(Hons) in Physics from Calcutta University, India in1990. He obtained his B-Tech and M-Tech degree inthe field of Electrical machines and Power system fromCalcutta University in 1993 and 1995 respectively.He obtained his Phd degree in Engineering fromthe department of Electrical Engineering, JadavpurUniversity, India in 2006. He has published severaltechnical papers in international/national journalsand conference proceedings. His research area mainly
includes Evolutionary approaches, Power systemoptimization, Planning, Dispatch, FACTS devices.
Vikash Kumar GUPTA born in 9th January1984. He received B. E. degree Anna University,Chennai in 2009, and the M.Tech degree from B.I.T.Sindri, Dhnabad, Jharkhand in 2011. Currently, heis the Research Scholar in the Electrical EngineeringDepartment, Indian School of Mines, Dhanbad, Jhark-hand. His area of interest is Power System.
Sanjay KUMAR born in 5th June 1980. Hereceived B.Tech degree from N.I.T Jamshedpur in2006, M.Tech from N.I.T Patna in 2010. He hashaving two years of teaching experience and currently,he is the Research Scholar in the Electrical Engineer-ing Department, Indian School of Mines, Dhanbad,Jharkhand.
c© 2014 ADVANCES IN ELECTRICAL AND ELECTRONIC ENGINEERING 12