A New Growing Method for Simplex-Based Endmember ...
16
2804 IEEE TRANSACTIONS ON GEOSCIENCE AND REMOTE SENSING, VOL. 44, NO. 10, OCTOBER 2006 A New Growing Method for Simplex-Based Endmember Extraction Algorithm Chein-I Chang, Senior Member, IEEE, Chao-Cheng Wu, Student Member, IEEE, Wei-min Liu, Student Member, IEEE, and Yen-Chieh Ouyang, Member, IEEE Abstract—A new growing method for simplex-based endmem- ber extraction algorithms (EEAs), called simplex growing algo- rithm (SGA), is presented in this paper. It is a sequential algorithm to find a simplex with the maximum volume every time a new vertex is added. In order to terminate this algorithm a recently developed concept, virtual dimensionality (VD), is implemented as a stopping rule to determine the number of vertices required for the algorithm to generate. The SGA improves one commonly used EEA, the N-finder algorithm (N-FINDR) developed by Winter, by including a process of growing simplexes one vertex at a time until it reaches a desired number of vertices estimated by the VD, which results in a tremendous reduction of computational complexity. Additionally, it also judiciously selects an appropriate initial vec- tor to avoid a dilemma caused by the use of random vectors as its initial condition in the N-FINDR where the N-FINDR generally produces different sets of final endmembers if different sets of randomly generated initial endmembers are used. In order to demonstrate the performance of the proposed SGA, the N-FINDR and two other EEAs, pixel purity index, and vertex component analysis are used for comparison. Index Terms—Endmember extraction, N-finder algorithm (N-FINDR), pixel purity index (PPI), sequential endmember ex- traction algorithm (SQEEA), simplex growing algorithm (SGA), simultaneous endmember extraction algorithm (SMEEA), vertex component analysis (VCA), virtual dimensionality (VD). I. I NTRODUCTION E NDMEMBER extraction has become increasingly impor- tant in hyperspectral image analysis due to significantly improved high spatial and spectral resolution provided by hy- perspectral imaging sensors. According to the definition given in [1], an endmember is an idealized, pure signature for a class. For multispectral imagery, an endmember may be difficult to find since most image pixels are heavily mixed because of low spatial and spectral resolution. As a result, the importance of endmember extraction has been overlooked, and its issue has Manuscript received October 1, 2005; revised July 12, 2006. C.-I Chang is with the Remote Sensing Signal and Image Processing Labora- tory, Department of Computer Science and Electrical Engineering, University of Maryland, Baltimore County, Baltimore, MD 21250 USA, and also with the Department of Electrical Engineering, National Chung Hsing University, Taichung 402, Taiwan, R.O.C. (e-mail: [email protected]). C.-C. Wu and W. Liu are with the Remote Sensing Signal and Image Process- ing Laboratory, Department of Computer Science and Electrical Engineer- ing, University of Maryland, Baltimore County, Baltimore, MD 21250 USA (e-mail: [email protected]; [email protected]). Y.-C. Ouyang is with Department of Electrical Engineering, Na- tional Chung Hsing University, Taichung 402, Taiwan, R.O.C. (e-mail: [email protected]). Digital Object Identifier 10.1109/TGRS.2006.881803 not been a major subject in multispectral image analysis. By contrast, with advances of hyperspectral imaging sensors many subtle material substances that cannot be resolved by multispec- tral imagery can now be uncovered by hyperspectral imagery. These substances are generally not known a priori and can be only diagnosed by high spectral resolution. Endmembers are considered to one type of such substances where their existence in image data cannot be detected visually. Most importantly, once endmembers are present, they may generally appear as anomalies since their population is relatively small. Because of such characteristics, finding endmembers is very challeng- ing. Many algorithms have been developed for this purpose, such as the pixel purity index (PPI) [2], N-finder algorithm (N-FINDR) [3], iterative error analysis (IEA) [4], automated morphological endmember extraction (AMEE) algorithm [5], minimum volume transform (MVT) [6], convex geometry [7], convex cone analysis (CCA) [8], vertex component analysis (VCA) [9], which can be categorized into two classes, simulta- neous endmember extraction algorithms (SMEEAs) including PPI, N-FINDR, MVT, CCA, convex geometry, and sequential endmember extraction algorithms (SQEEAs) including IEA, AMEE, and VCA. Technically speaking, an optimal endmem- ber extraction algorithm (EEA) must be an SMEEA. This is because all the endmembers should be selected all together at one time rather than one after another sequentially. However, finding simultaneously endmembers generally requires tremen- dous computational complexity due to exhaustive search. On the other hand, despite the fact that an SQEEA may not be as optimal as an SMEEA can be, a well-designed SQEEA may be able to perform as well as an SMEEA can. The most advantage benefited from an SQEEA is the significant reduction of computation complexity. A key idea to design an EEA is to use convexity of the data structure. One such approach is simplex-based methods, which find an appropriate set of vertices that represents desired endmembers in some optimal sense. Among these algorithms is the widely used N-FINDR developed by Winter [3], which finds a simplex of the maximum volume with a given number of vertices p. It is based on an assumption that for a given (p − 1)-dimensional simplex, the simplex that yields the largest volume will be the one whose p vertices are most likely specified by purest pixels. The vertices of an N-FINDR-found simplex are the desired set of endmembers. Unfortunately, there are several disadvantages of implementing the N-FINDR. One is that there is no provided criterion to determine how many endmembers for the N-FINDR to generate. Another is 0196-2892/$20.00 © 2006 IEEE
Transcript of A New Growing Method for Simplex-Based Endmember ...
2804 IEEE TRANSACTIONS ON GEOSCIENCE AND REMOTE SENSING, VOL. 44, NO. 10, OCTOBER 2006
A New Growing Method for Simplex-BasedEndmember Extraction Algorithm
Chein-I Chang, Senior Member, IEEE, Chao-Cheng Wu, Student Member, IEEE,Wei-min Liu, Student Member, IEEE, and Yen-Chieh Ouyang, Member, IEEE
Abstract—A new growing method for simplex-based endmem-ber extraction algorithms (EEAs), called simplex growing algo-rithm (SGA), is presented in this paper. It is a sequential algorithmto find a simplex with the maximum volume every time a newvertex is added. In order to terminate this algorithm a recentlydeveloped concept, virtual dimensionality (VD), is implemented asa stopping rule to determine the number of vertices required forthe algorithm to generate. The SGA improves one commonly usedEEA, the N-finder algorithm (N-FINDR) developed by Winter, byincluding a process of growing simplexes one vertex at a time untilit reaches a desired number of vertices estimated by the VD, whichresults in a tremendous reduction of computational complexity.Additionally, it also judiciously selects an appropriate initial vec-tor to avoid a dilemma caused by the use of random vectors as itsinitial condition in the N-FINDR where the N-FINDR generallyproduces different sets of final endmembers if different sets ofrandomly generated initial endmembers are used. In order todemonstrate the performance of the proposed SGA, the N-FINDRand two other EEAs, pixel purity index, and vertex componentanalysis are used for comparison.
Index Terms—Endmember extraction, N-finder algorithm(N-FINDR), pixel purity index (PPI), sequential endmember ex-traction algorithm (SQEEA), simplex growing algorithm (SGA),simultaneous endmember extraction algorithm (SMEEA), vertexcomponent analysis (VCA), virtual dimensionality (VD).
I. INTRODUCTION
ENDMEMBER extraction has become increasingly impor-tant in hyperspectral image analysis due to significantly
improved high spatial and spectral resolution provided by hy-perspectral imaging sensors. According to the definition givenin [1], an endmember is an idealized, pure signature for a class.For multispectral imagery, an endmember may be difficult tofind since most image pixels are heavily mixed because of lowspatial and spectral resolution. As a result, the importance ofendmember extraction has been overlooked, and its issue has
Manuscript received October 1, 2005; revised July 12, 2006.C.-I Chang is with the Remote Sensing Signal and Image Processing Labora-
tory, Department of Computer Science and Electrical Engineering, Universityof Maryland, Baltimore County, Baltimore, MD 21250 USA, and also withthe Department of Electrical Engineering, National Chung Hsing University,Taichung 402, Taiwan, R.O.C. (e-mail: [email protected]).
C.-C. Wu and W. Liu are with the Remote Sensing Signal and Image Process-ing Laboratory, Department of Computer Science and Electrical Engineer-ing, University of Maryland, Baltimore County, Baltimore, MD 21250 USA(e-mail: [email protected]; [email protected]).
Y.-C. Ouyang is with Department of Electrical Engineering, Na-tional Chung Hsing University, Taichung 402, Taiwan, R.O.C. (e-mail:[email protected]).
Digital Object Identifier 10.1109/TGRS.2006.881803
not been a major subject in multispectral image analysis. Bycontrast, with advances of hyperspectral imaging sensors manysubtle material substances that cannot be resolved by multispec-tral imagery can now be uncovered by hyperspectral imagery.These substances are generally not known a priori and can beonly diagnosed by high spectral resolution. Endmembers areconsidered to one type of such substances where their existencein image data cannot be detected visually. Most importantly,once endmembers are present, they may generally appear asanomalies since their population is relatively small. Becauseof such characteristics, finding endmembers is very challeng-ing. Many algorithms have been developed for this purpose,such as the pixel purity index (PPI) [2], N-finder algorithm(N-FINDR) [3], iterative error analysis (IEA) [4], automatedmorphological endmember extraction (AMEE) algorithm [5],minimum volume transform (MVT) [6], convex geometry [7],convex cone analysis (CCA) [8], vertex component analysis(VCA) [9], which can be categorized into two classes, simulta-neous endmember extraction algorithms (SMEEAs) includingPPI, N-FINDR, MVT, CCA, convex geometry, and sequentialendmember extraction algorithms (SQEEAs) including IEA,AMEE, and VCA. Technically speaking, an optimal endmem-ber extraction algorithm (EEA) must be an SMEEA. This isbecause all the endmembers should be selected all together atone time rather than one after another sequentially. However,finding simultaneously endmembers generally requires tremen-dous computational complexity due to exhaustive search. Onthe other hand, despite the fact that an SQEEA may not beas optimal as an SMEEA can be, a well-designed SQEEAmay be able to perform as well as an SMEEA can. The mostadvantage benefited from an SQEEA is the significant reductionof computation complexity.
A key idea to design an EEA is to use convexity of thedata structure. One such approach is simplex-based methods,which find an appropriate set of vertices that represents desiredendmembers in some optimal sense. Among these algorithmsis the widely used N-FINDR developed by Winter [3], whichfinds a simplex of the maximum volume with a given numberof vertices p. It is based on an assumption that for a given(p− 1)-dimensional simplex, the simplex that yields the largestvolume will be the one whose p vertices are most likelyspecified by purest pixels. The vertices of an N-FINDR-foundsimplex are the desired set of endmembers. Unfortunately,there are several disadvantages of implementing the N-FINDR.One is that there is no provided criterion to determine howmany endmembers for the N-FINDR to generate. Another is
0196-2892/$20.00 © 2006 IEEE

CHANG et al.: NEW GROWING METHOD FOR SIMPLEX-BASED ENDMEMBER EXTRACTION 2805
that the N-FINDR uses randomly generated vectors as initialendmembers, which are not an effective way to initialize thealgorithm. It generally takes a long time to find a desired setof endmembers. Most importantly, due to the nature in theuse of random initial endmembers the N-FINDR generallyproduces different sets of final endmembers at separate runs.Accordingly, how many runs that the N-FINDR must beperformed and which set of final generated endmembers by theN-FINDR should be selected as a desired set of endmembersbecome issues in endmember extraction despite that manyof them may be overlapped. Additionally, it is an SMEEAand requires enormous computation to conduct an exhaustivesearch to find its final set of endmembers. Inspired by theN-FINDR and its drawbacks this paper presents a simplexgrowing algorithm (SGA) that can be used to resolve theseissues commonly encountered in simplex-based algorithms.
As for the first issue in determination of the number ofendmembers required to be generated p, there is no guidelinesuggested in many EEAs [2]–[8]. This issue has been leftopen. In the SGA, a newly developed concept, called virtualdimensionality (VD) [10], [11], which has recently shownsuccess in determination of the number of endmembers forendmember extraction [9], [12], [13], is proposed to estimatesuch p. Most recently, a linear mixture model-based leastsquares error method was proposed to estimate signal subspacein hyperspectral imagery [14]. This method, referred to assignal subspace estimation (SSE) in this paper, can be also usedto estimate p. Once p is determined, the N-FINDR starts witha set of p random initial vertices and repeatedly calculates thevolumes of new simplexes with new vertex replacements untilit finds a simplex with the largest volume. Since the N-FINDRis an SMEEA, the entire process must be repeated over againwhen each replacement is taken place. Therefore, if the numberp is large, the N-FINDR becomes very slow. Our proposedSGA takes a rather different approach. It finds a desired(p− 1)-dimensional simplex with the largest volume by gradu-ally growing simplexes vertex by vertex. In other words, insteadof making an attempt to directly find a p-vertex simplex withthe maximum volume, it first finds a two-vertex simplex withthe largest volume from which it begins to grow new simplexeswith the largest volumes by increasing vertices from 2 to p.Since it generates desired endmembers one by one through asimplex growing process, the SGA is an SQEEA. With sucha simplex growing implementation, the SGA only has to findone endmember at a time until it reaches a desired number ofendmembers, which is the VD-estimated p. This is completelydifferent from the N-FINDR, which is an SMEEA and replacesvertices of simplexes with a number of newfound verticesrepeatedly. A third issue for the N-FINDR is a consequenceresulting from its use of random vectors as initial endmembers.If the N-FINDR is rerun again, it is most likely that a differentset of final endmembers is generated due to the use of adifferent set of random initial vectors. The SGA resolves thisissue by judiciously selecting the initial vectors to initialize thealgorithm. Accordingly, the final generated set of endmembersis always the same and consistent.
Incidentally, a recent VCA approach developed in [9] issimilar to the SGA from two aspects. Both use the VD to
estimate the number of endmembers required to be generated.Besides, both also grow simplexes gradually vertex by vertex tofind desired endmembers. However, there are also two distinctfeatures between the VCA and the SGA. The VCA repeatedlyperforms orthogonal subspace projections resulting from asequence of gradual growing simplexes vertex by vertex to findnew vertices. By contrast, the SGA finds maximum volumesfor a sequence of gradual growing simplexes vertex by vertex.Furthermore, the SGA develops a specific algorithm to generateinitial endmembers so that the final selection of endmembers bythe SGA is consistent regardless of how many runs the SGA isimplemented. But, like the N-FINDR, the VCA makes use of azero-mean Gaussian distribution to generate a random vector asits initial projection for each simplex it grows. As a result, theVCA suffers from the same drawback as does the N-FINDR.That is, final sets of endmembers generated by the VCA indifferent runs are usually not consistent.
In order to demonstrate the performance of the proposedSGA, a comparative analysis among the SGA, PPI, N-FINDR,and VCA is conducted via synthetic image-based computersimulations as well as two real hyperspectral image data whereexperimental results show that the SGA generally performssignificantly better than the N-FINDR in terms of resolving theissues addressed above and also comparable or slightly betterthan the VCA.
The remainder of this paper is organized as follows.Section II describes an implementation of the N-FINDR de-veloped by Winter [3]. Section III presents a new simplexgrowing method for endmember extraction, called an SGA.Section IV compares the computational complexity among thePPI, VCA, N-FINDR, and SGA. Sections V and VI conducta comparative study among the PPI, N-FINDR, VCA, andSGA via synthetic image-based computer simulations and realhyperspectral image experiments for performance analysis andevaluation. Section VII makes concluding remarks.
II. N-FINDER ALGORITHM
The main idea of N-FINDR is to assume that a (p− 1)-dimensional volume formed by a simplex with p vertices thatare specified by the purest pixels is always larger than thatformed by another combination of p pixels. N-FINDR wasbriefly described in [3]. Unfortunately, a detailed step-by-stepalgorithmic implementation was not provided in [3]. In this sec-tion, we summarize the steps to implement N-FINDR accordingto our understanding and experience as follows. It by no meansclaims that our interpreted N-FINDR is identical to the onedeveloped by Winter [3]. Nevertheless, the idea used in bothalgorithms should be the same.
N-FINDR
1) Preprocessing:a) let p be the number of endmembers required to gener-
ate; andb) apply a maximum noise fraction (MNF) transforma-
tion [or called noise-adjusted principal component(NAPC)] to reduce the data dimensionality from L top− 1 where L is the total number of spectral bands.

2806 IEEE TRANSACTIONS ON GEOSCIENCE AND REMOTE SENSING, VOL. 44, NO. 10, OCTOBER 2006
2) Initialization: Let {e(0)1 , e(0)
2 , . . . , e(0)p } be a set of initial
vectors randomly generated from the data.3) At iteration k ≥ 0, find V (e(k)
1 , e(k)2 , . . . , e(k)
p ) defined by
V(e(k)1 , . . . , e(k)
p
)=
∣∣∣∣det[
1 1 . . . 1e(k)1 e(k)
2 . . . e(k)p
]∣∣∣∣(p− 1)!
(1)
which is the volume of the simplex with verticese(k)1 , e(k)
2 , . . . , e(k)p , denoted by S(e(k)
1 , e(k)2 , . . . , e(k)
p ).4) Stopping rule: For each sample vector r, we re-
calculate V (r, e(k)2 , . . . , e(k)
p ), V (e(k)1 , r, e(k)
3 , . . . , e(k)p ),
. . . , V (e(k)1 , . . . , e(k)
p−1, r), the volumes of p simplex-
es, S(r, e(k)2 , . . . , e(k)
p ), S(e(k)1 , r, e(k)
3 , . . . , e(k)p ), . . . ,
S(e(k)1 , e(k)
2 , . . . , e(k)p−1, r), each of which is formed
by replacing one endmember e(k)j with the sam-
ple vector r. If none of these p recalculated vol-umes, V (r, e(k)
2 , . . . , e(k)p ), V (e(k)
1 , r, e(k)3 , . . . , e(k)
p ),. . . , V (e(k)
1 , . . . , e(k)p−1, r), is greater than V (e(k)
1 ,
e(k)2 , . . . , e(k)
p ), no endmember in e(k)1 , e(k)
2 , . . . , e(k)p
will be replaced. The algorithm is terminated. Otherwise,continue.
5) Replacement rule: The endmember pixel which isabsent in the largest volume among the p sim-plexes, S(r, e(k)
2 , . . . , e(k)p ), S(e(k)
1 , r, e(k)3 , . . . , e(k)
p ),. . . , S(e(k)
1 , e(k)2 , . . . , e(k)
p−1, r), will be replaced by thesample vector r. Assume that such an endmember isdenoted by e(k+1)
j . A new set of endmembers is then
produced by letting e(k+1)j = r and e(k+1)
i = e(k)i for
i �= j. Let k ← k + 1 and go to step 3).
III. SIMPLEX GROWING ALGORITHM
Since an endmember is an idealized pure signature, it isnot necessarily an image pixel. However, in real-image experi-ments, an endmember is generally extracted directly from thedata. Therefore, when it occurs as a pixel, it is referred to asendmember pixel in this paper.
In this section, we present a new algorithm, called SGA, forendmember extraction to find a set of desired endmembers bygrowing a sequence of simplexes. It starts off with two verticesand begins to grow a simplex by increasing its vertices one at atime. The algorithm is terminated when the number of verticesreaches the number of endmembers p, which can be estimatedby the VD using a method developed by Harsanyi, Farrand,and Chang, referred to as HFC method in [10], which does notrequire noise estimation. In order to select an appropriate pixelas its initial endmember pixel, a selection process for findingthe first endmember pixel is developed for this purpose anddescribed as follows.
First Endmember Selection Process
1) Randomly generate a target pixel, denoted by t.2) Find a pixel e1 that yields the maximum of absolute
determinant of the matrix,
∣∣∣∣det[
1 1t r
]∣∣∣∣ over all sample
vectors r, i.e.,
e1 = arg{
maxr
[∣∣∣∣det[
1 1t r
]∣∣∣∣]}
where principal components analysis (PCA) or MNF isrequired to reduce the original data dimensionality L tothe dimension 2 to find the maximum.
It is worth noting that the generation of the first endmemberpixel e1 is determined by the randomly generated target pixel t.A different target pixel t may result in a different e1. Inter-estingly, the experiments show that the generated e1 is alwaysa pixel which has either a maximum or a minimum value inthe first component of dimensionality reduction (DR) trans-form. Therefore, the target pixel t has no effect on the finalset of endmembers. Furthermore, according to our extensiveexperiments, the generated e1 eventually becomes one of thefinal generated endmembers. This explains that the final setof endmembers generated by the SGA is always the same andconsistent.
Including the above first endmember selection process as apreprocessing for initialization, the SGA can be described indetail as follows.
Simplex Growing Algorithm
1) Initialization:a) use the VD to estimate the number of endmembers
to be generated p; andb) use the e1 found by the first endmember selection
process as the desired initial endmember pixel andset n = 1.
2) At n ≥ 1 and for each sample vector r, we calculateV (e1, . . . , en, r) defined by
V(e1, . . . , en, r)=
∣∣∣∣det[
1 1 . . . 1 1e1 e2 . . . en r
]∣∣∣∣n!
(2)
which is the volume of the simplex specified by verticese1, e2, . . . , en, r, denoted by S(e1, e2, . . . , en, r). Since
the matrix
[1 1 . . . 1e1 e2 . . . en
1r
]in (2) is not necessar-
ily a square matrix, a DR technique such as PCA or MNFis required to reduce the original data dimensionality L tothe dimension n.
3) Find en+1 that yields the maximum of (2), i.e.,
en+1 = arg{
maxr
[V (e1, . . . , en, r)]}
. (3)
4) Stopping rule: If n < p, then n← n + 1 and go step 2).Otherwise, the final set of {e1, e2, . . . , ep} is the desiredp endmembers.

CHANG et al.: NEW GROWING METHOD FOR SIMPLEX-BASED ENDMEMBER EXTRACTION 2807
TABLE ICOMPUTATIONAL COMPLEXITY AMONG PPI, N-FINDR, VCA, AND SGA
Fig. 1. Plots of numbers of flops versus the number of endmembers, p.
IV. COMPUTATIONAL COMPLEXITY
In this section, a comparative study is conducted on thecomputational complexity among PPI, VCA, N-FINDR, andSGA. Since the N-FINDR uses randomly generated initialendmembers, it generally results in different numbers of re-placements for different runs. Therefore, in this paper, thebest N-FINDR was used to compare against the other threealgorithms where a best N-FINDR represents a case that noreplacement is required for the initial endmembers, in whichcase the initial endmembers turned out to be the final endmem-bers. According to the calculation of computational complexityused in [9], approximate numbers of flops (i.e., numbers offloating operations) required for the four EEAs are tabulated inTable I where N is the total number of pixels, p is the numberof endmembers, and s is the number of skewers.
Since the computational complexity of performing DR andVD was relatively small and negligible, it was not includedin Table I. A best N-FINDR computed the determinant of ap× p matrix Np times and the computational complexity ofeach time was pη with 2.3 < η < 2.9. The SGA computes thedeterminant of a matrix Nn times with n starting from 2 top. The VCA projected a total of N p-dimensional data vectorsonto p orthogonal projections. The PPI projects all data vectorsonto a large number of skewers s. Fig. 1 plots the numberof flops versus p for each of the four considered EEAs withN = 104 and s = 103. As shown in Fig. 1, the number of flopsrequired for the SGA was always less than that required for abest N-FINDR where the VCA had the lowest numbers.
As a concluding remark, a note is worthwhile. In termsof operations implemented in an EEA, the SGA and theN-FINDR as a group, which perform computations of simplexvolumes as opposed to the PPI and the VCA as another group,which performs orthogonal projections. Since these two oper-
Fig. 2. Five USGS ground-truth mineral spectra.
Fig. 3. (a) Twenty-five simulated panels. (b) A synthetic image having the25 panels simulated in (a) implanted in the background with an additiveGaussian noise to achieve SNR 20 : 1.
ations are different in nature, it may not be a fair comparisonbetween these two groups. However, Fig. 1 shows that withineach group, the SGA and VCA were significantly better thanthe N-FINDR and PPI, respectively. Nevertheless, it shouldbe noted that computing an orthogonal projection is generallyfaster than that calculating a simplex volume. Accordingly, theVCA yielded the lowest computational cost if the performanceis only measured by computing time. As noted, since ourproposed SGA is improved from the N-FINDR, it is importantto conduct a comparative study on computational complexitybetween these two. The computation complexity of the PPI andVCA is included in our paper only for reference.
V. COMPUTER SIMULATIONS
In order to conduct a comprehensive comparative analysis, asynthetic image was custom-designed and simulated based onthe reflectance spectra of five U.S. Geological Survey (USGS)ground-truth mineral spectra: Alunite (A), Buddingtonite (B),Calcite (C), Kaolinite (K), and Muscovite (M) shown in Fig. 2.It should be noted that the simulated synthetic image may notbe realistic from practical applications. But it does allow us tosimulate various scenarios to explore many interesting insightsthat cannot be observed from real image experiments.
The synthetic image has size of 200 × 200 pixel vectorswith 25 panels of various sizes that are arranged in a 5 × 5

2808 IEEE TRANSACTIONS ON GEOSCIENCE AND REMOTE SENSING, VOL. 44, NO. 10, OCTOBER 2006
TABLE IISIMULATED 20 MIXED PANEL PIXELS IN THE THIRD COLUMN
TABLE IIIABUNDANCE FRACTIONS OF SUBPIXEL PANELS IN THE
FOURTH AND FIFTH COLUMNS
matrix and located at the center of the scene shown in Fig. 3(a).The five mineral spectral signatures, {mi}5i=1 in Fig. 2 wereused to simulate these 25 panels where each row of five panelswas simulated by the same mineral signature and each columnof five panels has the same size. Among 25 panels are five4 × 4 pure pixel panels for endmember extraction, pi
4×4 fori = 1, . . . , 5 in the first column, five 2× 2 pure pixel panels fortraining samples, pi
2×2 for i = 1, . . . , 5 in the second column,five 2 × 2 mixed pixel panels, {pi
3,jk}2,2j=1,k=1 for i = 1, . . . , 5
in the third column for mixed pixel classification, five subpixelpanels, pi
4,1 for i = 1, . . . , 5 in the fourth column for subpixelclassification and five subpixel panels, pi
5,1 for i = 1, . . . , 5 inthe fifth column for subpixel classification. The reason thatthe five panels in the second column were included in theimage scene was to use them as training samples for supervisedclassification. The purpose of introducing the five panels in thethird column was designed to conduct a study and analysison five mineral signatures with different mixing in a pixel.Table II tabulates the mixing details of mineral composition inthe 20 panels.
The inclusion of the panels in the fourth and fifth columnsis to investigate subpixel effect on endmember extraction andtheir simulated abundance fractions are tabulated in Table IIIwhere the background (BKG) was simulated by mixing 20%of each of five mineral signatures, A, B, C, K, and M, i.e.,20%A + 20%B + 20%C + 20%K + 20%M.
These 25 panels in Fig. 3(a) were implanted in the imagebackground in a way that the background pixels were replacedwith the implanted panel pixels. Finally, this synthetic imagewith the 25 implanted panels was corrupted by a simulatedwhite Gaussian noise to achieve signal-to-noise ratio 20 : 1defined in [10] and [15] as 50% reflectance divided by thestandard deviation of the noise. The resulting noisy synthetic is
Fig. 4. Results of PPI with two different runs using MNF and 50 skewers.(a) VD = 6. (b) SSE = 5.
shown in Fig. 3(b). For the synthetic image scene in Fig. 3(b),there are 100 pure pixels, 20 mixed pixels, and 10 subpixels,all of which were simulated by five distinct pure mineralsignatures. The VD estimated for this synthetic image was 6with PF ≤ 10−1 that include five mineral signatures, A, B, C,K, M, and the background signature made up of mixing 20% ofeach minerals, A, B, C, K, and M.
It should be noted that although the background is equallymixed by five minerals, it is indeed a signature spectrallydistinct from the five minerals. This may be due to the factthat the simulated background signature is regarded as a hybridsignature in its own instead of being considered as a mixedsignature. As a result, this hybrid signature becomes a new end-member that represents the background class. In this case, theVD counted it as one endmember. Interestingly, a linear mixturemodel-based least squares error technique recently developedin [14], called SSE can be also used for this purpose wherep was estimated to be p = 5. In order to see its performance,the results using SSE = 5 were also included in comparisonwith VD = 6. With the number of endmembers, p estimated byVD = 6 and SSE = 5, two types of EEAs, SMEEA (PPI andN-FINDR), and SQEEA (VCA and SGA) were implementedfor comparative analysis.
This experiment is to show a dilemma resulting from theuse of randomly generated initial endmembers. That is, finalendmembers selected by an EEA are inconsistent. Figs. 4–6show the final selected endmembers by PPI, N-FINDR, andVCA in two different runs, respectively, where the value of pwas estimated by VD and SSE as VD = 6 and SSE = 5. ThePPI implemented here was the one described in [2] with numberof skewers chosen to be 50.
The N-FINDR found six pixels shown in Fig. 5 where onepixel from each of five 4 × 4 panels in the first columnmarked by open circles was extracted in correspondence to

CHANG et al.: NEW GROWING METHOD FOR SIMPLEX-BASED ENDMEMBER EXTRACTION 2809
Fig. 5. Results of N-FINDR with two different runs using MNF. (a) VD = 6.(b) SSE = 5.
Fig. 6. Results of VCA in two different runs. (a) VD = 6. (b) SSE = 5.
five pure signatures, A, B, C, K, M, and one background pixelcorresponding to a mixed signature was extracted. It should benoted that since the PPI and N-FINDR are SMEEAs, its sixendmember pixels were generated simultaneously. Therefore,no numbers were shown in Figs. 4 and 5.
Due to the use of insufficient number of skewers, PPI missedone endmember that represents the signature of the mineralCalcite, but it could be improved to extract all the five end-members if 500 skewers were used [16]. Additionally, despitethat the results shown in Fig. 4 in two different runs looked thesame, their PPI counts were actually different.
Fig. 7. Results of SGA using MNF. (a) VD = 6. (b) SSE = 5.
As shown in Figs. 5–7, all three N-FINDR, VCA, and SGAsuccessfully extracted five pixels that were specified by thefive pure signatures, A, B, C, K, and M plus one differentbackground pixel that was not an endmember pixel. As alsoshown in Fig. 6, the background pixels extracted by the VCAin two different runs were different. Additionally, Fig. 6(a)and (b) further shows that the order of the five endmemberscorresponding to the five pure signatures, A, B, C, K, Mextracted by the VCA in two different runs was also different.This further demonstrated that the results produced by the VCAin different runs were not consistent.
Additionally, Figs. 6 and 7 show the endmember pixels foundby the VCA and SGA in two different runs using p = 5 and 6,respectively, where the numbers indicated the order of sixpixels extracted by the VCA and the SGA in sequence anda background signature was always extracted prior to the lastextracted endmember. As a result, when p = 5 estimated by theSSE was used, none of the four studied EEAs could extract allfive distinct mineral endmembers. They always missed the thirdpanel signature in the first column. On the other hand, if p = 6estimated by the VD was used, all the four EEAs successfullyextracted all five minerals. These experiments demonstratedthat in order for an EEA to extract all necessary five minerals,the minimum value chosen for p must be at least six estimatedby the VD, not five estimated by the SSE.
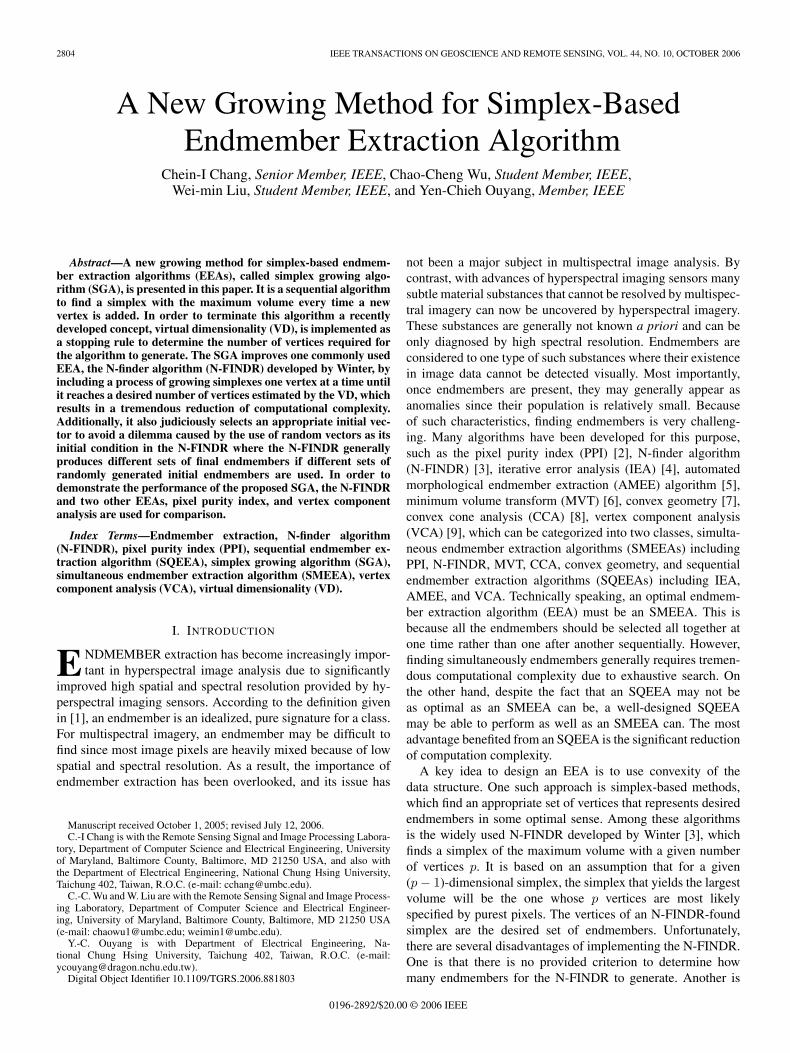
Since all the four EEAs require DR as a preprocessing priorto endmember extraction. In order to see the impact of differenttransforms used for DR, three commonly used transforms,PCA, MNF, and independent component analysis (ICA), wereimplemented to conduct comparative analysis. It should benoted that a problem similar to the use of random initial end-members in the PPI, N-FINDR, and VCA is also encountered inthe ICA implementation, which also uses randomly generatedprojectors as its initial conditions. In order to mitigate thisdilemma, a recent work developed for DR in [17] was imple-mented as the ICA as DR transform in this paper. Figs. 8–10show the results of the PPI, N-FINDR, and SGA with VD = 6and SSE = 5 where the number of dimensions to be retainedafter DR was set to be the same as p. It should be noted that noexperiments were conducted for the VCA since the algorithmused to run the VCA has its built-in DR transform [9].
By examining the results in Figs. 6 and 8–10, the four EEAsextracted all the five minerals for VD = 6 and missed onemineral for SSE = 5 regardless of which DR transform wasused. This implied that the three DR transforms made very little
2810 IEEE TRANSACTIONS ON GEOSCIENCE AND REMOTE SENSING, VOL. 44, NO. 10, OCTOBER 2006
Fig. 8. Endmember pixels extracted by PPI using three different DR trans-forms. (a) VD = 6. (b) SSE = 5.
Fig. 9. Endmember pixels extracted by N-FINDR using three differentDR transforms. (a) VD = 6. (b) SSE = 5.
difference in endmember extraction. However, this conclusionwill no longer be true as demonstrated in real-imageexperiments in Section VI. From the above experiments,the only major difference was the value of p for an EEA togenerate, in which case VD seemed to provide a better estimatethan SSE did.
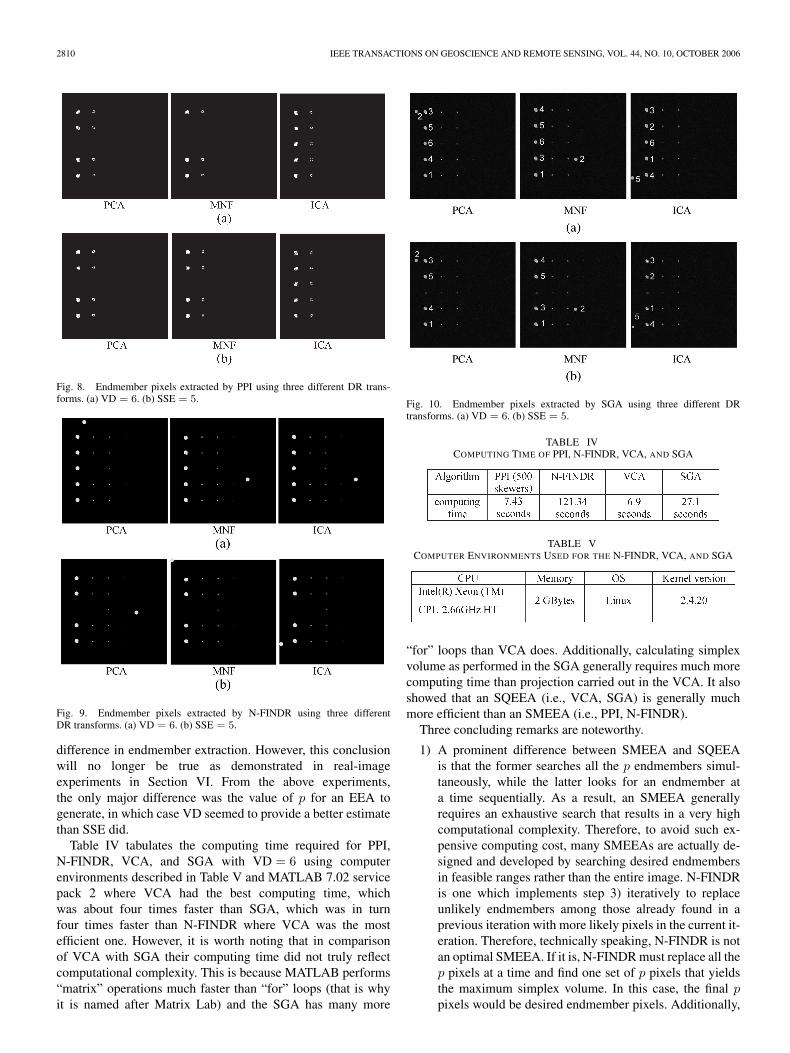
Table IV tabulates the computing time required for PPI,N-FINDR, VCA, and SGA with VD = 6 using computerenvironments described in Table V and MATLAB 7.02 servicepack 2 where VCA had the best computing time, whichwas about four times faster than SGA, which was in turnfour times faster than N-FINDR where VCA was the mostefficient one. However, it is worth noting that in comparisonof VCA with SGA their computing time did not truly reflectcomputational complexity. This is because MATLAB performs“matrix” operations much faster than “for” loops (that is whyit is named after Matrix Lab) and the SGA has many more
Fig. 10. Endmember pixels extracted by SGA using three different DRtransforms. (a) VD = 6. (b) SSE = 5.
TABLE IVCOMPUTING TIME OF PPI, N-FINDR, VCA, AND SGA
TABLE VCOMPUTER ENVIRONMENTS USED FOR THE N-FINDR, VCA, AND SGA
“for” loops than VCA does. Additionally, calculating simplexvolume as performed in the SGA generally requires much morecomputing time than projection carried out in the VCA. It alsoshowed that an SQEEA (i.e., VCA, SGA) is generally muchmore efficient than an SMEEA (i.e., PPI, N-FINDR).
Three concluding remarks are noteworthy.
1) A prominent difference between SMEEA and SQEEAis that the former searches all the p endmembers simul-taneously, while the latter looks for an endmember ata time sequentially. As a result, an SMEEA generallyrequires an exhaustive search that results in a very highcomputational complexity. Therefore, to avoid such ex-pensive computing cost, many SMEEAs are actually de-signed and developed by searching desired endmembersin feasible ranges rather than the entire image. N-FINDRis one which implements step 3) iteratively to replaceunlikely endmembers among those already found in aprevious iteration with more likely pixels in the current it-eration. Therefore, technically speaking, N-FINDR is notan optimal SMEEA. If it is, N-FINDR must replace all thep pixels at a time and find one set of p pixels that yieldsthe maximum simplex volume. In this case, the final ppixels would be desired endmember pixels. Additionally,

CHANG et al.: NEW GROWING METHOD FOR SIMPLEX-BASED ENDMEMBER EXTRACTION 2811
the controversy in final inconsistent results resulting fromthe use of randomly generated initial endmembers can befurther avoided because the search is conducted exhaus-tively in the entire image regardless of which p pixelsare picked for processing initially. Unfortunately, such anexhaustive search requires
(Np
)= N !/(N − p)!p! combi-
nations of p pixels. When N becomes large, the search-ing process also becomes forbidden. This evidence iswitnessed by our implementation of CCA [8] for theabove synthetic image. Since it is an exhaustive searchalgorithm, it took tens of hours using the same computerenvironment implemented by other EEAs to produce theresults similar and close to the results presented in thissection except different background pixels. Despite thatthe CCA is of major theoretical interest, it is impracticalfor applications unless computer environments can besignificantly improved to the point that computations arenot a major hurdle. Therefore, it is unrealistic to includethe CCA experiments in our computational complexityanalysis. On the other hand, an SQEEA overcomes thisdilemma by producing one endmember at a time sequen-tially. As a result, its computational complexity can betremendously reduced. Of course, it is also not an optimalalgorithm. Nevertheless, according to our experiments,an SQEEA nearly works as well and effectively as anSMEEA does.
2) As noted in the above experiments, the value of p esti-mated by the VD and SSE was close, 6 for VD and 5 forSSE. However, in our synthetic image-based simulations,even though SSE differed from the VD by one, thedifference between final results in endmember extractionwas significant because all the four studied EEAs missedone endmember if p = 5. For two SMEEAs, the PPI andN-FINDR missed panels in the third row. For twoSQEEAs, the order of the extracted endmembers showedthat the VCA and SGA always extracted one backgroundpixel before they extracted the last endmember. In otherwords, the last extracted endmember always happenedto be the sixth pixel. This implies that the backgroundsignature must be considered as one of endmembers. Thisfact was observed in Figs. 5–7 where the backgroundsignature was always among the first five extracted signa-tures, while the fifth mineral signature was always the lastand the sixth signature extracted by the N-FINDR, VCA,and SGA. This implies that in order to extract all thefive mineral signatures, the least number of endmembersfor all the three considered EEAs, N-FINDR, VCA, andSGA to generate must be 6 not 5. In other words, ifthe number of endmembers is 5, no matter which EEAis implemented, the algorithm always extracts four min-eral signatures and one background signature with onemissing mineral signature. Therefore, the VD actuallyprovided a more accurate estimate of p than the SSE did.It is also worth noting that according to the definition ofendmember given in [1], an endmember is intended to beused to represents a class. In light of this interpretation,VD = 6 is an accurate estimate since there are six classesin the synthetic image in Fig. 3(b), which include five
Fig. 11. (a) HYDICE panel scene that contains 15 panels. (b) Ground truthmap of spatial locations of the 15 panels.
mineral classes plus a background class. This is becausethe signature that specifies the background class can beconsidered as a hybrid signature rather than a mixedsignature. Furthermore, it can be easily shown that if theOSP classifier in [15] was used to classify the five mineralsignatures in Fig. 3(b), using six signatures to form thesignature matrix performed better than using only fivesignatures since the background signature must be usedto account for an additional class for background removalso as to achieve better classification.
3) It is our belief that there are two major issues for the SSEto fail in the above experiments. One is that the SSE isvery sensitive to the estimated noise covariance matrix.As a matter of fact, the noise estimation on SSE = 5is based on multiple regression theory as in [18]. Theother issue is the linear mixture model-based least squareserror approach used by the SSE. If a hyperspectral imagecannot be well represented by a linear mixture model,then it can be expected that the SSE may be very likelyto fail. The advantage of the VD over the SSE is that theVD is only determined by the false alarm probability, notby the linear mixture model, nor by noise estimates.
VI. REAL-IMAGE EXPERIMENTS
Two real-image scenes collected by the Hyperspectral DigitalImage Collection and Experiment (HYDICE) and AirborneVisible Infrared Imaging Spectrometer (AVIRIS) were used forexperiments. The four algorithms, PPI, N-FINDR, VCA, andSGA, were evaluated for performance analysis.
A. HYDICE Data
The first image data to be studied consist of an image sceneshown in Fig. 11(a), which has a size 64× 64 pixel vectors with15 panels in the scene and the ground truth map in Fig. 11(b)in [10]. It was acquired by 210 spectral bands with a spectralcoverage from 0.4 to 2.5 µm. Low signal/high noise bandsbands 1–3 and bands 202–210; and water vapor absorptionbands: bands 101–112 and bands 137–153 were removed.Therefore, a total of 169 bands were used in experiments. Thespatial resolution and spectral resolution of this image scene are1.56 m and 10 nm, respectively. Within the scene in Fig. 11(a)there is a large grass field background, and a forest on theleft edge. Each element in this matrix is a square panel anddenoted by pij with rows indexed by i and columns indexed by
2812 IEEE TRANSACTIONS ON GEOSCIENCE AND REMOTE SENSING, VOL. 44, NO. 10, OCTOBER 2006
TABLE VIVD ESTIMATES FOR THE HYDICE SCENE IN Fig. 11 WITH
VARIOUS FALSE ALARM PROBABILITIES
j = 1, 2, 3. For each row i = 1, 2, . . . , 5, there are three panelspainted by the same paint but with three different sizes. Thesizes of the panels in the first, second, and third columns are3 × 3 m, 2 × 2 m, and 1 × 1 m, respectively. Since the sizeof the panels in the third column is 1 × 1 m, they cannot beseen visually from Fig. 11(a) due to the fact that its size is lessthan the 1.56-m pixel resolution. For each column j = 1, 2, 3,the five panels have the same size but with five different paints.However, it should be noted that the panels in rows 2 and 3 weremade by the same material with two different paints. Similarly,it is also the case for panels in rows 4 and 5. Nevertheless, theywere still considered as different panels but our experimentswill demonstrate that detecting panels in row 5 (row 4) may alsohave effect on detection of panels in row 2 (row 3). The 1.56-mspatial resolution of the image scene suggests that most of the15 panels are one pixel in size except that the panels in the firstcolumn with the second, third, fourth, fifth rows, which are two-pixel panels, denoted by p211, p221, p311, p312, p411, p412, p511,p521. Fig. 11(b) shows the precise spatial locations of these15 panels where red pixels (R pixels) are the panel center pixelsand the pixels in yellow (Y pixels) are panel pixels mixed withthe background.
First of all, the VD was used to estimate number of bandsp required for band selection. Table VI calculated the valuesof VD for the HYDICE image in Fig. 11(a) with various falsealarm probabilities.
For our experiments, VD was chosen to be 9. The selection ofp = 9 is empirical based on the false alarm fixed at probabilitiesPF = 10−3, 10−4. Once again, the value of p estimated by theSSE was 10.
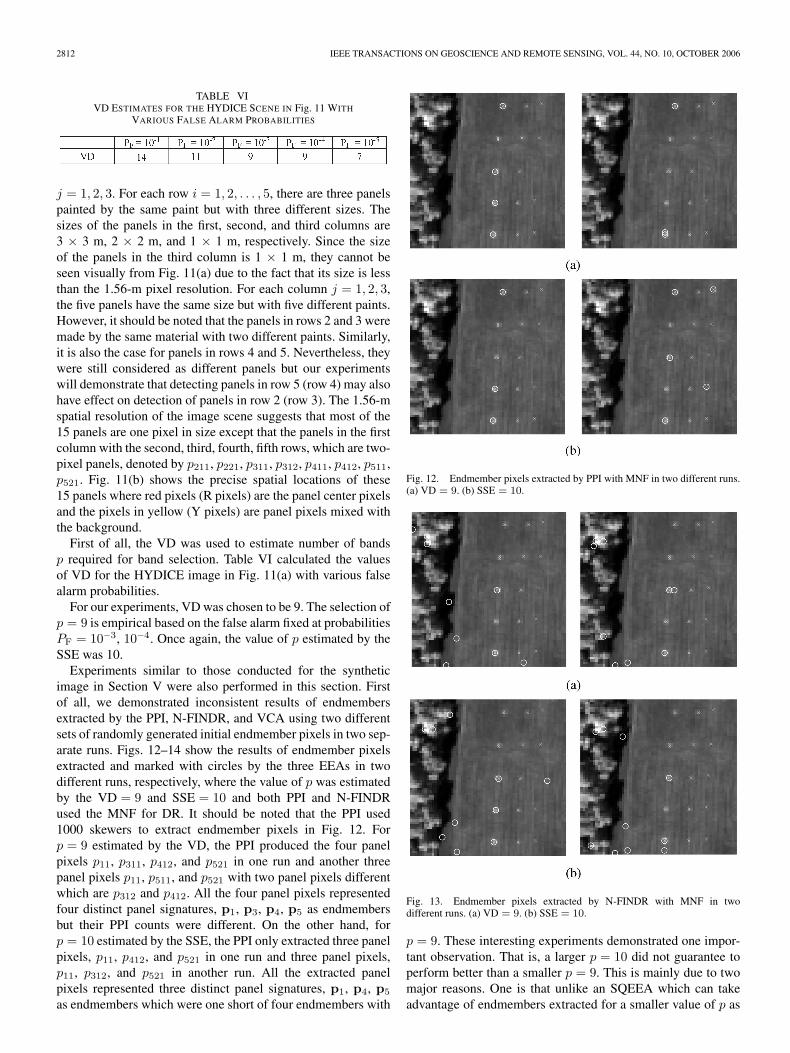
Experiments similar to those conducted for the syntheticimage in Section V were also performed in this section. Firstof all, we demonstrated inconsistent results of endmembersextracted by the PPI, N-FINDR, and VCA using two differentsets of randomly generated initial endmember pixels in two sep-arate runs. Figs. 12–14 show the results of endmember pixelsextracted and marked with circles by the three EEAs in twodifferent runs, respectively, where the value of p was estimatedby the VD = 9 and SSE = 10 and both PPI and N-FINDRused the MNF for DR. It should be noted that the PPI used1000 skewers to extract endmember pixels in Fig. 12. Forp = 9 estimated by the VD, the PPI produced the four panelpixels p11, p311, p412, and p521 in one run and another threepanel pixels p11, p511, and p521 with two panel pixels differentwhich are p312 and p412. All the four panel pixels representedfour distinct panel signatures, p1, p3, p4, p5 as endmembersbut their PPI counts were different. On the other hand, forp = 10 estimated by the SSE, the PPI only extracted three panelpixels, p11, p412, and p521 in one run and three panel pixels,p11, p312, and p521 in another run. All the extracted panelpixels represented three distinct panel signatures, p1, p4, p5
as endmembers which were one short of four endmembers with
Fig. 12. Endmember pixels extracted by PPI with MNF in two different runs.(a) VD = 9. (b) SSE = 10.
Fig. 13. Endmember pixels extracted by N-FINDR with MNF in twodifferent runs. (a) VD = 9. (b) SSE = 10.
p = 9. These interesting experiments demonstrated one impor-tant observation. That is, a larger p = 10 did not guarantee toperform better than a smaller p = 9. This is mainly due to twomajor reasons. One is that unlike an SQEEA which can takeadvantage of endmembers extracted for a smaller value of p as

CHANG et al.: NEW GROWING METHOD FOR SIMPLEX-BASED ENDMEMBER EXTRACTION 2813
Fig. 14. Endmember pixels extracted by VCA in two different runs.(a) VD = 9. (b) SSE = 10.
part of endmembers generated for a larger value of p, the PPI isan SMEEA and must regenerate all endmembers for differentvalues of p. The other reason is that the PPI produced differentPPI counts for endmembers in different runs. In this case, thepanel pixel p311 that appeared in one run may also disappear inanother run due to its low PPI count.
Similarly, N-FINDR also extracted different sets of finalendmember pixels in Fig. 13 for both cases, p = 9 and 10.
For VD = 9, among all extracted pixels are only two werereal endmember pixels p311 and p521 representing two distinctpanel signatures p3 and p5. However, for SSE = 10, threepanel pixels p311, p412, and p521 were extracted in one run, andtwo panel pixels p311 and p521 were extracted in another run.
Fig. 14 also showed that the VCA suffered from the samedilemma encountered in the PPI and N-FINDR where only twopanel pixels which might be different were extracted by all thecases. However, it is also interesting to note that VCA extracteddifferent sets of distinct panel signatures in two different runs,{p3,p5} and {p3,p4} for VD = 9 and SSE = 10, respectively.
Finally, Fig. 15 shows the result produced by our proposedSGA using the MNF as DR for VD = 9 and SSE = 10 where itsperformance was at least comparably to the other three EEAs.Since SGA is an SQEEA, the set of endmember pixels extractedby a smaller value of p is always a subset of endmemberpixels extracted by a larger value of p. As a result, endmembersextracted in Fig. 15(a) for VD = 9 were also endmember pixelsin Fig. 15(b) for SSE = 10. In this particular case, the tenthextracted endmember pixel occurred to be the panel pixel p412,which represented an additional third panel signature p3.
Comparing Fig. 15 to Figs. 12–14, the advantages of usingSGA are very obvious. First of all, the final set of endmember
Fig. 15. Results of SGA using MNF. (a) VD = 9. (b) SSE = 10.
Fig. 16. Endmember pixels extracted by PPI using three different DR trans-forms and 1000 skewers. (a) VD = 9. (b) SSE = 10.
pixels extracted by the SGA is always identical regardlessof how many runs the SGA is conducted. Second of all, theendmember pixels extracted for a smaller value of p are alwaysa subset of endmember pixels extracted for a larger value of p.
Finally, the impact of DR on the performance of EEAs wasalso investigated. Figs. 16–18 show that results of the PPI,N-FINDR, and SGA using three DR transforms for VD = 9 andSSE = 10. Unlike the synthetic image experiments in Section Vwhere there was no difference among the three DR transformsto be used for preprocessing, the results in Figs. 16–18 providedevidence that it was important to choose an appropriate DRtransform prior to endmember extraction. The experimentsshowed that using the ICA as a DR transform yielded the bestperformance where all the five distinct panel signatures wereextracted as endmembers. Most importantly, the results alsoshowed that VD = 9 was a better estimate than SSE = 10. As amatter of fact, according to Fig. 18, all the five panel signatureswere extracted by the SGA using ICA before the eighth pixelwas produced.
Like Table IV, Table VII also tabulates the computing timefor PPI with 1000 skewers, N-FINDR, VCA, and SGA with

2814 IEEE TRANSACTIONS ON GEOSCIENCE AND REMOTE SENSING, VOL. 44, NO. 10, OCTOBER 2006
Fig. 17. Endmember pixels extracted by N-FINDR using three different DRtransforms. (a) VD = 9. (b) SSE = 10.
Fig. 18. Endmember pixels extracted by SGA using three different DRtransforms. (a) VD = 9. (b) SSE = 10.
TABLE VIICOMPUTING TIME OF N-FINDR, VCA, AND SGA
VD = 9 for the same computer environment in Table V whereonce again the PPI and VCA ran about five times faster thandid the SGA and the SGA was five times faster than wasN-FINDR. As indicated previously, this is because SGA cal-culated simplex volumes and required much more computingtime than VCA did, which only calculated projections.
Fig. 19. Spatial positions of five pure pixels corresponding to minerals:alunite (A), buddingtonite (B), calcite (C), kaolinite (K), and muscovite (M).
TABLE VIIIVD ESTIMATES FOR THE CUPRITE SCENE IN FIG. 19 WITH
VARIOUS FALSE ALARM PROBABILITIES
B. AVIRIS Cuprite Data
Another real image to be used for experiments is a well-known AVIRIS image scene, Cuprite, NV, shown in Fig. 19,which has been widely used to study endmember extractionextensively. It is available online [19] and was collected by224 spectral bands with 10-nm spectral resolution over theCuprite mining site, in 1997. The image has size of 350 ×350 pixels and is well understood mineralogically where bands1–3, 105–115, and 150–170 have been removed prior to theanalysis due to water absorption and low SNR in those bands.As a result, a total of 189 bands were used for experiments.The ground truth also provides the spatial locations of the fiveminerals, Alunite (A), Buddingtonite (B), Calcite (C), Kaolinite(K), and Muscovite (M) circled and labeled by A, B, C, K,and M, respectively, which can be used to verify endmembersextracted by an EEA.
The VD estimated for this image scene was tabulated inTable VIII with various false alarm probabilities.
For our experiments, VD was chosen to be 22. The selectionof p = 22 is empirical based on the false alarm fixed at proba-bilities PF = 10−4. Also, the value of p estimated by the SSEwas 28. The experiments were conducted based on these twovalues, i.e., p = 22 and 28 for comparative analysis.
Experiments similar to those conducted for HYDICE imagescene in Section VI-A were also performed for the Cupriteimage scene in Fig. 19.
First of all, Figs. 20–22 demonstrate a dilemma encounteredin the PPI, N-FINDR, and VCA, which is that final resultsproduced by these three algorithms in two different runs wereinconsistent for both VD = 22 and SSE = 28. In these figures,the pixels marked by open circles were extracted by algorithms,

CHANG et al.: NEW GROWING METHOD FOR SIMPLEX-BASED ENDMEMBER EXTRACTION 2815
Fig. 20. Endmember pixels extracted by PPI in two different runs.(a) VD = 22. (b) SSE = 28.
Fig. 21. Endmember pixels extracted by N-FINDR in two different runs.(a) VD = 22. (b) SSE = 28.
and the pixels marked by the lower cases of “a, b, c, k, m” withtriangles were the desired endmember pixels corresponding tothe five ground truth mineral endmembers provided by [19] and
Fig. 22. Endmember pixels extracted by VCA in two different runs.(a) VD = 22. (b) SSE = 28.
marked by the upper cases of “A, B, C, K, M” with yellowcrosses “x” in the sense of spectral similarity measured by theSpectral Angle Mapper (SAM) [1], [10]. Since similar tablesusing the SAM for signature matching can be obtained in theexact same manner that was performed in [17], the results arenot included here to avoid replication. Therefore, in all thefollowing experiments, only spatial locations of the extractedendmember pixels were identified and shown in the figures. Ad-ditionally, the numerals in open parentheses underneath thesefigures indicate the numbers of extracted endmember pixelsthat were identified in correspondence to ground truth mineralpixels by the SAM. Since the VCA is an SQEEA, the pixels inFig. 22 labeled by numbers indicate the order that these pixelswere extracted in sequence by VCA. It should be also noted thatthe PPI implemented here used 500 skewers for computationalconvenience.
As shown in Figs. 20 and 21, the PPI and the N-FINDRextracted different numbers of ground truth correspondingendmember pixels, 5 and 4 in two different runs for bothcases, VD = 22 and SSE = 28. It was also true for theVCA with SSE = 28. Moreover, these extracted ground truth-corresponding endmember pixels were generally not the same.This is mainly due to the fact that there are other pixels whosespectral signatures are also similar and very close to groundtruth mineral signatures. As a result, a different run is verymuch likely to extract different pixels corresponding to groundtruth pixels. This evidence was demonstrated in Fig. 22(a)where the two sets of three endmember pixels correspondingto Alunite (A), Buddingtonite (B), Calcite (C) produced by

2816 IEEE TRANSACTIONS ON GEOSCIENCE AND REMOTE SENSING, VOL. 44, NO. 10, OCTOBER 2006
Fig. 23. Endmember pixels extracted by PPI using three DR transforms using 500 skewers. (a) VD = 22. (b) SSE = 28.
Fig. 24. Endmember pixels extracted by N-FINDR using three DR transforms. (a) VD = 22. (b) SSE = 28.

CHANG et al.: NEW GROWING METHOD FOR SIMPLEX-BASED ENDMEMBER EXTRACTION 2817
Fig. 25. Endmember pixels extracted by SGA using three DR transforms. (a) VD = 22. (b) SSE = 28.
Fig. 26. Endmember pixels extracted by VCA. (a) VD = 22. (b) SSE = 28.
the VCA in Fig. 22(a) for VD = 22 in two separate runswere different.
So far, we have demonstrated a major drawback of the use ofrandomly generated initial endmembers. Next, we conducteda comparative analysis and performance evaluation amongthe four EEAs, two SMEEAs (PPI and N-FINDR) and twoSQEEAs (VCA and SGA). Since all the four studied EEAsrequired DR as a preprocessing, three DR transforms used inprevious experiments were also used for the following experi-ments. Figs. 23–25 show the results of endmembers extractedby PPI with 500 skewers, N-FINDR, SGA using three DRtransforms, PCA, MNF, and ICA for VD = 22 and SSE = 28,respectively, where notations used in these figures are the sameas those used in Figs. 20–22.
As noted earlier, since the VCA has its built-in DR transform,no experiments on these three DR transforms conducted forVCA. Fig. 26 also showed the results obtained by the VCA forVD = 22 and SSE = 28.
By examining results in Figs. 23–26, the PPI, N-FINDR,SGA, and VCA could extract all desired five pixels that cor-responded to ground truth pixels in terms of spectral similaritymeasured by the SAM for both VD = 22 and SSE = 28. Onsome occasions, there were four endmembers extracted such asFig. 24(a) with the PCA and Fig. 25(a) and (b) with the MNF.However, these could be corrected by ICA, which consistentlyyielded the best results in all cases. Interestingly, Fig. 25(a)and (b) also showed that when the SGA was implementedwith the MNF, only four ground truth corresponding pixelswere extracted even SSE used a higher value of p = 28 than22 estimated by the VD. This implied that according to ourexperiments, the SSE seemed to overestimate the number ofendmembers, 28 which was higher than 22 estimated by VD.Most importantly, all experiments conducted above demon-strated that our proposed SGA performed at least comparablywith other EEAs with one major advantage, which other EEAsdo not have, consistent final set of selected endmembers.
Finally, Table IX also tabulates the computing time for PPIwith 500 skewers, N-FINDR, VCA, and SGA with VD = 22for the same computer environment in Table V. As we cansee, the projection-based algorithms PPI and VCA showedsignificant savings in computing time compared to simplexvolume-based algorithms SGA and N-FINDR. Nevertheless,the SGA was five times faster than the N-FINDR.

2818 IEEE TRANSACTIONS ON GEOSCIENCE AND REMOTE SENSING, VOL. 44, NO. 10, OCTOBER 2006
TABLE IXCOMPUTING TIME OF N-FINDR, VCA, AND SGA
VII. CONCLUSION
This paper introduces a new simplex growing method, anSGA that resolves three major issues encountered in theN-FINDR: 1) determination of the number of endmembers;2) inconsistent final selection set of endmembers; and 3) com-putational complexity. Coincidentally, the idea of growing sim-plexes to find endmembers used in the SGA is similar to thatused in a recently developed VCA, but their approaches aredifferent. Most distinctly, the VCA still cannot address thesecond issue, which is inconsistent results in finding a desiredset of endmembers due to its use of random projections forsimplexes generated by zero-mean Gaussian distributions as asimplex grows.
As a final concluding remark, there is a commercial versionof the N-FINDR that is available [20] which also resolves thesecond and the third issues. Unfortunately, the details of itsimplementation are not made available to users. In particular,it does not allow users to select their own initial endmembersfor comparison. Therefore, it was not studied in this paper.Nevertheless, computational complexity given in Table I re-mains the same. Additionally, since it is believed to be writtenin C not MATLAB, the computation is expected to be muchfaster than the one using MATLAB in this paper. It is our beliefthat if our proposed SGA is also written in C, its computationcan be significantly improved and comparable to the commer-cial version of the N-FINDR.
ACKNOWLEDGMENT
The authors would like to thank Dr. Nascimento who pro-vided his developed VCA to be implemented in this paper. Theauthors would also like to thank the anonymous reviewers whosuggested the use of a different DR transform for comparativeanalysis and to provide the reference [14].
REFERENCES
[1] R. A. Schowengerdt, Remote Sensing: Models and Methods for ImageProcessing, 2nd ed. New York: Academic, 1997.
[2] J. W. Boardman, F. A. Kruse, and R. O. Green, “Mapping target signaturesvia partial unmixing of AVIRIS data,” in Proc. Summ. JPL Airborne EarthSci. Workshop, Pasadena, CA, 1995, pp. 23–26.
[3] M. E. Winter, “N-finder: An algorithm for fast autonomous spectral end-member determination in hyperspectral data,” in Proc. Image Spectrom.V, 1999, vol. 3753, pp. 266–277.
[4] R. A. Neville, K. Staenz, T. Szeredi, J. Lefebvre, and P. Hauff, “Automaticendmember extraction from hyperspectral data for mineral exploration,”in Proc. 4th Int. Airborne Remote Sens. Conf. and Exhib./21st Can. Symp.Remote Sens., Ottawa, ON, Canada, Jun. 1999, pp. 21–24.
[5] A. Plaza, P. Martinez, R. Perez, and J. Plaza, “Spatial/spectral endmemberextraction by multidimensional morphological operations,” IEEE Trans.Geosci. Remote Sens., vol. 40, no. 9, pp. 2025–2041, Sep. 2002.
[6] M. D. Craig, “Minimum-volume transforms for remotely sensed data,”IEEE Trans. Geosci. Remote Sens., vol. 32, no. 3, pp. 542–552, May 1994.
[7] J. W. Boardman, “Geometric mixture analysis of imaging spectro-metery data,” in Proc. Int. Geosci. Remote Sens. Symp., 1994, vol. 4,pp. 2369–2371.
[8] A. Ifarraguerri and C.-I Chang, “Hyperspectral image segmentationwith convex cones,” IEEE Trans. Geosci. Remote Sens., vol. 37, no. 2,pp. 756–770, Mar. 1999.
[9] J. M. P. Nascimento and J. M. Dias, “Vertex component analysis: A fastalgorithm to unmix hyperspectral data,” IEEE Trans. Geosci. RemoteSens., vol. 43, no. 4, pp. 898–910, Apr. 2005.
[10] C.-I Chang, Hyperspectral Imaging: Techniques for Spectral Detectionand Classification. Norwell, MA: Kluwer, 2003.
[11] C.-I Chang and Q. Du, “Estimation of number of spectrally distinct signalsources in hyperspectral imagery,” IEEE Trans. Geosci. Remote Sens.,vol. 42, no. 3, pp. 608–619, Mar. 2004.
[12] J. Wang and C.-I Chang, “Dimensionality reduction by independent com-ponent analysis for hyperspectral image analysis,” in Proc. IEEE Int.Geosci. Remote Sens. Symp., Seoul, Korea, Jul. 25–29, 2005.
[13] C.-I Chang and A. Plaza, “Fast iterative algorithm for implementationof pixel purity index,” IEEE Geosci. Remote Sens. Lett., vol. 3, no. 1,pp. 63–67, Jan. 2006.
[14] J. Dias and J. Nascimento, “Estimation of signal subspace on hyper-spectral data,” in Proc. SPIE, Sep. 2005, vol. 5982, pp. 191–198.
[15] J. C. Harsanyi and C.-I Chang, “Hyperspectral image classification anddimensionality reduction: An orthogonal subspace projection approach,”IEEE Trans. Geosci. Remote Sens., vol. 32, no. 4, pp. 779–785, Jul. 1994.
[16] F. Chaudhry, C. Wu, W. Liu, C.-I Chang, and A. Plaza, “Pixelpurity index-based algorithms for endemember extraction from hyper-spectral imagery,” in Recent Advances in Hyperspectral Signal andImage Processing, C.-I Chang, Ed. Trivandrum, India: ResearchSignpost, 2006, ch. 3.
[17] J. Wang and C.-I Chang, “Independent component analysis-baseddimensionality reduction with applications in hyperspectral image analy-sis,” IEEE Trans. Geosci. Remote Sens., vol. 44, no. 6, pp. 1586–1600,Jun. 2006.
[18] R. E. Roger and J. F. Arnold, “Reliably estimating the noise inAVIRIS hyperspectral imagers,” Int. J. Remote Sens., vol. 17, no. 10,pp. 1951–1962, 1996.
[19] [Online]. Available: http://speclab.cr.usgs.gov/cuprite.html and http://aviris.jpl.nasa.gov/html/aviris.free.data.html
[20] A. J. Plaza, P. Martinez, A. Plaza and R. M. Perez “Quantifying theimpact of spatial resolution on endmember extraction from hyperspectralimagery,” in Proc. 3rd EARSeL Workshop Imag. Spectrosc., Germany,2003, pp. 117–125.
Chein-I Chang (S’81–M’82–SM’92) received theB.S. degree in mathematics from Soochow Univer-sity, Taipei, Taiwan, R.O.C., in 1973, the M.S. degreein mathematics from the Institute of Mathematics,National Tsing Hua University, Hsinchu, Taiwan,R.O.C., in 1975, the M.A. degree in mathematicsfrom the State University of New York, StonyBrook,in 1977, the M. S. and M.S.E.E. degrees from theUniversity of Illinois, Urbana-Champaign, in 1982,and the Ph.D. degree in electrical engineering fromthe University of Maryland, College Park, in 1987.
Since 1987, he has been with UMBC as a Visiting Assistant Professor fromJanuary 1987 to August 1987, Assistant Professor from 1987 to 1993, AssociateProfessor from 1993 to 2001, and Professor in the Department of ComputerScience and Electrical Engineering since 2001. From 1994 to 1995, he wasa Visiting Research Specialist in the Institute of Information Engineering atthe National Cheng Kung University, Tainan, Taiwan. He was a DistinguishedLecturer at the National Chung Hsing University, Taichung, Taiwan, sponsoredby the Ministry of Education, from 2005 to 2006. He was on the Editorial Boardof the Journal of High-Speed Networks and was the Guest Editor of a specialissue of the same journal on telemedicine and applications. He is the author ofHyperspectral Imaging: Techniques for Spectral Detection and Classification(New York: Kluwer, 2003). He has three patents and several pending patents.His research interests include multispectral/hyperspectral image processing,automatic target recognition, medical imaging, information theory and coding,signal detection and estimation, and neural networks.
Dr. Chang received a National Research Council Senior Research Associ-ateship Award from 2002 to 2003, sponsored by the U.S. Army Soldier andBiological Chemical Command, Edgewood Chemical and Biological Center.He is an Associate Editor in the area of hyperspectral signal processing forthe IEEE TRANSACTIONS ON GEOSCIENCE AND REMOTE SENSING. He is aFellow of the International Society for Optical Engineering and a member ofPhi Kappa Phi and Eta Kappa Nu.

CHANG et al.: NEW GROWING METHOD FOR SIMPLEX-BASED ENDMEMBER EXTRACTION 2819
Chao-Cheng Wu (S’04) received the B.S. degreein electrical engineering from Tamkang University,Taipei, Taiwan, R.O.C., in 2002 and the M.S. de-gree in electrical engineering from the Universityof Maryland, Baltimore County (UMBC), Baltimore,in 2006.
He is currently a Research Assistant in the RemoteSensing, Signal, and Image Processing Laboratoryat UMBC. His research interests include signal andhyperspectral image processing.
Wei-min Liu (S’03) received the B.S. degree inapplied mathematics from the National Chiao TungUniversity, Taiwan, R.O.C., in 2001, and the M.S.degree in electrical engineering from the Universityof Maryland, Baltimore County (UMBC), Baltimore,in 2005. He is currently working toward the Ph.D.degree at UMBC.
He is currently a Research Assistant in theRemote Sensing, Signal, and Image ProcessingLaboratory, UMBC. His research interests includemulti/hyperspectral and medical image processing,
pattern recognition, and adaptive signal processing.
Yen-Chieh Ouyang (S’86–M’92) received theB.S.E.E. degree from Feng Chia University,Taichung, Taiwan, in 1981, and the M.S. andPh.D. degrees, both from University of Memphis,Memphis, Tennessee, in 1987, and 1992, respec-tively, all in electrical engineering.
He joined the faculty of the Department ofElectrical Engineering at National Chung HsingUniversity (NCHU), Taichung, Taiwan, R.O.C., inAugust 1992. He is currently an Associate Professorand the Director of the Multimedia Communica-
tion Laboratory, NCHU. His research interests include hyperspectral imageprocessing, communication networks, providing QoS over wireless and net-work security in mobile networks, multimedia system design, and performanceevaluation.