
A NATIONAL MEASUREMENT GOOD PRACTICE GUIDE …publications.npl.co.uk/npl_web/pdf/mgpg107.pdf · A...
29
A NATIONAL MEASUREMENT GOOD PRACTICE GUIDE No.107 Guide to the calibration and testing of torque transducers
Transcript of A NATIONAL MEASUREMENT GOOD PRACTICE GUIDE …publications.npl.co.uk/npl_web/pdf/mgpg107.pdf · A...

A NATIONAL MEASUREMENT
GOOD PRACTICE GUIDE
No.107
Guide to the calibration and testing of torque transducers
A NATIONAL MEASUREMENT
GOOD PRACTICE GUIDE
No.107
Guide to the calibration and testing of torque transducers

Good Practice Guide 107
Measurement Good Practice Guide No.107
Guide to the calibration and testing of torque transducers
Andy Robinson Industry and Innovation Division
ABSTRACT This guide describes a collection of methods for the calibration of a torque transducer. It encompasses transducers based on different technologies and transducers that operate in both static and dynamic applications. The user is expected to select the tests suitable for their requirements.
Good Practice Guide 107
© Crown copyright 2008 Reproduced with the permission of the Controller of HMSO
and Queen's Printer for Scotland
ISSN 1368-6550
National Physical Laboratory Hampton Road, Teddington, Middlesex, TW11 0LW
Approved on behalf of the Managing Director, NPL by Susan Evans, Director, Industry and Innovation Division

Good Practice Guide 107
Contents 1 Introduction 2 General
2.1 Torque machines/rigs 2.2 Setup 2.3 Calibration 2.4 Traceability
3 Basic calibration 3.1 Non-linearity 3.2 Reproducibility
4 Additional tests 4.1 Repeatability 4.2 Hysteresis 4.3 Creep & Creep recovery 4.4 Overload effect 4.5 Bending effects 4.6 Output stability at zero torque 4.7 Output stability at maximum torque 4.8 Alternating torque 4.9 Torque versus angle (flexural stiffness) 4.10 Excitation voltage effects
5 Environmental tests 5.1 Temperature sensitivity at zero torque 5.2 Temperature sensitivity at maximum calibration torque
6 Dynamic tests 6.1 Frequency response (electronic) 6.2 Speed effect on zero
7 Glossary 8 Acknowledgments 9 References


Good Practice Guide 107
1
1. Introduction This guide is aimed at providing a set of tests for the calibration, testing and evaluation of torque transducers. The guide covers a wide range of applications including transducers used in both static and dynamic environments. Some methods included in this guide will have a relevance that is limited to a particular application. The user is expected to select the tests appropriate to the intended application. The guide allows greater flexibility and covers a wider scope than other existing standards for static torque calibration [1, 2]. Worked examples are included by way of demonstration. The set of tests described in the guide was designed to provide the data that is typically found in the manufacturer’s datasheet for a torque transducer. By documenting a common and practical set of tests, it is hoped to introduce a consistency and understanding that will be of benefit to both the manufacturer and the end user. During this project a number of UK torque transducer manufacturers were consulted in an attempt to collate a range of tests representative of those currently used in industry and to identify some common best practices. A number of transducers were tested to the methods described in this guide to ensure that the methods were practical and to provide data for the worked examples. 2. General 2.1 Torque machines/rigs There are many ways of generating torque. A few alternative designs are briefly discussed below: Lever deadweight – This consists of a set of calibrated masses that act on a calibrated lever arm. The system can be directly applied to the transducer in the case of an unsupported calibration beam (see figure 1). In the ideal case the lever arm will be connected to a bearing to eliminate bending from the weights and masses and to minimise friction [3]. This type of system is used for static torque calibration and offers the best uncertainties.
Figure 1. Left; An unsupported calibration beam: right; a motor driven torque machine used for continuous torque calibration
Reference torque transducer – Torque can be applied using a motor or hydraulics and the torque controlled by means of a calibrated reference torque transducer in a feedback

Good Practice Guide 107
2
loop (see figure 1). This type of system can be used to measure static torque but has the additional advantage of being suitable for continuous torque calibration, whereby the applied torque is applied over a much shorter time. The disadvantage of these systems is that the uncertainty of applied torque will be much higher because the system is dependant on the prior calibration of the reference. Other similar designs may take traceability from calibrated load cells measuring the reaction force at the end of the lever arm. Regardless of the torque facility to be used, it is important to evaluate the uncertainty of the system [4]. This should include contributions from all influencing parameters (e.g. mass, length, alignment, and environmental factors). 2.2 Setup The transducer, lead, and readout unit should be considered as a complete system for the calibration. Part numbers and serial numbers should be recorded. The temperature at which the measurements are to take place should also be recorded. Stabilisation - the equipment should be allowed to thermally stabilise for at least one hour before measurements begin. In cases where the equipment is subjected to a significant temperature change, a longer time period should be allowed for acclimatisation. The readout unit should be chosen carefully so that there is adequate resolution over the whole of the torque range of interest, otherwise a lack of resolution may limit the analysis of the parameter to be measured. Resolution is given by the last active unit of the indicator, or in the case of a fluctuating reading, half the magnitude of the largest fluctuation. The cable should be handled carefully so that it has negligible influence on the transducer under test. Particularly with small torques and good resolutions, the handling of the cable can have a significant effect on the output. In the ideal case a pure torque is applied to the transducer under test. In practice the transducer will also be subject to additional bending and parasitic forces and torques, which may affect the transducer to varying degrees [5-8]. It should always be the aim to keep these additional forces to a minimum. When using unsupported calibration beams bending forces are unavoidable. In this case it is important to be aware of the influence that bending can have on the measurement result and, where possible, to be able to quantify this. The mounting of the transducer is very important. The transducer should be held as rigidly as possible on the mounting plate. The fit of the squares should be as good as possible to minimise any slack (see figure 2).
Good Practice Guide 107
3
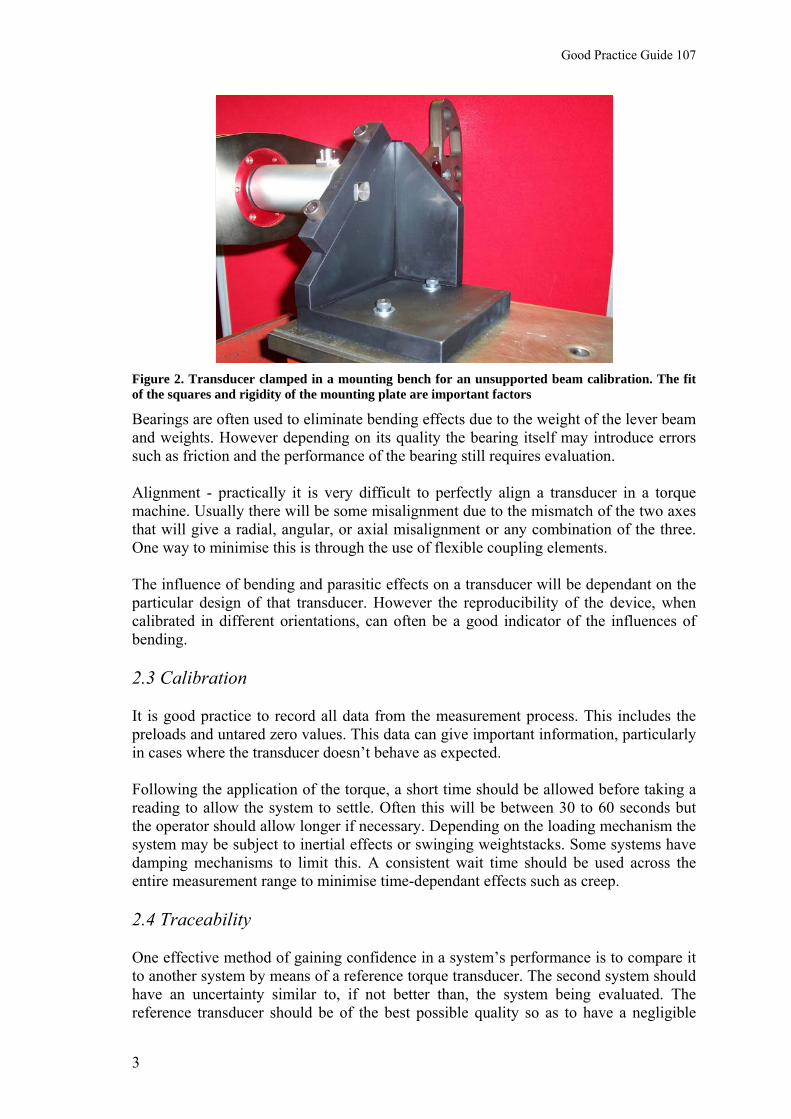
Figure 2. Transducer clamped in a mounting bench for an unsupported beam calibration. The fit of the squares and rigidity of the mounting plate are important factors
Bearings are often used to eliminate bending effects due to the weight of the lever beam and weights. However depending on its quality the bearing itself may introduce errors such as friction and the performance of the bearing still requires evaluation. Alignment - practically it is very difficult to perfectly align a transducer in a torque machine. Usually there will be some misalignment due to the mismatch of the two axes that will give a radial, angular, or axial misalignment or any combination of the three. One way to minimise this is through the use of flexible coupling elements. The influence of bending and parasitic effects on a transducer will be dependant on the particular design of that transducer. However the reproducibility of the device, when calibrated in different orientations, can often be a good indicator of the influences of bending. 2.3 Calibration It is good practice to record all data from the measurement process. This includes the preloads and untared zero values. This data can give important information, particularly in cases where the transducer doesn’t behave as expected. Following the application of the torque, a short time should be allowed before taking a reading to allow the system to settle. Often this will be between 30 to 60 seconds but the operator should allow longer if necessary. Depending on the loading mechanism the system may be subject to inertial effects or swinging weightstacks. Some systems have damping mechanisms to limit this. A consistent wait time should be used across the entire measurement range to minimise time-dependant effects such as creep. 2.4 Traceability One effective method of gaining confidence in a system’s performance is to compare it to another system by means of a reference torque transducer. The second system should have an uncertainty similar to, if not better than, the system being evaluated. The reference transducer should be of the best possible quality so as to have a negligible

Good Practice Guide 107
4
influence on the measurement result. In addition to the reproducibility of the transducer, something should be known about its long-term stability (or drift) and its sensitivity to temperature and humidity effects.

Good Practice Guide 107
5
3. Basic calibration
Preload – the preload is applied to bed in the mechanical setup of the transducer and adapters, and to exercise the gauges. When the transducer is first put in the calibration rig it should be preloaded 3 times to maximum torque before any measurements are made. If the transducer is disturbed and moved to a new mounting position a further preload is required to bed in the transducer.
a. Preload the transducer. b. Record the zero torque output. c. Apply at least 5 equally spaced torques, increasing torque from zero torque up to
and including the maximum torque. d. At each torque, record the output after a period of at least 30 seconds. e. If decreasing torques are to be applied, then apply a decreasing series back down
to zero torque. f. Record the final zero torque output. g. The transducer should be disconnected and rotated in a clockwise direction.
After each rotation the transducer should be preloaded once. h. Repeat the steps so that the transducer is calibrated symmetrically (3
orientations for flange and shaft style transducers, 4 orientations for square drive transducers).
Trandsducer orientation 0° 90° 180° 270°
App
lied
torq
ue
100%
20%
0%
Figure 3. Loading diagram for a square drive transducer
3.1 Departure from curve fit / Non-linearity ~ maximum difference between the deflection and polynomial curve fit.
a. For many applications, polynomial curve fits can be programmed into the instrumentation. Using this method a first order curve fit can be used to calculate the deviation from a straight line if required.
b. Calculate the mean deflection for each increasing calibration torque. c. Using the method of least squares, compute the coefficients of a polynomial
equation giving deflection as a function of applied torque. d. For each calibration torque, calculate the difference between the mean measured
transducer deflection and the value computed from the equation. e. The non-linearity shall be taken as the maximum of these differences, when
expressed as a percentage of the mean deflection.

Good Practice Guide 107
6
⎥⎥⎦
⎤
⎢⎢⎣
⎡×
−100Max
comp
comp
ddd
where: d is the mean deflection; dcomp is deflection value calculated from the curve fit. Worked example
Calibration data
N·m 0° 90° 180° 270° Mean Value Curve fit non linearity0 0.0000 0.0000 0.0000 0.0000 0.0000
40 0.3986 0.3984 0.3985 0.3987 0.3986 0.3985 0.0004%80 0.7970 0.7970 0.7970 0.7971 0.7970 0.7972 -0.0235%
120 1.1963 1.1963 1.1962 1.1965 1.1963 1.1960 0.0311%160 1.5944 1.5944 1.5944 1.5946 1.5945 1.5947 -0.0175%200 1.9935 1.9937 1.9935 1.9936 1.9936 1.9935 0.0037%
Cubic Curve FitDeflection in terms of torqueD = b1 T + b2 T
2 +b3 T3
b1 = 9.961 94 E-03b2 = 4.855 E-08b3 = -1.036 E-10
hence deviation from curve fit/non linearity = -0.0311%
dcompd
⎥⎥⎦
⎤
⎢⎢⎣
⎡ −100x
ddd
comp
comp
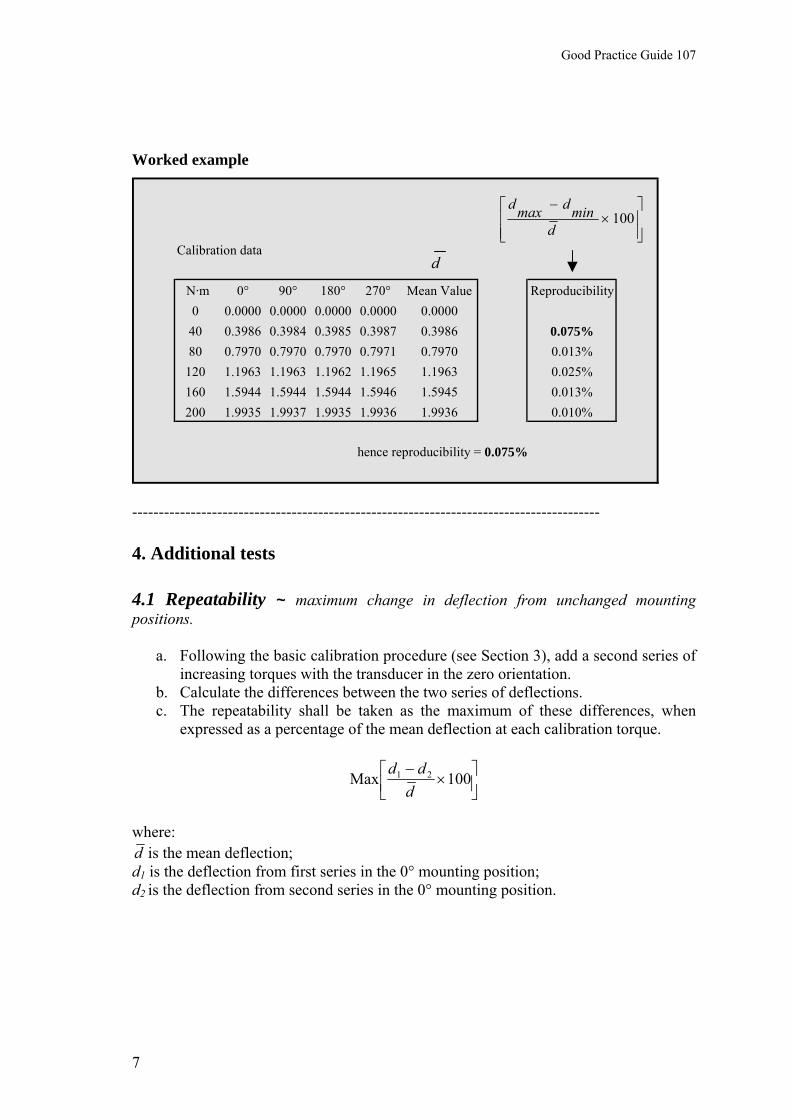
3.2 Reproducibility ~ maximum change in deflection from changed mounting positions.
a. Calculate the maximum difference between the deflections at each increasing calibration torque across the measurement series at different orientations.
b. The reproducibility shall be taken as the maximum of these differences, when expressed as a percentage of the mean deflection at each calibration torque.
⎥⎦⎤
⎢⎣⎡ ×
−100Max minmax
ddd
where: d is the mean deflection; dmax is the maximum deflection across the measurement series; dmin is the minimum deflection across the measurement series.
Good Practice Guide 107
7
Worked example
Calibration data
N·m 0° 90° 180° 270° Mean Value Reproducibility0 0.0000 0.0000 0.0000 0.0000 0.0000
40 0.3986 0.3984 0.3985 0.3987 0.3986 0.075%80 0.7970 0.7970 0.7970 0.7971 0.7970 0.013%
120 1.1963 1.1963 1.1962 1.1965 1.1963 0.025%160 1.5944 1.5944 1.5944 1.5946 1.5945 0.013%200 1.9935 1.9937 1.9935 1.9936 1.9936 0.010%
hence reproducibility = 0.075%
⎥⎥⎦
⎤
⎢⎢⎣
⎡×
−100
dmindmaxd
d
---------------------------------------------------------------------------------------- 4. Additional tests 4.1 Repeatability ~ maximum change in deflection from unchanged mounting positions.
a. Following the basic calibration procedure (see Section 3), add a second series of increasing torques with the transducer in the zero orientation.
b. Calculate the differences between the two series of deflections. c. The repeatability shall be taken as the maximum of these differences, when
expressed as a percentage of the mean deflection at each calibration torque.
⎥⎦⎤
⎢⎣⎡ ×
− 100Max 21
ddd
where: d is the mean deflection; d1 is the deflection from first series in the 0° mounting position; d2 is the deflection from second series in the 0° mounting position.

Good Practice Guide 107
8
Worked example
Calibration data
N·m 0° (1) 0° (2) …… Mean Value Repeatability0 0.0000 0.0000 0.0000
40 0.3986 0.3983 0.3992 0.075%80 0.7970 0.7966 0.7991 0.050%
120 1.1963 1.1960 1.1987 0.025%160 1.5944 1.5942 1.5985 0.013%200 1.9935 1.9931 1.9978 0.020%
hence repeatability = 0.075%
d
⎥⎦⎤
⎢⎣⎡ ×
− 10021
ddd
4.2 Hysteresis ~ difference between measurements of transducer deflection for the same applied torque, one measurement being obtained by increasing the torque from zero, the other by decreasing the torque from the maximum calibration torque.
a. Follow the basic calibration procedure in section 3, but in addition apply a single decreasing series of torques with the transducer in the zero degree orientation.
b. Calculate the difference between the increasing and decreasing deflections for each applied torque.
c. The hysteresis shall be taken as the maximum of these differences, when expressed as a percentage of the increasing deflection.
⎥⎦
⎤⎢⎣
⎡×
−100
'Max
i
ii
ddd
where: di is the deflection for the incremental series; di’ is the deflection for the decremental series. Worked example
Calibration data
N·m 0° inc 0° dec …… Mean Value Hysteresis0 0.0000 -0.0004 0.0000
40 0.3986 0.3995 0.3992 0.226%80 0.7970 0.7985 0.7991 0.188%
120 1.1963 1.1981 1.1987 0.150%160 1.5944 1.5958 1.5985 0.088%200 1.9935 1.9935 1.9978
hence hysteresis = 0.226%
d
⎥⎦
⎤⎢⎣
⎡×
− 100'
i
ii
ddd
Good Practice Guide 107
9
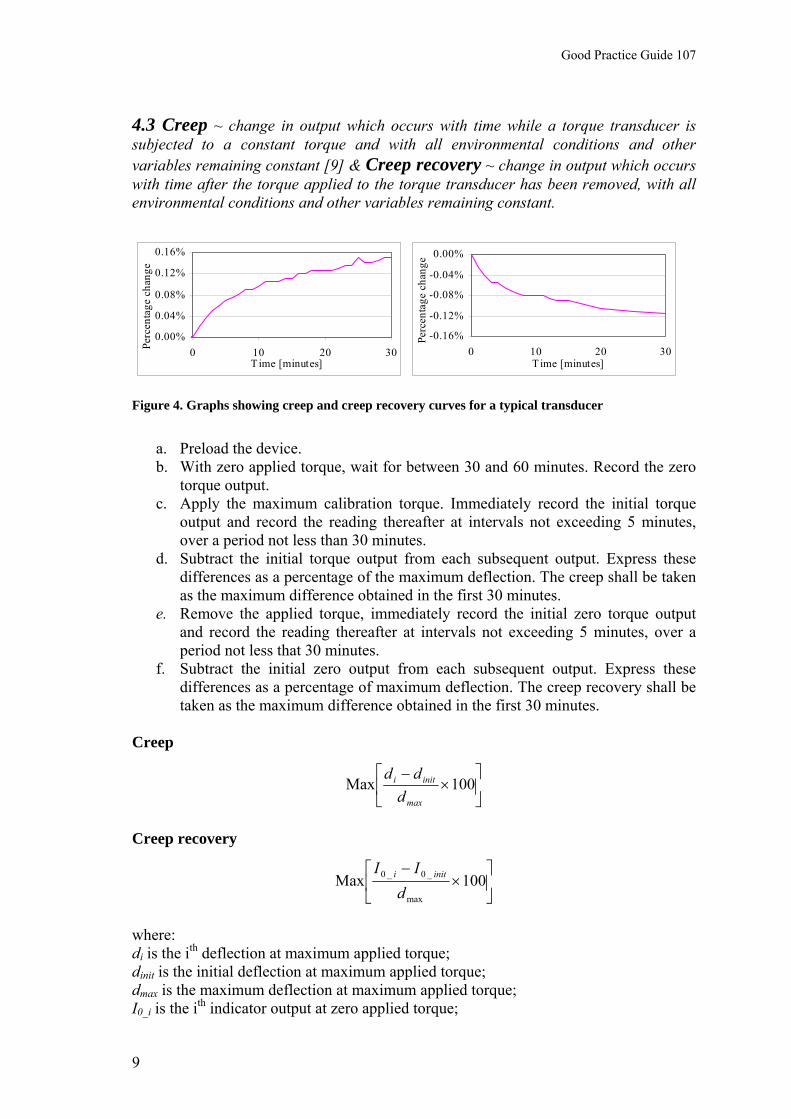
4.3 Creep ~ change in output which occurs with time while a torque transducer is subjected to a constant torque and with all environmental conditions and other variables remaining constant [9] & Creep recovery ~ change in output which occurs with time after the torque applied to the torque transducer has been removed, with all environmental conditions and other variables remaining constant.
0.00%
0.04%
0.08%
0.12%
0.16%
0 10 20 30Time [minutes]
Perc
enta
ge c
hang
e...
-0.16%
-0.12%
-0.08%
-0.04%
0.00%
0 10 20 30Time [minutes]
Perc
enta
ge c
hang
e...
Figure 4. Graphs showing creep and creep recovery curves for a typical transducer
a. Preload the device. b. With zero applied torque, wait for between 30 and 60 minutes. Record the zero
torque output. c. Apply the maximum calibration torque. Immediately record the initial torque
output and record the reading thereafter at intervals not exceeding 5 minutes, over a period not less than 30 minutes.
d. Subtract the initial torque output from each subsequent output. Express these differences as a percentage of the maximum deflection. The creep shall be taken as the maximum difference obtained in the first 30 minutes.
e. Remove the applied torque, immediately record the initial zero torque output and record the reading thereafter at intervals not exceeding 5 minutes, over a period not less that 30 minutes.
f. Subtract the initial zero output from each subsequent output. Express these differences as a percentage of maximum deflection. The creep recovery shall be taken as the maximum difference obtained in the first 30 minutes.
Creep
⎥⎦
⎤⎢⎣
⎡×
−100Max
max
initi
ddd
Creep recovery
⎥⎦
⎤⎢⎣
⎡×
−100Max
max
_0_0
dII initi
where: di is the ith deflection at maximum applied torque; dinit is the initial deflection at maximum applied torque; dmax is the maximum deflection at maximum applied torque; I0_i is the ith indicator output at zero applied torque;
Good Practice Guide 107
10
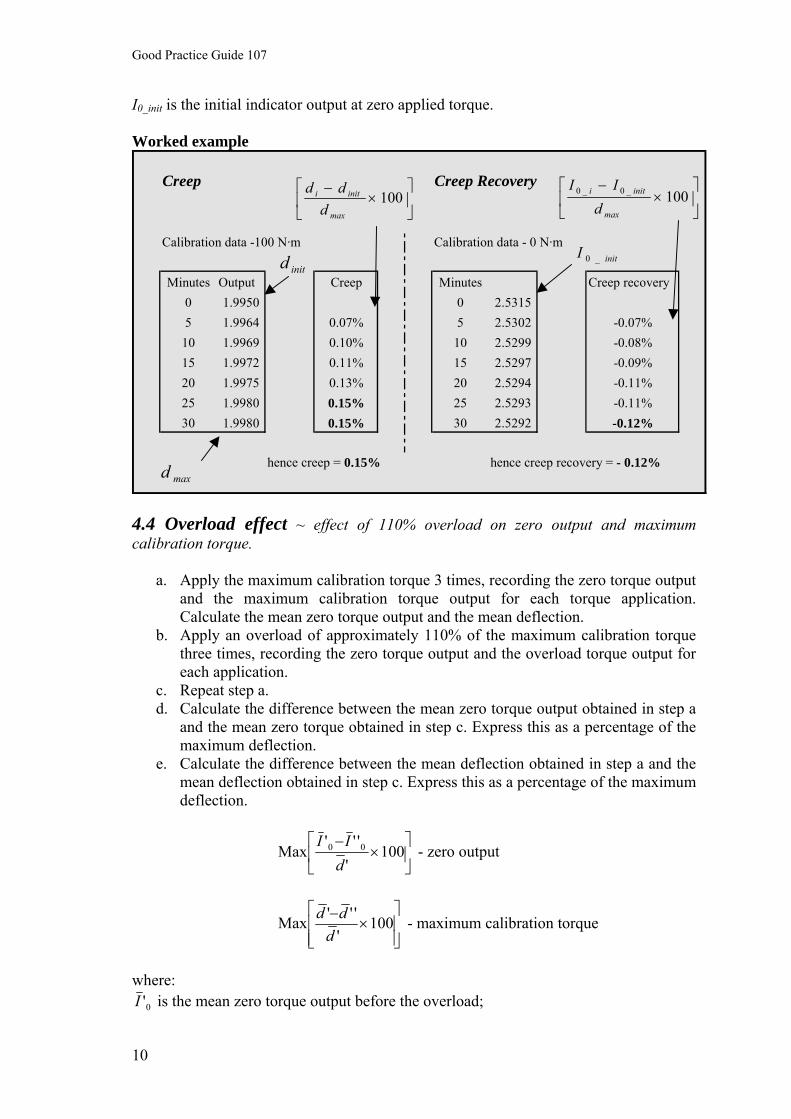
I0_init is the initial indicator output at zero applied torque. Worked example
Creep Creep Recovery
Calibration data -100 N·m Calibration data - 0 N·m
Minutes Output Creep Minutes Creep recovery0 1.9950 0 2.53155 1.9964 0.07% 5 2.5302 -0.07%10 1.9969 0.10% 10 2.5299 -0.08%15 1.9972 0.11% 15 2.5297 -0.09%20 1.9975 0.13% 20 2.5294 -0.11%25 1.9980 0.15% 25 2.5293 -0.11%30 1.9980 0.15% 30 2.5292 -0.12%
hence creep = 0.15% hence creep recovery = - 0.12%
⎥⎦
⎤⎢⎣
⎡×
− 100max
initi
ddd
⎥⎦
⎤⎢⎣
⎡×
−100_0_0
max
initi
dII
initd initI _0
maxd
4.4 Overload effect ~ effect of 110% overload on zero output and maximum calibration torque.
a. Apply the maximum calibration torque 3 times, recording the zero torque output and the maximum calibration torque output for each torque application. Calculate the mean zero torque output and the mean deflection.
b. Apply an overload of approximately 110% of the maximum calibration torque three times, recording the zero torque output and the overload torque output for each application.
c. Repeat step a. d. Calculate the difference between the mean zero torque output obtained in step a
and the mean zero torque obtained in step c. Express this as a percentage of the maximum deflection.
e. Calculate the difference between the mean deflection obtained in step a and the mean deflection obtained in step c. Express this as a percentage of the maximum deflection.
⎥⎦
⎤⎢⎣
⎡×
−100
''''
Max 00
dII
- zero output
⎥⎥⎦
⎤
⎢⎢⎣
⎡×
− 100'
'''Maxd
dd - maximum calibration torque
where:
0'I is the mean zero torque output before the overload;

Good Practice Guide 107
11
0''I is the mean zero torque output after the overload; 'd is the mean deflection before the overload;
''d is the mean deflection after the overload. Worked example
zero output maximum calibration torque
Calibration data
0 N·m 100 N·m-0.010133 -1.345833
-0.010144 -0.010146 -1.345846 -1.345842-0.010153 -1.345846
0 N·m 110 N·m-0.010156 -1.479461
-0.0035% -0.010175 -1.479478 -0.0040%-0.010184 -1.479482
0 N·m 100 N·m-0.010192 -1.345897
-0.010191 -0.010188 -1.345888 -1.345895-0.010194 -1.345900
hence overload effect on zero output = 0.0035 % overload effect on maximum output = 0.0040 %
⎥⎦
⎤⎢⎣
⎡×
− 100'
''' 00
dIIMax
⎥⎥⎦
⎤
⎢⎢⎣
⎡×
−100
''''
ddd
Max
0'I
0''I
'd
''d
4.5 Bending effects ~ effects of side loads on the calibration result [10]. This test is to be carried out on a symmetrical unsupported calibration beam.
a. Calibrate to the basic calibration method in Section 3. b. At each calibration torque record the deflection then apply an additional 50% of
the load on each side of the beam, so that 150% of the applied load is in the direction the direction the torque is to be applied and 50% of the load is in the opposite direction. Record the deflection. Remove the additional load and then apply the next increasing torque.
c. Calculate the maximum difference between the single and double loading deflections at each increasing calibration torque across the measurement series and at different orientations, expressing this as a percentage of the single load deflection.
d. The bending parameter shall be taken as the maximum of these differences, when expressed as a percentage of the deflection.
⎥⎥⎦
⎤
⎢⎢⎣
⎡×
−100Max
sin
sin
g
gdoub
ddd
where: dsing
is the deflection for the single loading series;

Good Practice Guide 107
12
ddoub is the deflection for the double loading series.
Worked example
N·m single double bending N·m single double bending200 0.129842 0.129872 0.023% 200 0.129754 0.129744 -0.008%400 0.264157 0.264214 0.022% 400 0.264035 0.263999 -0.014%600 0.398471 0.398559 0.022% 600 0.398298 0.398260 -0.010%800 0.532792 0.532930 0.026% 800 0.532587 0.532526 -0.011%
1000 0.667134 0.667284 0.022% 1000 0.666868 0.666845 -0.003%
N·m single double bending N·m single double bending200 0.129717 0.129702 -0.012% 200 0.129852 0.129887 0.027%400 0.263983 0.263949 -0.013% 400 0.264166 0.264218 0.020%600 0.398262 0.398210 -0.013% 600 0.398485 0.398578 0.023%800 0.532540 0.532464 -0.014% 800 0.532809 0.532913 0.020%
1000 0.666830 0.666806 -0.004% 1000 0.667133 0.667318 0.028%
hence bending parameter = 0.028%……between 20% & 100% of applied torque
0°
180°
90°
270°
⎥⎥⎦
⎤
⎢⎢⎣
⎡×
−100
sin
sin
g
gdoub
ddd
d sing d doub
4.6 Output stability at zero torque ~ drift in zero value. Through regular use, knowledge of a transducer’s long-term stability can be built up. For a new transducer, or one with little history the following tests (4.7 & 4.8) can give some indication of the stability of the transducer. The longer the stability test the better although this has to be balanced against practicalities.
a. Mount the transducer in the calibration rig and allow at least 30 minutes to settle.
b. With zero applied torque take a series of 15 readings at regular time intervals over a period of at least 48 hours simultaneously recording temperature.
c. Record the spread and express as a percentage of maximum deflection.
where: I0 max is the maximum output with zero applied torque; I0 min is the minimum output with zero applied torque; d max is the deflection at the maximum calibration torque.
100×−
dmaxminImaxI 00

Good Practice Guide 107
13
0.010106
0.010110
0.010114
0.010118
0.010122
0 10 20 30 40 50 60
Time [Hours]
Out
put [
mV
/V]
Figure 5. Output stability at zero torque over a 56 hour period
4.7 Output stability at maximum torque ~ drift at maximum calibration torque.
a. Preload the transducer according to the procedure in Section 3. b. Apply the maximum calibration torque. c. While maintaining the maximum calibration torque take a series of 15 readings
at regular time intervals over a period of at least 48 hours simultaneously recording temperature.
d. Record the spread and express as a percentage of maximum deflection.
⎥⎦⎤
⎢⎣⎡ ×
− 100Maxdmax
dmindmax
where: dmax is the maximum deflection recorded over the measurement period; dmin is the minimum deflection recorded over the measurement period.
Good Practice Guide 107
14
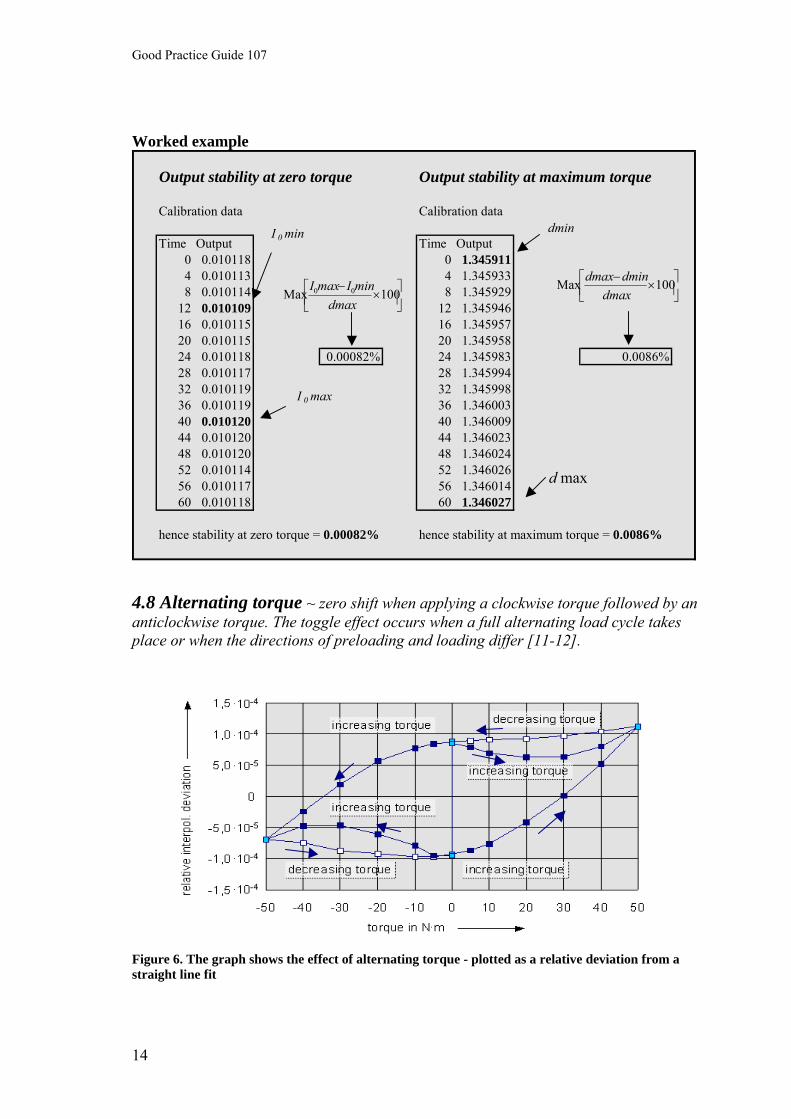
Worked example
Output stability at zero torque Output stability at maximum torque
Calibration data Calibration data
Time Output Time Output0 0.010118 0 1.3459114 0.010113 4 1.3459338 0.010114 8 1.345929
12 0.010109 12 1.34594616 0.010115 16 1.34595720 0.010115 20 1.34595824 0.010118 0.00082% 24 1.345983 0.0086%28 0.010117 28 1.34599432 0.010119 32 1.34599836 0.010119 36 1.34600340 0.010120 40 1.34600944 0.010120 44 1.34602348 0.010120 48 1.34602452 0.010114 52 1.34602656 0.010117 56 1.34601460 0.010118 60 1.346027
hence stability at zero torque = 0.00082% hence stability at maximum torque = 0.0086%
⎥⎦⎤
⎢⎣⎡ ×
− 100Max 00
dmaxminImaxI ⎥⎦
⎤⎢⎣⎡ ×
− 100Maxdmax
dmindmax
maxd
I 0 min
I 0 max
dmin
4.8 Alternating torque ~ zero shift when applying a clockwise torque followed by an anticlockwise torque. The toggle effect occurs when a full alternating load cycle takes place or when the directions of preloading and loading differ [11-12].
Figure 6. The graph shows the effect of alternating torque - plotted as a relative deviation from a straight line fit
Good Practice Guide 107
15
a. Calibrate to the basic calibration procedure in section 3 in both clockwise and anticlockwise directions.
b. Calculate the mean zero output for the clockwise calibration. Calculate the mean zero output for the anticlockwise calibration. The toggle value shall be taken as the difference between these two values expressed as a percentage of the mean of the magnitude of the two maximum deflections for the clockwise and anticlockwise calibrations.
1002/][
00 ×+−
antidclockdantiIclockI
maxmax
where: clockI 0 is the mean zero output in the clockwise direction; antiI 0 is the mean zero output in the anti-clockwise direction;
clockd max is the mean maximum deflection in the clockwise direction; antid max is the mean maximum deflection in the anti-clockwise direction.
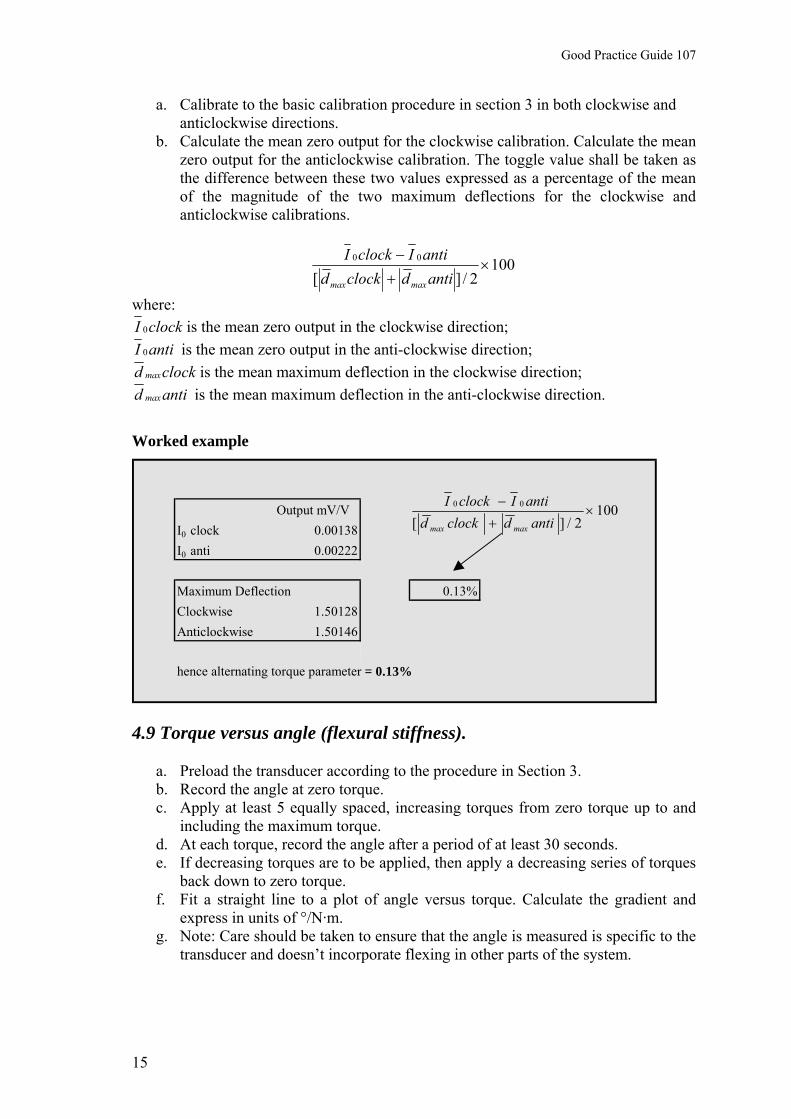
Worked example
Output mV/VI0_clock 0.00138I0_anti 0.00222
Maximum Deflection 0.13%Clockwise 1.50128Anticlockwise 1.50146
hence alternating torque parameter = 0.13%
1002/][
00 ×+−
antidclockdantiIclockI
maxmax
4.9 Torque versus angle (flexural stiffness).
a. Preload the transducer according to the procedure in Section 3. b. Record the angle at zero torque. c. Apply at least 5 equally spaced, increasing torques from zero torque up to and
including the maximum torque. d. At each torque, record the angle after a period of at least 30 seconds. e. If decreasing torques are to be applied, then apply a decreasing series of torques
back down to zero torque. f. Fit a straight line to a plot of angle versus torque. Calculate the gradient and
express in units of °/N·m. g. Note: Care should be taken to ensure that the angle is measured is specific to the
transducer and doesn’t incorporate flexing in other parts of the system.
Good Practice Guide 107
16
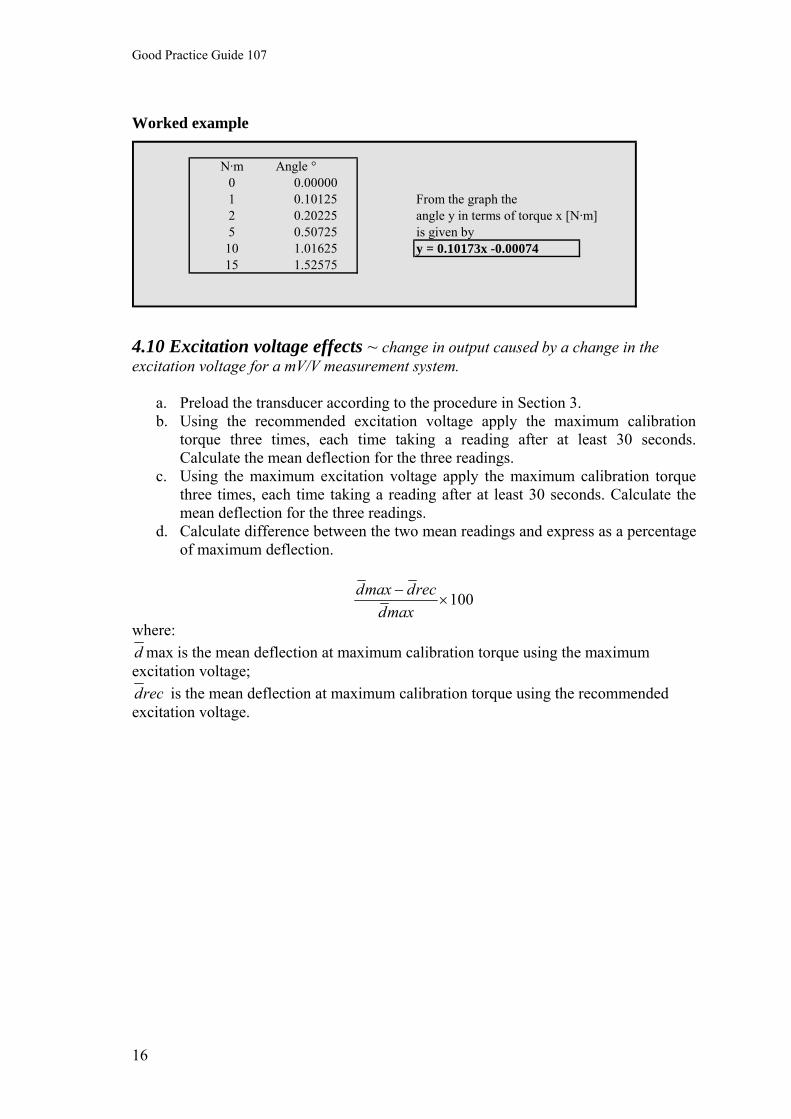
Worked example
N·m Angle °0 0.000001 0.10125 From the graph the2 0.20225 angle y in terms of torque x [N·m]5 0.50725 is given by
10 1.01625 y = 0.10173x -0.0007415 1.52575
4.10 Excitation voltage effects ~ change in output caused by a change in the excitation voltage for a mV/V measurement system.
a. Preload the transducer according to the procedure in Section 3. b. Using the recommended excitation voltage apply the maximum calibration
torque three times, each time taking a reading after at least 30 seconds. Calculate the mean deflection for the three readings.
c. Using the maximum excitation voltage apply the maximum calibration torque three times, each time taking a reading after at least 30 seconds. Calculate the mean deflection for the three readings.
d. Calculate difference between the two mean readings and express as a percentage of maximum deflection.
100×−
maxdrecdmaxd
where: maxd is the mean deflection at maximum calibration torque using the maximum
excitation voltage; recd is the mean deflection at maximum calibration torque using the recommended
excitation voltage.

Good Practice Guide 107
17
Worked example
Recommended excitation voltage Maximum exctiation voltage8 V 12 V
0 2.5267 0 2.5291200 4.5239 200 4.5269
0 2.5275 0 2.5297200 4.5246 200 4.5273
0 2.5280 0 2.5297200 4.5245 200 4.5274
1.9969 1.9977
0.038%
hence difference due to change in excitation voltage = 0.038%
maxdrecd
100×−
maxdrecdmaxd
5. Environmental tests 5.1 Temperature sensitivity at zero torque ~ change in zero output with change in temperature.
a. Set the temperature to 20 ° C and record the zero output. b. Set the temperature to the lower limit of the compensated temperature range.
Record the zero output. c. Set the temperature to the upper limit of the compensated temperature range.
Record the zero output. d. Set the temperature to 20 ° C and record the zero output. e. For each temperature change calculate the change in zero torque output and
divide by the change in temperature. Take the maximum of these 3 figures and express as a percentage of maximum deflection per degree Celsius.
⎥⎦
⎤⎢⎣
⎡Δ−
=°Δtemp
temp2Itemp1I )()(deg/0 00
100)deg/0(Max)0( ×°Δ
=d
TSens
where: I0(temp1) is the zero output at the first temperature; I0(temp2) is the zero output at the second temperature; Δtemp is the difference between the two temperatures; d is the maximum deflection at 20 °C.
Good Practice Guide 107
18
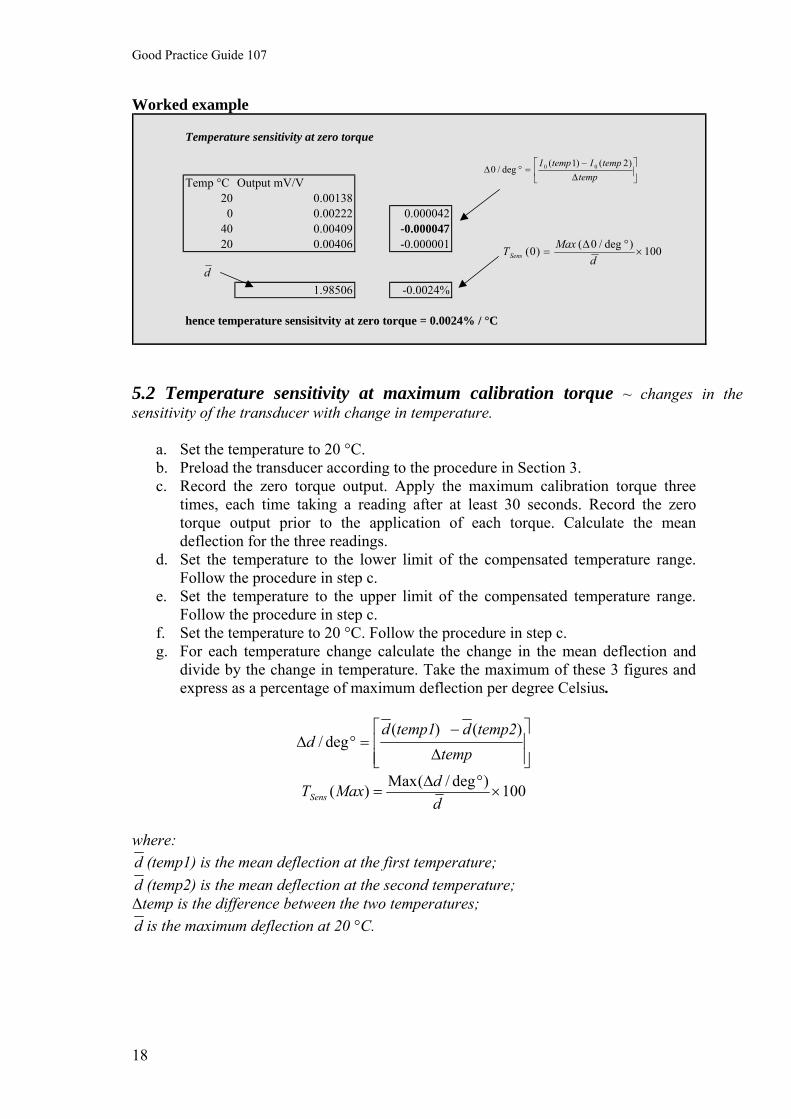
Worked example
Temperature sensitivity at zero torque
Temp °C Output mV/V20 0.00138
0 0.00222 0.00004240 0.00409 -0.00004720 0.00406 -0.000001
1.98506 -0.0024%
hence temperature sensisitvity at zero torque = 0.0024% / °C
⎥⎦
⎤⎢⎣
⎡Δ−
=°Δtemp
tempItempI )2()1(deg/0 00
100)deg/0()0( ×°Δ
=d
MaxTSens
d
5.2 Temperature sensitivity at maximum calibration torque ~ changes in the sensitivity of the transducer with change in temperature.
a. Set the temperature to 20 °C. b. Preload the transducer according to the procedure in Section 3. c. Record the zero torque output. Apply the maximum calibration torque three
times, each time taking a reading after at least 30 seconds. Record the zero torque output prior to the application of each torque. Calculate the mean deflection for the three readings.
d. Set the temperature to the lower limit of the compensated temperature range. Follow the procedure in step c.
e. Set the temperature to the upper limit of the compensated temperature range. Follow the procedure in step c.
f. Set the temperature to 20 °C. Follow the procedure in step c. g. For each temperature change calculate the change in the mean deflection and
divide by the change in temperature. Take the maximum of these 3 figures and express as a percentage of maximum deflection per degree Celsius.
⎥⎥⎦
⎤
⎢⎢⎣
⎡
Δ
−=°Δ
temptemp2dtemp1d
d)()(
deg/
100)deg/(Max)( ×°Δ
=ddMaxTSens
where: d (temp1) is the mean deflection at the first temperature; d (temp2) is the mean deflection at the second temperature; Δtemp is the difference between the two temperatures; d is the maximum deflection at 20 °C.

Good Practice Guide 107
19
Worked example
Temperature sensitivity at maximum calibration torque
Temp °C Mean deflection mV/V20 1.99753
0 1.98419 -0.00066740 2.00475 -0.00051420 1.99721 -0.000377
1.98506 -0.034%
hence temperature sensitivity at maximum calibration torque = 0.034% / °C
d
⎥⎥⎦
⎤
⎢⎢⎣
⎡
Δ
−=°Δ
temptempdtempd
d)2()1(
deg/
100)deg/()( ×°Δ
=ddMaxMaxTSens
6. Dynamic 6.1 Frequency response (electronic) ~ characterised by magnitude of the system’s response.
a. Introduce a small AC signal into the torque measuring device and measure the output signal at the output of the indicating device.
b. Slowly increase the frequency (f) of the AC signal and measure the change in the amplitude of the output signal plotting an output against frequency graph.
c. The graph should be reasonably linear until the frequency reaches the limits of the electronic bandwidth or edge of any low-pass filter. The frequency (f) at which output (f)=0.707*outputMax can be taken as a measure of the bandwidth of the system or frequency response.
Figure 7. Example of the frequency response for a system
6.2 Speed effect on zero ~ changes in the zero output of the transducer due to rotational effects.
Good Practice Guide 107
20
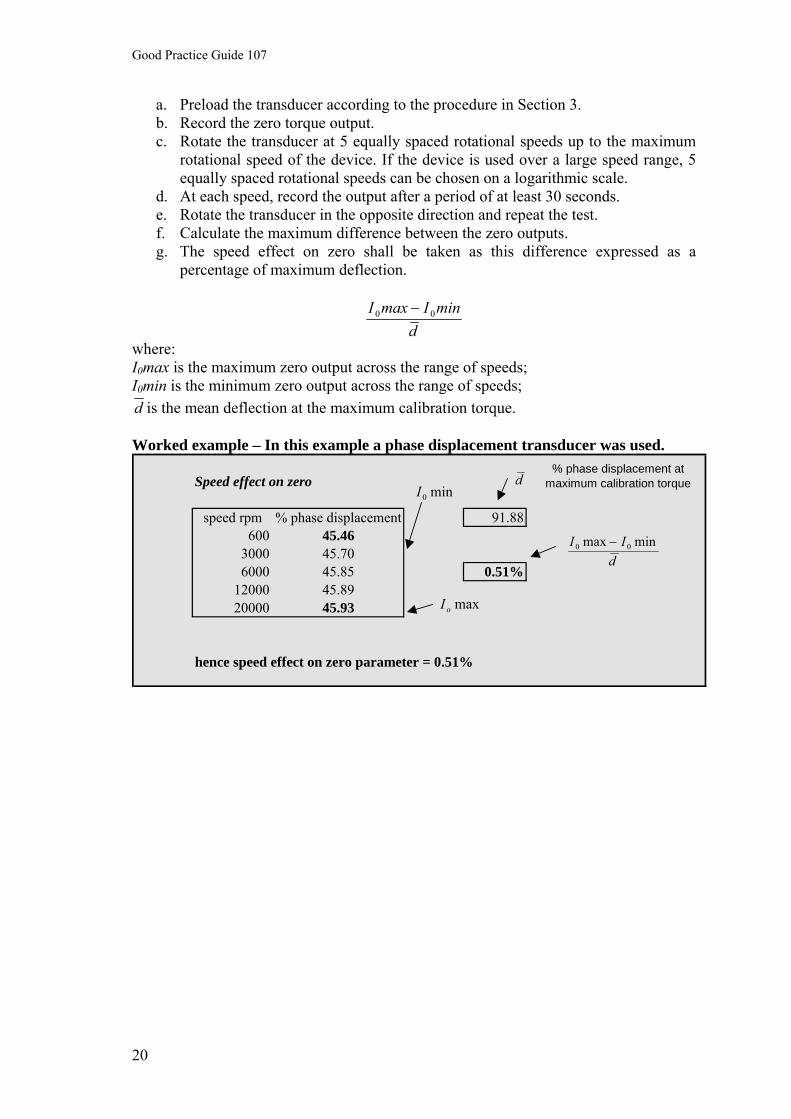
a. Preload the transducer according to the procedure in Section 3. b. Record the zero torque output. c. Rotate the transducer at 5 equally spaced rotational speeds up to the maximum
rotational speed of the device. If the device is used over a large speed range, 5 equally spaced rotational speeds can be chosen on a logarithmic scale.
d. At each speed, record the output after a period of at least 30 seconds. e. Rotate the transducer in the opposite direction and repeat the test. f. Calculate the maximum difference between the zero outputs. g. The speed effect on zero shall be taken as this difference expressed as a
percentage of maximum deflection.
dminImaxI 00 −
where: I0max is the maximum zero output across the range of speeds; I0min is the minimum zero output across the range of speeds; d is the mean deflection at the maximum calibration torque. Worked example – In this example a phase displacement transducer was used.
Speed effect on zero
speed rpm % phase displacement 91.88600 45.46
3000 45.706000 45.85 0.51%
12000 45.8920000 45.93
hence speed effect on zero parameter = 0.51%
dII minmax 00 −
d
maxoI
min0I
% phase displacement at maximum calibration torque
Good Practice Guide 107
21
7. Glossary Applied torque ~ the torque applied to a transducer by a torque machine or rig. Deflection ~ the difference between the output at an applied torque and the output with no applied torque. Stabilisation ~ the process of allowing a transducer and readout, to acclimatise to new conditions. This may be the environmental conditions in a laboratory or a change in the applied torque. Resolution ~ the smallest increment that can be measured by the indicating unit or if the readout is fluctuating half the magnitude of the largest fluctuation. Mounting position ~ the particular orientation of a transducer in the torque machine or calibration rig. The transducer is calibrated symmetrically in several orientations to eliminate any positional dependencies. This is measured by the reproducibility of the transducer. Misalignment ~any offset between the two ends of the machine or rig to which the transducer is connected. This offset may be radial, angular or axial. The offset will introduce parasitic forces into the transducer, which can influence the measurement result. Uncertainty ~ The applied torque for a particular rig should have an associated uncertainty which takes into account all of the contributing parameters and are traceable to calibration certificates for mass and length etc. Similarly the measurement result for a calibration will have an associated uncertainty. This will include the uncertainty of the applied torque together with transducer parameters such as reproducibility measured during the calibration. More information on working out calibration uncertainties can be found in some of the standards listed in this guide. Static torque calibration ~ a process where discrete torque increments are applied in a stepwise manner with time allowed for stabilisation of the transducer at each applied torque. Continuous torque calibration ~ a process where applied torque is applied in a continuous linear manner up to the maximum calibration torque The process takes a fraction of the time of a static torque calibration and data from the transducer can be recorded continuously. The applied torque, applied by the torque machine is usually measured by a calibrated reference torque transducer. Reference torque transducer ~a high performance transducer that can be used to measure or control the applied torque of a torque machine or as a transfer standard to provide a comparison between different torque machines. Long terms stability / drift ~ the change in the output of the transducer over a significant time period such as the interval between successive calibrations.

Good Practice Guide 107
22
8. Acknowledgements The author would like to acknowledge the support of the following individuals and companies, for their contributions to the project including technical input, provision of data and the loan of equipment. Mr Chanchal Bahra, Instron Ltd. Mr Pete Goddard, Alpha Technologies UK. Mr Malcolm Habens, Datum Electronics Ltd. Mr Peter Lewis, Applied Measurements Ltd. Mr Paul Miles, Industrial Measurements Ltd. Mr Ben Van Millingen, Torquemeters Ltd. Mr Barry Pratt, Norbar Torque Tools Ltd. Mr Jeff Tanner & Dr Serghei Sandacci, Sensor Technology Ltd. The pictures in figures 1 (right) and 6 are reproduced with the kind permission of the PTB. Finally the author would like to acknowledge the financial support of the National Measurement System of the Directorate UK Department of Innovation, Universities and Skills. 9. References [1] BS 7882:1997; Calibration and classification of torque measuring devices. [2] DIN 51309:1998; Calibration of static torque measuring devices. [3] Robinson A, 2007 The Design, Development and Commissioning of a 2 kN·m
Torque Standard Machine. CalLab, Jan – Mar. [4] Merlo S, 2001 The uncertainty of torque primary standards: a comprehensive
analysis. Measurement 29 pp. 279-285. [5] Brüge A, Peschel D and Röske D, 2000 The influence of misalignment on
torque transducers. Proceedings of the 16th Imeko World Congress, Vienna, Austria, vol. III, pp. 13-17.
[6] Röske D, 1998 Investigation of the Influence of Disturbing Components on the Torque Measurement. Proceedings of the 16th Imeko TC3 Conference, Taejon, Korea, pp. 280-285.
[7] Brüge A, 1996 Influence of eccentric mounting on the calibration of torque measuring devices. Proceedings of the 15th Imeko TC3 Conference, Madrid, Spain, pp. 255-259.
[8] Peschel D, 1993 Mechanical parasitic components and their influence on the calibration of torque transducers. Proceedings of the 13th Imeko TC3 Conference, Helsinki, Finland, pp. 91-96.
[9] Peschel D, Röske D; 1999 Determination of creep value using short-term creep. Proceedings of the 15th Imeko World Congress, Osaka, Japan, vol. III, pp. 245-249.
[10] Pratt B, Robinson A, 2006 A comparison between supported and unsupported beams for use in static torque calibrations. Proceedings of the 18th Imeko World Congress, Rio.

Good Practice Guide 107
23
[11] Röske D, Peschel D, 1997 Investigations into the alternating torque calibration of torque transducers. Proceedings of the 14th Imeko World Congress, Tampere, Finland, vol. III, pp. 72-78.
[12] Röske D, 2003 Discussion on calibration results for alternating torque in comparison with single cw and acw torque calibrations. Round table TC3 17th Imeko World Congress, Dubrovnik.