A Method to determine Partial Weight Enumerator for Linear
75
Computer Engineering and Intelligent Systems www.iiste.org ISSN 2222-1719 (Paper) ISSN 2222-2863 (Online) Vol 3, No.10, 2012 1 A Method to determine Partial Weight Enumerator for Linear Block Codes Saï d NOUH 1* , Bouchaib AYLAJ 2 and Mostafa BELKASMI 1 1. Mohammed V-Souisi University, SIME Labo, ENSIAS, Rabat, Morocco. 2. Chouaib Doukkali University, MAPI Labo, Faculty of Science, El jadida, Morocco * E-mail of the corresponding author: [email protected] Abstract In this paper we present a fast and efficient method to find partial weight enumerator (PWE) for binary linear block codes by using the error impulse technique and Monte Carlo method. This PWE can be used to compute an upper bound of the error probability for the soft decision maximum likelihood decoder (MLD). As application of this method we give partial weight enumerators and analytical performances of the BCH(130,66) , BCH(103,47) and BCH(111,55) shortened codes; the first code is obtained by shortening the binary primitive BCH (255,191,17) code and the two other codes are obtained by shortening the binary primitive BCH(127,71,19) code. The weight distributions of these three codes are unknown at our knowledge. Keywords: Error impulse technique, partial weight enumerator, maximum likelihood performance, error correcting codes, shortened BCH codes, Monte Carlo method. 1. Introduction The current large development and deployment of wireless and digital communication has a great effect on the research activities in the domain of error correcting codes. Codes are used to improve the reliability of data transmitted over communication channels, such as a telephone line, microwave link, or optical fiber, where the signals are often corrupted by noise. Coding techniques create code words by adding redundant information to the user information vectors. Decoding algorithms try to find the most likely transmitted codeword related to the received word as illustrated in the figure 1. Decoding algorithms are classified into two categories: Hard decision and soft decision algorithms. Hard decision algorithms work on a binary form of the received information. In contrast, soft decision algorithms work directly on the received symbols (Clark 1981). Figure1. A simplified model a communication system. Let C(n,k,d) be a binary linear block code of length n, dimension k and minimum distance d. The weight enumerator of C is the polynomial: 0 () n i i i Ax Ax Information Source Encoder codeword Decoder decodedwo Message Message Destination Received Signal Channel
Transcript of A Method to determine Partial Weight Enumerator for Linear

Computer Engineering and Intelligent Systems www.iiste.org ISSN 2222-1719 (Paper) ISSN 2222-2863 (Online)
Vol 3, No.10, 2012
1
A Method to determine Partial Weight Enumerator for Linear Block
Codes
Saïd NOUH1*
, Bouchaib AYLAJ2 and Mostafa BELKASMI
1
1. Mohammed V-Souisi University, SIME Labo, ENSIAS, Rabat, Morocco.
2. Chouaib Doukkali University, MAPI Labo, Faculty of Science, El jadida, Morocco
* E-mail of the corresponding author: [email protected]
Abstract
In this paper we present a fast and efficient method to find partial weight enumerator (PWE) for binary linear block
codes by using the error impulse technique and Monte Carlo method. This PWE can be used to compute an upper
bound of the error probability for the soft decision maximum likelihood decoder (MLD). As application of this
method we give partial weight enumerators and analytical performances of the BCH(130,66) , BCH(103,47) and
BCH(111,55) shortened codes; the first code is obtained by shortening the binary primitive BCH (255,191,17) code
and the two other codes are obtained by shortening the binary primitive BCH(127,71,19) code. The weight
distributions of these three codes are unknown at our knowledge.
Keywords: Error impulse technique, partial weight enumerator, maximum likelihood performance, error correcting
codes, shortened BCH codes, Monte Carlo method.
1. Introduction
The current large development and deployment of wireless and digital communication has a great effect on the
research activities in the domain of error correcting codes. Codes are used to improve the reliability of data
transmitted over communication channels, such as a telephone line, microwave link, or optical fiber, where the
signals are often corrupted by noise. Coding techniques create code words by adding redundant information to
the user information vectors. Decoding algorithms try to find the most likely transmitted codeword related to
the received word as illustrated in the figure 1.
Decoding algorithms are classified into two categories: Hard decision and soft decision algorithms. Hard decision
algorithms work on a binary form of the received information. In contrast, soft decision algorithms work directly on
the received symbols (Clark 1981).
Figure1. A simplified model a communication system.
Let C(n,k,d) be a binary linear block code of length n, dimension k and minimum distance d. The weight enumerator
of C is the polynomial:
0
( )n
i
i
i
A x A x
Information
Source
Encoder
codeword
Decoder
decodedwo
rd
Message Message
Destination
Received Signal
Channel

Computer Engineering and Intelligent Systems www.iiste.org ISSN 2222-1719 (Paper) ISSN 2222-2863 (Online)
Vol 3, No.10, 2012
2
Where Ai denotes the number of codewords of weight i in C. The weight of a word is the number of non-zero
elements it contains. The polynomial A is one of the keys to obtain an exact expression for the error detection and
error correction performance of C (Clark 1981 and Berlekamp 1984). It can be used to compute an upper bound on
the error correcting performances for the soft decision maximum likelihood decoding algorithm (MLD): The
probability of a decoding error with the MLD decoder denoted by ep can be upper bounded as follows (Clark
1981):
(1)
Where A is the weight enumerator of C, R=k/n is the code rate, Eb /N0 is the energy-per-bit to noise ratio and Q(x) is
given by:
(2)
The error correcting performances obtained by Equation (1) are called the analytical performance of C.
In (Fossorier 1998), authors show that for systematic binary linear codes with binary transmission over AWGN
channel, the probability of bit error denoted by Pb(C) or BER(bit error rate), has the following upper bound:
(3)
The above bound holds only for systematic encoding; this shows that systematic encoding is not only desirable, but
actually optimal in the above sense.
In general the determination of the weight enumerator is a NP-hard problem; the simplest way is the exhaustive
research which requires the computing of 2k codewords.
For some codes, the wealth of their algebraic structures permits to determine the weights enumerators; so many
excellent studies on the determination of the weights enumerators of quadratic codes or their extended codes were
succeed (Gaborit 2005, Tjhai 2008, Su 2008, Mykkeltveit 1972) and the weights enumerators are known for all
lengths less than or equal to 167.
In (Fujiwara 1993) authors have found the weight enumerators of the primitive BCH codes of length 255 and
dimension less than 64 or big than 206.
In (Sidel’nikov 1971) Sidel’nikov has proved that the weight enumerator of some binary primitive BCH codes can be
given by the approximate following formula:
Where and K is a constant. n is the code length in the form 2m-1 and t is the error correction
capability of the code. In (Kasami 1985) Kasami et al have given an approximation of the weight enumerator of
linear codes with the binomial distribution by using a generalization of the Sidel’nikov result.
The BCH codes, as a class, are one of the most known powerful error-correcting cyclic codes. The most common BCH
codes are characterized as follows: specifically, for any positive integer m ≥ 3 , and t < 2m
- 1
, there exists a
binary BCH code with the following parameters:
Block length : n=2m-1
Number of message bits : k ≤ n-mt
Minimum distance : d ≥ 2t + 1
These BCH codes are called primitive because they are built using a primitive element of GF (2m).
The code obtained by removing a fixed coordinates of a primitive BCH code is called a shortened BCH code. Thus
the BCH(130,66) code is obtained by removing 125 coordinates of the binary primitive BCH(255,191,17) code; the
BCH(103,47) and BCH(111,55) codes are obtained by removing respectively 24 and 16 coordinates of the
binary primitive BCH(127,71,19) code.
In this paper an approximation of partial weight enumerators of the BCH(130,66), BCH(111,55) and BCH(103,47)
codes are given.
0
( ) 2n
b
wew d
C Q wR Ep AN
2
21
( )2 x
zQ x dze
0
( 2 )n
w bb
w d
wA Ep Q wR
n N
2 . 1n
mt
j jj
A R
0.1
.jR K n

Computer Engineering and Intelligent Systems www.iiste.org ISSN 2222-1719 (Paper) ISSN 2222-2863 (Online)
Vol 3, No.10, 2012
3
In (Nouh 2011), authors have used genetic algorithms combined with the Monte Carlo method for finding the weight
enumerator of the quadratic residue code of lengths 191 and 199. This method is efficient when the linear system
obtained from the Mac Williams identity (MacWilliams 1977) contains a small number of unknowns after its
simplification (Nouh 2011). For the BCH(130,66) code it remains 37 unknowns then the method given in (Nouh 2011)
can’t be used. So we introduce here a new method allowing determination of a partial weight distribution of a block
code.
The remainder of this paper is organized as follows. On the next section, we define the partial weight enumerators of
a code and the corresponding analytical performances. In section 3 we present the proposed method for
approximating a partial weight enumerator. In section 4 we give a validation of the proposed method and we give
their results for some BCH codes. Finally, a conclusion and a possible future direction of this research are outlined in
section 4.
2. Partial weight enumerator and analytical performances.
2.1 Union bound on the error probability of the Maximum likelihood Decoding algorithm (MLD).
Let be p a positive integer less than n-d. The polynomial is called the partial weight
enumerator of radius p of the code C having the weight enumerator A.
Let be the function ( )eP p defined by Equation (4):
(4)
The Equation (3) becomes: (5)
The Equation (2) shows that increase slowly with p and there exists an appropriate value of p for which the
value of becomes negligible comparing to therefore the code C performances can be analyzed by using a
partial weight enumerator of radius p. In this paper we will show by simulation that the appropriate value of p can be
chosen between 2 and 4 without big alteration of the analytical performances.
We have firstly decoded the extended (24,12,8) Golay code having the weight enumerator:
8 12 16 241 759 2576 759A X X X X X by the MLD decoder. The figure 2 shows a comparison between the
simulated error correcting performance of the MLD decoder and the analytical performance AP(WE) obtained by
Equation (3) and the weight enumerator (WE=A). Practically the performances are the same for the values of SNR
greater than 2. The simulation parameters of the MLD decoder are given in the table 1.
Table 1. The simulation parameters.
Simulation parameter value
Channel AWGN
Modulation BPSK
Minimum number of residual bit in errors 200
Minimum number of transmitted blocks 5000
( ) 1p d
p i
i
i d
A x A X
0
( ) ( 2 )p
w be
w d
wA EP p Q wR
n N
( )e e
pp p
( )e
pp( )
epp

Computer Engineering and Intelligent Systems www.iiste.org ISSN 2222-1719 (Paper) ISSN 2222-2863 (Online)
Vol 3, No.10, 2012
4
0 1 2 3 4 5 6 7
10-5
10-4
10-3
10-2
10-1
SNR (dB)
BE
R
AP(WE)
MLD
Figure 2. Comparison between simulated and analytical performances of the MLD decoder for the extended
(24,12,8) Golay code.
The figure 3 shows a comparison between the analytical performances AP (WE) obtained by Equation (3) when the
weight enumerator (WE=A) is completely used and the analytical performances AP (PWE) obtained by the same
formula with only the first two terms of A (PWE=1+759X8). Practically the obtained analytical performance is the
same for all values of SNR.
Figure 3. Comparison of the analytical performances obtained by WE and PWE for the extended (24,12,8)
Golay code.
To compare the analytical performances obtained by the weight enumerator and those obtained by a partial weight
0 1 2 3 4 5 6 7
10-5
10-4
10-3
10-2
10-1
SNR (dB)
BE
R
AP(WE)
AP(PWE)
MLD

Computer Engineering and Intelligent Systems www.iiste.org ISSN 2222-1719 (Paper) ISSN 2222-2863 (Online)
Vol 3, No.10, 2012
5
enumerator of radius p between 4 and 8 for relatively long codes we give in the figure 4 the analytical performances
for the BCH(127,57,23) code by using only the first p terms of its weight enumerator given in (Desaki 1997).
Practically the performances are the same for all values of SNR greater than 3 dB.
Figure 4. Impact of the radius p on the analytical performances of the BCH (127, 57, 23) code.
3. The proposed method for finding a partial weight enumerator.
3.1 Monte Carlo method.
In the general case, the Monte Carlo method consists in formulating a game of chance or a stochastic process which
produces a random variable whose expected value is the solution of a certain problem. An approximation to the
expected value is obtained by means of sampling from the resulting distribution. This method is used for example in
the evaluation of some integrals (Bauer 1958).
3.2 The proposed method for approximating a partial weight enumerator of linear block codes.
In order to have a good approximation of the partial weight enumerator, we propose the following probabilistic
method, which is a variant of Monte Carlo method.
Let Cw be the set of all codewords of weight w in C and Lw a subset of Cw. We define the recovery rate of Lw related
to Cw by: R( ) / | |w w wL L C (6)
Where the symbol . denotes the cardinal.
When Lw is available, the value of R( )wL can be computed statistically with a percentage of error and wC
can be approximated by w w| L | /R L .
When a codeword c of weight w is drawn at random, there are two cases:
- c is an element of Lw and it is called intern code word.
- c isn’t an element of Lw and it is called extern code word.
0 1 2 3 4 5 6 7 7.75
10-20
10-15
10-10
10-5
100
Eb/N
0 (dB)
BE
RBCH(127,57,23)
p=106
p=4
p=6
p=8

Computer Engineering and Intelligent Systems www.iiste.org ISSN 2222-1719 (Paper) ISSN 2222-2863 (Online)
Vol 3, No.10, 2012
6
In the practice the recovery rate wR=R(L ) can be evaluated statistically by the following algorithm:
Inputs: Lw , M (minimum number of intern code words)
Outputs: R (recovery rate)
Begin
S0; i 0;
While (S < M) do:
i i+1;
Drawn at random a codeword c from Cw.
If c wL then SS+1; end if.
End while.
R( wL ) /s i .
End.
To get the confidence interval of R corresponding to the precision we use the algorithm above at each time j to
compute a value R jof R. When the process is repeated q times the value of R belongs to the interval:
With a probability of error equal to
Where:
is the average value of the recovery rate.
is the variance of R.
is the solution of the equation: (7)
The table 2 gives the values of for some values of between 94% and 99.99
Table 2. Some values of .
0.9999 3.89
0.99 2.57
0.98 2.32
The confidence interval wI | C | of the number of code words having the weight w can be written as follows:
* * * *. .( ) ; ;left rightI R R R R R
q q
*
1
1
.q
j
j
R q R
*2
1
1( )
1
q
j
j
R Rq
2
22
12
u
e du
w
| | | |I | C | ;w w
right left
L L
R R

Computer Engineering and Intelligent Systems www.iiste.org ISSN 2222-1719 (Paper) ISSN 2222-2863 (Online)
Vol 3, No.10, 2012
7
When the variance is null and the recovery rate is equal to 1 we can decide that wL is equal to wC .
3.3 Error impulse technique to find a list of codewords of a given weight.
The automorphism group of a code C(n,k,d) is the set of permutations under which it remain invariant. For cyclic
codes, this group contains all cyclic permutations of length n. When a codeword cC is available then a set of
codeword having the same weight as c can be obtained by applying these permutations.
The error impulse technique (Berrou 2002, ASKALI 2012) is a fast and efficient method to find the minimum
distance of linear codes. In this work we use this technique to find not only codewords of the minimum weight but a
list of codewords with small weights as follow:
Let be c1 a codeword to transmit over a communication channel, in the modulation phase c
1 is converted to the
sequence c2 which will transmitted and it can be perturbed by a noise e therefore the received sequence r with float
symbols can be different from c1. The soft decision decoding algorithms try to decode the sequence r, in general, by
searching the codeword c2 having the smallest Euclidean distance from r. When the decided codeword c
2 is not equal
to c1 the sum c
3=c
1+c
2 is a codeword having in general a small weight. When this process is iterated a list Lw of code
words having the weight w can be obtained.
4.Validation of the proposed METHOD.
4.1 Validation of the proposed method.
To validate the proposed method we give in the table 4 the exact partial weight enumerators and the approximated
partial weight enumerators of radius 3 for some linear codes. This table shows that the proposed method yield a very
good approximation (true at 100%) of a partial weight enumerators. Therefore it can be used as a powerful tool to
analyze the performances of linear error correcting codes of average lengths.
Table 3. Comparison between the exact and approximated PWE.
Code The exact PWE The approximated PWE
QR(47,24)
11 : 4324
12 : 12972
15 : 178365
11 : 4324
12 : 12972
15 : 178365
QR(71,36)
11 : 497
12 : 2485
15 : 47570
11 : 497
12 : 2485
15 : 47570
QR(73,37)
13 : 1533
14 : 6570
15 : 19272
13 : 1533
14 : 6570
15 : 19272
When the dimension of the code C is large, the proposed method can be used to approximate the PWE of C, the table
4 gives the confidence intervals wI | C | regarding the approximated partial weight enumerator of the
BCH(127,50,27) code generated by the polynomial:
.
With M=10, =2.57, q=100. The table 5 gives a comparison between the exact PWE and its approximated value. It
shows that w| C | is in general in the confidence interval or it is near to its extremities.
1 2 3 5 6 9 10 11 13 14 15 17 18 26 27 28 33 35 36 37 38 42
1
43 45 47 48 51 56 57 58 59 60 64 65 68 72 75 77
1g (x)= + x + x + x + x + x + x + x + x + x + x + x + x + x + x + x + x + x + x + x + x + x + x +
x + x + x + x + x + x + x + x + x + x + x + x + x + x + x x

Computer Engineering and Intelligent Systems www.iiste.org ISSN 2222-1719 (Paper) ISSN 2222-2863 (Online)
Vol 3, No.10, 2012
8
Table 4. Confidence interval wI | C | for the BCH ( 127,50) code.
w | |wL
*
R wI | C |
27 104 0,26045736 0.086847 [35364; 41993]
28 104
0,06536888 0.023571 [140004; 168602]
31 104
0,01171173 0.004031 [3922283; 4683496]
32 104
0,00370467 0.001421 [12285596; 14972120]
Table 5. Validation of approximated PWE for BCH (127,50).
The exact PWE The approximated PWE w w| C | I | C |
27 : 40894
28 : 146050
31 : 4853051
32 : 14559153
27 : 38394
28 : 152978
31 : 4269224
32 : 13496466
Yes
Yes
No
Yes
4.2 Application on some BCH codes.
By using the proposed method with the OSD3 decoder (Fossorier 1995) we give in the table 6 the confidence
interval of a partial weight enumerators for BCH(130,66), BCH(103,47) and BCH(111,55) codes. The first code is
obtained by shortening the binary primitive BCH (255,191,17) code generated by the polynomial g2 and the two
other codes are obtained by shortening the binary primitive BCH(127,71,19) code generated by the polynomial g3.
4 10 11 13 16 17 20 23 24 25 28 32 35 39 40 41 42
3
43 44 45 46 48 49 51 53 56
( ) 1g x x x x x x x x x x x x x x x x x x
x x x x x x x x x
2 3 5 6 9 10 11 14 15 16 22 23 24 25 26 27 31 34 35 37
2
39 40 42 43 45 46 47 48 49 52 53 56 58 59 60 62 63 64
( ) 1g x = + x + x + x + x + x + x + x + x + x + x + x + x + x + x + x + x + x + x + x + x +
x + x + x + x + x + x + x + x + x + x + x + x + x + x + x + x + x + x

Computer Engineering and Intelligent Systems www.iiste.org ISSN 2222-1719 (Paper) ISSN 2222-2863 (Online)
Vol 3, No.10, 2012
9
Table 6. Confidence intervals.
Code Weight w I(|CW|)
BCH (130,66)
17 [58;58]
18 [284; 339]
19 [1244; 14 57]
20 [10155; 13233]
BCH (103,47)
19 [3319;24252]
20 [14336; 27760]
21 [17552;901580]
22 [120862;183060]
BCH(111,55)
19 [ 20163; 27212]
20 [78991;127621]
21 [154269;317927]
22 [648819;1335370]
The confidence intervals regarding the approximated partial weight enumerator of the three BCH codes given in the
table 6 are obtained by using the parameter =3.89 all other parameters are given in the table 7 with the average
values of w| C | for each weight w. By using the approximated PWE we give in the figure 5 (above) the
approximated analytical performance of these codes.

Computer Engineering and Intelligent Systems www.iiste.org ISSN 2222-1719 (Paper) ISSN 2222-2863 (Online)
Vol 3, No.10, 2012
10
Table 7. Approximated partial weight enumerator of some BCH codes.
C w |Lw| R q M |Cw|
BC
H (
13
0,6
6) 17 58 1 30 0 10 58
18 232 0.748731 101 0.169188 5 309
19 911 0.678383 133 0.158547 6 1342
20 1478 0.128609 45 0.029190 10 11492
BC
H (
10
3,4
7) 19 300 0.051368 3 0.017364 10 5840
20 795 0.042046 7 0.009120 10 18709
21 530 0.015391 3 0.006591 10 34434
22 2351 0.016147 9 0.002548 10 145795
BC
H(1
11,5
5) 19 1062 0.045848 258 0.028164 5 23163
20 877 0.008987 76 0.004740 5 97583
21 1002 0.004823 30 0.002354 5 207738
22 836 0.000957 10 0.000269 5 873317
0 1 2 3 4 5 6 7
10-15
10-10
10-5
Eb/N
0 (dB)
Pe(C
)
BCH(130,66)
BCH(103,47)
BCH(111,55)
Figure 5. The analytical performances obtained by PWE for the BCH (130, 66), BCH (103, 47) and BCH
(111, 55) codes.
4.3 Run time of the proposed method.
The table 8 shows the run time of the proposed method for two linear codes by using a simple PC configuration:
AMD Athlon™ 64 processor, 1GB of RAM. It shows that we can obtain a partial weight enumerator in a few
minutes for codes of average length and dimension.

Computer Engineering and Intelligent Systems www.iiste.org ISSN 2222-1719 (Paper) ISSN 2222-2863 (Online)
Vol 3, No.10, 2012
11
Table 8. Run time of the proposed method.
Code Weight Run time of the proposed method (in seconds)
BCH(63,39) 9 73 s
10 383 s
11 5840 s
QR(71,36) 11 43 s
12 254 s
15 10291 s
5. Conclusion.
In this paper we have presented an efficient method for finding a partial weight enumerator of a linear code and
therefore its analytical performance. Using the error impulse technique and some elements of the automorphism
group a large list of code words of a given weight can be obtained and it can be used in a Monte Carlo method for
approximating a partial weight enumerator. This method is validated on some codes with known weight
enumerator and it is then used to get the partial weight enumerators and the performances of other codes with
unknown weight enumerators.
References
Clark G.C., and Cain J.B., (1981) “Error-Correction Coding for Digital Communications,” first edition Springer,
New York ,30 June,.
Berlekamp E.R., (1984) “Algebraic Coding Theory, ” Second Edition, Aegean Park Press, Laguna Hills
California
Gaborit P., Nedeloaia C.S., and Wassermann A., (2005) “On the weight enumerators of duadic and quadratic residue
codes, ” IEEE Trans. Inf. Theory, Vol. 51, pp. 402–407, January.
Tjhai C., Tomlinson M., Ambroze M., and Ahmed M., (2008) “On the weight distribution of the extended quadratic
residue code of prime 137” 7th
International ITG Conference on Source and Channel Coding, Germany ,14–16
January.
Su W., Lee C., Lin T., Truong T., Chang Y., (2008) “On Determination of the Weight Distribution of Binary (168,
84, 24) Extended Quadratic Residue Code, ” ISIT 2008, Toronto, Canada, 6 -11 July.
Mykkeltveit J., Lam C., and McEliece R. J., (1972) “On the weight enumerators of quadratic residue codes, ” JPL
Technical Report 32-1526, Vol.12, pp.161–166.
Fujiwara T., and Kasami T., (1993) “The Weight Distribution of (256,k) Extended Binary Primitive BCH Code with
k <= 63, k>=207, ” Technical Report of IEICE, IT97-Vol.46, pp.29-33, September.
Bauer W. F., (1958) “The Monte Carlo Method,” J Soc Ind and Applied Math, Vol. 6, No. 4, pp. 438-451,
December.
Nouh S., and Belkasmi M. (2011) “Genetic algorithms for finding the weight enumerator of binary linear block
codes”, International Journal of Applied Research on Information Technology and Computing IJARITAC volume 2,
issue 3.
Sidel’nikov V. M., (1971) “Weight spectrum of binary Bose-Chaudhuri-Hoquinghem codes, ” Prohl. Peredachi
Inform., Vol. 7, No. 1, pp.14-22, January.-March.
Kasami T., Fujiwara T., and Lin S. (1985) “An Approximation to the Weight Distribution of Binary Linear Codes,”
IEEE Transactions on Information Theory, Vol. 31,No. 6, pp. 769-780.

Computer Engineering and Intelligent Systems www.iiste.org ISSN 2222-1719 (Paper) ISSN 2222-2863 (Online)
Vol 3, No.10, 2012
12
Fossorier M. P. C., Lin S. and Rhee D., (1998) “Bit-Error Probability for Maximum-Likelihood Decoding of Linear
Block Codes and Related Soft-Decision Decoding Methods, ” IEEE Trans. Inf. Theory, vol. 44 no. 7, pp.
3083–3090, Nov.
MacWilliams F.J, and N.J.A. Sloane, (1977) “The theory of Error-Correcting Codes. North-Holland.
Berrou C. and Vaton S., (2002) “Computing the minimum distance of linear codes by the error impulse method, ” in
Proc. IEEE Intl. Symp. Inform. Theory, Lausanne, Switzerland, July.
ASKALI M., NOUH S. and Belkasmi M., (2012) “An Efficient method to find the Minimum Distance of Linear
Codes”, International Conference on Multimedia Computing and Systems proceeding, May 10-12, Tangier,
Morocco.
Desaki Y., Fujiwara T. and Kasami T., (1997) "The Weight Distribution of Extended Binary Primitive BCH Code of
Lenght 128," IEEE Transaction on Information Theory, 43, 4, pp.1364-1371, July.
Fossorier M.P.C. and lin S. (1995) “Soft decision decoding of linear block codes based on ordered statistics”, IEEE Trans. information theory Vol. 41, pp. 1379-1396, sep.
S. NOUH – Phd student, Ecole nationale Supérieure d'informatique et d'analyse Système, ENSIAS, Avenue
Mohammed Ben Abdallah Regragui, Madinat Al Irfane, BP 713, Agdal Rabat, Maroc; e-mail: [email protected].
Major Fields of Scientific Research: Computer Science and Engineering. Areas of interest are Information and
Coding Theory.
B. AYLAJ – Phd student, Université de Chouaib Doukkali, MAPI Labo, Faculté des sciences, Route Ben Maachou,
24000, El jadida, Maroc; e-mail: [email protected]. Major Fields of Scientific Research: Computer Science
and Engineering. Areas of interest are Information and Coding Theory.
M. Belkasmi – Professor, Ecole nationale Supérieure d'informatique et d'analyse Système, ENSIAS, Avenue
Mohammed Ben Abdallah Regragui, Madinat Al Irfane, BP 713, Agdal Rabat, Maroc; e-mail: [email protected].
Major Fields of Scientific Research: Computer Science and Engineering. Areas of interest are Information and
Coding Theory.

Computer Engineering and Intelligent Systems www.iiste.org ISSN 2222-1719 (Paper) ISSN 2222-2863 (Online)
Vol 3, No.10, 2012
13
Efficient Solar Powered Smartphone for Nigeria’s Telecom
Advancement. Francis Enyi
1, 2* Florence N. Ifezulike
1, 3
1. Computer Science Department, Nnamdi Azikiwe University, Awka, Anambra State, Nigeria.
2. Computer Science Department, Delta State Polytechnic, Ogwashi-Uku, Delta state, Nigeria.
3. IT Department, Nnamdi Azikiwe University Teaching Hospital, Nnewi, Anambra State, Nigeria.
* E-mail of Corresponding Author: [email protected]
Abstract.
This study is aimed at producing an efficient model design of a solar-powered Smartphone that can be used
continuously without the need to recharge their batteries from electrical outlets. There has been recent significant
advancements in the research aimed at developing solar powered Smartphones as against the Smartphones we
have today that requires frequent recharge of their batteries from electrical outlets. But these advancements have
only produced solar Smartphone with efficiency of less than 19%. This study is theoretical due to lack of fund to
produce the empirical design of the efficient solar powered Smartphone. However, it is intended to provide a new
direction for Researchers in solar powered Smartphone Design to enable them produce efficient models that can
continuously work for years without recharging their batteries.
Keywords: Smartphone, Graphene, Photovoltaic, Supertransformer, Electrically-Doped Semiconductor, Solar
1. Introduction:
The term, Smartphone, was probably first used in 1997, when Ericsson described its GS 88 "Penelope" concept as
a "Smart Phone". A Smartphone can be described as a mobile phone that is built on a mobile computing platform,
and has a more advanced computing ability and connectivity than a regular phone. The first Smartphones mainly
combined the functions of PDAs and a mobile phone or camera phone. Today's models combine the functions of
portable media players, high-speed wireless data transfer, low-end compact digital cameras, pocket video
cameras, video game consoles, GPS navigation units, high-resolution touch screens, web browsers that can access
and properly display standard web pages rather than just mobile-optimized sites, and high-speed data access via
Wi-Fi and mobile broadband.
There is no official definition for what constitutes the difference between Smartphones and feature phones.
However, the advanced APIs on Smartphones can allow applications to better integrate with the phone's OS and
hardware than what is obtainable on feature phones. These Smartphones are powered by rechargeable batteries.
Due to the series of application running on Smartphones, the battery life tends to be short. And this requires a
frequent recharging of the batteries by plugging to electricity sockets (Smartphone, 2012).
2. Solar power and solar powered devices and equipment:
Solar power is power derived from energy from the sun. Energy can be derived from the sun in a number of
ways, but we will focus on energy derived from the sun using photovoltaic (PV) devices or solar panels. Solar
panels are the major component of a solar power system. It converts light energy from the sun to direct current
DC electric voltage. Solar panels are made up of arrays of photovoltaic cells (solar cells), connected in series and
in parallel to deliver rated voltage and power.
The PV cell is the basic component of a solar panel. PV cells are made from semiconductor materials, like
silicon, and doped with other elements, like Boron and phosphorus. These elements create an N-type layer and a
P-type layer on the cell. The junctions between the N-type layer and P-type layer contains an electric field, which
stops electrons from moving across the junction, effectively creating an open circuit. Some materials exhibit a
photoelectric effect that causes them to absorb photons of light and release electrons. When a PV cell is exposed
to sunlight, photons continuously strike the p-n junction area of the cell and are absorbed. Energy derived from
these absorbed photons provides electrons on the cell with enough energy to overcome the potential barrier of the
electric field in the p-n junction. When these free electrons are captured, an electric current results that can be
used as electricity. (Okafor, 2009). Photovoltaics is the direct conversion of light into electricity at the atomic
level. The photoelectric effect was first noted by a French physicist, Edmund Bequerel, in 1839, who found that
certain materials would produce small amounts of electric current when exposed to light. The nature of light and
the photoelectric effect on which photovoltaic technology is based, was described in 1905 by Albert Einstein. The

Computer Engineering and Intelligent Systems www.iiste.org ISSN 2222-1719 (Paper) ISSN 2222-2863 (Online)
Vol 3, No.10, 2012
14
first photovoltaic module was built by Bell Laboratories in 1954 as a solar battery and was too expensive to gain
widespread use. In the 1960s, the space industry began to use the technology to provide power aboard spacecraft.
Then the technology advanced, and became reliable and the cost began to decline. During the energy crisis in the
1970s, photovoltaic technology gained recognition as a source of power for non-space applications (Knier, 2011).
Modules are designed to supply electricity at a certain voltage. The current produced is directly dependent on how
much light strikes the module. PV modules are now used to provide electrical energy to various devices, equipment
and structures. Some houses are built with Building-integrated photovoltaics (BIPV). BIVPs are photovoltaic
materials that are used to replace conventional building materials in parts of the building envelope such as the roof,
skylights, or facades. They are increasingly being incorporated into the construction of new buildings as a principal
or ancillary source of electrical power, although existing buildings may be retrofitted with BIPV modules as well
(Building-integrated photovoltaics, 2012). In Nigeria, PV modules are used to provide energy for street lighting,
calculators, water boreholes projects etc. Two things hold back the mass adoption of solar energy as a source of
sustainable energy. One is the need to store and transmit excess power, the other is the high cost of solar panels. One
of the reasons solar panels are so expensive is that it is tricky to extract electric currents from semiconductors, the
materials used to convert solar radiation into electrical energy (Finley, 2012).
3. Batteries:
Battery is a device that converts chemical energy into electricity. It consists of two or more cells connected in series
or parallel, but the term is also used for single cells. All cells consist of a liquid, paste, or solid electrolyte and a
positive electrode, and a negative electrode. The electrolyte is an ionic conductor; one of the electrodes will react,
producing electrons, while the other will accept electrons. When the electrodes are connected to a device to be
powered, called a load, an electrical current flows.Batteries in which the chemicals cannot be reconstituted into
their original form once the energy has been converted , are called primary cells or voltaic cells. Batteries in which
the chemicals can be reconstituted by passing an electric current through them in the direction opposite that of
normal cell operation are called secondary cells, rechargeable cells, storage cells, or accumulators.
3.1 lead-acid battery:
The storage battery, which can be recharged by reversing the chemical reaction, was invented in 1859 by the French
physicist Gaston Planté. Planté's cell was a lead-acid battery. Its major advantage is that it can deliver a strong
current of electricity for starting an engine; however, it runs down quickly. The electrolyte is a dilute solution of
sulfuric acid, the negative electrode consists of lead, and the positive electrode of lead dioxide. In operation, the
negative lead electrode dissociates into free electrons and positive lead ions. The electrons travel through the
external electric circuit, and the positive lead ions combine with the sulfate ions in the electrolyte to form lead
sulfate. When the electrons reenter the cell at the positive lead-dioxide electrode, another chemical reaction occurs.
The lead dioxide combines with the hydrogen ions in the electrolyte and with the returning electrons to form water,
releasing lead ions in the electrolyte to form additional lead sulfate.
A lead-acid storage cell runs down as the sulfuric acid gradually is converted into water and the electrodes are
converted into lead sulfate. When the cell is being recharged, the chemical reactions described above are reversed
until the chemicals have been restored to their original condition. A lead-acid battery has a useful life of about four
years. It produces about 2 V per cell. Recently, lead batteries with useful lives of 50 to 70 years have been
developed for special applications.
3.2 alkaline battery:
Another secondary cell is the alkaline cell, or nickel-iron battery, developed by the American inventor Thomas
Edison in the 1900s. The principle of operation is the same as in the lead-acid cell except that the negative electrode
consists of iron, the positive electrode is of nickel oxide, and the electrolyte is a solution of potassium hydroxide.
The nickel-iron cell has the disadvantage of giving off hydrogen gas during charging. This battery is used
principally in heavy industry applications. The Edison battery has a useful life of approximately ten years and
produces about 1.15 V.
Another alkaline cell similar to the Edison battery is the nickel-cadmium cell, or cadmium battery which produces
about 1.15 V, and its useful lifetime is about 25 years.

Computer Engineering and Intelligent Systems www.iiste.org ISSN 2222-1719 (Paper) ISSN 2222-2863 (Online)
Vol 3, No.10, 2012
15
3.3 Lithium storage batteries:
Perhaps most notable have been the entrance of lithium batteries into the commercial market and the development
of nickel-hydrogen and nickel–metal hydride cells for use in spacecraft, computers, cellular telephones, and other
applications. Rechargeable lithium–metal anode batteries show commercial promise, with theoretical energy
densities that range from 600 to 2,000 watt-hours per kilogram. Even after allowance is made for the inactive parts
of such cells, the net energy density is still competitive with aqueous systems. Commercially available systems of
this type include lithium–cobalt oxide, lithium–nickel oxide, lithium–manganese dioxide, and
lithium–molybdenum disulfide. Much current research is devoted to developing better oxide and sulfide structures
and better solvent combinations, as well as to preventing the unsafe formation of finely divided lithium during the
recharging of the cells.
3.3.1 lithium-ion cell:
Major commercial success for rechargeable lithium-based batteries came with the development of lithium-ion cells.
The difficult problem of preventing lithium dendrite formation on charging was solved in these cells by using
specially selected carbon powders as a base in which to insert lithium ions to form a weak compound that functions
as a high-voltage, high-energy-density anode. While the energy density is lower than for lithium–metal anode
batteries, their added safety is well worth the sacrifice. These batteries are available for portable computers,
Smartphones, and other devices. The usual cathode is an expensive special cobalt oxide. Even with all of the added
safety of the lithium-ion form, it is still a critical requirement to have precise electronic controls for charging and
discharging.
3.4 Solar battery:
Solar batteries produce electricity by a photoelectric conversion process. The source of electricity is a
photosensitive semiconducting substance such as a silicon crystal to which impurities have been added. When the
crystal is struck by light, electrons are dislodged from the surface of the crystal and migrate toward the opposite
surface. There they are collected as a current of electricity. Solar batteries have very long lifetimes (Battery,
2008).
4. PVC DESIGN AND STRUCTURE:
4.1 Solar cell structure and operation:
Solar cells, whether used in a central power station or a calculator, have the same basic structure. Light enters the
device through an optical coating, or antireflection layer that minimizes the loss of light by reflection; it effectively
traps the light falling on the solar cell by promoting its transmission to the energy-conversion layers below. The
antireflection layer is typically an oxide of silicon, tantalum, or titanium that is formed on the cell surface by
spin-coating or a vacuum deposition technique.
The three energy-conversion layers below the antireflection layer are the top junction layer, the absorber layer,
which constitutes the core of the device, and the back junction layer. Two additional electrical contact layers are
needed to carry the electric current out to an external load and back into the cell, thus completing an electric circuit.
The electrical contact layer on the face of the cell where light enters is generally present in some grid pattern and is
composed of a good conductor such as a metal. Since metal blocks light, the grid lines are as thin and widely spaced
as is possible without impairing collection of the current produced by the cell. The back electrical contact layer has
no such diametrically opposed restrictions. It simply functions as an electrical contact and thus covers the entire
back surface of the cell structure. Because the back layer also must be a very good electrical conductor, it is always
made of metal.
Semiconductors in thicknesses of about one-hundredth of a centimeter or less can absorb all incident visible light;
since the junction-forming and contact layers are much thinner, the thickness of a solar cell is essentially that of the
absorber. Examples of semiconductor materials employed in solar cells include silicon, gallium arsenide, indium
phosphide, and copper indium selenide. When light falls on a solar cell, electrons in the absorber layer are excited
from a lower-energy ground state, in which they are bound to specific atoms in the solid, to a higher excited state, in
which they can move through the solid. In the absence of the junction-forming layers, these free electrons are in
random motion, and so there can be no oriented direct current. The addition of junction-forming layers induces a
built-in electric field that produces the photovoltaic effect. The electric field gives a collective motion to the
electrons that flow past the electrical contact layers into an external circuit where they can do useful work.

Computer Engineering and Intelligent Systems www.iiste.org ISSN 2222-1719 (Paper) ISSN 2222-2863 (Online)
Vol 3, No.10, 2012
16
The materials used for the two junction-forming layers must be dissimilar to the absorber in order to produce the
built-in electric field and to carry the electric current. These may be different semiconductors, or the same
semiconductor with different types of conduction, or they may be a metal and a semiconductor. The photovoltaic
process bears certain similarities to photosynthesis, the process by which the energy in light is converted into
chemical energy in plants. Since solar cells obviously cannot produce electric power in the dark, part of the energy
they develop under light is stored, in many applications, for use when light is not available. One common means of
storing this electrical energy is by charging electrochemical storage batteries. This sequence of converting the energy
in light into the energy of excited electrons and then into stored chemical energy is strikingly similar to the process of
photosynthesis (Solar cell, 2012).
The structural design of a PV cell depends on the limitations of the material used in the PV cell. The four basic device
designs are:
4.1.1 Homojunction Devices:
Crystalline silicon is the primary example of this kind of cell. Single crystalline silicon is altered so that one side is
p-type, dominated by positive holes, and the other side is n-type, dominated by negative electrons. The p/n junction is
located so that the maximum light is absorbed near it. The free electrons and holes generated by light deep in the
silicon diffuse to the p/n junction and then separate to produce a current if the silicon is of sufficiently high quality.
In this homojunction design, these aspects of the cell may be varied to increase conversion efficiency:
Depth of the p/n junction below the cell's surface;
Amount and distribution of dopant atoms on either side of the p/n junction
Crystallinity and purity of the silicon.
Some homojunction cells have also been designed with the positive and negative electrical contacts on the back of the
cell. This geometry eliminates the shadowing caused by the electrical grid on top of the cell. A disadvantage is that the
charge carriers must travel farther, all the way to the back of the cell, to reach an electrical contact. The silicon must be
of very high quality, without crystal defects that cause electrons and holes to recombine.
4.1.2 Heterojunction Devices:
This type of device structure includes copper indium diselenide cell, in which the junction is formed by contacting
different semiconductors, cadmium sulfide and copper indium diselenide. This structure is often chosen to produce
cells made of thin-film materials that absorb light better than silicon. The top layer, or window layer, is a material with
a high bandgap selected for its transparency to light. The window allows almost all incident light to reach the bottom
layer, which is a material with low bandgap that readily absorbs light. This light generates electrons and holes very
near the junction, which separate the electrons and holes before they can recombine.Heterojunction devices have an
inherent advantage over homojunction devices, which require materials that can be doped both p- and n-type. Many
PV materials can be doped either p-type or n-type but not both. Again, because heterojunctions do not have this
constraint, many promising PV materials can be investigated to produce optimal cells.
Also, a high-bandgap window layer reduces the cell's series resistance. The window material can be made highly
conductive, and the thickness can be increased without reducing the transmittance of light. As a result, light-generated
electrons can easily flow laterally in the window layer to reach an electrical contact.
4.1.3 p-i-n and n-i-p Devices:
Amorphous silicon thin-film cells use a p-i-n structure, while cadmium telluride (CdTe) cells use an n-i-p structure. A
three-layer sandwich is created, with a middle intrinsic (i-type or undoped) layer between an n-type layer and a p-type
layer. This geometry sets up an electric field between the p- and n-type regions that stretches across the middle
intrinsic resistive region. Light generates free electrons and holes in the intrinsic region, which are then separated by
the electric field.
In the p-i-n amorphous silicon (a-Si) cell, the top layer is p-type a-Si, the middle layer is intrinsic silicon, and the
bottom layer is n-type a-Si. Amorphous silicon has many atomic-level electrical defects when it is highly conductive,
so very little current would flow if an a-Si cell had to depend on diffusion. In a p-i-n cell, current flows because the
free electrons and holes are generated within the influence of an electric field rather than having to move toward the
field.
4.1.4 Multijunction Devices:

Computer Engineering and Intelligent Systems www.iiste.org ISSN 2222-1719 (Paper) ISSN 2222-2863 (Online)
Vol 3, No.10, 2012
17
In the multijunction cell, individual cells with different bandgaps are stacked on top of one another. The individual
cells are stacked in such a way that sunlight falls first on the material having the largest bandgap. Photons not
absorbed in the first cell are transmitted to the second cell, which then absorbs the higher-energy portion of the
remaining solar radiation while remaining transparent to the lower-energy photons. These selective absorption
processes continue through to the final cell, which has the smallest bandgap.
A multijunction cell can be made two ways. In the mechanical stack approach, two individual solar cells are made
independently, one with a high bandgap and one with a lower bandgap. Then the two cells are mechanically stacked,
one on top of the other. In the monolithic approach, one complete solar cell is made first, and then the layers for the
second cell are grown or deposited directly on the first.
Much of today's research in multijunction cells focuses on gallium arsenide as one (or all) of the component cells.
These cells have efficiencies of more than 35% under concentrated sunlight, which is high for PV devices. Other
materials studied for multijunction devices are amorphous silicon and copper indium diselenide (Photovoltaic Cell
Structures, 2011).
4.1.5 Transparent and Translucent Photovoltaics:
Transparent solar panels use a tin oxide coating on the inner surface of the glass panes to conduct current out of the
cell. The cell contains titanium oxide that is coated with a photoelectric dye.Most conventional solar cells use visible
and infrared light to generate electricity. In contrast, the innovative new solar cell also uses ultraviolet radiation. Used
to replace conventional window glass, or placed over the glass, the installation surface area could be large, leading to
potential uses that take advantage of the combined functions of power generation, lighting and temperature control.
Transparent photovoltaics is also called translucent photovoltaics, they transmit half the light that falls on them.
Inorganic and organic photovoltaics are capable of being translucent (Building-integrated photovoltaics, 2012).
5. Recent Advancement in Solar powered phone:
Although Smartphone technology has advanced rapidly over the last few years with the advent of multi-core mobile
processors, high fidelity displays and a wider breadth of multimedia applications, power consumption remains a
persistent issue. Many models require recharging before reaching a full day's worth of use, but with a new OLED
display technology that can actually recharge itself as it is being used, the days of keeping a charger close at hand may
be numbered (Scott, 2012).
Researcher Arman Ahnood has developed a method to capture light otherwise wasted by OLED displays and convert
it into energy that can be used to recharge a device's central battery unit. According to Ahnood, only 36-percent of the
light produced by OLED displays is projected outward, while the rest is pointed toward the sides and rear. He applied
a thin film of hydrogenated amorphous silicon that is designed to sit within the phone's screen. The layer of film
containing photovoltaic cells gather the wasted energy, as well as capture ambient light from both man-made sources
and the sun. Ahnood's findings offer a small amount of supplemental energy, but with further research it could reach
higher efficiency levels. Making the device work required sidestepping another problem: fluctuations in the voltage
provided by the solar cell, which could have damaged the phone’s battery. The researchers, designed a thin-film
transistor circuit to smooth out voltage spikes and extract electricity more efficiently. And instead of charging the
battery directly, which would have involved adding complex circuitry, they integrated a thin-film supercapacitor for
intermediate energy storage. This combination of photovoltaics, transistors, and supercapacitor yielded a system with
an average efficiency of 11 percent and peak efficiency of 18 percent. If the PV array converts 5 percent of ambient
light to electricity, the energy-harvesting system can generate as much as 165 microwatts per square centimeter under
the right lighting conditions. There are existing CMOS-based switch mode voltage regulators that offer higher
efficiency, but they are not compatible with the thin-film technology used in Smartphone displays. The thin-film
devices can be fabricated at temperatures below 150 °C on lightweight plastic, making them much more attractive for
use in mobile phones. (Savage, 2012).
6. Proposed Design of Efficient solar powered Smartphone:
A PV module should replace the entire back cover of the Smartphone. The usual chemically doped semiconductor
should not be used to design the PV cells, instead an electrically doped semiconductor (using Graphene (Finley,
2012), a highly conductive one-atom-thick sheet of carbon, as a transparent electrode), will be more suitable. The PV
cells can then be miniaturized and translucent. The cells should be arranged in series and parallel to form a thin-film
module with a relatively higher voltage than that of a chemically doped semiconductor. The PV module should be

Computer Engineering and Intelligent Systems www.iiste.org ISSN 2222-1719 (Paper) ISSN 2222-2863 (Online)
Vol 3, No.10, 2012
18
connected to several miniaturized supertransformers that have been connected in series to achieve the rated voltage.
The supertransformers should be integrated into the circuit panel of the Smartphone or the rear side of the PV module.
The supertransformers should then be connected to a thin-film supercapacitor as an intermediate storage and thin-film
transistors to check any voltage fluctuation. The supercapacitor should then be connected to terminals to recharge the
miniaturized lithium-ion battery. The rated voltage produced at the end of the supercapacitor should be sufficient to
recharge the lithium-ion battery and resulting in an acceptable efficiency.
7. Conclusion:
The PV module should replace the entire cover case of the Smartphone. It can be a single-back case when using
models like the Nokia® 5800 xpressmusic or Samsung® Galaxy series, or a double-back case in models like Nokia®
Communicator. It can even serve as case in smaller-sized Smartphones. In Nigeria where the people are blessed with
abundant natural resources, including sunlight, the solar energy should be used for greater productivity. The
temperature in Nigeria averages between 25oC and 28
oC annually, using such solar powered Smartphone will be a
positive option in the right direction. During the day, the Smartphone will run on solar power, while at night, the
lithium-ion battery will sustain it till the next daylight. Thereby providing a twenty four (24) hours uninterrupted
power supply to the Smartphone.This proposed design is theoretical because lack of fund and tools has limited us
from producing the empirical design of the solar powered Smartphone. We hereby urge Researchers trying to produce
an efficient solar powered Smartphone to look in this direction.
References:
1. Anthony, S. (2012, January 19). Smartphone screens with built-in solar cells. Retrieved August 2012,
from Ziff Davis Inc website: www.extremetech.com
2. Battery. (2008). Microsoft® Encarta® 2009 [DVD]. Redmond, WA: Microsoft Corporation.
3. Battery. (2012). Encyclopædia Britannica. Ultimate Reference Suite. Chicago: Encyclopædia Britannica.
4. Building-integrated photovoltaics. (2012 last updated, July 30). Retrieved August 2012, from Wikipedia
Encyclopedia: http://en.wikipedia.org
5. Finley, K. (2012, August). Nano Breakthrough Paves Way for Super Cheap Solar Panels. Retrieved
August 2012, from WIRED Enterprise: www.wired.com
6. Knier, G. (2011 (last updated), April 6). How do Photovoltaics Work? Retrieved August 2012, from
NASA website: http.science.nasa.gov
7. Okafor, P. (2009, September). Solar Power Systems Components Solar Panels. Retrieved August 2012,
from Nigeria Technology Guide: http://www.naijatechguide.com
8. Photovoltaic Cell Structures. (2011, August). Retrieved August 2012, from USA Government Energy
website: www.eere.energy.gov
9. Savage, N. (2012, January). Solar Cells in Smartphone Screens: Researchers advance thin-film energy
harvesters. Retrieved August 2012, from IEEE Spectrum: www.spectrum.ieee.org
10. Scott, L. (2012, January). Solar Smartphone Display Could Lead to Endless Battery Life: Researcher
develops method for capturing energy from the sun and unused light from OLED displays. Retrieved
August 2012, from IGN Entertainment Inc.: http://www.ign.com
11. Smartphone. (2012). Retrieved August 2012, from Wikipedia Encyclopedia: http://en.wikipedia.org
12. Solar cell. (2012). Encyclopædia Britannica. Ultimate Reference Suite. Chicago: Encyclopædia Britannica.

Computer Engineering and Intelligent Systems www.iiste.org ISSN 2222-1719 (Paper) ISSN 2222-2863 (Online)
Vol 3, No.10, 2012
19
The Role of Information Systems in Decision Making: The case of
Jordan Bank
Maha Alkhaffaf
Management Information Systems Dept, Applied Sciences University, PO box 166, Amman 11391, Jordan.
* E-mail of the corresponding author: [email protected]
Abstract
This research aims to analyze the current state of computer information systems and its role in decision making in
Jordan bank. It identifies the types of computer based information systems that is used in the Bank. However, the
research relies on an empirical study and a structured questionnaire. Questionnaire numbered 252 have been
distributed to the studied bank, 212 questionnaires have been retrieved. The study found a strong relationship
between information systems and the process of decision making; on the other hand the results show that Jordan
relies heavily on a number of technologies used by IS to implement their key activities.
Keywords: Information systems, decision making.
1. Introduction
The relationship between information system and decision making is a central concern in the field of information
system (IS). The main objective of information systems is helping decision makers by providing accurate and time
based information helping them in making the right decisions in turbulent environment. A successful organization
nowadays relies heavily on information systems to improve its work in one hand, and on the other hand achieving its
goals and benefits. Management Information Systems helps in solving both structured and unstructured problem
environments. This system is consisted of computers, People, procedures, databases, interactive query facilities
and… Information is considered as a most important ingredient for success decision making in now a days
companies, Due to the importance of information in decision making a developed system has emerged to serve the
appropriate information's to managers for good decision making process; called information system. Such systems
as DSS, MIS, TPS were discussed in this paper to analyze its role in decision making process in the studied
population; Jordan Bank.
1.1 Procedural Definitions
Decision Support Systems: Information system that supports organizational decision-making activities. It is a
software-based system intended to help decision makers compile useful information from raw data, documents,
personal knowledge, and/or business models to identify and solve problems and make decisions.
Information Systems: Professional discipline bridging the business field and the well-defined computer science field
that is evolving toward a new scientific area of study. It includes people, procedures, data, software, and hardware
that are used to gather and analyze digital information.
2. Background
Number of authors has discussed the role of information system in decision making, Kostetsky was one of the first
authors who wrote about the relationship between information systems, system analyst and decision making in 1966.
Management information system provides knowledge about the relative position of the organization and basic forces
at work. It provides the right information needed in decision making process and help the organizations control,
planning and operational functions to be carried out effectively (Reddy, 2090). Furthermore, Ajayi, I. A. and Omirin,
Fadekem investigated the use of management information systems in decision-making on long-term planning, short-
term planning and budgeting in the South-West Nigerian Universities. A stratified random sampling technique was
used to collect data and conclude that that there was a significant difference in the use of MIS for decision making
on budgeting between Federal and State universities in favor of the Federal universities. The authors recommend that
the MIS units should be adequately financed and maintained to ensure a free flow of information and adequate use of
MIS in decision-making on short-term and long-term planning as well as budgeting. Ali Safari and Asefeh Asemi
have discussed two main information systems, namely, MIS and DSS, its characteristics, relations, and connections
of each concept to decision-making process. Srinivas Nowduri has the same consumption about the relationship
between MIS and decision making. Decision making process and its impact on top level management in a business
organization was explained also with an emphasis on automated decision making. The study found that the dynamic
nature of MIS makes it difficult for some organizations to keep up with the principles, strategies, propositions or

Computer Engineering and Intelligent Systems www.iiste.org ISSN 2222-1719 (Paper) ISSN 2222-2863 (Online)
Vol 3, No.10, 2012
20
even ideas. Barry Chris, provide added a new conceptual framework for decision making and information systems
development, same as another authors who analyzed the role of MIS in decision making. A framework was
developed, combining an analysis of decision-making within the systems development life cycle, key models of
decision-making and the actors involved in the process of systems development. Barry Chris concludes that a deeper
understanding of differing viewpoints on systems development held by actors and other phenomena can be illustrated
with the framework. George Huber also draws a theory of effects of advanced information technologies on
organizational design, intelligent and decision making, the theory studied the effects that computer- assisted
communication and decision aiding technologies have on organizational design and decision making. Humber
focuses on technology that affects the quality and timelines of decision making from one side and from the other side
has prompted changes in organizational design. On the other hand Felix Alvarado in his study " Complementary uses
of Information Systems in Decision Making, Planning and Democracy: An Example in the Education Sector"
describes the ongoing implementation of web intelligence tools in public education and other policy sectors in
Guatemala. Software tools were developed for use in business was adopted for planning and decision making in
public institutions. The study summarizes the salient aspects of the experience so far of implementing and expanding
what has been called the “Platform for Integrated Social Information,” It discusses the issues this Platform raises as a
resource for improved public decision making, policy analysis and especially, as a promising but challenging tool for
democracy in the education sector. However, the world health organization has introduced a report by who study
group it was about the role of research and information systems in decision making for the development of human
resource for health, the study identified a number of problems and noted causes of these problems such as inefficient
data definition and, lack of relevant information and poor coordination of available information on the other hand the
study identified a positive factors that prompt decision making such as problem awareness and easy availability of
well presented information. The study group emphasized that strengthening decision making in the development of
human resource of health, by linking information and research to decision making and prompting relevant
information requires a coordinated approach.
3. Research hypothesis
Ho.1 there is no significant relationship between IS and the quality of the managerial decision
Ho.1.1 there is no significant relationship between IS and the degree of accuracy in the managerial decision.
Ho.1.2 there is no significant relationship between IS and the speed of the managerial decision.
Ho1.3 there is no significant relationship between IS and the degree of easiness in the decision making.
Ho.2 there is no significant relationship between IS and the managerial decision making depending on the
standards of information quality.
Ho.3 there is no significant relationship between the information quality standards and the factors of the
managerial decision quality.
4. Research methodology and analysis
A survey research that is able to describe the situation of a company from information gathered through a
questionnaire. It is also possible to form explanations based on statistical analysis of the data. Two main sources will be
used in this research to collect required information: primary sources and secondary sources. Data gathered from
magazines, books and previous published studies of related subjects to e-readiness, in addition to data gathered from
the World Wide Web (Internet). A research methodology justifies the techniques adopted for collecting, analyzing and
interpreting data. Multiple regression will be used to analyze the relationship between the dependent and independent
variables in which the study has a number of independent variables. T Calculated and T tabulated will be used also to
analyze the hypothesis acceptance or rejection.
4.1 Results and Discussion
The table bellows identify the types of used CBISs in order to answer the main research question; what are the types
of CBIS used in the case study (Jordan Bank)?
The most information system that is used in the bank was identified in table is e-mail and voice mail since the
percentage was 94.9 % and the second information was Information system management with percentage 90%. This
high percentage means that; the studied bank relies heavily on these two types of information systems.
4.2 Hypotheses testing

Computer Engineering and Intelligent Systems www.iiste.org ISSN 2222-1719 (Paper) ISSN 2222-2863 (Online)
Vol 3, No.10, 2012
21
Hypothesis .1 There is no significant relationship between IS and the quality of the managerial decision.
In this research the researcher has selected an analytical tool that can be used to analyze the relationship among the
IS and the other factors -Accuracy, Speed, Easiness and Appropriate – and that's why the explanatory factor analysis
have been to as a best way to collect the variable into groups depending on the links relationship among these
factors.
1-Factor One: Accuracy
This factor consisted of four variables used to evaluate the concept of accuracy in decision making, The figure
below shows that this factor has a high value of internal consistency (0.811) and is considered as an indication of
the stability of this factor, where the load factor scores ranged between (0.60) and (0.70) which is considered as
high values comparing to the accepted value (0.400).
2- Factor Two: This factor consisted of four variables used to evaluate the concept of speed in decision making,
so that the bank can be adaptive by making a speed decisions. The figure below shows that this factor has a high
value of internal consistency (0.885) and is considered as an indication of the stability of this factor, where the
load factor scores ranged between (0.541) and (0.741) which is considered as high values comparing to the
accepted value (0.400).
3-Factor Three: This factor consisted of four variables used to evaluate the concept of easiness in decision
making. The figure below shows that this factor has a high value of internal consistency (0.886) and is
considered as an indication of the stability of this factor, where the load factor scores ranged between (0.474)
and (0.662) which is considered as high values comparing to the accepted value (0.400).
Ho.2 There is no significant relationship between IS and the managerial decision making depending on the
standards of information quality.
In order to identify the efficiency of the decision making in the studied bank the researcher has analyzed three
dimensions consisted of sub dimensions:
1- Time dimension
2- Formal dimension
3- Content dimension
1- Time Dimension
This dimension contains three variables concerned about the effect of time dimension of information that in
order effect on the process of decision making
The table below shows that the factor 23 has the highest loading.
2- Formal dimension
Four variables was concerned about this dimension; Clarity, Arrangements and Inclusiveness. Clarity means that the
information is easy to understand by the user, Arrangements means that the information is presented in a sequential
way depending on the need for this information, Inclusiveness means that the information is complete and cover all
the details.
3- content dimension
This dimension contains three variables accuracy, relatedness and completeness, Accuracy means that the
information is correct and doesn't has any mistakes, relatedness means that the information is related to the
subject of decision and help the user in making the decision, finally the completeness means that the information
help the user in all the details needed in making the decision.
Ho.3 there is no significant relationship between the information quality standards and the factors of the
managerial decision quality.
The table below shoes the multiple regressions, it shows that number of factors of information quality explained 39%
of the variance in degree of risk in terms of the value of F statistically significant at the level of ( 0,001 > a ) and
shows the values of T calculated that the effect of the formal dimension and the content dimension was statistically
significant at the level of (0,001 > a) while no significant effect of the time dimension in explaining the variation, the
reason of this that the importance of the decision under the risk impose the decision maker to be careful and ell
planed, and this mean that the management in the studied population focuses on the careful decision making in the
risk events, on the other hand using technological tools and information systems to minimize the importance of time
factor.
The Table also shows that the dimensions of the information quality explained 62% in the variance of the managerial

Computer Engineering and Intelligent Systems www.iiste.org ISSN 2222-1719 (Paper) ISSN 2222-2863 (Online)
Vol 3, No.10, 2012
22
decision quality, and the value of T calculated shows that the effect of the three variables (factors of the managerial
decision quality) was statistically significant in explaining the variance in the factors of managerial decision, the
table also shows that the T values was important in level of (0,001> a).
And to explain that we found that the factors of the managerial decision identified with four factors (accuracy, speed,
easiness and appropriate), and where the results explained the effect of the dimension of information quality on the
factors of managerial decision, this results shows a strong relationship among the information systems and the
managerial decisions.
The results shows that the two dimensions of the information quality ( content and formal dimension) was explained
49% in the variance of degree of the participation in decision making, and this was statistically significant at the
level( 0,001>a). The F calculated also shows that the variables (content and formal dimension) was important in
explaining the variance in the degree of participation and was statistically significant at the level (0,001 > a) while
the other dimension (time dimension) was not significant in explaining the variance of the degree of participation.
5. Conclusion and study results
By reviewing the literature written in the subject of information system we can figure out that all the definitions of
information systems focuses on the role of this systems in enhancing and improving the decision making process by
providing the accurate related and time based information needed in making the decision, however; this study results
shows the same strong relationship among information systems and decision making. The right use of information
systems in the bank helps that bank achieving competitive advantage comparing with other bank in Jordanian
environment , furthermore; the results shows that the factor (easiness) has the highest variance level in the
relationship among the information systems and the decisions quality in the studied bank.
the results shows that the easiness variable had the highest variance to measure the relationship among
information systems and the quality of decision making, while the accuracy had the lowest variance. As for
the risk and participation variables the variance of participation was higher that the risk variable. And as for
the quality of information; time dimension was the highest variance and the lowest was the content
dimension.
The study found that the accuracy of information was the most usable variable in the bank, while the
appropriateness was the lowest usable variable in the study population, however; the risk variable was more
usable in the bank that the participation variable, as for the quality of the information; time dimension was
the most variable used in the bank.
The result show a great influence of risk in decision making, where the degree of risk increases when
increasing the difficulties of using information systems, this difficulties is usually faces managers in the
high organizational levels and needs intuition, prediction or guesswork.
The results also shows a great importance of the participation in decisions making, Information systems
such as group decision support system (GDSS), video conferencing, intranet and extranet may help in
increasing participation in decision making, furthermore; the study found that the needed infrastructure for
those information systems are available on the bank.
Depending on the study results number of recommendations is listed below:
The studded bank needs a continuous developments and improvement of the used information, it also needs
to use the latest technology used in the field of banking.
The need of training course for staff in order to revive their abilities of using information systems. However;
the bank needs to determine the competence of each employee in the information system department and
what each employee needs from information systems.
Field studies in group decision support systems are needed to be implemented in the bank which helps
decision making in the workplace and in addition it helps in generating ideas. .
References
Ajayi, I. A. and Omirin, Fadekemi F (2007) The Use of Management Information Systems (MIS) In Decision
Making In The South-West Nigerian Universities. Educational Research and Review Vol. 2 (5), pp. 109-116.
Alvarado, Felix (2009) Complementary uses of Information Systems in Decision Making, Planning and Democracy:
An Example in the Education Sector Journal of Education for International Development 4:2 .Academy for
Educational Development - USAID/Dialogue For Social Investment Project

Computer Engineering and Intelligent Systems www.iiste.org ISSN 2222-1719 (Paper) ISSN 2222-2863 (Online)
Vol 3, No.10, 2012
23
Archibald, J.A. (1975) Computer Science education for majors of other disciplines". AFIPS Joint Computer
Conferences: 903–906. "
Asemi, Asefeh, Ali Safari, (2011) The Role of Management Information System (MIS) and Decision Support System
(DSS) for Manager’s Decision Making Process International Journal of Business and Management Vol. 6,
No. 7.
Danielsen, J. (2009): Proceeings of the 32nd Information Systems Research Seminar in Scandinavia, IRIS 32,
Inclusive Design, Molde University College, Molde, Norway, August 9–12.
Davis, Timothy; Geist, Robert; Matzko, Sarah; Westall, James (2004) a First Step". Technical Symposium on
Computer Science Education: 125–129.
Denning, Peter (1999) "COMPUTER SCIENCE: THE DISCIPLINE". Encyclopedia of Computer Science (2000
Edition).
Hevner, March, Park & Ram (2004) Design Science in Information Systems Research. MIS Quarterly, 28(1), 75-105.
Humber, George. (1990) A theory of the effects of advanced information technologies on organizational design,
Intelligence and decision making. Academy of management review Vol 15 No. 1.
Jessup, Leonard M.; Joseph S. Valacich (2008). Information Systems Today Pearson Publishing. Pages ??? &
Glossary (3rd ed.). p. 416
Kostetsky, Oleh (1996) Decision making, Information systems and the role of system analyst, Management Science.
Vol 13 N0 2. October. USA.
Khazanchi, Deepak; Bjorn Erik Munkvold (2000) "Is information system a science? an inquiry into the nature of the
information systems discipline". ACM SIGMIS Database 31 (3): 24–42. doi:10.1145/381823.381834.
ISSN 0095-0033.
Kelly, Sue; Gibson, Nicola; Holland, Christopher; Light, Ben (1999) "Focus Issue on Legacy Information Systems
and Business Process Engineering: a Business Perspective of Legacy Information Systems".
Communications of the AIS 2 (7): 1–27.
Mark S. Silver, M. Lynne Markus, Cynthia Mathis Beath (1995) The Information Technology Interaction Model: A
Foundation for the MBA Core Course, MIS Quarterly, Vol. 19, No. 3, Special Issue on IS Curricula and
Pedagogy. pp. 361-390
Nowduri , Srinivas (2011) Management information systems and business decision making: review, analysis, and
recommendations. Journal of Management and Marketing Research Management information systems and
business decision making, Bloomsburg University of Pennsylvania.
Pearson Custom Publishing & West Chester University (2009) Custom Program for Computer Information
Systems. Pearson Custom Publishing, Glossary p. 694
World health organization Geneva (1990) A report of who study group, the role of research and information system
on decision making for the development of human resources for health. Technical report series 208.

Computer Engineering and Intelligent Systems www.iiste.org ISSN 2222-1719 (Paper) ISSN 2222-2863 (Online)
Vol 3, No.10, 2012
24
Quality of Managerial Decision Information Quality Dimensions IS factors
Figure 1. Research Mode
Computer Hardware and
software
Data Operating
Systems
MIS
DSS
Expert systems and
Artificial
Intelligence
Data
People
Procedure
Time Dimension
Up to date
Time
Formal Dimension
Clarity
Arrangements
Inclusiveness
Content Dimension
Accuracy
Relatedness
completeness
Degree of
risk
Accuracy
Speed
Easiness
Appropriate
Degree of
Participation in
the decision

Computer Engineering and Intelligent Systems www.iiste.org ISSN 2222-1719 (Paper) ISSN 2222-2863 (Online)
Vol 3, No.10, 2012
25
Table (1) Views of the sample on types of the used CBISs.
Table (2) Test results analysis of the factors, averages and standard deviations.
Reliability Coefficient: 0.811 Coefficient of variation: 0.05
Paragraph
No.
Paragraph Mean Standard
deviation
Factor
loading
1 The Process of saving info on CDs keeps the security
of Info needed for decision making.
3.21 0.71 0.600
2 I have deferent options to use information systems
leads to more accurate decisions.
3.07 0.76 0.699
3 The continues improvement of IS helps in better
decision making.
3.27 0.79 0.614
4 The use of different information systems helps in better
accurate and speed decisions
3.28 0.63 0.651
Table (3) Test results analysis of the factors, averages and standard deviations.
Reliability Coefficient: 0.885 Coefficient of variation: 0.061
Paragraph
No.
Paragraph Mean Standard
deviation
Factor
loading
1 I can find the needed information for my decisions
easily by entering the information systems used in the
bank.
3.21 0.67 0.604
2 I use the automated information system to help me in
automating the routine decisions
2.77 0.74 0.696
3 The information used in the information systems is
clear, accurate time-based and related
2.89 0.69 0.700
4 The used information systems help in consulting
experts easily
3.15 0.71 0.551
Table (4) Test results analysis of the factors, averages and standard deviations.
No Yes The used type No
Percentage Repetition Percentage Repetition
13.8 29 86.2 181 Data operating systems 1
10 21 90 189 Management information
systems
2
39.5 83 60.5 127 Executive information
systems
3
80.5 169 19.5 41 Expert systems and
artificial intelligent
4
36.2 76 63.8 134 Decision support system 5
13.8 29 86.2 181 Office automation 6
5.7 12 94.3 198 E-mail and voice mail 7
86.7 182 13.3 28 Video conferencing 8
12.4 26 87.6 184 Reporting information
system
9
81.4 171 18.6 39 Simulation system 10

Computer Engineering and Intelligent Systems www.iiste.org ISSN 2222-1719 (Paper) ISSN 2222-2863 (Online)
Vol 3, No.10, 2012
26
Reliability Coefficient: 0.886 Coefficient of variation: 0.088
Paragraph
No.
Paragraph Mean Standard
deviation
Factor
loading
1 I can easily use information system when I make my
decisions.
3.11 0.60 0.404
2 I can use internet easily when I make my decisions. 3.20 0.74 0.686
3 The information introduced by the information systems
is abstracted and easy to understand.
2.99 0.61 0.620
4 The used information systems helps in represent
information in different ways text, audio…
2.80 0.66 0.500
Table (5) Test results analysis of the factors, averages and standard deviations.
Reliability Coefficient: 0.853 Coefficient of variation: 0.095
Paragraph
No.
Paragraph Mean Standard
deviation
Factor
loading
23 The delays in the time needed for providing
information effect negatively in effectiveness of the
decision making process
2,69 0.80 0.780
24 The process of updating the information saved in the
systems is concerned as a critical step in decision
making
3.18 0.78 0.678
25 It is possible to use the historical data saved in the
systems in solving a future similar problems.
3,00 0.73 0.719
Table (6) Test results analysis of the factors, averages and standard deviations.
Reliability Coefficient: 0.887 Coefficient of variation: 0.075
Paragraph
No.
Paragraph Mean Standard
deviation
Factor
loading
26 I can use the manual IS when computers is not
available or breakdowns.
2,71 0.80 0.532
29 I don’t need a detailed or long CBIS when I make my
decision.
2.43 0.85 0.624
28 Our IS can provide me with information in different
forms; graphical, numeric, mathematical…
2,76 0.74 0.502
Table (7) Test results analysis of the factors, averages and standard deviations.
Reliability Coefficient: 0.887 Coefficient of variation: 0.075
Paragraph
No.
Paragraph Mean Standard
deviation
Factor
loading
16 Our information systems provide all the information
needed in decision making
2,95 0.57 0.530
27 Our DSS help me in all the levels of decision making
and all types of decision
2.76 0.69 0.580
30 The modeling tools help me in defining the problem to
solve in decision making
2,79 0.79 0.745

Computer Engineering and Intelligent Systems www.iiste.org ISSN 2222-1719 (Paper) ISSN 2222-2863 (Online)
Vol 3, No.10, 2012
27
Table (8) the result of the regression to the effect of the dimension of the information quality on the factors of
managerial decision.
Independent
variable
Dependent
variable
Beta Partial
Correlation
T Sig of
T
F Sig of
F
R2
Degree of risk Time
dimension
Formal
dimension
Content
dimension
0,045
0,295
0,438
0.781
5,030
7,279
0,436
0.001
0.001
43,876 0.001 0,395
Factors of the
managerial
decision
quality
Time
dimension
Formal
dimension
Content
dimension
0,280
0,317
0,468
6,182
6,885
9,904
0.001
0,001
0,001
113,708 0,001 0,623
Degree of
participation
in the decision
Time
dimension
Formal
dimension
Content
dimension
0,053
0,288
0,526
1,012
5,406
9,598
0,313
0,001
0,001
67,010 0,001 0,494

Computer Engineering and Intelligent Systems www.iiste.org ISSN 2222-1719 (Paper) ISSN 2222-2863 (Online)
Vol 3, No.10, 2012
28
STEP-BY-STEP APPROACH TO BASIC INTERNET AND EMAIL
OPERATIONS FOR BEGINNERS
JEREMIAH CHUKWU1, EZE ELIAS CHINEDUM
2
1DEPARTMENT OF INFORMATION AND COMMUNICATION TECHNOLOGY/RESEARCH CENTRE,
EBONYI STATE UNIVERSITY, P.M.B. 053, ABAKALIKI –EBONYI STATE 2COMPUTER SCIENCE DEPARTMENT, EBONYI STATE UNIVERSITY, ABAKALIKI
* E-mail of the corresponding author: [email protected]
ABSTRACT
The way Internet has evolved over the years makes it difficult for us to believe that it was created to allow data transfer
and communications in case of a nuclear attack on US or a big disaster. Internet has come a long way from a
restricted-use network created for such a special purpose. People today communicate with friends, family and business
contacts, participate in community activities developed around their interest areas, shop, bank, study, entertain
themselves, and research using the Internet. It is therefore becoming essential for people to learn how to use Internet
and email.
1. INTRODUCTION
Before we begin learning how to use the Internet and email, we must get familiar with some of the fundamental
concepts. Internet is a huge network of computers. People connect their computers to local networks, which in turn are
connected to regional networks and these regional networks are connected to a central structure called backbone. Also
Internet is a worldwide interconnection of different types of computers from thousands of networks around the world.
In other words, the Internet consists of many computer networks from different countries all connected together.
These computers are connected through telephone lines and satellite links, all having ability to communicate with a
common language called TCP/IP (Transmission Control Protocol/Internet Protocol).
Internet has made the world a global village. It provides us with the unprecedented amount of information. On the
internet, interaction with other computers uses a client-server mode. Once you are accessing a site all you are doing
is logging on a computer somewhere in the world and that computer is known as the server because it houses the
information or services, while your computer is the client because it is accessing or receiving information from the
server.
1.1 OBJECTIVES
Ability to conduct basic operations required to use Internet and email independently
Familiarity with the fundamental concepts to enable learning to use Internet and email
Good understanding of commands and steps required to access the web
Good understanding of commands and steps required to use emails on Yahoo

Computer Engineering and Intelligent Systems www.iiste.org ISSN 2222-1719 (Paper) ISSN 2222-2863 (Online)
Vol 3, No.10, 2012
29
2 LITERATURE REVIEW
2.1 INTERNET
The Internet is a global system of interconnected computer networks that use the standard Internet protocol suite
(often called TCP/IP, although not all applications use TCP) to serve billions of users worldwide. It is a network of
networks that consists of millions of private, public, academic, business, and government networks, of local to global
scope, that are linked by a broad array of electronic, wireless and optical networking technologies. The Internet
carries an extensive range of information resources and services, such as the inter-linked hypertext documents of the
World Wide Web (WWW) and the infrastructure to support email.
Most traditional communications media including telephone, music, film, and television are reshaped or redefined by
the Internet, giving birth to new services such as Voice over Internet Protocol (VoIP) and Internet Protocol Television
(IPTV). Newspaper, book and other print publishing are adapting to Web site technology, or are reshaped into
blogging and web feeds. The Internet has enabled and accelerated new forms of human interactions through instant
messaging, Internet forums, and social networking. Online shopping has boomed both for major retail outlets and
small artisans and traders. Business-to-business and financial services on the Internet affect supply chains across
entire industries.
The origins of the Internet reach back to research of the 1960s, commissioned by the United States government in
collaboration with private commercial interests to build robust, fault-tolerant, and distributed computer networks.
The funding of a new U.S. backbone by the National Science Foundation in the 1980s, as well as private funding for
other commercial backbones, led to worldwide participation in the development of new networking technologies,
and the merger of many networks. The commercialization of what was by the 1990s an international network
resulted in its popularization and incorporation into virtually every aspect of modern human life. As of 2011 more
than 2.2 billion people—nearly a third of Earth's population—used the services of the Internet. ( Mockapetris, P,
1983)
The Internet has no centralized governance in either technological implementation or policies for access and usage;
each constituent network sets its own standards. Only the overreaching definitions of the two principal name spaces
in the Internet, the Internet Protocol address space and the Domain Name System, are directed by a maintainer
organization, the Internet Corporation for Assigned Names and Numbers (ICANN). The technical underpinning and
standardization of the core protocols (IPv4 and IPv6) is an activity of the Internet Engineering Task Force (IETF), a
non-profit organization of loosely affiliated international participants that anyone may associate with by contributing
technical expertise.
2.2 WORLD WIDE WEB
Many people use the terms Internet and World Wide Web, or just the Web, interchangeably, but the two terms are not
synonymous. The World Wide Web is a global set of documents, images and other resources, logically interrelated by
hyperlinks and referenced with Uniform Resource Identifiers (URIs). URIs symbolically identifies services, servers,
and other databases, and the documents and resources that they can provide. Hypertext Transfer Protocol (HTTP) is
the main access protocol of the World Wide Web, but it is only one of the hundreds of communication protocols used
on the Internet. Web services also use HTTP to allow software systems to communicate in order to share and

Computer Engineering and Intelligent Systems www.iiste.org ISSN 2222-1719 (Paper) ISSN 2222-2863 (Online)
Vol 3, No.10, 2012
30
exchange business logic and data.
World Wide Web browser software, such as Microsoft's Internet Explorer, Mozilla Firefox, Opera, Apple's Safari,
and Google Chrome, lets users navigate from one web page to another via hyperlinks embedded in the documents.
These documents may also contain any combination of computer data, including graphics, sounds, text, video,
multimedia and interactive content that runs while the user is interacting with the page. Client-side software can
include animations, games, office applications and scientific demonstrations. Through keyword-driven Internet
research using search engines like Yahoo! and Google, users worldwide have easy, instant access to a vast and
diverse amount of online information. Compared to printed media, books, encyclopedias and traditional libraries, the
World Wide Web has enabled the decentralization of information on a large scale.
The Web has also enabled individuals and organizations to publish ideas and information to a potentially large
audience online at greatly reduced expense and time delay. Publishing a web page, a blog, or building a website
involves little initial cost and many cost-free services are available. Publishing and maintaining large, professional
web sites with attractive, diverse and up-to-date information is still a difficult and expensive proposition, however.
Many individuals and some companies and groups use web logs or blogs, which are largely used as easily updatable
online diaries. Some commercial organizations encourage staff to communicate advice in their areas of specialization
in the hope that visitors will be impressed by the expert knowledge and free information, and be attracted to the
corporation as a result. One example of this practice is Microsoft, whose product developers publish their personal
blogs in order to pique the public's interest in their work. Collections of personal web pages published by large
service providers remain popular, and have become increasingly sophisticated. Whereas operations such as Angelfire
and GeoCities have existed since the early days of the Web, newer offerings from, for example, Facebook and
Twitter currently have large followings. These operations often brand themselves as social network services rather
than simply as web page hosts.
Advertising on popular web pages can be lucrative, and e-commerce or the sale of products and services directly via
the Web continues to grow.
When the Web began in the 1990s, a typical web page was stored in completed form on a web server, formatted in
HTML, ready to be sent to a user's browser in response to a request. Over time, the process of creating and serving
web pages has become more automated and more dynamic. Websites are often created using content management or
wiki software with, initially, very little content. Contributors to these systems, who may be paid staff, members of a
club or other organization or members of the public, fill underlying databases with content using editing pages
designed for that purpose, while casual visitors view and read this content in its final HTML form. There may or may
not be editorial, approval and security systems built into the process of taking newly entered content and making it
available to the target visitors.
2.3 HOW DID THE INTERNET BEGIN?
In 1969, the U. S. Department of Defense established the ARPANET (Advanced Research Projects Agency Network)
to aid the military research going on in some universities by sharing information. This later grew to encompass all of
America. More networks emerged that accommodated non-military research like the NSFNET (National Science

Computer Engineering and Intelligent Systems www.iiste.org ISSN 2222-1719 (Paper) ISSN 2222-2863 (Online)
Vol 3, No.10, 2012
31
Foundation Network), in the 80s, which allowed universities and other agencies to link up with its supercomputers.
The NSFNET later became known as the Internet.
In 1991, only the handful of people use the internet until the development of the World Wide Web by Tim Berner
Leer popularly called the father of the web in 1993. The World Wide Web (WWW) is created by the development of
hypertext, which has the ability to combine words, pictures and sound on web pages.
SAMPLE NETWORK OF COMPUTERS
2.4 NETWORK TERMINOLOGY
2.4.1 TCP/IP
Just like two people can communicate easily if they talk in the same language and its rules. Similarly, all computers
connected to Internet follow same rules and procedure, also called protocols, to communicate with each other. These
protocols, or the common language, of the Internet are known as Transmission Control Protocol/Internet Protocol or
TCP/IP.
Every computer on the Internet has a unique address. This is a four-part numeric address called Internet Protocol
Address or IP address, and it contains information that identifies the location of this computer. Some examples of IP
addresses are 255.230.54.1, or 10.11.0.220. Therefore, we can see that each part of IP address is a number ranging
between 0 and 255.
2.4.2 DNS
The Domain Name System
The Internet evolved as an experimental system during the 1970s and early 1980s. It then flourished after the TCP/IP
protocols were made mandatory on the ARPANET and other networks in January 1983; these protocols thus became
the standard for many other networks as well. Indeed, the Internet grew so rapidly that the existing mechanisms for

Computer Engineering and Intelligent Systems www.iiste.org ISSN 2222-1719 (Paper) ISSN 2222-2863 (Online)
Vol 3, No.10, 2012
32
associating the names of host computers (e.g. UCLA, USC-ISI) to Internet addresses (known as IP addresses) were
about to be stretched beyond acceptable engineering limits. Most of the applications in the Internet referred to the
target computers by name. These names had to be translated into Internet addresses before the lower level protocols
could be activated to support the application. For a time, a group at SRI International in Menlo Park, CA, called the
Network Information Center (NIC), maintained a simple, machine-readable list of names and associated Internet
addresses which was made available on the net. Hosts on the Internet would simply copy this list, usually daily, so as to
maintain a local copy of the table. This list was called the "host.txt" file (since it was simply a text file). The list served
the function in the Internet that directory services (e.g. 411 or 703-555-1212) do in the US telephone system - the
translation of a name into an address.
As the Internet grew, it became harder and harder for the NIC to keep the list current. Anticipating that this problem
would only get worse as the network expanded, researchers at USC Information Sciences Institute launched an effort to
design a more distributed way of providing this same information. The end result was the Domain Name System
(DNS) [2] which allowed hundreds of thousands of "name servers" to maintain small portions of a global database of
information associating IP addresses with the names of computers on the Internet.
The naming structure was hierarchical in character. For example, all host computers associated with educational
institutions would have names like "stanford.edu" or "ucla.edu". Specific hosts would have names like "cs.ucla.edu" to
refer to a computer in the computer science department of UCLA, for example. A special set of computers called "root
servers" maintained information about the names and addresses of other servers that contained more detailed
name/address associations. The designers of the DNS also developed seven generic "top level" domains, as follows:
Education – EDU, Government – GOV, Military – MIL, International – INT, Network – NET, (non-profit)
Organization – ORG, Commercial - COM
Under this system, for example, the host name "UCLA" became "UCLA.EDU" because it was operated by an
educational institution, while the host computer for "BBN" became "BBN.COM" because it was a commercial
organization. Top-level domain names also were created for every country: United Kingdom names would end in
“.UK,” while the ending “.FR” was created for the names of France.
The Domain Name System (DNS) was and continues to be a major element of the Internet architecture, which
contributes to its scalability. It also contributes to controversy over trademarks and general rules for the creation and
use of domain names, creation of new top-level domains and the like. At the same time, other resolution schemes exist
as well. One of the authors (Kahn) has been involved in the development of a different kind of standard identification
and resolution scheme [3] that, for example, is being used as the base technology by book publishers to identify books
on the Internet by adapting various identification schemes for use in the Internet environment. For example,
International Standard Book Numbers (ISBNs) can be used as part of the identifiers. The identifiers then resolve to
state information about the referenced books, such as location information (e.g. multiple sites) on the Internet that is
used to access the books or to order them. These developments are taking place in parallel with the more traditional
means of managing Internet resources. They offer an alternative to the existing Domain Name System with enhanced
functionality.

Computer Engineering and Intelligent Systems www.iiste.org ISSN 2222-1719 (Paper) ISSN 2222-2863 (Online)
Vol 3, No.10, 2012
33
The growth of Web servers and users of the Web has been remarkable, but some people are confused about the
relationship between the World Wide Web and the Internet. The Internet is the global information system that includes
communication capabilities and many high level applications. The Web is one such application. The existing
connectivity of the Internet made it possible for users and servers all over the world to participate in this activity.
Electronic mail is another important application. As of today, over 60 million computers take part in the Internet and
about 3.6 million web sites were estimated to be accessible on the net. Virtually every user of the net has access to
electronic mail and web browsing capability. Email remains a critically important application for most users of the
Internet, and these two functions largely dominate the use of the Internet for most users.
2.4.3 WORLD WIDE WEB
For the purpose of this tutorial, when we mention Internet, we are actually referring to the World Wide Web (WWW or
the web). The web was developed as a method for incorporating footnotes, figures, and cross-references into online
hypertext documents, also called web pages. These web pages are files encoded by using the hypertext markup
language or HTML, and this language allows developers to insert hypertext links in the documents. It is through this
facility that the web has become so useful for all of us. The web users can click any link on a web page to access more
information about these links. A collection of related web pages is called a website. The first page of a website is called
its home page. On the home page, links to various web pages of the website are listed.
2.4.4 WEB BROWSERS
You need a web browser to access web pages on the web. A web browser is a software application specially designed to
look up and open web pages on the user's computer. The two most popular web browsers are Microsoft Internet
Explorer, and Netscape Navigator. For the purpose of this tutorial we will refer to the Microsoft Internet Explorer 5.0
which is used by a vast majority of web users.
2.4.5 URL
The World Wide Web is built on a set of rules called the Hypertext transfer protocol (HTTP). This protocol requires the
Internet addresses in a special format, called URL or Uniform Resource Locator. A typical example of a URL is as
follows:
http://www.google.com
Let us see what the various parts of a URL stand for:
a. http://
b. www
c. google

Computer Engineering and Intelligent Systems www.iiste.org ISSN 2222-1719 (Paper) ISSN 2222-2863 (Online)
Vol 3, No.10, 2012
34
stands for a server that uses the hypertext transfer protocol means the website is on the World Wide Web part of the
Internet stands for the name of the service/company/organization whose website you are accessing refers to a web
folder belonging to the website of google refers to the specific web page in the web folder named home.
Sometimes the name of the web page is not displayed in the URL. However, each web page on the web has a unique
URL. To access a website, you must know its URL and that URL should be typed in the Address bar of the web browser
used by you.
2.5 Email
Electronic mail, also known as email or e-mail, is a method of exchanging digital messages from an author to one or
more recipients. Modern email operates across the Internet or other computer networks. Some early email systems
required that the author and the recipient both be online at the same time, in common with instant messaging. Today's
email systems are based on a store-and-forward model. Email servers accept, forward, deliver and store messages.
Neither the users nor their computers are required to be online simultaneously; they need connect only briefly,
typically to an email server, for as long as it takes to send or receive messages.
An Internet email message consists of three components, the message envelope, the message header, and the message
body. The message header contains control information, including, minimally, an originator's email address and one or
more recipient addresses. Usually descriptive information is also added, such as a subject header field and a message
submission date/time stamp.
To send and receive mails in electronic format, an email account and an Internet connection are required. There are
email programs available to help you manage your emails on your computer. Some of the most commonly used email
programs are Microsoft Outlook Express and Netscape Messenger. However, it is not essential to have an email
program to be able to send and receive emails. There are several free email service providers on the web, including
Hotmail, Yahoo, Rediffmail and Indiatimes. You need to register with them and open an account with them to start
sending and receiving emails. After you drop your letter in the post box, the post-man collects and takes it to the central
post office. From here it is dispatched to the recipient's city. Similarly, after an email is sent from a computer, it is sent
to the nearest mail server. Here, depending on the recipient's domain and top-level domain name, the mail is forwarded
to the mail servers closest to the recipient.
To deliver a letter, a postman collects the recipient's mail from the central post office and delivers it to the recipient's
home. Similarly, whenever the recipient connects to his mail server, the email program retrieves the mail from there
and presents it to the recipient. Irrespective of what time of the day you send a mail, and no matter how far your
recipient is, the whole process of sending and receiving mails takes a few seconds.
2.6 Email Address
Just like every letter should have an address where it can be delivered, there are addresses for sending and receiving
emails also. Every email user has a unique email address.

Computer Engineering and Intelligent Systems www.iiste.org ISSN 2222-1719 (Paper) ISSN 2222-2863 (Online)
Vol 3, No.10, 2012
35
A typical example of an Email address is as follows:
Email addresses have three parts:
i. User name
ii. Domain name - 'internet' in the example. The domain name refers to the mail server - a type of computer -
where the recipient has an electronic mailbox. It is usually the name of a company or an Internet service
provider. A domain name and user name are always separated by the axiom symbol '@'.
iii. Top-level domain - '.com' in the example. The top-level domain is always preceded by a dot and refers to the
country or type of organization where the recipient's domain mail server is located. Some of the commonly
used top-level domains are
1..com, 2. .edu, 3. .org, 4. .net
- A commercial enterprise or an online service - An educational institution or university - A non-profit organization - A
network
- 'jerry' in the example. The user name refers to the mailbox of the recipient.
3. METHODOLOGY
3.1 THE INTERNET
To be able to use Internet and email, you need to set up a connection with an Internet Service Provider (ISP). Internet
connections are available over the telephone line through dial-up modems or DSL; over cable through Cable T. V.
wires; and through wireless. The most common way of connecting to the Internet is over telephone line using a dial-up
modem. However, lately Internet over cable is also becoming quite popular. There are also a large number of cyber
cafes in the country offering Internet Access facility on hourly rental basis.
Before we begin, ensure that you have an Internet connection on your PC. If you are accessing from home, you need to
connect to the net using the software provided by your service provider. This software can be launched from the
Program sub-menu in Start Menu or from Desktop, if there is a shortcut on the desktop.
1. Starting Microsoft Internet Explorer 8.0 or any other higher vision of browsers
To access websites on the web, we need to launch a web browser. Here we will learn to access websites using the web
browser from Microsoft - the Microsoft Internet Explorer 8.0. To launch Internet Explorer, follow the instructions
given below:
i. Press the start button to open the start menu. Go to Programs and open the programs sub-menu.
ii. Now use the down arrow direction key to reach the option labeled Internet Explorer, and press Enter.

Computer Engineering and Intelligent Systems www.iiste.org ISSN 2222-1719 (Paper) ISSN 2222-2863 (Online)
Vol 3, No.10, 2012
36
iii. Alternatively, you can use the shortcut icon for Internet Explorer on the desktop
2. Components of Microsoft Internet Explorer 8.0
The components of Microsoft Internet Explorer 8.0 are quite similar to the Windows Explorer. It consists of the
following parts:
1. Title Bar - It is the topmost part of the web browser, and is a thin rectangular strip. The left hand corner of
Title bar displays, the icon of Internet Explorer, name of the web site, and name of the program i.e.
Internet Explorer. On the right hand corner the three buttons - Minimize, Maximize and Close are
displayed.
2. Menu Bar - This consists of a horizontal row of command options. These are File, Edit, View, Favorites,
Tools, and Help.
3. Command Tool Bar - It displays shortcut icons of some of the most frequently used menu commands on the
browser and this command tool bar replaced standard tool bar in lower vision of Microsoft Internet
Explorer.
4. Short cut links bar - This may or may not be present. It displays shortcuts to a few most preferred links by the
user.
5. Address Bar - It displays the URL of the website being accessed by the user.
6. Contents Pane - The contents of the web page will be displayed here.
7. Status Bar - It displays the status of download, connectivity and the URL of the link being downloaded.
3.2 WEBSITES
To access websites, follow the instructions given by steps:
Step:
1. Ensure that you are connected to the Internet. Launch the Internet Explorer from the start menu, programs sub-menu.

Computer Engineering and Intelligent Systems www.iiste.org ISSN 2222-1719 (Paper) ISSN 2222-2863 (Online)
Vol 3, No.10, 2012
37
2. Go to File Menu option of the Internet Explorer by pressing the Alt key to activate the accessing key. Use the down
arrow direction key to drop down the file menu or press the Alt Key + F key on the keyboard to also drop down the file
menu. In this drop down, use the down arrow direction key to go to the option labeled 'open'. This will open the 'Open'
dialog box. Alternatively, you can press Control key and O key. The cursor will be in an edit text box. Here type the
URL of the website you want to visit. We will take the example of Google website. So, type www.google.com in the
open edit text box, and press Enter.
Alternatively, you can also launch a google website by typing into the address bar
3. The browser will then look for the google website on the web. The status bar will display "searching
www.google.com.ng". When it finds the website, the status bar will display 'website found'. After this a process of
displaying the website on your computer will begin, this process is called downloading. The page that appears after
downloading is complete is called the home page of the website. Once the site is completely downloaded, JAWS will
start reading the page. To stop JAWS from reading the entire page, press the control key once.
4. Typically, a website is divided into five distinct areas. It is like a window and its frame. So the area of the window is
the content section, while each side of the frame represents a particular section. The different sides of the frames are
called navigation bars, because they contain links to navigate through the website. Therefore, usually there is a top
navigation bar, a bottom navigation bar, a left navigation bar and a right navigation bar. The top and bottom navigation
bars of the frame contain links to various sections in the website. These are also called the global navigation bars. The
left navigation bar of the frame usually serves as a section navigation bar i.e. it contains links to pages within the
particular section being accessed. The right navigation bar is for links to specific pages, or links outside the website.
This placement and the number of these navigation bars can vary widely from website to website, however, a global
and section navigation bar is always there.
5. JAWS will start reading the downloaded web page from top left-hand corner of the screen to the bottom right-hand
corner. You can stop JAWS from reading the page by pressing the control key. If you want JAWS to begin reading the
web page again, press the down arrow key. JAWS will start reading forward from the point it had stopped when you
pressed the control key. You can now keep pressing the down arrow key to move forward step by step at your own pace.
To move backwards, press the up arrow direction key.
Address
bar

Computer Engineering and Intelligent Systems www.iiste.org ISSN 2222-1719 (Paper) ISSN 2222-2863 (Online)
Vol 3, No.10, 2012
38
6. A web page usually consists of many elements such as hyperlinks to other web pages in the same website or to other
websites; buttons for commands; Forms with text boxes, combo boxes, check boxes and radio buttons; graphic images;
and of course plain text. While reading the web page, JAWS will distinguish each element as follows:
A. Plain Text: JAWS will simply read out the plain text
B. Hyperlink: Before reading out a hyperlink, JAWS will speak out the word "link" and then read out the name of the
link. For example if a hyperlink is labeled 'About Us' then JAWS will read "link About Us".
C. Buttons: JAWS will first read out the title of the button and then speak out the word "button". For example if a
button is labeled 'Submit' then JAWS will read “Submit button".
D. Graphic Images: Every graphic image has an alternative text associated with it; JAWS will speak out the word
'Graphic' first and then read out the alternative text of the graphic.
E. Forms: A form has many fields in which a user can type relevant information. There are different types of fields in
a form. These are:
Text Box: These are areas in which the user can type limited information. JAWS will first speak out the label
of the text box and then it will speak out the word "Edit". For example, if there is a field in which the user has
to enter his first name, then JAWS will read "First Name Edit'
Combo Box: Usually combo boxes are provided to make certain pre-defined selections. These selection
options can be browsed by using the down and up arrow keys. JAWS will speak out the label of the combo box
and then it will speak the word "Combo". For example, if there is a field in which the user has to select his
country from a list of countries provided in a combo box, then JAWS will read "Select your Country combo".
Sometimes, user can type in a combo box also, for such combo boxes JAWS will speak out "Edit Combo".
Check box selection: This is a small box provided for single selection options. To select and deselect the
option against a check box, use the space bar. JAWS will speak out "check box checked" if the option is
selected and "check box unchecked" if the option is not selected.
Radio buttons: These are small buttons provided when there are limited options, usually two to five options, to
select from. These options are changed by using the direction arrow keys. JAWS will speak out the word
"radio button" and then the option that is against it. For example if there are two options A and B, and option
A is selected, then JAWS will speak out "Radio button Option A selected", for the option not selected it will
speak out "Radio button Option B unselected".
7. To access a link that you would want to access, there are two ways
First: Use Tab key to browse through the links sequentially, and when you reach the link you want to access, press
Enter key.
Second: Press Insert key + F7 key. This will open a 'Links list' dialog box. As the name suggests, links list dialog box
has the complete list of links present in the opened web page. You can reach the link you want to access by using the up

Computer Engineering and Intelligent Systems www.iiste.org ISSN 2222-1719 (Paper) ISSN 2222-2863 (Online)
Vol 3, No.10, 2012
39
or down arrow direction keys. You can also use the alphabet keys. For example, if you want to access a link labeled
'Email', then press E key. Keep pressing E key till you reach the link labeled Email. After you reach this link, press
Enter. This will then open the page hyper linked to the accessed link.
8. To know your position on the page, press Insert key + Up arrow key.
9. To go back to the previous page, press Alt key + left arrow key. To move forward to a visited page press Alt key +
right arrow key.
4. EMAILS
e-mail is an acronym for electronic mail. It is one of the most popular resources of the internet. E-mail is nothing other
than an electronic way of sending and receiving letters or messages. It lets you send texts to a recipient through the
computer. Sending and receiving e-mail messages has been made easy and free courtesy of internet portals like yahoo
and others. Free web based e-mail account – the kind available at yahoo, http://www.yahoo.com; Hotmail,
http://www.hotmail.com; OneBox, http://www.onebox.com; Google, http://www.gmail.com and a host of other sites-
have cost, convenience and spped advantages among others. You can easily send or check your mail from any
computer connected to the internet in any part of the world.
Cost: if you have a personal computer that is connected to the internet via an Internet Service Provider (ISP) or any
network Internet Modem, you do not pay extra charges for sending or receiving e-mail messages. If you are not
connected at a very minimal cost, you can send or check your mails in a Cyber Café (Business Centre) scattered around
town.
Convenience: You can send or check your mail at any time of the day and from any computer that is connected to the
Internet in any part of the world, if the e-mail address is correct. You do not need to configure your computer differently
as required by some internet service providers, which you use their service to receive mails.
Speed: it takes an e-mail few minutes even seconds to reach its destination in any part of the world. This however
depends on your connection, the speed of your computer and the speed at which your Internet Service Provider
transmits. It is unlike the regular postal service/Courier service that takes a lot of time.
4.1 E-MAIL BASICS COMPONENTS
E-mail id/Username: Email id/username is the name of the owner of the e-mail address. If name is Chuks Jerry, so
your e-mail can be chuksjerry. E-mail id or username and e-mail address will be used interchangeably in this work.
Email id is followed by @ (at), then the name of the web server where the user maintains the account and lastly the
suffix. So your e-mail address at yahoo will read something like [email protected] or [email protected],
mine is [email protected]. Two people cannot use the same username as an e-mail address in one web service,
just as two persons cannot have the same account number with the same bank. This is to avoid duplicity. For instance,
you cannot register [email protected] because I have already registered it, but if you add any other thing before
or after chukwuorih for instance [email protected] or [email protected], it may be registered if not
already taken and username is usually written in small letters.

Computer Engineering and Intelligent Systems www.iiste.org ISSN 2222-1719 (Paper) ISSN 2222-2863 (Online)
Vol 3, No.10, 2012
40
Password: This refers to a key or code with which the user opens his/her e-mail box. With your password, you can be
sure that nobody- except technically proficient miscreants called hackers will have access to your e-mail box.
Passwords are case sensitive, that is if you use an upper case (capital letter) to sign on, you must use upper case letter to
open the box or vice versa. When you type your password, it will appear in asterisks to prevent others from reading it.
Make sure you remember your password, if you forget it, you will have difficulty opening the box.
4.2 UNDERSTANDING “To”, “CC”, “BCC”
The “To” field is where you enter the primary recipient’s e-mail address. The “CC”, which stands for Carbon Copy.
The field is where you enter the e-mail address of the other recipient you want to receive the same mail. The “BCC”,
which stands for Blind Carbon Copy. This is where you enter the e-mail address of the person(s) you want to receive
the same mail but would not want others who receive similar mail to know. That is, when you enter my e-mail address
in BCC field, other recipients of the mail will not know you sent me a copy of the same letter/mail.
4.3 E-MAIL PROTOCOL/RULE
Here are some basic rules, you should try to observe while using email and this is called e-mail netiquette:
1. Always use subject line, this will help the mail recipient to have an idea of what your message is all about.
2. Be brief in writing, if the information you want to send is much, consider sending some as attachment.
3. Keep paragraphs short and to the point, it is hard to view long paragraphs. Remember most people will read
your message on the computer screen, so do not give them trouble reading your mail.
4. Do not use all capital or all small letters, some consider all capital letters as surprises and all small letters as
sloppy. Write in a conventional way.
5. Remember to check your mail for spelling errors before you send.
4.4 CREATION OF E-MAIL
Steps:
1. Opening an Email account
Before you can start accessing an email, you must have an email account. There are two ways of acquiring an
email account:
Buy an Internet account from an Internet Service Provider. An email account is provided
to you as part of the package.
Open an email account with web-based email services such as Hotmail, Yahoo!,
Rediffmail etc.
We will learn how to open an email account with the web-based email service Yahoo!
Step 1:
Ensure that you are connected to the Internet. Open Internet Explorer, press control key + O key to open the 'Open'

Computer Engineering and Intelligent Systems www.iiste.org ISSN 2222-1719 (Paper) ISSN 2222-2863 (Online)
Vol 3, No.10, 2012
41
dialog box, type www.yahoo.com and press enter key or enter www.yahoo.com in the address bar and hit the enter key
on the keyboard. This URL is of the website for the Yahoo! email service.
Step 2:
The Yahoo home page will download on your screen. Now, since we want to open an Email account, we will look for
the link labeled 'Sign Up' on the home page and click the left mouse button or if it is Sign In page that display, move to
step 3.
Step 3:
On the 'Email Sign In' page, email account holders with Yahoo type in their username/yahoo id and password to access
their email account. This page also contains hyperlink to the page with the registration form for opening new email
accounts. These links is labeled Create New Account and click the left mouse button to open the registration page.
Step 4:
This will open a registration page. But it might interest you to know that Yahoo offers this email services free. In this
approach, we are interested in creating free yahoo mail account. In this registration form, there are several sections that
you have to fill. The fields in these sections of the registration form are:

Computer Engineering and Intelligent Systems www.iiste.org ISSN 2222-1719 (Paper) ISSN 2222-2863 (Online)
Vol 3, No.10, 2012
42
Step 5:
Follow the instructions and enter your particulars in the fields (spaces) provided. Scroll to view the other pages of the
registration form.
Step 6:
At the end of the form, move your mouse to Submit/Create My Account button and click the left mouse button.
If you had entered a username already taken by someone else, the web server will display alternative username/yahoo
id for you to choose from, make selection from the suggestions or choose another username yourself.
Step 7:
Make other needed changes, then move your mouse to submit/Create Account button and click the left mouse button. If
the information you entered are correct, the web server will display a “Congratulation” page indicating that you have
successfully registered your e-mail address with some of the information entered at the course of creating the mail.
Step 8:
Move your mouse to Continue to yahoo mail and click the left mouse button. Your e-mail account display with first
mail sent to you by yahoo as a confirmation.
4.5 SENDING AND RECEIVING EMAILS IN YAHOO!
1. Ensure that you are connected to the Internet. Open Internet Explorer, press control key + O key to open the 'Open'
dialog box, type www.yahoo.com and press enter key. This URL is of the website for the Yahoo! email service.

Computer Engineering and Intelligent Systems www.iiste.org ISSN 2222-1719 (Paper) ISSN 2222-2863 (Online)
Vol 3, No.10, 2012
43
2. The Yahoo home page will download/display on your screen. Now, since you want to access your Email account,
look for the links labeled ‘Sign In’ on the home page and click the left mouse button.
3. After a short while, the 'Email Sign In' page will open. On this page, email account holders with Yahoo type in their
username and password to access their email account. When this page opens, the cursor will be in Yahoo ID field. It is
a text box, press enter to turn the forms mode on and type your Yahoo ID. Press tab to go to the Password field. It is a
text box, type your password in this field and press enter key.
4. After a short while, your email account home page will be opened with a message Hi your name and also the
number of unread mail in your inbox, look for a link called Mail towards your left hand side and click the left mouse
button.
5. There are two links that we will look for in this page - Inbox and compose. Inbox is like your mailbox; all
incoming mails will come here. Therefore, Inbox link will take you to all emails sent to this Yahoo email ID. Compose
link will take you to an email form in which you can type your email and send to any email ID.
6. To check new emails and even old emails in your Yahoo email account, go to the Inbox link/Check Mail link and
click the left mouse button.

Computer Engineering and Intelligent Systems www.iiste.org ISSN 2222-1719 (Paper) ISSN 2222-2863 (Online)
Vol 3, No.10, 2012
44
7. An email listing page will open. Here all incoming emails will be listed in reverse chronological order, that is, the
latest emails will be listed on the top, while the oldest will be at the bottom. The email list is organized as a table. Each
email occupies a row and is divided into five columns.
These five columns are:
Check box - Each email has a check box in the beginning. It is used to select the email for operations like
delete or moving it to another folder.
Sender/From - In this column, the sender's name is displayed
Subject - The subject of the incoming mail is displayed in this column and it is a hyperlink.
Date - The day and date on which the incoming mail is received is displayed in this column
Size - The size of each email is displayed in this column
8. To view the content of an email, move your mouse to the subject o the mail and click the left mouse button.
9. To send an email, we need to access the compose link and click the left mouse button. A email form will open as
shown below.
The email form has the following fields:

Computer Engineering and Intelligent Systems www.iiste.org ISSN 2222-1719 (Paper) ISSN 2222-2863 (Online)
Vol 3, No.10, 2012
45
'To': This is a text box in which you will type the email address of the person to whom you want to send your
email. When the email form opens, the cursor will be in this field. Press enter to turn on the forms mode and
type the email address of the recipient. Press tab to go to the next field.
CC: It refers to carbon copy, which is if you want to send a copy of this email to some other persons then type
the email IDs of these persons in this field. Press tab to go to the next field. All the recipients will see who else
has received this message. To send the same mail to more than one recipient, separate the email addresses of
the recipients by a comma or a semi-colon.
BCC: If you want to send a copy of your message to someone, but do not want others to know, then use the
blind carbon copy (BCC) option for this undisclosed recipient. Type the email IDs of such person/s in this
field. Press tab to go to the next field.
Subject: Type the subject of your email in this field and press tab to go to the next field.
Text: This is the place where you would write your message. This is like notepad and you just need to start
typing. When you are done, press tab once to go to send button. Press enter on Send button.
10. After a short while, a confirmation screen will appear. This will inform you that your message has been sent.
11. You can send a reply to any email received in your account. To do this, go to the Inbox email listing page. Go
to the subject hyperlink of the email to which you want to reply and press enter. This will open the detailed
text of the email on the screen. On this page, there is button labeled Reply. Use arrow direction keys to reach
this button and press enter. After a short while, a page with the email form, similar to the compose email form
will appear. However, unlike the compose form, the reply form will have the following fields appearing
pre-filled.
'TO' field: The email address in the 'From' field of the message to which you are replying, will appear
pre-filled in the 'To' field of the reply form. For example, if say you received an email from jerry chukwu,
whose email address is [email protected]. Now, when you reply to his message, the To field of the
reply form will have [email protected] pre-filled.
CC field and BCC field will be blank
Subject: The text in the subject field of the message to which you are replying, will appear pre-filled in the
'Subject' field of the reply form with the text 'Re:' pre-fixed to it. For example, In jerry's email, if the subject
field had 'Hello there', then the subject field of the reply form will have the text 'Re: Hello there' pre-filled in it.
Text: The complete text of the original message will appear pre-filled in the Text box for writing messages.
When the reply form opens, press tab once and the cursor will be placed in the text field. You can now start
typing your reply. When you are done, press tab to reach the send button.
4.6 ATTACHMENT
It might interest you to know that e-mail is designed to transfer light text messages only, when you want to send
graphics, audio/visual files, send then as attachments. It is assumed that you had typed the mail and the accompanying
attachment.

Computer Engineering and Intelligent Systems www.iiste.org ISSN 2222-1719 (Paper) ISSN 2222-2863 (Online)
Vol 3, No.10, 2012
46
Step 1:
Move your mouse to attachments and click, a link will appear called attach file, click on it to display the attachment
window for you.
Step 2:
In choose file window/attachment window, move your mouse to look in, click the left mouse button then select the
driver/ search where the file you want to attach is located.
Step 3:
Move your mouse to the file name of the file you want to send and click the left mouse button, then choose Open button,
the start attaching, after which a clip indicate successfully attachment with the file name.
5. USING SEARCH ENGINES:
The web has become a huge repository of information on a variety of topics. This makes it a preferred mode to research
on a large number of topics. However, the volume of information is so large, that it makes the access to right

Computer Engineering and Intelligent Systems www.iiste.org ISSN 2222-1719 (Paper) ISSN 2222-2863 (Online)
Vol 3, No.10, 2012
47
information difficult and slow. This is the reason for the popularity of Search Engines. Search Engines help web-users
to find information quickly. Some of the most popular search engines are Google, Altavista, and Hotbot. Usually
search engines have a text box, where the users have to enter the information they want to search on the web. On
pressing Enter, the search engine looks for a match to the words entered in the text box. After a few moments, a list of
search results is displayed on the screen. This list usually consists of a listing of links to various websites containing
and a brief description of each link. These results are arranged according to their accuracy, i.e. the closer the match with
the text entered by the user, the higher up the list it is placed. The user, then has to browse through this list to find which
results are relevant and open the links by pressing Enter key on them.
We will learn to conduct search on Google.
1. Open Internet Explorer.
2. Press control key + O key to open the 'Open' dialog box, type www.google.com and press enter key or type the web
address at the address bar and hit the enter key on the keyboard.
3. In a few moments the home page of the Google website will be opened as shown above. The cursor will be placed in
the search text box, press enter key to put on the forms mode. Now, type the text you want to search on the web in this
box and press enter key.
4. In a few seconds, the search results will be listed on your computer.

Computer Engineering and Intelligent Systems www.iiste.org ISSN 2222-1719 (Paper) ISSN 2222-2863 (Online)
Vol 3, No.10, 2012
48
5. Use Tab to browse the links. Or if you are already know the link, press Insert key + F7 key to open the links listing
dialog box. Now, use the arrow direction keys to reach the link you want to access, and press enter key.
CONCLUSION
In the modern society, a computer has become a vital component for people, leading to email and the internet being
an essential tool in every area of human endeavor. This has indisputably had a positive impact on people and the
benefits are clear to see, such as the greatly increased speed at which information between friends, colleagues and
customers can be accessed and shared, improve efficiency, find new business opportunities and work more closely
with customers and suppliers. It is important to remember however that these valuable tools can also be misused by
people, when used in carrying out operations against the email and internet policy. Enhance, people are encourage to
positively engage themselves in positive usage of these great facilities in improving their businesses and academic
work.
REFERENCES
Ben Mbonu (2002). Teach yourself Internet and the World Wide Web, Becky Products Limited, Ikeja-Lagos, Nigeria.
The Domain Name System was designed by Paul Mockapetris and initially documented in November
1983. Mockapetris, P., "Domain names - Concepts and Facilities", RFC 882, USC/Information Sciences Institute,
November 1983 and Mockapetris, P.,"Domain names - Implementation and Specification", RFC 883,
USC/Information Sciences Institute, November 1983. (see also http://soa.granitecanyon.com/faq.shtml)
The Handle System - see www.handle.net
"RFC 5321 – Simple Mail Transfer Protocol". Network Working Group. Retrieved 2010-02=October 2008.
Partridge 2008 for early history of email, from origins through 1991.
Long, Tony (23 October 2000). A Matter of (Wired News) Style. Wired magazine.
Internet World Stats, updated 31 March 2011. Retrieved 8 November 2011.
"Internet, n.". Oxford English Dictionary (Draft ed.). March 2009. Retrieved 26 October 2010. "Shortened <
INTERNETWORK n., perhaps influenced by similar words in -net"
Oxford English Dictionary, 2md ed., gives ninteenth-century use and pre-Internet verb use]
"7.76 Terms like 'web' and 'Internet'", Chicago Manual of Style, University of Chicago, 16th edition
"Links". HTML 4.01 Specification. World Wide Web Consortium. HTML 4.01 Specification. Retrieved 13 August
2008. "[T]he link (or hyperlink, or Web link) [is] the basic hypertext construct. A link is a connection from one Web
resource to another. Although a simple concept, the link has been one of the primary forces driving the success of the
Web."
Celebrating 40 years of the net, by Mark Ward, Technology correspondent, BBC News, 29 October 2009
"A Technical History of CYCLADES", Technical Histories of the Internet & other Network Protocols, Computer
Science Department, University of Texas Austin, 11 June 2002
"The Cyclades Experience: Results and Impacts", Zimmermann, H., Proc. IFIP'77 Congress, Toronto, August 1977, pp.
465–469
A Chronicle of Merit's Early History, John Mulcahy, 1989, Merit Network, Ann Arbor, Michigan
"A Technical History of National Physical Laboratories (NPL) Network Architecture", Technical Histories of the

Computer Engineering and Intelligent Systems www.iiste.org ISSN 2222-1719 (Paper) ISSN 2222-2863 (Online)
Vol 3, No.10, 2012
49
Internet & other Network Protocols, Computer Science Department, University of Texas Austin, 11 June 2002
"Roads and Crossroads of Internet History" by Gregory Gromov. 1995
Hafner, Katie (1998). Where Wizards Stay Up Late: The Origins Of The Internet. Simon & Schuster.
ISBN 0-684-83267-4.
Ronda Hauben (2001). From the ARPANET to the Internet. Retrieved 28 May 2009.
"Events in British Telecomms History". Events in British TelecommsHistory. Archived from the original on 5 April
2003. Retrieved 25 November 2005.
"NORSAR and the Internet". NORSAR. Retrieved 5 June 2009.
Barry M. Leiner, Vinton G. Cerf, David D. Clark, Robert E. Kahn, Leonard Kleinrock, Daniel C. Lynch, Jon Postel,
Larry G. Roberts, Stephen Wolff (2003). A Brief History of Internet. Retrieved 28 May 2009.
NSFNET: A Partnership for High-Speed Networking, Final Report 1987-1995, Karen D. Frazer, Merit Network, Inc.,
1995
"Retiring the NSFNET Backbone Service: Chronicling the End of an Era", Susan R. Harris and Elise Gerich,
ConneXions, Vol. 10, No. 4, April 1996
Ben Segal (1995). A Short History of Internet Protocols at CERN.
Réseaux IP Européens (RIPE)
"Internet History in Asia". 16th APAN Meetings/Advanced Network Conference in Busan. Retrieved 25 December
2005.
How the web went world wide, Mark Ward, Technology Correspondent, BBC News. Retrieved 24 January 2011
"Brazil, Russia, India and China to Lead Internet Growth Through 2011". Clickz.com. Retrieved 28 May 2009.
Coffman, K. G; Odlyzko, A. M. (2 October 1998) (PDF). The size and growth rate of the Internet. AT&T Labs.
Retrieved 21 May 2007.
Comer, Douglas (2006). The Internet book. Prentice Hall. p. 64. ISBN 0-13-233553-0.
"World Internet Users and Population Stats". Internet World Stats. Miniwatts Marketing Group. 22 June 2011.
Retrieved 23 June 2011.
"The World’s Technological Capacity to Store, Communicate, and Compute Information", Martin Hilbert and Priscila
López (April 2011), Science, 332(6025), 60–65.

Computer Engineering and Intelligent Systems www.iiste.org ISSN 2222-1719 (Paper) ISSN 2222-2863 (Online)
Vol 3, No.10, 2012
50
Multiple Views Effective for Gait Recognition Based on Contours
Romany F. Mansour
Department of Science and Mathematics, Faculty of Education, New Valley,
Assiut University, EL kharaga, Egypt
Abstract
Gait is one of well recognized biometrics that has been widely used for human identification. However, the current
gait recognition might have difficulties due to viewing angle being changed. This is because the viewing angle under
which the gait signature database was generated may not be the same as the viewing angle when the probe data are
obtained. This paper present an effective multi-view gait recognition based on motion contour (MVGRMC) approach
which tackles the problems mentioned above. Initially the background modeling is done from a video sequence.
Subsequently, the moving foreground objects in the individual image frames are segmented using the background
subtraction algorithm. Then, the morphological skeleton operator is used to track the moving silhouettes of a
walking , Finally, when a video sequence is fed, the proposed system recognizes the gait features and thereby
humans, based on self-similarity measure. The proposed system is evaluated using gait databases and the
experimentation on outdoor video sequences demonstrates that the proposed algorithm achieves a pleasing
recognition performance. The proposed algorithm can significantly improve the multiple view gait recognition
performance when being compared to the similar methods. These results are illustrated with practical examples on
popular gait databases.
Keywords: Gait Recognition; Biometric; silhouette; Motion analysis; Feature extraction
1. Introduction
Biometrics technologies verify a person’s identity by analyzing human characteristics such as fingerprints, facial
images, irises, gait, and voice recordings. Gait as a biometric may be performed at a distance or at low resolution,
while other biometric need higher resolution. Apart from this, it is difficult to disguise, and it requires no
body-invading equipment to capture gait information. Medical studies [1] suggest that gait is unique if all gait
movements are considered. In these cases, gait recognition is an attractive biometric and becoming increasingly
important for surveillance, control area etc. More and more researchers have devoted to this field.
Early approaches to automated recognition by gait used marked-based technology, which needs expensive
specialized hardware. Most recent approaches based on computer vision extract features for recognition from image
sequences. Current approaches to gait recognition can be divided into two categories: Appearance-based ones [2,3]
that deal directly with image statistics and Model-based ones [4,5]that first model the image data and then analyze
the variation of its parameters. The majority of current approaches are the appearance-based approaches which are
simple and fast. But the silhouette appearance information is only indirectly linked to gait dynamics. Little and Boyd
[6] used frequency and phase obtained from optical flow to identify walkers. Furthermore, Lee and Grimson [2]
divided the silhouette into seven regions to extract both the gait average appearance feature vector and the gait
spectral component feature vector for recognition. Wang et al. [7] converted 2D silhouette contour to 1D signal that

Computer Engineering and Intelligent Systems www.iiste.org ISSN 2222-1719 (Paper) ISSN 2222-2863 (Online)
Vol 3, No.10, 2012
51
composed of distances to shape centroid and classified the walkers after having reduced the dimensionality of the
feature by Principal Component Analysis. Furthermore, Johnson and Bobick [8] presented a gait recognition
technique based on static body parameters recovered during the walking action across two different side-views in
depth with a single camera. Huang and Boulgouris [3] investigated the contribution of each view direction to the
recognition performance using the CMU MoBo database.
Our study aims at establishing an automatic gait recognition method based upon silhouette analysis. Gait includes
both the body appearance and the dynamics of human walking motion. Intuitively, recognizing people by gait
depends greatly on how the silhouette shape of an individual changes over time in an image sequence. So, we
consider gait motion to be composed of a sequence of static body poses and expect that some distinguishable
signatures with respect to those static body poses can be extracted and used for recognition by considering temporal
variations in those observations. Based on these considerations, we propose a new extraction scheme for gait feature.
First, we obtain the gait features by scanning the outer contour of the binarized silhouette forgetting more
information about body appearance and structure. This method can extract the equivalent information with low cost
of computation by analyzing the variation of silhouette contour.
2. Human Extraction Silhouette
The gait images are firstly pre-processed before gait recognition. It includes two steps: human silhouette
extraction and human contour stereo matching. The details are described as follows:
• The LMS (Least Median of Squares) method [9] is used for retrieving the background image from image
sequences captured by a from stereo vision system firstly.
• The moving individual silhouette is detected through background subtraction.
• Mathematical Morphology Method is employed to fill in holes and remove noise in binary images.
• A binary connected component analysis is used to extract a single-connective moving object.
• A contour of moving object can be accomplished by Canny edge detection operator.
• Stereo match on contour is performed in order to get the disparity of the pairs of stereo image.
As a result, 3D coordinates of the contour are finally recovered by using the disparity, the known calibration
parameters and the known 2D coordinates of the contour, which yield the 3D silhouette. An instance of human
contour extracted is shown on Figure 1
Figure 1. Instance of human silhouette extraction
The continuous change of the silhouette of a moving individual along with time denotes that it is a complex
spatio-temporal signal. For analyzing the rule of the change of moving silhouette and reducing the complexity of
algorithm, we represent the moving 3D contour with a 1D silhouette signal named the stereo silhouette vector (SSV).
The transformation of stereo silhouette vector reflects the changes of moving silhouette along with time. The

Computer Engineering and Intelligent Systems www.iiste.org ISSN 2222-1719 (Paper) ISSN 2222-2863 (Online)
Vol 3, No.10, 2012
52
extraction process of stereo silhouette vector is shown on Figure 2.
Figure 2. Illustration of stereo silhouette vector
Let (xi,yi,zi) represent a pixel on the 3D silhouette, i=1,2,…,N, N is the total number of pixels. Then, the centroid
(xc,yc,zc) of 3D silhouette can be computed by ,
Thus, the stereo silhouette vector can be depicted as
We unwrapped the extracted 3D silhouette from top to bottom to calculate all of the stereo silhouette vector. Finally,
the 3D silhouette can be described by
,
For decreasing the calculation, we only utilized the L2-norm of stereo silhouette vector as a crude stereo gait feature.
It is described by the below expression
,
Finally, we normalized the 1D silhouette signal by employing both maximum-norm and equal interval sampling so
that the effect of scale and length on correct recognition rate can be partly eliminated. Figure 3 demonstrates a
sample of normalized stereo gait feature.

Computer Engineering and Intelligent Systems www.iiste.org ISSN 2222-1719 (Paper) ISSN 2222-2863 (Online)
Vol 3, No.10, 2012
53
Figure 3Illustration the normalized L2-norm
3. Gait Feature Representations and Extraction
To classify the different person by their gait easily, we need some effective features. Good features should maximize
interclass variance and minimize within-class variance. Here, both shape and dynamic feature have been extracted.
We normalized the same start for each sequence. Murrary [1] suggested that human gait is a form of periodic motion.
[4] has given some relative definition of gait cycle. Our previous work has found that the width and height of person
body fluctuate as walking. The fluctuating of silhouette is equal to that of body. Then we consider gait cycle as a
function of the silhouette width and height over time. Here, we define the bounding box for each observed body. The
height and width of box alter along with the fluctuating of silhouette. Gait cycle is the time between the successive
peak values of the width (height). Gait cycle is one of features for the latter recognition. Figure 4 shows the periodic
gait signals
Figure 4 The periodic gait signals
The variance of width is the important information for gait analysis based on silhouette. The width contains structural
as well as dynamical information of gait. Different from , the width parameters in our approach are not merely the
bounding box width. Through observing the gait of the same and different persons, we found that most changes
occur during the swing of arms and the oscillation of legs. We subdivide the binary silhouette into three horizontal
segments. As shown in Figure 5, the silhouette is divided into three contiguous horizontal segments according the
anatomical literature And we denote the three horizontal segments as R1, R2 and R3, respectively.WR1 , WR2 and WR3,
are the width of above segments. Every segment has one sub-bounding box. Corresponding to the three
sub-bounding boxes, the time series of the width in a period are denoted, WR1 (t), WR2(t) and WR3(t) , respectively.
W(t) = Max( WR1 (t), WR2(t) ,WR3(t)) denotes the width of the entire person’s bounding box. From analyzing the three
sub-bounding boxes, we attain some apparent features including stride length, height and gait cycle. Stride length is
estimated by tracking the person, estimating their distance walked over a period of time and then counting the
number of steps.

Computer Engineering and Intelligent Systems www.iiste.org ISSN 2222-1719 (Paper) ISSN 2222-2863 (Online)
Vol 3, No.10, 2012
54
Figure 5 Three contiguous sub-bounding boxes
4. Dynamic feature analysis
The Kinematic information of gait is usually represented by the joint angles of limbs. The angles of body are useful
and important information for improving the recognition rate. To extract the angle information, there are many
methods represented human body model by a 2D stick figure configuration. [5] Modeled the human legs as two
pendula joined. L. Wang extracted angles from a model composed of 14 rigid body parts. Different from these
methods, we attain the joint angle by analyzing the width of sub-bounding box not modeling the whole body. It is
known that the swing of the limbs and other details of the body are retained in the width vector. And we attain the
useful features with low cost of computation. The joint angles are extracted in the sub-bounding box. The upper
limbs have the severe self-occlusion, the joint angles are very difficult to track and measure. Therefore, we choose
three joint angles of lower limbs as the gait features. The silhouette is divided into three contiguous horizontal
segments based on the anatomical literature. To extract the joint angles, we should firstly locate the positions of
joints.
The first joint is pelvis. The position of this joint is calculated based on the W4 approach. The pelvis location within
R2 is determined from the mean x-value and the mean y-value of the silhouette pixels in the pelvis region. The
positions of knees and ankles are determined by the know properties of body segments and the direction of thigh and
shin. The rough position of the front knee is estimated by the minimum distance from the left boundary of R2. The
vertical of position of the rear knee is equal to or higher that the vertical position of the front knee. We locate the
position of the rear knee in R2 and the position of the front knee around the border of R2. The position of knee is
calculated by
,
Where denote the two knee positions. For the front knee, denotes the horizontal position of the first
pixel of the left border of R2, represents the second pixel on one leg. For the rear knee, denotes the
horizontal position of the right border of R2. The width of R2 is the distance between he knee position
is the crossing between thigh and shin. Using the same method, the positions of ankles are calculated and we denote
left ankle location and right ankle location as and, respectively. and At low cost, all positions of joints are

Computer Engineering and Intelligent Systems www.iiste.org ISSN 2222-1719 (Paper) ISSN 2222-2863 (Online)
Vol 3, No.10, 2012
55
located. Figure 6 (a) shows the positions of the angles. There are five joint we attained in previous section. As
follows:
, , , , , ,
The thigh lines are generated by connecting the pelvis position , to the knee positions. The shin lines are
generated by connecting positions between knees and ankles. Joint angles are generated between the neighboring
lines. Figure 6 (b) shows the joint angles we defined at each frame of an image sequence. All the angles are measured
relative to the horizontal axis. We denote the angles as, and , and are angles series in
one gait cycle. The thigh angles , and the knee angles have the relationship: The angle
information extracted by analyzing the variation of silhouette width is equal to that extracted from dynamic model
with a low cost of computation.
Figure 6: (a) The positions of the angles and (b) the angles of lower limb
This paper adopts the similar method as that one in [7] to determine the period of each gait sequence. The basic
procedure is illustrated in Figure 7. It is a complicated procedure for the case of frontal view video sequence.

Computer Engineering and Intelligent Systems www.iiste.org ISSN 2222-1719 (Paper) ISSN 2222-2863 (Online)
Vol 3, No.10, 2012
56
Figure 7. Gait period estimation. (a) Sample silhouette sequences of walking people. (b) Aspect ratio of silhouette bounding box. (c)
Normalization of aspect ration followed by mean filtering. (d) Autocorrelation of aspect ration under various offset. (e) First order
derivative based on (d). (f) Peak positions indicating the periods.
Figure 7(a) shows three samples of silhouette sequences obtained under the side view, oblique view and front view
respectively. Along the time of image sequences, the aspect ratio of each silhouette bounding box is recorded (Figure
7(b)). In order to more precisely estimate the gait period, the curves in Figure 7(b) are further processed by deleting
the mean value and normalized by its standard deviation. Then, the results are processed by mean filtering (Figure
7(c)). Autocorrelation based on the results in Figure 7(c) are calculated. The correlation between the curve in Figure
7(c) and the curve by shifting itself in some degree is calculated. The offset range t in this paper is −40 ≤ t ≤ 40 as
shown in Figure 7(d). From Figure (b) and (c), it can be seen that the change of bounding box aspect ration is a kind
of periodic signal.
Thus, when calculating autocorrelation in Figure 7(d), there will be a peak if the offset equals to a gait period or its
integer multiple. To more clearly identify the period transition position, first order derivative (Figure 7(e)) is
calculated based on the results of Figure 7(d). The period transition position is defined at the zero crossing point
along the positive-to-negative direction. According to [7], because of the bilateral symmetry of human gait under any
viewing angle except frontal view, the autocorrelation signals sometime contain minor peaks located half way
between each pair of consecutive major peaks. So the final period transition positions are shown and aligned using
dash lines on Figure 7(f)
5. Gait Analysis and Classifier
In this section, we analyze different features to exploit redundancy in the gait data for reduction. The time
series we attain in previous section including, WR1 (t), WR2(t) ,WR3(t) , W (t), are all 1D

Computer Engineering and Intelligent Systems www.iiste.org ISSN 2222-1719 (Paper) ISSN 2222-2863 (Online)
Vol 3, No.10, 2012
57
vectors. The time series are considered to be periodic. Denotes a sequence of
periodical signal in one gait cycle. We adopt Discrete Cosine analysis to describe the periodical sequences. Discrete
Cosine analysis is performed on x(m) using the Discrete Cosine Transform. And DCT is very appropriate to
analyzing our signals than other transforms. It should be noted that the data needs to be normalized and x(m) needs to
be symmetrical before being transformed. To insure x(m) is symmetrical, we extend x(m) to be the new series , y(n),
n=0,1,…N-1, y(n) is even function.
The number of y(n) is twice of x(m),but it does not affect the features we need. And the number of descriptors
of after discrete cosine analysis is equal to that of Fourier descriptors of x(m) The DCT is closely to K-L transform,
which compression ratio is high. Here, discrete cosine analysis is propitious to our signals. The time series y(n) can
be represented by the discrete cosine series:
And these DC coefficients can be calculated by DCT. Frequency spectrum is
where is frequency spectrum at frequency i
,
The extracted discrete cosine frequency spectrum of WR3(t) is shown as Figure 8.
Figure 8 The magnitude spectrum discarded the high frequency of WR3(t)
Then we apply the gait appearance features and kinetic features to identify the human. We trained and tested support
vector machines on our gait features. This is a multi-class support vector machine [10]. The kernel function of our
classifier is Gaussian kernel,
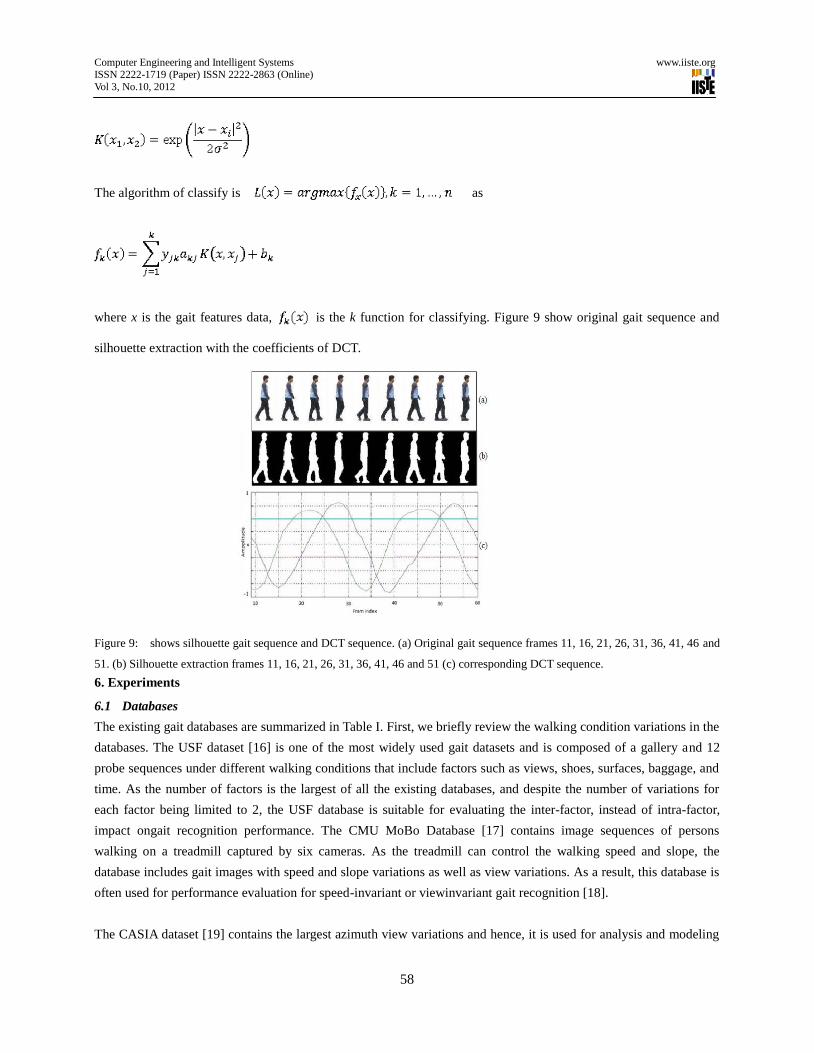
Computer Engineering and Intelligent Systems www.iiste.org ISSN 2222-1719 (Paper) ISSN 2222-2863 (Online)
Vol 3, No.10, 2012
58
The algorithm of classify is as
where x is the gait features data, is the k function for classifying. Figure 9 show original gait sequence and
silhouette extraction with the coefficients of DCT.
Figure 9: shows silhouette gait sequence and DCT sequence. (a) Original gait sequence frames 11, 16, 21, 26, 31, 36, 41, 46 and
51. (b) Silhouette extraction frames 11, 16, 21, 26, 31, 36, 41, 46 and 51 (c) corresponding DCT sequence.
6. Experiments
6.1 Databases
The existing gait databases are summarized in Table I. First, we briefly review the walking condition variations in the
databases. The USF dataset [16] is one of the most widely used gait datasets and is composed of a gallery and 12
probe sequences under different walking conditions that include factors such as views, shoes, surfaces, baggage, and
time. As the number of factors is the largest of all the existing databases, and despite the number of variations for
each factor being limited to 2, the USF database is suitable for evaluating the inter-factor, instead of intra-factor,
impact ongait recognition performance. The CMU MoBo Database [17] contains image sequences of persons
walking on a treadmill captured by six cameras. As the treadmill can control the walking speed and slope, the
database includes gait images with speed and slope variations as well as view variations. As a result, this database is
often used for performance evaluation for speed-invariant or viewinvariant gait recognition [18].
The CASIA dataset [19] contains the largest azimuth view variations and hence, it is used for analysis and modeling

Computer Engineering and Intelligent Systems www.iiste.org ISSN 2222-1719 (Paper) ISSN 2222-2863 (Online)
Vol 3, No.10, 2012
59
of view impact on gait recognition [20]. The OU-ISIR Gait Database [21] contains gait images with the largest speed
variations (7 speeds: 1 km/h interval from 2 km/h to 7 km/h) and clothing variations (32 combinations at most), and
therefore, it is used for evaluating speed-invariant [22] and clothing-invariant [23] gait recognition. Next, we review
the number and variation of subjects. As shown in Table I, relatively large-scale gait databases with more than a
hundred subjects are limited to the following three: USF dataset, Soton database [24], and CASIA dataset . Although
these three databases provide a statistically reliable performance to some extent, the number of subjects are still not
sufficient compared with other biometrics such as fingerprints and faces. In addition, populations of genders and ages
are biased in these databases; e.g., there are no children in the USF dataset, while in the CASIA dataset most of the
subjects are in their twenties and thirties and the ratio of males to females is 3 to 1. Such biases are undesirable in
performance evaluation of gait-based gender and age estimation and performance comparison of gait recognition
between genders and age groups.
Table I Existing gait databases
Walking conditions # Subjects Database
2 views, 2 shoes, 2 surfaces, baggage (w/ and w/o), time 122 USF database [16]
6 views, 2 speeds, 2 slopes, baggage (ball) 25 CMU Mobo database [17]
Multiple views 115 Soton (Southampton) database [24]
11 views, clothing (w/ and w/o coat), baggage (w/ and w/o) 124 CASIA database [19]
Multiple views 24 MIT database [25]
Multiple views, time, distance 20 Georgia Tech database [16]
32 clothes combination (at most 68 The OU-ISIR gait database [21]
7 speeds 34
Table 2 results by different recognition algorithms on CMU MoBo
CMU
[11]
UMD
[12]
MIT
[2]
SVB
[13]
Frieze
[14]
SSP
[15] MVGRMC
Slow vs. Slow 100% 100% 100% 100% 100% 100% 100%
Fast vs. Fast - 100% - 100% 100% 100% 100%
Ball vs. Ball - 100% - 100% 100% - 100%
Slow vs. Fast 73% 77% 70% 82% 100% 54% 88%
Fast vs. Slow - 86% - 80% 84% 39% 89%
Slow vs. Ball 90% 48% 50% 77% 81% - 97%
Ball vs. Slow - 40% - 89% 50% - 94%
Fast vs. Ball - 44% - 61% 50% - 80%
Ball vs. Fast - 49% - 79% 50% - 81%
6.2 Evaluation measures
Recognition performance is evaluated by two measures: (1) Cumulative Match Characteristic (CMC) curve and
(2) Receiver Operating Characteristic (ROC) curve. The CMC curve shows the relation between identification rates
and a tolerant rank in a one-to-N matching scenario. For example, a rank k identification rate means the ratio of a
probe to all other probes, where a correct gallery corresponding to the given probe occurs within a rank k score. The

Computer Engineering and Intelligent Systems www.iiste.org ISSN 2222-1719 (Paper) ISSN 2222-2863 (Online)
Vol 3, No.10, 2012
60
(b) (a)
ROC curve denotes a tradeoff curve between a False Rejection Rate (FRR) and False Acceptance Rate (FAR) when
the acceptance threshold is changed by a receiver in a one-tone matching scenario. In a one-to-one matching scenario,
a z-normalized distance among galleries is adopted to improve the performance in this paper. Note that the CMC
curve is dependent on the gallery size, whereas the ROC curve is essentially independent of the gallery size.
6.3 Comparison of gait recognition approaches
In this section, the recognition performance of each of the four approaches, PP-PCA, SP-PCA, MVGRMC, and
FREQ, is compared using the whole set in the largest gait database as a preliminary experiment. The CMC and ROC
curves are depicted in Figure. 10 (a) and 10 (b),. According to the results, MVGRMC achieves the best performance
of all. PP-PCA, SPPCA, and FREQ are more sensitive to motion components than MVGRMC and therefore, their
performance is possibly more severely affected by gait fluctuations between the gallery and probe.
7. Conclusions
This paper describes the construction of a database and a most up statistically reliable evaluation of performance of
the motion recognition based on vision and have a less automated approach marker for human identification
parameters from fusion of low resolution video Static and dynamic walking. The width was chosen as the function of
basic gait. The characteristic features consist gait based on appearance of the progress and based on kinematics. We
angles extract features without human body model and analyze motion signatures Discrete Cosine analysis. Used to
analyze the shape and the dynamic characteristic and reduce running characteristics. In addition, this document uses
the machines multi-class Support Vector to distinguish the different positions of humans. The performance of the
proposed method is tested using different databases gait. Recognition results show Our approach provides an
efficient way to extract, the model form of movement up sequence information, and to measure the difference
between the models walking sequence that is robust to location gait cycle, the change in gross appearance, and time
scaling. The proposed algorithm can significantly improve the throughput multiple view recognition when compared
with similar methods.
Figure 10 (a) CMC curve of gait recognition approaches ; (b) ROC curve of gait recognition approaches.

Computer Engineering and Intelligent Systems www.iiste.org ISSN 2222-1719 (Paper) ISSN 2222-2863 (Online)
Vol 3, No.10, 2012
61
References
[1] M.P Murary, A.B Drought and R.C Kory. “Walking Pattern of Movement”, American Journal Medicine,
Vol.46, No. 1, pp.290-332, Jan. 1967.
[2] L. Lee and W. Grimson, “Gait Analysis for Recognition and Classification”, Proceedings of the 5th
IEEE
International Conference on Automatic Face and Gesture Recognition, pp. 155-162, 2002.
[3] X. Huang and N. V. Boulgouris, “Human Gait Recognition Based on Multi view Gait Sequences”,
EURASIP Journal on Advances in Signal Processing, pp. 1-9, 2008.
[4] D. Cunado, M.S. Nixon, and J.N. Carter. “Automatic Extraction and Description of Human Gait Models for
Recognition Purposes”, Computer Vision and Image Understanding, vol. 90, No.1, pp. 1-41, April 2003.
[5] M.S. Nixon, J.N. Carter, M G. Grant. “New Advance in Automatic Gait Recognition”. Information Security
Technical Report, vol. 7, No.4,pp. 23-35,2002.
[6] J. Little and J. Boyd, “Recognizing people by their gait: the shape of motion” , Journal of Computer Vision
Research, vol. 1, no.2, pp. 2-32, 1998.
[7] L. Wang, T. Tan, W. Hu, and H. Ning, “Silhouette Analysis-Based Gait Recognition for Human
Identification,” IEEE Trans. on Pattern Analysis and Machine Intelligence, vol. 25, no. 12, pp. 1505-1518,
2003.
[8] A. Y. Johnson and A. F. Bobick, “A Multi-view Method for Gait Recognition Using Static Body
Parameters”, in Proc. 3rd
International Conference on Audio-and Video-Based Biometric Person
Authentication, Halmstad, Sweden, pp. 301-311, 2001.
[9] Y. H. Yang and M. D. Levine, “The background primal sketch: An approach for tracking moving objects,”
Machine Vision and Applications, vol. 5, no. 1, pp. 17-34, 1992.
[10] J Weston, C Watkins. “Multi-class support vector machine” , Royal Holloway: University of London,
London, CSK-TR-98-04,1998
[11] R.Collins, R. Gross, and J.Shi. "Silhouette-based human identification from body shape and gait", In Proc.
Int Conf. Automatic Face and Gesture Recognition, volume 1, pp. 351– 356. IEEE, 2002.
[12] A. Veeraraghavan, A. R. Chowdhury, and R. Chellappa. Role of shape and kinematics in human movement
analysis. In Proceedings of CVPR.2007, IEEE, 2004.
[13] S. Lee, Y. Liu, and R. Collins, "Shape variation-based frieze pattern for robust gait recognition", In
Proceedings of CVPR 2007, volume 1, pp. 1–8. IEEE, 2007.
[14] Y. Liu, R. Collins, and Y. Tsin, "Gait sequence analysis using frieze patterns", In Proceedings of ECCV
2002, vol. 1, pp. 657–671, IEEE, 2002.
[15] C. Ben Abdelkader, R. G. Cutler, and L. S. Davis. "Gait recognition using image self-similarity", EURASIP
Journal on Applied Signal Processing, 20(4), pp. 572–585, 2004.
[16] S. Sarkar, J. Phillips, Z. Liu, I. Vega, P. Grother, and K. Bowyer, “The humanoid gait challenge problem:
Data sets, performance, and analysis,” Trans. of Pattern Analysis and Machine Intelligence, vol. 27, no. 2,
pp. 162–177, 2005.
[17] R. Gross and J. Shi, “The cmu motion of body (mobo) database,” CMT, Tech. Rep., Jun. 2001.
[18] Z. Liu and S. Sarkar, “Improved gait recognition by gait dynamics
normalization,” IEEE Transactions on Pattern Analysis and Machine Intelligence, vol. 28, no. 6, pp.
863–876, 2006.
[19] S. Yu, D. Tan, and T. Tan, “A framework for evaluating the effect of view angle, clothing and carrying

Computer Engineering and Intelligent Systems www.iiste.org ISSN 2222-1719 (Paper) ISSN 2222-2863 (Online)
Vol 3, No.10, 2012
62
condition on gait recognition,” in Proc. of the 18th Int. Conf. on Pattern Recognition, vol. 4, Hong Kong,
China, pp. 441–444,2006.
[20] S. Yu, D. Tan, and T. Tan, “Modeling the effect of view angle variation on appearance-based gait
recognition,” in Proc. of 7th Asian Conf. on Computer Vision, vol. 1, pp. 807–816, 2006.
[21] “Ou-isir gait database,” http://www.am.sanken.osakau. ac.jp/GaitDB/index.html.
[22] Y. Makihara, A. Tsuji, and Y. Yagi, “Silhouette transformation based on walking speed for gait
identification,” in Proc. of the 23rd IEEE Conf. on Computer Vision and Pattern Recognition, San Francisco,
CA, USA, Jun 2010.
[23] M. A. Hossain, Y. Makihara, J. Wang, and Y. Yagi, “Clothing invariant gait identification using part-based
clothing categorization and adaptive weight control,” Pattern Recognition, vol. 43, no. 6, pp. 2281-2291,
2010.
[24] M. Nixon, J. Carter, J. Shutler, and M. Grant, “Experimental plan for automatic gait recognition,”
Southampton, Tech. Rep., 2001.
[25] “Mit ai database,” http://www.ai.mit.edu/people/llee/HID.
[26] R. Tanawongsuwan and A. Bobick, “A study of human gaits across different speeds,” Georgia Tech, Tech.
Rep., 2003.

Computer Engineering and Intelligent Systems www.iiste.org ISSN 2222-1719 (Paper) ISSN 2222-2863 (Online)
Vol 3, No.10, 2012
63
A New Technique to Fingerprint Recognition Based on Partial
Window
Romany F. Mansour1*
AbdulSamad A. Marghilani2
1. Department of Science and Mathematics , Faculty of Education, New Valley, Assiut University, Egypt
2. Dean of Scientific Research, Northern Border University, KSA,
* E-mail of the corresponding author : [email protected] – [email protected]
Abstract
Fingerprint verification is a well-researched problem, and automatic fingerprint verification techniques have been
successfully adapted to both civilian and forensic applications for many years. This paper present a new technique to
fingerprint recognition based a window that contain core point this window will be input ANN system to be model
we can recognize another fingerprint , so we will firstly, A recognition algorithm needs to recover fingerprints pose
transformation between the input reduce time computation. Our detection algorithm works in the field orientation of
the adaptive smoothed with a varying area. The adaptive window is used to attenuate the noise effectively orientation
field while maintaining the information of the detailed guidance in the area of high curvature. A new approach to the
core point location that is proposed is based on hierarchical analysis orientation consistency. The proposed adaptation
singular point detection method increases the accuracy of the algorithm. Experiments show that our algorithm
developed consistently locates a reference point with high precision only for all fingerprints. And very faster for
recognition process.
Keywords: Fingerprint recognition; field orientation; neural networks; core point, neural networks.
1. Introduction
Fingerprints are the most widely used biometric feature for user identification and verification in the field of
biometric identification and security [1]. Fingerprint consists of ridges and furrows on the fingertips. It is widely
used for personal identification due to its easy accessibility, uniqueness and reliability. Pose transformation samples
normally exist in different fingerprints of the same finger. A popular solution is to locate a reference point that is used
only for registration or alignment of the different samples. Since the singular points, i.e. central and delta points are
landmarks unique fingerprint, which were used as reference points for fingerprint matching and classification [2].
However, some fingerprints contain only partial images with singular points are out of print, and not all have valid
fingerprint singular points. To locate a single reference point consistent for all types of fingerprints. Central point is
defined as the northernmost point of the innermost ridge line [3], which is usually located in the central area (see
figure 1). Methods for detecting singular points operating in the field of orientation of the fingerprint. The Poincare
index analysis is one of the commonly used methods and relates Karu Jain [2].
However, this method is sensitive to noise and orientation field does not work for arc fingerprint smooth, since there
are no singular points in such a fingerprint. Koo and Kot [4] proposed a method of detecting a singular point based
on searching the point with maximum curvature crest. It works well for low quality fingerprint, as calculated
curvature is sensitive to noise of orientation field. A.K. Jain [5] proposed a robust method to locate a reference point
with maximum curvature based on multi-resolution analysis of the sinusoidal component integration differences

Computer Engineering and Intelligent Systems www.iiste.org ISSN 2222-1719 (Paper) ISSN 2222-2863 (Online)
Vol 3, No.10, 2012
64
between two defined regions of the field orientation. However, these two regions are sensitive to the rotation of
fingerprints.
Figure 1 Example of core point.
In a fingerprint, all the ridges diverge out in the form of loops from the core point. They are generally elliptical in
nature and grow in size as we move away from the core point. In general, the core point shows a discontinuity as far
as the orientation of the ridges around it is concerned. In existing algorithms, we make use of this discontinuity to
locate the core point. Finding the orientation of the ridges is the first step. Following this, various algorithms make
use of different properties. The Detection of Curvature algorithm uses a global mask to locate the points which
exhibit this discontinuity by considering the cosine and sine components of the orientation [6].
The Geometry of Region technique defines two sandwiched regions designed to capture the maximum curvature in
concave ridges [7]. In these techniques, we use the micro features to locate the core point. However, the presence of
discontinuities due to scars and wrinkles or faulty image acquisition, might lead to false detection of the core point.
The proposed algorithm utilizes the global orientation features of the fingerprint. In any fingerprint, the ridges above
the core point are almost horizontal, while those on its sides are almost vertical. Based on this property, we can make
use of the vertical (sine) components of the orientations to locate the core point.
The sine of the orientation of the horizontal ridges will have a value close to zero, while that of the vertical ridges
will have a value close to one. We make use of this property and apply a global (less than) threshold to the sine of the
orientation of the ridges. The resulting image will have a component connected to the upper boundary of the
fingerprint region. Ideally, there should be only one such component. However, there may be multiple components
due to non-ideality. We choose the largest component and designate the lower most point of that component as the
core point. Our proposed algorithm has major steps. Pre-processing, extracting core point, determined window
surround core point , after extract the feature vectors of the window it will be input to ANN to recognize
fingerprints. Figure 2 show a diagram with the major steps of the proposed technique.

Computer Engineering and Intelligent Systems www.iiste.org ISSN 2222-1719 (Paper) ISSN 2222-2863 (Online)
Vol 3, No.10, 2012
65
Figure 2 shows a diagram with the major steps of the proposed technique.
2. Pre-processing
In our algorithm, images are pre-processed with gray-level enhancement, followed by obtaining the bounding
rectangle for the region of interest of the fingerprint and finally estimation of the orientation field in the region.
2.1 Normalization
Let l(x,y) represent the gray-level of the pixel at (x,y). The image is divided into a number of sectors of size w x w.
Let and denote the estimated mean and variance of the ith sector, denote the normalized gray level
value of the pixel at (x,y). Then for all the pixels in the ith sector, the normalized gray-level is defines as,
where and are the desired mean and variance values respectively. The result of normalization step is
illustrated in Figure 3 where the first image is an original fingerprint image and the second one is the result of the
normalization process.

Computer Engineering and Intelligent Systems www.iiste.org ISSN 2222-1719 (Paper) ISSN 2222-2863 (Online)
Vol 3, No.10, 2012
66
Figure 3 (a) Original fingerprint, (b) Normalization of (a)
2.2. Obtaining the region of interest
After normalization, the region of interest of the fingerprint has to be obtained. For our algorithm, it will be
beneficial to find the bounding rectangle for the fingerprint (for subsequent steps). The gradients and
at every pixel are computed, following which an overall gradient is computed as follows:
The overall gradient gives us the edge pixels in the fingerprint image. To this overall gradient G, a global threshold
T1 is applied. This threshold was empirically found to be in the range of 0.3 and 1.2.
We applying this threshold, we seek to eliminate noisy pixels and consider only the edges present in the fingerprint
region. We then find the smallest bounding rectangle for the nonzero pixels in E. If and are
the comer points of the bounding rectangle, and
Hence we obtain the bounding rectangle for the fingerprint region. A slightly liberal rectangular region of interest can
also be found. If R be the Region of Interest (Rol) for the fingerprint in the image, then we have,
where is the normalized image. We shall estimate the orientation field of the fingerprint only on this RoI, thus
cutting down on a large number of unnecessary computations.

Computer Engineering and Intelligent Systems www.iiste.org ISSN 2222-1719 (Paper) ISSN 2222-2863 (Online)
Vol 3, No.10, 2012
67
2.3 Orientation field estimation
One of the commonly used fingerprint representations, derived from the intensity images, is an orientation field. The
fingerprint orientation field is a vector field, which assigns a vector along the direction of the prevailing ridge to each
pixel of intensity image. One of the most important steps in core point detection as well as fingerprint matching and
identification is the orientation field estimation. Let be defined as the orientation field of a fingerprint image.
specifies the local orientation of the ridge at pixel . Since we have already obtained the bounding
rectangle for the fingerprint in the image, we shall restrict our operation to the ROI only. There are numerous
methods for estimating the orientation field [8] and [9]. However, in connection to the method outlined in this paper,
the smoothed orientation field based on least mean square algorithm is used [6] and [7].
1) The RoI is divided into a set of non-overlapping blocks, each of size w x w.
2) The gradients and are computed at each pixel which is at the center of a block. Since the
gradients have already been computed in the previous step, they need not be recomputed.
3) The local orientation is estimated using the following equations [5].
Here, is the least square estimate of the local ridge orientation of the block centered at pixel .
4) The obtained orientation field contains discontinuities of ridges and valleys due to the presence of noise. We
assume that local ridge orientation varies slowly in a local neighborhood where the core point does not appear. So the
discontinuities could be softened by applying a low pass filter. However, to apply a low pass filter, the orientation
field must be converted to a continuous vector field. The components of the continuous vector field are defined as
follows

Computer Engineering and Intelligent Systems www.iiste.org ISSN 2222-1719 (Paper) ISSN 2222-2863 (Online)
Vol 3, No.10, 2012
68
5) With the resulting vector field, a two dimensional low pass filter L of unit integral and size k x k is applied. As a
result,
6) The smoothed orientation field can be computed as follows
In our experiment, non-overlapping 3 x 3 pixel blocks were used to estimate the orientation field, smoothened with a
3 x 3 Gaussian Filter. Figure 4 show the result of orientation process.
Figure 4 Orientation field estimation: (a) original image with minutiae and (b) orientation field of (a).
3. Coarse Detection of Core Point
At this juncture, we have with us the rectangular region of interest for the fingerprint from the image and the
smoothed orientation field of the same. The coarse detection of the core point is carried out in the following steps.
1) The vertical component (sine) of the orientation field is computed
2) A global inverse threshold T2 is applied to .
The threshold T2 is empirically found to vary between 0.2 and 0.6. As a result, we get a number of segments or
components in the Rol.
3) Connected component labeling is performed over all the components, and as a result, the sizes of the components
are also obtained.

Computer Engineering and Intelligent Systems www.iiste.org ISSN 2222-1719 (Paper) ISSN 2222-2863 (Online)
Vol 3, No.10, 2012
69
4) The largest component C is chosen.
5) We check if the chosen component C is connected to the upper boundary of the RoI i.e.
where is found while obtaining the bounding rectangle. If the above condition is valid, we move on to the next
step. If not, we discard this particular component and go back to Step 4.
6) The lower most point in component C is assigned as the core point, i.e.
Since the procedure makes use of a global threshold, it is extremely robust and gives satisfactory results even for
poor quality images. However, there is a slight compromise as far as the precision of the location of the core point is
concerned. A finer detection of the core point is carried out using the Geometry of Region technique. See figure 5.
Figure 5 (a) estimated local orientation field, b) connected components obtained after applying threshold the
largest component is shown in gray. The lowest point in the largest component is marked with ‘X’ and (c)
the location of the coarse core point shown on the fingerprint.
4. Accurate Detection of Core Point
Accurate detection of core point is carried out by using the existing geometry of region technique over a m x 2m
window with the coarse core point lying at the center of the upper boundary of the window. In the previous step, we
chose the largest component connected to the upper boundary of the ROI. So the method adopted for detecting the
core point may be viewed as a top-to-bottom approach. So the actual core point can in no way lie above the coarse
core point detected in the previous step. This is the reason for choosing the aforementioned search window. The
process can be summarized as follows [5].
1) The smoothed orientation field is computed over the window
2) The sine component of is computed.

Computer Engineering and Intelligent Systems www.iiste.org ISSN 2222-1719 (Paper) ISSN 2222-2863 (Online)
Vol 3, No.10, 2012
70
= sin (18)
3) A label image A is initialized. This label image is used for indicating the core point.
4) The value of the difference in integrated pixel intensity of each region is assigned to the corresponding pixels in A.
The regions RI and RII were determined empirically to capture the maximum curvature in concave ridges (See
Figure 6). RI is sandwiched within RII for our experiment; the radius of the region was taken to be 5 pixels.
5) The maximum value in A is found. Its corresponding point is the core point. The smoothed orientation field and
the sine components need not be recomputed. For our experiment, we used a 50 x100 window see figure 7.
Figure 6 Regions used for integrating the pixel intensities of for finding .
Figure 7 Results obtained by the proposed algorithm (a) coarse core point (marked by 'x') and the 50 x 100 search
window for the next step and (b) the fine core point (marked by '0') obtained by the Geometry of Region technique
applied over the search window
5. Artificial Neural Network for Fingerprint Recognition
After extract the feature vectors of fingerprint will be input to ANN to recognize fingerprints. Therefore, in the
filtered images, a predetermined region of interest around the core point is tessellated into cells, as shown in Figure
8.
Figure 8 Core point ( ) the region of interest, and window superimposed on a fingerprint

Computer Engineering and Intelligent Systems www.iiste.org ISSN 2222-1719 (Paper) ISSN 2222-2863 (Online)
Vol 3, No.10, 2012
71
In previous work [10], we got the results from which to recognize the fingerprints images of over 40% out of the
original image size. So we can take the window size 40% of the original image so that core point is centered of this
window, and extraction the features derived from the local ridge-line orientations and frequencies, this method
descried in [11].ANN is the calculation model that is inspired by working principles of biological neural systems. It
works as the principle of decision by learning. Multilayer ANN model is a kind of feed forward ANN which has
input layer, hidden layer and output layer. Each layer is fully connected to the succeeding layer, as shown in Figure 9,
the input layer neurons distribute the input signals to the hidden layer and the hidden layer neurons use the output of
input layer as input. All input signals are added by multiplying by the weights of connecting neurons. The output
value of neuron is calculated by passing the sum of these neurons through the transfer function. This process is
repeated for all the neurons in this layer. The output layer neurons behave as hidden layer neurons and the output
values of the network are calculated. The reason of using this kind of network is that lots of learning algorithm can
be used in training of multilayer ANN such as Back propagation algorithm. The conjugate gradient algorithm is an
improved method of multilayer perception training. It has better performance than Back propagation algorithm can
be used for all the process as for this algorithm. It is suitable for the network which has huge number of output nodes
and weights. In this work back propagation, batch back propagation; conjugate gradient training algorithms are used
for training of multilayered ANN.
Figure 9 A scheme of feed forward back-propagation network
A feature vector is composed of an ordered enumeration of the features extracted from the (local) information
contained in each sub image (window) specified by the tessellation. Thus, the feature elements capture the local
information and the ordered enumeration of the tessellation captures the invariant global relationships among the
local patterns. The local discriminatory information in each sector needs to be decomposed into separate components.
Gabor filter banks are a well-known technique to capture useful information in specific band pass channels. In the
matching process, we used feature vectors as an input of ANN.
6. Experiments
The proposed method has been evaluated on the public fingerprint databases of FVC2002 [12]. It is comprised of
800 fingerprints from 100 different fingers with 8 images captured from each finger using a low-cost capacitive
sensor that produces many poor quality images. Since the location of the singular points is unknown. The
experimental results were 93.2 % locating the core points with spurious and 6.8 % miss locating the core points.
We applied the proposed algorithm on two Experiments of fingerprint complete image size and incomplete (partial)
images and the results are described below. Experimental 1: Fig. 10(a) shows a set of complete fingerprints images.

Computer Engineering and Intelligent Systems www.iiste.org ISSN 2222-1719 (Paper) ISSN 2222-2863 (Online)
Vol 3, No.10, 2012
72
The enhancement image of this image is shown in Fig. 6b. The proposed algorithm is applied on image Fig. 10(b) to
get Fig. 10(c) which shows the extracted features superimposed on the original image and core pints assign with
below circle. The performance of a biometric system can be measured by reporting its false accept rate (FAR) and
false reject rate (FRR) at various thresholds [13]. These two error rates are brought together in a receiver operating
characteristic (ROC) curve that plots the FRR against the FAR at different thresholds. Alternately, the genuine accept
rate (GAR), which equals 1-FRR, may be plotted against the (FAR.) The FAR and FRR are computed by generating
all possible genuine and impostor matching scores and then setting a threshold for deciding whether to accept or
reject a match. A genuine matching score is obtained when two feature vectors corresponding to the same individual
are compared, and an impostor matching score is obtained when feature vectors from two different individuals are
compared. The ROC curves depicting the performances of the minutiae, ridge feature map. Figure 11 shows the
average ROC curve of our approach.
Figure 10 set of complete fingerprints images: (a) original image; (b) enhancement and (c) extracted core points and features superimposed on the
original image.
Figure 11 shows the ROC curve of our approach method
Experimental 2. Figure 12 shows an example of a complete image size 100% and Fig. 13 shows a set of an
incomplete fingerprint image of a partial fingerprint that contain the core point in center. The algorithm was applied
to varying image sizes from 100% to 40%. The enhancement and the proposed method applied on images that show
the extracted features superimposed on the original images as shown in Figure 14. In Figures. 15 and 16, we can

Computer Engineering and Intelligent Systems www.iiste.org ISSN 2222-1719 (Paper) ISSN 2222-2863 (Online)
Vol 3, No.10, 2012
73
conclude that as image size decreases the system performance also decrease, but not the size but also the number of
minutiae. The algorithm gives an error 17% for images size 60% of the original size for 100 choices from the
database. These images must contain on at least 60 % of total number of minutiae.
Figure 12 an example of a complete fingerprint image size (i.e. 100%).
Figure 13 Partials images that contain the core point
Figure 14 Extracted features superimposed on the partials original images
Figure 15 illustrate the relation between image size and error rate.

Computer Engineering and Intelligent Systems www.iiste.org ISSN 2222-1719 (Paper) ISSN 2222-2863 (Online)
Vol 3, No.10, 2012
74
Figure 16 illustrate the relation between number of minutiae in image and error rate
Conclusion
This is a robust method for locating the core point of a fingerprint. The global threshold reduces chances of falsely
locating a core point due to presence of discontinuities like scars or wrinkles, which may occur in the existing
processes. Since the detection is based on a global threshold, the method only gives us an approximate location of the
core point. For exact detection of the core point, we use the geometry of region technique over a smaller search
window using ANN. We show that as image size window that contain core point in center decreases the system
performance also decrease but not the size but also the number of minutiae. The algorithm gives a error rate of 17%
for images size 60% of the original size. Our proposed method is developed to get the best match with the original
and demonstrate that the minutiae template of a user may be used to reconstruct fingerprint images.
Reference
[1] M. Abdullah, M. Alkhozae and M. Alsowaiel, "Fingerprint Matching Approach Based on Bifurcation
Minutiae', Journal of Information and Communication Technologies, Vol. 2, , No. 5, pp. 33-40, 2012.
[2] K. KARU and A. K. Jain, "Fingerprint Classification, "Pattern recognition, Vol.29, No. 3, pp. 389-404,
1996.
[3] D. Maltoni, D. Maio, A.K. Jain and S. Prabhakar, Handbook of Fingerprint Recognition, Springer, New
York, 2009
[4] W. M. Koo and A. Kot, "Curvature Based Singular Points Detection," 3rd International Conference on
Audio- and Video-Based Biometric Person Authentication, Lecture Notes in Computer Since (LNCS) 2091,
pp.229- 234, 2001.
[5] A. K. Jain, S. Prabhakar, L. Hong, and S. Pankanti, "Filter bank-Based Fingerprint Matching," IEEE
Transactions On Image Processing, Vol.9, No.5, May 2000.
[6] A. Jalasayvake and S. Choomchuay, "An Algorithm for Fingerprint Core Point Detection", Proc. Of IEEE
International Symposium on Signal Processing and its Applications (ISSPA 2007), 2007
[7] X. Jiang, M. Liu, and A. C. Kot, “Reference point detection for fingerprint recognition,” in 17th
International Conference on Pattern Recognition, 2004.
[8] Jinwei Gu and Jie Zhou, "A Novel Model for Orientation Field of Fingerprints," Proc. of IEEE Coriference

Computer Engineering and Intelligent Systems www.iiste.org ISSN 2222-1719 (Paper) ISSN 2222-2863 (Online)
Vol 3, No.10, 2012
75
on Computer Vision and Pattern Recognition (CVPR2003), vol.2, pp. 493-498, 2003.
[9] Jie Zhou and Jinwei Gu, "A Model-based Method for the Computation of Fingerprints' Orientation Field,"
IEEE Transactions on Image Processing, voU3, no.6, p. 821-835, June 2004.
[10] M.R. Girgis, A.A. Sewisy and R. F. Mansour," A robust method for partial deformed fingerprints
verification using genetic algorithm", Expert Systems with Applications (36), pp.2008–2016, 2009.
[11] Raffaele Cappelli, "Fast and Accurate Fingerprint Indexing Based on Ridge Orientation and Frequency",
IEEE Transaction on System, MAN, and Cybernetics —PART B: Cybernetics, Vol . 41, No. 6, December
2011
[12] Pattern Recognition and Image Processing Laboratory.[cited 2007]; Available from:
http://bias.csr.unibo.it/fvc2002.
[13] Sareni, B., Krahenbuhl, L., & Nicolas, A." Efficient genetic algorithms for solving hard constrained
optimization problems", IEEE Transaction on Magnetics, 36(4), pp.1027–1030. 2000.