A Maxwell's fish eye lens for the terahertz region...A Maxwell’s fish eye lens for the terahertz...
5
A Maxwell's fish eye lens for the terahertz region Jingbo Liu, Rajind Mendis, and Daniel M. Mittleman Citation: Appl. Phys. Lett. 103, 031104 (2013); doi: 10.1063/1.4813820 View online: http://dx.doi.org/10.1063/1.4813820 View Table of Contents: http://apl.aip.org/resource/1/APPLAB/v103/i3 Published by the AIP Publishing LLC. Additional information on Appl. Phys. Lett. Journal Homepage: http://apl.aip.org/ Journal Information: http://apl.aip.org/about/about_the_journal Top downloads: http://apl.aip.org/features/most_downloaded Information for Authors: http://apl.aip.org/authors
Transcript of A Maxwell's fish eye lens for the terahertz region...A Maxwell’s fish eye lens for the terahertz...

A Maxwell's fish eye lens for the terahertz regionJingbo Liu, Rajind Mendis, and Daniel M. Mittleman Citation: Appl. Phys. Lett. 103, 031104 (2013); doi: 10.1063/1.4813820 View online: http://dx.doi.org/10.1063/1.4813820 View Table of Contents: http://apl.aip.org/resource/1/APPLAB/v103/i3 Published by the AIP Publishing LLC. Additional information on Appl. Phys. Lett.Journal Homepage: http://apl.aip.org/ Journal Information: http://apl.aip.org/about/about_the_journal Top downloads: http://apl.aip.org/features/most_downloaded Information for Authors: http://apl.aip.org/authors

A Maxwell’s fish eye lens for the terahertz region
Jingbo Liu, Rajind Mendis, and Daniel M. MittlemanDepartment of Electrical and Computer Engineering, MS-378, Rice University, Houston, Texas 77005, USA
(Received 21 May 2013; accepted 26 June 2013; published online 15 July 2013)
We implement a two-dimensional Maxwell’s fish eye lens using a waveguide-based artificial
dielectric. The Maxwell’s fish eye lens consists of two metallic cylindrical plates sandwiching a
free-space region, with the inner surface of one plate shaped into a hollow conical form. This
lens has the capability to image terahertz beams from a source located at the edge (between the
plates) to the diametrically opposite point on the edge, independent of the incident angle. VC 2013AIP Publishing LLC. [http://dx.doi.org/10.1063/1.4813820]
A gradient index (GRIN) lens is an example of an optical
device whose focusing effect is realized by a spatial variation
of the refractive index of the constituent material.1 The design
and fabrication of devices like GRIN lenses using naturally
occurring dielectric media has been an on-going challenge,
particularly at long wavelengths, since traditional approaches
such as continuously varying doping,2 are not practical. In the
far infrared and beyond, it has been difficult to achieve a con-
tinuously varying index in bulk optical components. Some
fabrication methods have been explored to approximately
emulate the gradient index, such as the onion-shell technique,3
the tapered hole approach,4 and the slice technique.5 These
approaches roughly approximate the gradient index, but each
suffers from various aberrations due to the non-ideal index
variation. The emerging disciplines of metamaterials6–9 and
artificial dielectrics10–12 have opened up several possibilities
to realize devices with spatially varying dielectric parameters.
Here, using artificial dielectrics, we implement a GRIN device
with an ideal, continuously varying index distribution.
The Maxwell’s fish eye (MFE) lens13,14 is one example
of a GRIN device that has recently attracted a great deal of
interest.15–19 The MFE lens is a spherically symmetrical lens
with the refractive index conforming to the equation
nðrÞ ¼ n0
1þ ðr=RÞ2; (1)
where n0 is a constant, R is the radius of the sphere, and r is
the radial distance from the center. Designed on the basis of
geometrical optics, the MFE lens can image light rays emit-
ted from a point source on the spherical surface to the dia-
metrically opposite point on the surface. The unique
focusing and imaging properties of the MFE lens have
recently been exploited to design a dielectric antenna.18
Moreover, it has been suggested, somewhat controversially,
that an ideal MFE constitutes a perfect lens whose resolution
is not limited by the wavelength.15–17,20,21
In the terahertz (THz) range, it is possible to construct a
nearly ideal GRIN device using waveguide-based artificial
dielectrics.10–12 When a parallel-plate waveguide (PPWG) is
excited to operate in the TE1 mode, the free-space region
between the metal plates has an effective index of refraction
given by
n ¼ffiffiffiffiffiffiffiffiffiffiffiffiffiffiffiffiffiffiffiffiffiffiffiffiffiffi1� ðc=2bf Þ2
q; (2)
where b is the plate separation, c is the speed of light in free-
space, and f is the frequency. At a given frequency f greater
than the TE1-mode cutoff frequency fc¼ c/2b, the index of
refraction can have any value in the range between 0 and 1,
by adjusting the plate separation of the PPWG.12 Moreover,
this effective refractive index can be engineered to vary
almost arbitrarily in the two-dimensional (2D) space defined
by the two metal plates, simply by slowly varying the plate
separation b. In this study, we report a 2D version of a MFE
lens implemented using this concept.
In the traditional MFE lens, the index of refraction has a
spherically symmetric radial variation from n¼ 2 in the cen-
ter to n¼ 1 on the surface. In this case, the constant n0 in Eq.
(1) is 2, and since the refractive index on the surface matches
that of free space, waves couple in and out of the lens with-
out any reflections. However, this index-matching is not
essential to the focusing properties of the MFE lens. We con-
duct a 2D ray-tracing simulation to validate this focusing
capability [Fig. 1(a)]. The refractive index inside a circle of
radius 2.5 cm is set according to Eq. (1) with n0¼ 0.9. On
the circumference of the circle, the index of refraction is
0.45. As expected, light rays emitted from a point source on
the circumference of the circle are focused exactly to the dia-
metrically opposite point.
To implement this MFE lens, we fabricate a waveguide
consisting of two circular metal plates in which the plate
spacing varies radially. Combing Eqs. (1) and (2), the plate
separation b can be derived as a function of the distance to
the center (r) as
bðrÞ ¼ k2
1ffiffiffiffiffiffiffiffiffiffiffiffiffiffiffiffiffiffiffiffiffiffiffiffiffiffiffiffiffiffiffiffiffiffiffiffiffi1� n0
1þ ðr=RÞ2� �2
s : (3)
Here, k is the wavelength at the design frequency. For this
demonstration, we choose a design frequency of 0.15 THz
(k¼ 2 mm), and n0¼ 0.9 and R¼ 2.5 cm, as above. The bot-
tom plate has a flat inner surface, while the top plate has a
hollow conical inner surface. The curvature of the top sur-
face is specified in such a way that when the two plates are
held adjacent to each other the plate separation varies
according to Eq. (3) [Fig. 1(b)].
In fabricating the device, the bottom plate is made of
aluminum by conventional machining. To fabricate the top
(non-uniform) plate, we employ a high-resolution 3D
0003-6951/2013/103(3)/031104/4/$30.00 VC 2013 AIP Publishing LLC103, 031104-1
APPLIED PHYSICS LETTERS 103, 031104 (2013)
printing technique,22 which produces an accurate finish with
a resolution of better than 25 lm. The fabrication was carried
out by a commercial vendor using a PolyJet 3D printer. The
plot in Fig. 1(b) shows the measured (via digital image
processing) surface profile of the fabricated waveguide (red
curve), which overlaps very well with the theoretical design
curve (black curve). Then, we coat the curved surface of the
plastic plate with a �20 lm-thick layer of high-conductivity
paint (MG Chemicals 841 Super Shield Nickel Conductive
Coating). The conductivity of the paint is as high as that of
nickel, and the roughness of the painted surface is much less
than the design wavelength. Therefore, the metal-coated sur-
face of the top plate behaves as a smooth bulk metal and can
serve as the upper plate of our waveguide-based MFE lens.
The experimental setup to investigate the imaging prop-
erties of the MFE lens is shown in Fig. 2(b). We use a fiber-
coupled THz time-domain-spectroscopy (TDS) system,
which generates THz pulses consisting of frequencies rang-
ing from about 0.05 THz to almost 2 THz. In order to excite
the TE1 mode in the lens, the polarization of the incident
THz beam is aligned parallel to the flat surface of the bottom
plate. The width of the input beam size was limited at the
source point of the MFE lens using a 2 mm slit-aperture. In
order to map the output beam profile of the lens, we use a
1 mm slit-aperture in contact with the edge of the MFE lens
on the output side, aligned with a set of confocal lenses and
the THz receiver. This optical configuration effectively
images the THz signal at the edge of the lens to the THz re-
ceiver, so the resolution of the measurement is determined
by the aperture size (�1 mm). We scan the aperture together
with the receiver optics along the circumference of the MFE
lens. The scan ranges from about �45� to about þ45� with a
step size of 2�. The 0� reference is located at the diametri-
cally opposite point to the input aperture.
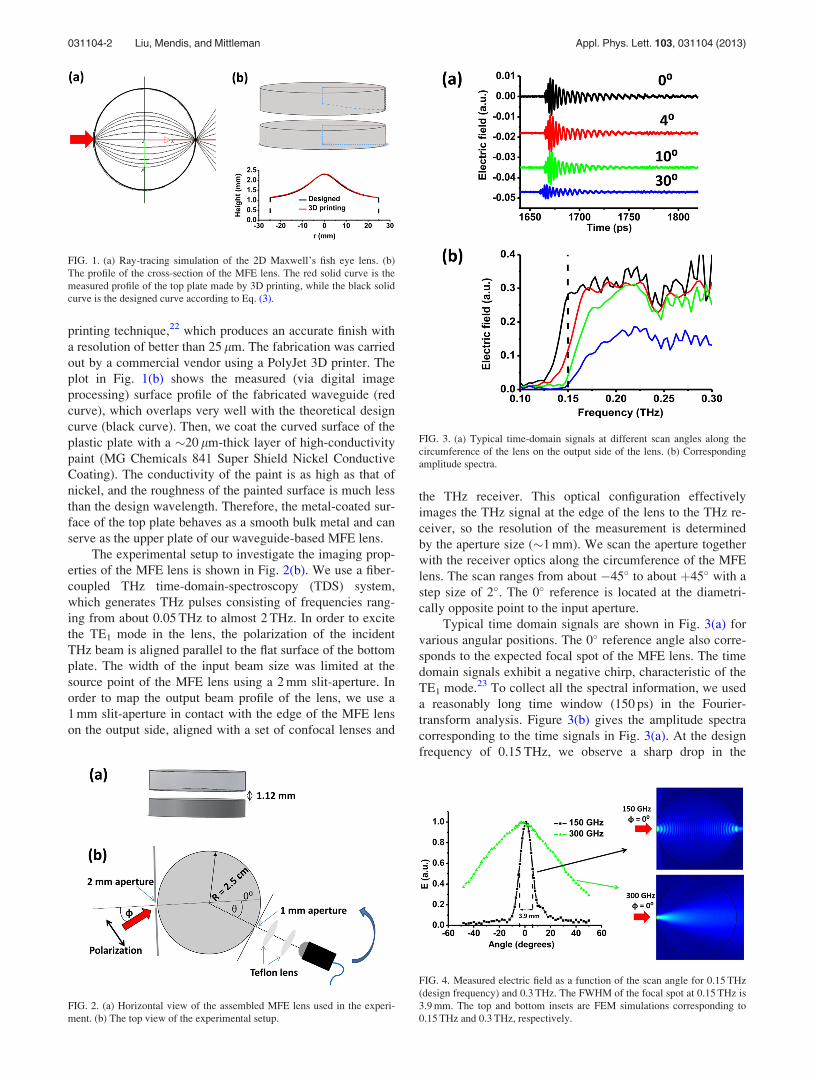
Typical time domain signals are shown in Fig. 3(a) for
various angular positions. The 0� reference angle also corre-
sponds to the expected focal spot of the MFE lens. The time
domain signals exhibit a negative chirp, characteristic of the
TE1 mode.23 To collect all the spectral information, we used
a reasonably long time window (150 ps) in the Fourier-
transform analysis. Figure 3(b) gives the amplitude spectra
corresponding to the time signals in Fig. 3(a). At the design
frequency of 0.15 THz, we observe a sharp drop in the
FIG. 1. (a) Ray-tracing simulation of the 2D Maxwell’s fish eye lens. (b)
The profile of the cross-section of the MFE lens. The red solid curve is the
measured profile of the top plate made by 3D printing, while the black solid
curve is the designed curve according to Eq. (3).
FIG. 2. (a) Horizontal view of the assembled MFE lens used in the experi-
ment. (b) The top view of the experimental setup.
FIG. 4. Measured electric field as a function of the scan angle for 0.15 THz
(design frequency) and 0.3 THz. The FWHM of the focal spot at 0.15 THz is
3.9 mm. The top and bottom insets are FEM simulations corresponding to
0.15 THz and 0.3 THz, respectively.
FIG. 3. (a) Typical time-domain signals at different scan angles along the
circumference of the lens on the output side of the lens. (b) Corresponding
amplitude spectra.
031104-2 Liu, Mendis, and Mittleman Appl. Phys. Lett. 103, 031104 (2013)

amplitude when the receiver scans from 0� to 4�, compared
to the amplitude changes at the other frequencies. The ampli-
tude at 0.15 THz drops to almost zeros when the receiver
scan angle exceeds 10�. This sharp drop of the signal at
0.15 THz is a manifestation of the focusing effect of MFE
lens at its design frequency.
The focusing effect is more prominent in Fig. 4, where
we have extracted the field amplitude at the frequencies of
0.15 THz and 0.3 THz and plotted them as a function of the
scan angle. For comparison, the profile at each frequency is
normalized to the peak value. At the design frequency of
0.15 THz, the MFE shows a good focal spot having a full-
width-at-half-maximum (FWHM) of 3.9 mm (note that an
angle of 1� corresponds to an arc-length of 0.44 mm on the
lens circumference). At the higher frequency of 0.3 THz, the
beam is highly diffracted due to the relatively small input
aperture. These results are consistent with 3D numerical sim-
ulations (shown in the inset of Fig. 4) based on the finite-
element method (FEM).24 We note that in the simulation we
assume that the operating mode of the MFE lens is a pure
TE1 mode, but a pure TE1 mode is very difficult to achieve
experimentally, due to the inherent mode mismatch at the
input to the lens.23 A certain amount of the input energy will
be coupled to the higher-order TE3 mode. This probably
explains the relatively larger size of the measured focal spot
of 3.9 mm, which is almost twice the size of the input
aperture.
We further characterize the MFE by changing the inci-
dent beam angle (U). The MFE lens is predicted to image
light emitted from a point source to the same output point,
regardless of the incident angle.13,14 We varied the incident
angle U of the input THz beam from 0� to 50� and made the
same angular measurement for each incident angle. The
results are shown in Fig. 5. As expected, the focal-spot pro-
files are virtually the same at a frequency of 0.15 THz, for all
the incidence angles, as shown in Fig. 5(a). The FWHM of
the profile is 4 mm for the incident angle of 50�, which is
almost the same as that of 0� incidence. In comparison, the
beams at higher frequencies are less influenced by the MFE
lens. The higher the frequency, the less the MFE lens affects
the wave propagation. Figure 5(b) shows the profiles of the
signals at a frequency of 0.5 THz. We observe that when the
incident angle increases, the profile experiences relatively
the same angular shift. The angular shift at the high fre-
quency and the imaging effect at the design frequency are
confirmed by FEM simulations [Figs. 5(c) and 5(d),
respectively].
In summary, we have implemented a Maxwell’s fish eye
lens with an ideal (non-discretized) index gradient based on a
2D inhomogeneous artificial dielectric medium. This 2D MFE
lens works at a specifically chosen design frequency of
0.15 THz and has the capability to image THz radiation from
a source located at a point on its surface to the diametrically
opposite point, regardless of the incident angle. This device
could have important applications in the design of wide-angle
THz detectors. Therefore, the use of waveguide-based inho-
mogeneous artificial dielectrics as the basis for GRIN optics
offers an effective technology for the realization of THz opti-
cal components with unique and valuable properties.
1E. Hecht, Optics (Addison-Wesley, 2001).2C. Gomez-Reino, M. V. Perez, and C. Bao, Gradient-Index Optics:Fundamentals and Applications (Springer, 2010).
3G. D. M. Peeler and H. P. Coleman, IRE Trans. Antennas Propag. 6, 202
(1958).4K. A. Zimmerman and D. L. Runyon, U.S. patent 5,677,796 (1997).5S. Rondineau, M. Himdi, and J. Sorieux, IEEE Antennas Wireless Propag.
Lett. 2, 163 (2003).6R. A. Shelby, D. R. Smith, S. C. Nemat-Nasser, and S. Schultz, Appl.
Phys. Lett. 78, 489 (2001).7D. R. Smith, J. B. Pendry, and M. C. K. Wiltshire, Science 305, 788
(2004).8V. M. Shalaev, W. Cai, U. K. Chettiar, H.-K. Yuan, A. K. Sarychev, V. P.
Drachev, and A. V. Kildishev, Opt. Lett. 30, 3356 (2005).9J. Valentine, S. Zhang, T. Zentgraf, E. Ulin-Avila, D. A. Genov, G. Bartal,
and X. Zhang, Nature (London) 455, 376 (2008).10R. Mendis and D. M. Mittleman, IEEE Trans. Microwave Theory Tech.
58, 1993 (2010).11R. Mendis, A. Nag, F. Chen, and D. M. Mittleman, Appl. Phys. Lett. 97,
131106 (2010).
FIG. 5. (a) Measured electric field as a
function of scan angle for a frequency
of 0.15 THz and incident angles of 0�,10�, 30�, and 50�. (b) Measured elec-
tric field as a function of scan angle for
a frequency of 0.5 THz and incident
angles of 0�, 10�, 30�, and 50�. (c)
FEM simulation for an incident angle
of 50� and a frequency of 0.15 THz.
(d) FEM simulation for an incident
angle of 50� and a frequency of
0.5 THz.
031104-3 Liu, Mendis, and Mittleman Appl. Phys. Lett. 103, 031104 (2013)

12R. Mendis, J. Liu, and D. M. Mittleman, Appl. Phys. Lett. 101, 111108 (2012).13J. C. Maxwell, Camb. Dublin Math J. 8, 188 (1853).14C. T. Tai, Nature (London) 182, 1600 (1958).15U. Leonhardt, New J. Phys. 11, 093040 (2009).16Y. G. Ma, S. Sahebdivan, C. K. Ong, T. Tyc, and U. Leonhardt, New J.
Phys. 13, 033016 (2011).17U. Leonhardt and T. G. Philbin, Phys. Rev. A 81, 011804 (2010).18B. Fuchs, O. Lafond, S. Rondineau, and M. Himdi, IEEE Trans.
Microwave Theory Tech. 54, 2292 (2006).
19V. N. Smolyaninova, I. I. Smolyaninov, A. V. Kildishev, and V. M.
Shalaev, Opt. Lett. 35, 3396 (2010).20T. Tyc and X. Zhang, Nature (London) 480, 42 (2011).21R. Merlin, J. Opt. 13, 024017 (2011).22Z. Wu, W. Ng, M. E. Gehm, and H. Xin, Opt. Express 19, 3962
(2011).23R. Mendis and D. M. Mittleman, Opt. Express 17, 14839 (2009).24J. Deibel, M. Escarra, N. Berndsen, K. Wang, and D. M. Mittleman, Proc.
IEEE 95, 1624 (2007).
031104-4 Liu, Mendis, and Mittleman Appl. Phys. Lett. 103, 031104 (2013)