A Longitudinal Investigation of the Interactional Process ...
125
A Longitudinal Investigation of the Interactional Process Mechanisms of Leadership Emergence in Dyads Maureen E. McCusker Dissertation submitted to the faculty of The Virginia Polytechnic Institute and State University in partial fulfillment of the requirements for the degree of Doctor of Philosophy In Psychology Roseanne J. Foti, Chair Kevin D. Carlson Neil M. Hauenstein Sarah H. Parker May 10, 2018 Blacksburg, VA Keywords: Leadership; followership; emergence; discourse; longitudinal; interaction process analysis
Transcript of A Longitudinal Investigation of the Interactional Process ...

A Longitudinal Investigation of the Interactional Process Mechanisms of
Leadership Emergence in Dyads
Maureen E. McCusker
Dissertation submitted to the faculty of
The Virginia Polytechnic Institute and State University in partial fulfillment of the requirements
for the degree of
Doctor of Philosophy
In
Psychology
Roseanne J. Foti, Chair
Kevin D. Carlson
Neil M. Hauenstein
Sarah H. Parker
May 10, 2018
Blacksburg, VA
Keywords: Leadership; followership; emergence; discourse; longitudinal; interaction process
analysis

A Longitudinal Investigation of the Interactional Process Mechanisms of
Leadership Emergence in Dyads
Maureen E. McCusker
ABSTRACT
The purpose of the following study was to advance the science of leadership emergence by
taking a process-oriented approach to understand the dyadic micro-level interacts that underlie
the emergence of leader-follower relationship. While most leadership emergence research
focuses mainly on attributes, behaviors, or perceptions of individuals and neglects the multi-
level, temporal and contextual of the emergence leaders, this study focuses on dyads’ attributes,
behaviors and perceptions and considers the teams, over time, and in situ. Individuals worked
together in teams over the course of four weeks to accomplish a task, and their verbal
interactions were recorded and coded. Attributes of dyads and dyadic perceptions of leader-
follower relationship emergence were collected. Results showed dyads that were more similar in
leadership self-efficacy were more likely to engage in symmetrical types of interactions.
Furthermore, the more dyads engaged in such symmetrical exchanges, the more likely they were
to both see each other as leaders, than to both not see each as leaders. Contrary to expectations,
no significant results were found for the effect of dyadic dissimilarity on dyadic interactions, or
for the effect of complementary interactions of leader-follower relationship emergence.
Implications of these findings are discussed.

A Longitudinal Investigation of the Interactional Process Mechanisms of
Leadership Emergence in Dyads
Maureen E. McCusker
GENERAL AUDIENCE ABSTRACT
The purpose of this dissertation was to better understand how and why leaders and followers
emerge in groups based on how they communicate with each other and what characteristics they
possess. Most related research focuses mainly on the characteristics that a single person who
emerges as a leader or follower posses. What makes this study unique is that the focus is not
exclusively on the individual, but rather is on a pair of individuals and not just their
characteristics but also their forms of communication they engage in. In addition, the pair is
studied in a group, over time and in a quasi-naturalistic environment to better include temporal
and contextual factors. Participants worked together in teams over the course of four weeks to
accomplish a task, and they were audio recorded as they worked together. Characteristics of the
pairs were measured, as was whether a leader-follower relationship formed between the pair.
Results showed pairs who were more similar in the their own abilities to lead (leadership self-
efficacy) were more likely to engage in a particular type of communication pattern (symmetry).
Furthermore, pairs who engaged in these types of communication patterns (symmetry) were
more likely to both see each other as leaders, than to both not see each as leaders. Contrary to
expectations, no significant relationships were found between dissimilar pairs and patterns of
communication. Implications of these findings are discussed.

iv
DEDICATION
This dissertation, and all of the effort put into it, is dedicated to my father, Martin
McCusker, who may not have been physically here on Earth, but whose love and support I felt
right beside me every single step of the way. Dad, early in my childhood, you predicted I would
be a doctor. Take this as one of the few instances that I actually admit that you were right.

v
ACKNOWLEDGEMENTS
The past five years as a Ph.D. student at Virginia Tech have been the most intellectually
demanding and challenging, but also the most productive, fulfilling, and rewarding years of my
life. I have gained more personal and professional knowledge, skills, and expertise than I had
ever imagined, produced scientific work and research of which I am very proud (this dissertation
included), and have built lasting relationships and friendships. None of these accomplishments
could I have attained without the support of so many people.
First, I would like to thank my family and lifelong friends. To my loving and strong
Mom, thank you for being my encouraging voice of reason, for always knowing the right things
to say when, and for forever believing in me. Also, thanks for lending me the $30 I needed in my
first year to adopt my foster dog and partner in crime, Scotch. I can think of no better companion
for late nights dissertation analysis and writing. To my brother, Michael, thank you for
contacting me weekly- if not daily- no matter where in the world you were. Your funny movie
quotes, inside jokes, and music were the perfect diversions. To Matt, words cannot explain how
grateful I am for you. From the day I began grad school applications to the day I walked across
the graduation stage, your positivity, love, and encouragement never wavered. Thank you for the
distances you traveled, the late night phone calls, for listening to my countless research ideas,
and for always giving me something to look forward to. To my best friends from high school and
college, I’ve relied on you so much the past 10-20 years. Thanks you for always being there.
Thank you to my Virginia Tech friends for the consistent social support and reminders
that life is too short to avoid too many Thursday night karaokes. To my friend, Bryce Torian,
your humor got me through my first year. You are so missed. My ILT lab mates, I will miss our
invigorating chats of new research ideas and fun critiques of published research. Those insights
were a tremendous help in producing this dissertation. In particular, I must recognize Lauren

vi
Thompson, Elsheba Abraham, and Mahira Sheikh, for the hundreds of hours they put into data
coding for this project. You were absolutely invaluable. I simply cannot thank you enough.
Thank you to my dissertation committee members, who invested their time and energy
toward developing me as scientist. Dr. Sarah Parker, thank you for engaging me in so many
interesting projects, for your contagious passion for leadership and teams, and for prompting me
to always consider the translation of my research to practice. To Dr. Kevin Carlson, thank you
for your methodological insights and advice, careful detail-orientation, and reminders to consider
the utility and contribution of any scientific research. Thank you to Dr. Neil Hauenstein, who
instilled in me a strong research, theory and methods foundation in my first year and every year
thereafter. Neil, you encouraged me to think critically, challenge the norm, use words wisely,
and conduct strong, sound, ethical research. Thank you for opening your door to all the students
in the Department, being the comic relief we often needed, and serving as my second mentor.
Finally, I owe my utmost gratitude to Dr. Roseanne Foti, my advisor, guide, role model,
and friend. Few Ph.D. students can say they had an advisor who was entirely devoted to her
students, who never turned down a student’s research idea, who never told her students what to
think, but rather showed them how to think, and who took the time to provide individualized
mentorship strategies to each one of her students so they could find their own path to success.
Roseanne, thank you for doing it all. Thank you for encouraging me to push the boundaries,
think outside the box, and to pursue the challenging, but impactful, research questions. This
dissertation is the perfect example. Thank you for sharing your knowledge, wisdom, insight, and
support in our 3-hour long weekly meetings that inevitably left me excited and passionate about
the science of leadership. Thank you for the countless personal and professional opportunities
you’ve afforded me, and thank you for setting me up for the success I have achieved. I am
humbled and privileged to have had the opportunity to learn from and work with you.

vii
TABLE OF CONTENTS
Chapter 1 – Introduction ................................................................................................................. 1
Chapter 2 – Review of the Literature .............................................................................................. 4
2.1 – Defining Leadership ........................................................................................................... 4
2.2 – Leadership as a Socio-perceptual and Relational Process .................................................. 5
2.3 – Leadership Process from a Discourse-based Lens ............................................................. 9
2.4 – Hypothesis Development .................................................................................................. 13
2.4.1 – Dynamics of the process. ........................................................................................... 13
2.4.2 – Outcome of the process. ............................................................................................. 16
2.4.3 – Antecedents of the process. ........................................................................................ 18
Chapter 3 – Method ...................................................................................................................... 29
3.1. – Data Source...................................................................................................................... 29
3.2 – Participants ....................................................................................................................... 29
3.3 – Procedure .......................................................................................................................... 30
3.4 – Measures ........................................................................................................................... 31
3.4.1 – Antecedent measures. ................................................................................................. 31
3.4.2 – Process measure. ........................................................................................................ 34
3.4.3 – Outcome measure. ...................................................................................................... 39
3.4.4 – Control measure. ........................................................................................................ 40
Chapter 4 – Results ....................................................................................................................... 41
4.1 – Descriptive Statistics, Correlations, and Reliability ......................................................... 41
4.2 – Hypothesis Tests ............................................................................................................... 44
Chapter 5 – Discussion ................................................................................................................. 52
5.1 – Summary of Findings and Contributions .......................................................................... 52

viii
5.2 – Limitations, Strengths, and Future Research .................................................................... 57
5.3 – Conclusion ........................................................................................................................ 60
References ..................................................................................................................................... 61
Appendices.....................................................................................................................................76
Tables.............................................................................................................................................97
Figures..........................................................................................................................................109
ix
LIST OF TABLES
Table 1 – Results of K-mean Cluster Analysis for ILT and IFT of Entire Sample ...................... 97
Table 2 – Results of K-mean Cluster Analysis for ILT and IFT of Study Sample Only.............. 98
Table 3 – Categories of Outcome Variable of Leader-follower Relationship .............................. 99
Table 4 – Means, Standard Deviations, Intercorrelations and Reliability Coefficients for
Individual Level Variables .......................................................................................... 100
Table 5 – Means, Standard Deviations, and Intercorrelations for Dyadic Level Continuous
Variables ..................................................................................................................... 101
Table 6 – Means of Dyadic Dissimilarity of Dominance and LSE and Percent of Complementary
and Percent of Symmetrical Interacts by ILT-IFT Congruence Categories ............... 102
Table 7 – Means of Dyadic Dissimilarity of Dominance and LSE and Percent of Complementary
and Percent of Symmetrical Interacts by Leader-follower Relationship Categories .. 103
Table 8 – Results of Regression Analysis Testing Reliability of Dyadic Attribute Difference
Scores .......................................................................................................................... 104
Table 9 – Results of Hierarchical Linear Regression of Change in Relational Control Moves over
Time ............................................................................................................................ 105
Table 10 – Results of Multiple Multinomial Logistic Regression of the Effect of Dyadic Interacts
on Leader-Follower Relationship Emergence ........................................................... 106
Table 11 – Results of Hierarchical Linear Regression of Dyadic Complementary Interacts on
LSE Dissimilarity, Dominance Dissimilarity, and ILT-IFT Congruence................. 107
Table 12 – Results of Hierarchical Linear Regression of Dyadic Symmetrical Interacts on LSE
Dissimilarity, Dominance Dissimilarity, and ILT-IFT Congruence ......................... 108

x
LIST OF FIGURES
Figure 1 – Depiction of conceptual model and study Hypotheses 1 and 3. ................................ 109
Figure 2 – Depiction of conceptual model and study Hypotheses 2; 4-6. .................................. 110
Figure 3 – Image of coding platform of Mangold Interact program (Mangold, 2010). ............. 111
Figure 3 – Longitudinal trajectory of percent of relational control moves sent from individuals to
dyadic partners ........................................................................................................... 112
1
Chapter 1 – Introduction
The importance of informal leadership in today’s workplace is perhaps more pronounced
than ever before. As organizations shift toward team-based structures, decentralized formal
leadership, and fluctuating demands, there is a much greater need for individuals and collectives
to assume informal leadership positions. That is, individuals in teams will need to fluidly and
dynamically “step up to the plate” to reach collective goals and will often have to do so
autonomously or semi-autonomously. Thus, there is growing need to understand the process by
which individuals in teams come to assume informal leadership positions.
Yet, according to two prevalent leadership scholars, “a fundamental question that
remains to be answered is how leadership and leader-follower relationships develop” (DeRue &
Ashford, 2010, p. 627). The authors of this quote suggest that even after almost a century of
research on leadership, there exists very little insight on the “how” of leadership emergence, or,
in other words, the process by which leadership relations come into existence. This is because
the vast majority of leadership research has been “leader-centric” (Uhl-Bien, Riggio, Lowe, &
Carsten, 2013), a-contextual (Oc, 2018), and cross-sectional in design (Day, 2014). But in
reality, the emergence of leadership is a socially constructed process, emerging from the
dynamic interactions of all group members within a given social context over time (Avolio,
Walumbwa, & Weber, 2009; Hollander & Julian, 1969).
Fortunately, in recent years, the leadership field has generally come to define leadership
as a socio-perceptual and relational process (See McCusker, Foti, & Abraham, 2018 for a review
of process-oriented definitions of leadership), that is co-constructed through the interactions of
all actors in a group (Emery, 2012) and where patterns of leadership emerge from interactions
and cognitions among all actors in a group (Hannah & Avolio, 2011). Leadership Identity
2
Construction Theory (DeRue & Ashford, 2010) characterizes these interactions as a series of
behavioral “claims” and “grants” of leadership enacted among dyads in the group. Through a
reciprocal, dynamic process of claiming and granting leadership, group members form individual
and relational identities as leaders and followers, which, over time, become recognized by the
group and result in the in emergent leadership (DeRue, 2011). Thus, emergent leadership is the
outcome of the leadership emergence process. By examining patterns of behavior among dyads
in action, this study focuses on the interactional dynamics of the process of leadership
emergence, and how they produce the emergent outcome of emergent leader-follower
relationships.
Despite the conceptualization of leadership emergence as the socio-perceptual and
relational process, few leadership studies actually study the process of leadership; rather they
study the outcome of the process (Hunter, Bedell-Avers, & Mumford, 2007). The methods used
for leadership research continue to lack the process-orientation needed to study the dynamic,
interactional processes of leadership emergence (Fairhurst & Uhl-Bien, 2012). Process-oriented
models aim to understand the “how” and “why” of phenomena (Dublin, 1976) and the methods
used to test such models must include both data collection techniques that effectively capture the
dynamics of the process mechanisms as well as analysis techniques that uncover and test
dynamic patterns of the mechanisms (Grand, Braun, Kuljanin, Kozlowski, & Chao, 2016).
In this study, I explicitly differentiate the process of leadership emergence from the
outcome of emergent leadership. I take an organizational discourse based approach (Fairhurst &
Connaughton, 2014; Fairhurst & Uhl-Bien, 2012) to conceptualize the leadership process and use
process-oriented methods of behavioral observation coding and sequence-based dyadic data
analysis to test my hypotheses. The purpose of this study is thus to uncover the interpersonal and

3
interactional mechanisms (process) through which informal leader-follower relationships arise
(outcome). In addition, I aim to understand how cognitive and personality characteristics of a
dyad (inputs) impact the interactional process mechanisms.
This study advances the science of leadership emergence in four ways. First, by
operationalizing leadership as a sequence of dyadic verbal exchanges between individuals
unfolding over time, I align the conceptual and operational definitions of leadership. Second, by
examining dyadic antecedents of leadership emergence, I shift the focus from personological
(Carter, DeChurch, Braun, & Contractor, 2015) predictors of leadership to relational ones,
heeding calls for more dyadic level research. Third, by purposefully measuring the leadership
process in action, I model the process in context and over time. Finally, I demonstrate the utility
of combining historically traditional data collection methods (e.g., behavioral observation; Bales,
1951) with newer pattern and sequencing techniques (e.g., sequential analyses) to better
understand the “how” and “why” of leadership emergence.

4
Chapter 2 – Review of the Literature
2.1 – Defining Leadership
In 1974, Stogdill claimed, “there are almost as many different definitions of leadership as
there are people who have attempted to define the concept” (p. 7). Stodgill’s point is that the
term “leadership” carries many different meanings depending on the person, the field of
research, and the perspective from which it is approached. While it is generally accepted that
leadership involves influencing others in some capacity (Fischer, Dietz, & Antonakis, 2017;
Yukl, 1989), this conceptualization is open to broad interpretation (Alvesson & Spicer, 2014).
The difficulty in defining leadership arises in part because leadership is a complex concept, laden
with myriad contextually bound dimensions and facets.
Perhaps the clearest conceptual differentiation within leadership is whether leadership is
formal or informal. Formal leadership stems from an official position or role, such as a manager,
supervisor, or political head. Informal leadership stems from an entity outside an officially
designated position (Balkundi & Kilduff, 2006; Morgeson, DeRue, & Karam, 2009). While I
acknowledge formal and informal leadership are often not independent, this study will focus
exclusively on informal leadership. For the purposes of succinctness, from here on my use of the
term “leadership” refers to leadership in this informal sense.
The second distinction, which is related the first, is the study of leaders versus the study
of leadership. The leadership development literature differentiates leaders from leadership, such
that leader development focuses on developing a person who influences, and leadership
development focuses on developing the process of influence (Day, 2000). Similarly, this
proposed study does not aim to understand what it is about a particular person who emerges as
influential, but rather to understand the influence emergence process. Thus, this is a study of

5
leadership emergence.
The final distinction is between leadership emergence and leadership effectiveness
(Judge, Colbert & Ilies, 2004), and both can be studied in the context of informal leadership (Foti
& Hauenstein, 2007). The former, emergence, focuses on who comes to have influence in
groups, while the latter, effectiveness, focuses on the successfulness or productivity in
influencing others. This study centers on understanding the former, emergence, and in particular,
the relational process of leadership emergence.
2.2 – Leadership as a Socio-perceptual and Relational Process
Defining leadership emergence as a socio-perceptual and relational process is perhaps
best done by first discussing the concept of emergence. The study of emergence and emergence
theory in the organizational sciences is rooted in multilevel theory (Kozlowski & Klein, 2000)
and is defined as a process by which higher level, collective phenomena arise from interactions
of lower level elements over time (Cronin, Weingart, & Todorova, 2011; Kozlowski & Klein,
2000). What sets emergent constructs apart from other group-level constructs (i.e.,
contextual/global and cumulative) is that emergent constructs only come into existence because
of the interactions among the lower level units. Thus, for a construct to be considered emergent,
it must arise from lower level units that interact in a dynamic way over time. In this way, an
emergent construct (i.e., an emergent leader-follower relationship) is differentiated from the
process of emergence- or leadership emergence. The former is a result or a product of the latter
(Grand et al., 2016).
Often associated with emergence theory is the Input-Process-Output framework (IPO;
McGrath, 1964), which is an oversimplified heuristic often used in team research to
conceptualize team processes. While the IPO model has since been updated with more complex

6
relationships including moderating variables and feedback loops (Matthieu Maynard, Rapp, &
Gilson, 2008), its generality and flexibility helps to map an emergence process at a high level, by
categorizing variables as antecedents (inputs) which drive processes and result in measureable
effects (outcomes). One way this can be applied to leadership is by defining the output (i.e., what
has emerged) as emergent or effective leader-follower relationships; antecedents as the lower
level units that produce the emerged phenomenon (i.e., ingredients of the emergence process),
and the process is the sequence of mechanisms and interactions underlying what has emerged.
Leadership scholars have done a very good job modeling the inputs and the outcomes of
leadership emergence, but modeling and testing the process component is starkly
underrepresented in the empirical literature (Kozlowski, Mak, & Chao, 2016; van Kippenberg &
Sitkin, 2013).
The emergence process of leadership in its entirety is made up of multiple simultaneously
occurring sub-processes (Fischer et al., 2016). These sub-processes can thus be as micro as a
within-individual cognitive categorization process, or as macro as the collective and team
influence processes in multi-team systems. Thus, studying the leadership process in its entirety is
a practically insurmountable feat, but studying a sub-process of leadership emergence is
attainable and parsimonious. An exemplary study modeling a sub-process of emergence is one
by Grand et al. (2016), who modeled the emergence of team knowledge in groups. The authors
argue that in order to develop and test process-oriented theories about how or why phenomena
emerge, researchers must first identify the individual level “core concepts” involved in the
process, as well as the manner, or “mechanisms,” in which they combine to produce an emergent
phenomenon.
Following Grand et al.’s model and past researchers citing the IPO heuristic (Fischer et
7
al., 2016; Kozlowski et al, 2016), in this study I treat the process of leadership as a mediating
mechanism that explains how and why antecedents of leadership emergence produce leader-
follower relationships. It has been argued that there are four critical elements involved in any
leadership processes: context, time, levels and interpersonal interaction (McCusker et al., 2018).
These must be considered to adequately study a process. That is, leadership process mechanisms
are inherently married to and constrained by the social and environmental context in which they
unfold (Carter et al., 2015). Second, since it takes time for antecedent to affect outcomes,
leadership processes are naturally time consuming (Shamir, 2011). Third, and specifically
regarding emergence processes, lower levels elements (i.e., individuals) must combine in some
way to produce emergent outcomes (i.e., dyadic relationships). Finally, if leadership involves
influencing others (Yukl, 1989), or at the very least perceptions of influence (Lord, Foti, & De
Vader, 1984), then this influence process must involve individuals dynamically interacting
together in a social situation. Thus, leadership as a process (in the sense of the IPO model)
involves the dynamic interpersonal interaction of individuals in a collective, in a particular
situation over time. This latter notion of interpersonal interaction coincides well with the
conceptualization of leadership emergence as a socio-perceptual and relational process.
The concept of leadership as socio-perceptual and relational is best characterized by
relational approaches to leadership. These views treat leadership not as a single person, a
characteristic, a set of characteristics, behaviors, or structure, but as a co-constructed, ongoing
mutual influence process among dyads (Hollander & Julian; 1989; Uhl-Bien Riggio, Lowe, &
Carsten, 2013). In that way, it moves beyond leader or follower-centric approaches to leadership,
focusing rather on the perceptions, relationships and connections among actors in the leadership
process. Rooted in the idea that leadership only comes into existence because one or more

8
individuals perceive one or more others as leaderlike (Hogan, Curphy, & Hogan, 1994; Lord &
Maher, 1991), relational approaches to leadership emphasize the contribution of both dyad
members in leadership processes. Methodologically, these approaches aim to understand
leadership phenomena by gathering information about leadership relationships from both
members of the dyad (i.e., leader and follower; manager and subordinate; perceiver and target;
Gooty, Serban, Thomas, Gavin, & Yammarino, 2012). For example, relational approaches to
leadership emergence examine how attributes (e.g., Kalish, 2014; Emery, 2012), cognitions
(Wilgus, 2017), or behaviors (Marchiondo, Myers, & Kopelman, 2015) of both dyad members
contribute to the emergence of leadership. Relational approaches to studying leadership
emergence thus shift the focus from leaders and followers as entities to the fine-grained,
unfolding micro-interactions of dyads (Fairhurst & Uhl-Bien, 2012). The structure of leadership
takes its form in the patterns of interactions and moment-to-moment contingencies of
interpersonal interactions.
An extension of Relational Leadership Theory is Leadership Identity Construction
Theory (DeRue & Ashford, 2010), which articulates the socially constructed development of
leader-follower relationships through reciprocal intra- and inter-personal processes. Central to
this theory, and aligned with social identity theory (van Knippenberg & Hogg, 2003), is the
notion that individuals hold and develop both individual and relational (dyadic) identities as
leaders and followers in a given context, and these identities are manifested through
interpersonal interactions. DeRue and Ashford conceptualize the interactions as “claims” or
“grants” of leadership and followership. Claims are the verbal and nonverbal actions taken to
affirm one’s own leader or follower identity on another person, whereas grants are the actions
taken to bestow one’s leader or follower identity on somebody else. Claiming and granting acts
9
occur as both initiations or as replies to other claims/grants. When claims of leadership are
followed by grants of leadership (and vice-versa), the claimer’s leaders’ and followers’ identities
(and in turn behaviors) in relation to one another are reinforced. This idea supports early work by
Stogdill (1959), who posited that people informally assume leadership positions when they
initiate actions and those actions are reinforced over time by other members’ acquiescence. Over
time, through successive and iterative claims and grants, relatively stable patterns of interaction
emerge alongside dyadic and group recognition of respective leader-follower relationships
(DeRue, 2011). In short, leadership identity construction theory describes that leader-follower
relationships are “constituted in relation to others” (Sparrowe, 2005, p. 421), from feedback and
reinforcement in social interactional processes at the dyad level.
Leadership Identity Construction Theory maps on well to the input-process-outcome
heuristic of leadership as a relational process because the outcome of the process is the leader-
follower relationship, and antecedents of the process refer to individual, dyadic or contextual
variables, such as individual attributes (Marchiondo et al., 2015), Implicit Leadership and
Followership Theories (DeRue, 2011), and social context (Wellman, 2013). Despite this
alignment, its prevalence, and its testability, formal empirical tests of leadership identity
construction theory are almost absent from published research. One explanation might be the
overreliance on static, self-reported, survey methods of leadership. In the next section, I discuss
one alternative method that may help to unpack the “black box” of the leadership emergence
process.
2.3 – Leadership Process from a Discourse-based Lens
The challenge in conducting process-oriented leadership research is not in the
conceptualization and theorizing of leadership; it is in translating the relational process concepts

10
(e.g., claiming and granting; initiating and acquiescing) into observable, measurable and testable
units. The most clearly observable units are behaviors. Behavioral approaches to leadership have
long aimed to uncover individual behaviors associated with emergent and effective leadership
(e.g., Bass, 1949; Fleishman, 1953). However, in these approaches, the behaviors reside at the
individual level as opposed to the relational one. Needed are methods that examine behaviors of
individuals in relation to one another, in context and over time. A viable solution is studying
interpersonal communication.
The importance of communication for leadership is not a new idea. Tannenbaum,
Weschler and Massarik (1961) defined leadership as “interpersonal influence, exercised in a
situation, and directed, through the communication process, toward the attainment of a
specified goal or goals (p. 24)” and Donelly, Ivancevich, and Gibson (1985) claimed,
“Leadership is an attempt at influencing the activities of followers through the communication
process and toward the attainment of some goal or goals” (p. 362). These approaches treat
communication as the means through which leadership is enacted to accomplish group goals, but
more recent conceptualizations view leadership more generally as communication itself. For
example, Connaughton, Shuffler, and Goodwin (2011), defined discourse as “the constituting
factor of leadership itself” (p. 501). Recent years have witnessed a rise in empirical research that
bridges the domains of communication and organizational research. Organizational discourse
analysis (ODA; Fairhurst & Uhl-Bien, 2012) is a family of techniques that each rely on various
forms of interpersonal communication to better understand, describe, or define organizational
phenomena (Alvesson & Kärreman, 2000).
ODA is comprehensive in scope, spanning multiple disciplines (e.g., psychology,
sociology, political science, management; Fairhurst & Connaughton, 2014), paradigms (e.g.,
11
constructionist, post-positivist, critical, postmodern; Fairhurst, 2007) and methodologies (highly
qualitative to highly quantitative, Fairhurst, 2007). Specifically with regard to leadership, ODA
has been used to study conflict in leaderless groups (Lehmann-Willenbrock & Chiu, 2017),
transformational leadership and problem solving (Lehman-Willenbrock et al., 2015), employee
voice (Weiss, Kolbe, Grote, Spahn, Grande, 2017); LMX (Fairhurst, 1993), the impact of
leadership context (Courtright, Fairhurst, & Rogers, 1989), and leader identity (Alvessor &
Spicer, 2011), just to name a few.
Most commonly, these research studies use a form of ODA called interaction analysis, or
interaction process analysis (IPA). Whereas critical and post-modern approaches to ODA focus
is on understanding Discourse (big D) as a social system of thought that contextualizes and gives
meaning to talk (Foucault, 1980), IPA focuses on talk-in-action, or language-in-use. It has its
roots in early small group research studies that measured behavioral interactions of group
members over time to understand group processes. The first use of the term interaction analysis
dates to early work by Bales (1951), who used IPA to model behavioral interactions in groups.
Interaction analysis typically uses a priori coding schemes to classify utterances as they unfold
over time. The result is a large set of behavioral codes representing individuals’ meaningful
utterances directed at other individuals. The set of codes are then analyzed to uncover sequential
patterns or configurations of communication that themselves carry meaning or importance for the
construct of interest.
Central to interaction analysis is the “interact” (Weick, 1979). The interact is a reciprocal
verbal or nonverbal transmission of information from one person to another, that is, a
communication from A to B and from B back to A. In this way, interaction analysis represents a
relational process-oriented approach of leadership, moving beyond a static relationship to the

12
pattern of relations among dyads (Fairhurst & Uhl-Bien, 2012). Applied to leadership, interacts
can be seen as dyadic, influential organizing sequences that are neither leader-centric, nor
follower-centric (Fairhurst & Connaughton, 2014) because they focus not on how one person
acts toward another but how one person acts and also how the other responds. Moreover, at the
heart of relational perspectives is this process of interaction, dialogue, and communication
(Dachler & Hosking, 1995). In sum, interaction analysis is well suited to study leadership
processes for three primary reasons: 1) it is aligned with relational approaches; 2) it captures
leadership “in the wild” as it is enacted in the social and environmental context (Fairhurst & Uhl-
Bien, 2012) from which leadership cannot be separated (Carter et al., 2015); and 3) it is
necessarily temporal in nature (Connaughton, et al., 2011). Not only is interaction analysis
capable of capturing the moment-to-moment relational dialogue that underlies leadership
relationships, but it allows for an understanding of how the dyadic interacts change or combine
over time to form meaningful sequences that symbolize the leadership emergence process and
result in emergent relationships (Murase, Poole, Asencio, & McDonald, 2017; Shamir, 2011).
Relational Control
Having shown the fit of interaction analysis for leadership research, I next turn to
explaining more concretely how interaction analysis can be used to study leadership processes.
One type of interaction analysis, called relational control analysis (“relational control”) aims to
understand how people use language to exert control and influence on others (Rogers &
Escudero, 2004). Every speech act can be characterized as a control move intended to either
exert control (one-up; ), acquiesce control (one-down; ), or neutralize (one-across; )
control toward another person (Fairhurst, Green, & Courtright, 1995). A pair of contiguous
control moves represents an interact, and together the pair represent a discernible relational

13
interaction pattern. A complementary interact is defined as a one-up move, followed by a one-
down move, or vice versa (e.g., ; ). A competitive symmetrical interact is defined as a
pair of sequential one-up moves (). A submissive symmetrical interact is a pair of sequential
one-down moves (). A neutralized interact is a pair of one-across moves (). Finally, a
transitory interact is a one-up or one-down, followed by a lateral move (; ; Fairhurst et
al., 1995).
Dyadic patterns of relational control correspond well to theories of leadership interaction,
such as those put forth by Stodgill (1959) and DeRue and Ashford (2010) because the patterns of
assertion and acquiescence of control mirror the initiations and acquiesces of actions and claims
and grants of leadership. Fairhurst et al. (1995) previously conceptualized relational control
interacts in terms of leadership, but their aim was on understanding relationships between formal
leaders and their subordinates, as opposed to the emergence of informal leadership. It should be
noted, however that leadership is not synonymous with control (Stein et al., 1979). So in this
study, I do not operationalize relational control interacts as leadership itself, rather, I
conceptualize them more generally as verbal control moves, the patterns of which are
manifestations of the emergence process underlying emergent leader follower relationships.
2.4 – Hypothesis Development
2.4.1 – Dynamics of the process. Inherent in any process is the role of time (Langley,
Smallman, Tsoukas, & Van de Ven, 2013), and the leadership process is certainly no exception
(Shamir, 2011). Alongside the call for the need for process-oriented leadership research are
myriad calls for leadership researchers to better incorporate temporal dynamics (Day, 2014;
Fischer et al., 2017, Leenders, Contractor, & DeChurch, 2017; Shamir, 2011). While studying
interact patterns partially addresses this issue because it focuses on the fine-grained moment-to-

14
moment dynamics of consecutive behaviors, most sequential analysis collapse across time (e.g.,
Lehamnn-Willenbrock et al., 2015). This approach provides little insight into the development
and dynamic nature of the relational process, or how it changes and unfolds across time.
Kozlowski and Ilgen (2006) demonstrate the dynamic nature of team interactions, stating
“that the repeated interactions among individuals that constitute processes tend to regularize,
such that shared structures and emergent states crystallize and then serve to guide subsequent
process interactions” (p. 81). Recall from Leadership Identity Construction Theory that the
formation of leadership identities are iterative processes, manifested in successive claims and
grants, which serve to either reinforce or challenge one particular leader/follower identity
(DeRue & Ashford, 2010). For example, if person A claims (grant) of leadership on Person B,
and person B fails to grant (claim) leadership back to person A, person A will likely re-evaluate
his/her identity relative to Person B and subsequently adjust his/her behaviors.
As time progresses, the enactment-feedback-reenactment process of dyads’ interaction
iteratively adjusts how each dyad member behaves until the interactions stabilize into a relatively
consistent pattern. This is supported by Stein et al.’s (1979) valence model of leadership. Their
model posits that all individuals in a working team have “valences” for others’ perceptions of
them as leaders. When a team member initiates controlling behaviors, and when such behaviors
are responded to with agreement or conformity, the initiator’s leadership valence increases,
creating a positive spiral of leadership (DeRue & Wellman, 2009). The more valence people
accrue, the more they are perceived as able to lead and the more the “dominance-submission”
relationship becomes established among dyads (p. 134). When initiations of control are
consistently responded to with subsequent assertions of control, conflict may exist or emerge
between the dyad. However, Stein et al.’s empirical study of group interaction over time showed

15
that such conflict is not sustainable and dissolves. They found such interactions “crystalize” into
“dominance-submission” norms and perceptions.
Dominance-submission behaviors can be conceptualized as complementary behaviors,
and if dyadic interactions are theorized to stabilize toward them, then it could be argued that
dyadic interactions are likely to stabilize toward complementarity. That is, over time, dyads will
engage in more complementary interacts. Sociological research rooted in interpersonal
circumplex framework (IPC; Horowitz, 2004; Kiesler, 1983) suggests people prefer engaging in
complementary behaviors and will gravitate towards doing so. The IPC framework claims social
interactions can be characterized by 1) their degree of friendliness and 2) their degree of
dominance. People are apt to engage in similar behaviors along the friendliness dimension
(friendly behaviors invite friendly behaviors) and complementary behaviors along the dominance
dimension (dominant behaviors invite submissive behaviors, and vice versa). One test of this
framework is an experiment by Tiedens and Jimenez (2003) who presented participants with
particular behavioral scenarios and asked them to judge how they believed they were supposed to
and would behave in response to either dominant or submissive behaviors. Results showed a
significant preference for subsequent complementary behaviors. Similar findings have been
reported in studies measuring actual behavioral interactions, both verbal (Dryer & Horowitz,
1997; Tracey, 2004) and nonverbal (Tiedens & Fragale, 2003), and the authors suggest these
behaviors reflect cognitive schemas that behavioral interactions should be complementary
(Tiedens et al., 2007).
If dyadic interactions systematically stabilize over time, and people prefer
complementary interactions, then dyads’ behavior should stabilize toward complementarity, thus
increasing the frequency of complementary interactions. According, I predict:

16
H1: The frequency of complementary interacts will increase over time.
2.3.2 – Outcome of the process. Van Knippenburg and Sitkin (2013) claimed that one
“fatal flaw” of leadership research is that the concept of leadership is confounded with its effects,
or outcomes, such as effectiveness, satisfaction, or performance (Alvesson & Spicer, 2014;
DeRue, 2011). In taking a process-oriented view of leadership, the outcome in this study is the
result of the emergence process, or what has emerged (Grand et al., 2016): the mutual
recognition of a leader-follower relationship.
Past research has examined emergent leadership relationships as outcomes, especially in
the social network approaches to leadership (Carter et al., 2015; “Area 2: Leadership as
Networks”). However, the majority of this research has three fundamental limitations. First, with
the exception of a few studies (e.g., Holland, 2016), “relationships” are conceptualized as a
perception from a single dyadic member. Instead, leadership relationships should be mutually
recognized by both partners in order to be considered a true dyadic relationship (Duncan, Kanki,
Mokros, & Fiske, 1984; Krasikova & Lebreton, 2012). Second, also with the exception of a
select few (e.g., Emery, 2012; Kalish, 2014) antecedents of the relationships are individual
characteristics (Anderson et al., 2008) or collective attributes (Zhu et al., 2011) as opposed to
dyadic ones. Finally, the intermediately process by which antecedents impact relationship
formation is not specified (van Knippenburg & Sitkin, 2013).
In this study, the process of dyadic interaction (as defined by interact patterns) is
considered the antecedent to the emergent leader-follower relationships.1 Morgeson and Hofman
(1999) view interpersonal interactions as “the basic building block upon which all larger
1 It should be noted here that I understand the complexity of leadership the leadership emergence process involves
the concurrent interaction of multiple simultaneous processes. Thus patterns of interpersonal interactions are not
intended to represent the complete process of leadership emergence, but rather, gain insight on one of the micro-
level processes involved.

17
collective structures are composed” (p. 252). Morgeson and Hofmann also theorize that actions
and reactions among individuals in a collective form a pattern of interaction from which a social
collective structure emerges. Moreover, empirical research suggests people have negative
feelings toward symmetrical interactions. For example, when dominance is responded to with
dominance and when submissiveness is responded to with submissiveness, conflict emerges
between interaction partners (Stein, 1979). In particular, symmetry in dominance behaviors is
related to power struggles and interpersonal frustrations (Horowitz et al., 2006; Tracey et al.,
2001) and ultimately lower productivity (Grant et al., 2011). Furthermore, conflict in leader-
follower relationships has been associated with negative outcomes for the dyad members (e.g.,
Wilheim, Herd & Steiner, 1993), and interpersonal conflict has been found to be negatively
associated with the emergence of leadership (Bergman Rentsch, Small, Davenport, & Bergman,
2012). This suggests that, in general, complementary as opposed to symmetrical interactions will
be associated with emergent leader-follower relationships. Thus, I predict:
H2a: Complementary interacts will be positively associated with the emergence of
leader-follower relationships.
H2b: Symmetrical interacts will be negatively associated with the emergence of leader-
follower relationships.
Whereas dyadic interacts are generally likely to be associated with emergent
relationships, research also suggests that how the sequential patterns of dyadic interacts change
over time (as predicted in H1) is also likely related to their emergence. The psychological
entropy model of uncertainly posits that all social systems at any given time experience some
level of psychological entropy, which is a state of “conflicting perceptual and behavioral
affordances” (Hirsh, Mar, & Peterson, 2012; p. 304). The systems need to reduce, or dissipate,

18
psychological entropy in order to survive. They do so by adopting or readopting patterns of self-
organization that align cognitive and behavioral affordances and maximize stable, low entropy
states. If a system effectively adapts and self-organizes, what emerges is a stable, organized
structure. If a system fails to effectively adapt and self-organize into a stable structure, it
deteriorates.
Applied to this study, entropy may represent uncertainty in groups’ perceptions of
emergent leadership. As the groups are leaderless, there exists large amount of uncertainty and
entropy in the perceptions and behaviors of leadership initially. As dyads interact, they aim to
reduce this uncertainty to achieve alignment in perceptions and behaviors of leadership and
followership, characterized by stable and structured leader-follower relationships. If dyads fail to
achieve these stable states of emergent leadership and followership, uncertainty increases, and
mutual leader-follower relationships cannot emerge. Bales (1999) discussed a similar notion that
there exist dual forces in groups that drive people to form either cooperative or conflicting
relationships, and conflicting relationships either stabilize to form cooperative ones or degenerate
completely (Stein, 1979). A final comparable notion is that of positive and negative spirals of
dyads, as put forth in Leadership Identity Construction Theory. Accordingly, I expect dyads
whose interactions stabilize into complementary and cooperative interactions (those that increase
over time) reflect self-organization toward low levels entropy and will be positively related to the
emergence of leader-follower relationships. Thus,
H3: The pattern of increasing complementary interacts over time (positive slope) will be
associated with the emergence of leader-follower relationships.
2.4.3 – Antecedents of the process. Studying the interactional process and emergent
structure of leadership relations on their own is not enough to study the process of leadership. As

19
Antonakis made clear in his exchange with Fairhurst (Fairhurst & Antonakis, 2012), dyadic
relations, no matter how they are conceptualized (e.g., communication, perceptions, etc.), are
endogenous variables. These endogenous variables in process models have exogenous
antecedents that cause their existence. In order for process models to be useful, Antonakis
claimed, the antecedents of the relationship must be modeled completely. In this case,
interactional patterns of control arise from one or more variables occurring at one or more levels.
So, to fully understand the process of leadership emergence, we must understand the antecedents
of those processes. Applied to emergence theory, antecedents of the leadership emergence
process may represent some of the “core concepts” involved in the process (Grand et al., 2016),
and the dyadic interactional processes represent the mechanisms through which the “core
concepts” impact emergent leader-follower relationships.
In general, antecedents of leadership are most commonly studied at the individual level,
particularly focusing on individual attributes, behaviors or perceptions. In addition, a great deal
of leadership research has focused on macro-level predictors, such as context (Zaccaro, Green,
Dubrow, & Kozle, 2018). In the leadership domain, dyadic level antecedents are rare, at best
(Krasikova & LeBreton, 2012). Yammarino and Gooty (2017) claimed the dyad is “the most
neglected and poorly understood level analysis in leadership research” (p. 229). This is
surprising given leadership is inherently dyadic (Uhl-Bien, 2006). If understanding the relational
process of leadership necessitates studying how a pair of individuals form patterns of interaction,
then the antecedents of these interactional processes must also focus at the very least on
characteristics of a pair of individuals. Thus, in this section, I heed calls to build the study of
leadership at the dyadic level (e.g., Carter et al., 2015; Krasikova & Lebreton, 2012, Uhl-Bien &
Fairhurst, 2012) by developing hypotheses that extend traditional individual level antecedents of

20
leadership outcomes to dyadic level antecedents of dyadic relational control processes.
In particular, I make the case for complementarity, or dissimilarity, in individual
differences among dyads as predictive of complementarity in relational communication patterns.
In leadership research, the predominant belief is that dyadic similarity predicts (effective) leader
follower relationships and positive outcomes. Theories claim individuals are more attracted to
similar others (Attraction-Similarity Theory; Bryne, 1971; Attraction-Similarity-Attrition
Paradigm; Schneider, 1987). However, turning to research outside the leadership field reveals the
potential importance of dyadic dissimilarity, or complementarity, especially regarding relational
processes. For example, in teams research, there is a growing recognition of the importance of
compilation models, which emphasize the differences among team members. The positive effects
of dissimilarity in team composition have been studied across a variety of constructs, including
individual differences in personality (e.g., Barrick, Stewart, Neubert, & Mount, 1998;
Humphrey, Hollenbeck, Meyer, & Ilgen, 2007), demographics (e.g., Jackson, Brett, Sessa,
Cooper, Julin, & Peyronnin, 1991), and knowledge (Shin & Zhou, 2007). In addition, in the
sociology and social psychological literature, interpersonal theory suggests people often prefer
interpersonal complementarity, or dissimilarity (Carson, 1969), especially with when working on
interpersonal tasks (e.g., Dryer & Horowitz, 1997; Tiedens et al., 2007). Accordingly, I examine
the role that dyadic complementarity plays in the leadership process.
Dominance. Dominance is consistently found to be one of the strongest predictors of the
emergence of leaders in groups (Judge et al. 2002; Lord et al., 1986). This is likely because
dominant people prefer to control and master others in a group (Horowitz et al., 2006), and this
inclination drives assertive and domineering behaviors toward group members (Tiedens &
Fragale, 2003). For example, in an interaction-based lab study by Lock and Saddler (2007), two

21
individuals were instructed to complete a decision-based task, which required a significant
amount of interaction. They each rated themselves on dominance efficacy, which resembled self-
report measures of dominance, and then completed the task. Behavioral interactions were
recorded and coded for the degree to which they were domineering, or controlling in function.
Results showed a positive relationship between dominance efficacy and domineering behaviors
toward the task partner. This suggests dominant people tend to enact domineering and
controlling behaviors.
At a relational level, the similarity and dissimilarity in dominance between two
individuals may impact their interactional patterns (Tiedens & Jiminez, 2003). A dominant
expression can be followed by either a submissive expression or another dominant expression
(Tiedens & Fragile, 2003). If two individuals are high on dominance they are likely to both
express dominance behaviors toward each other, resulting in a power struggle (Schmid Mast,
2010). The close relationship between dominance and control would suggest the same for
relational control patterns. Individuals both high on dominance are likely to engage in
symmetrical competitive dyadic interacts. Symmetrical competitive interacts represent a series of
challenges and counterchallenges, reflecting competition for control of the social hierarchy
(Muniz de la Pena, Friedlander, Escudero, & Heatherington, 2012). Since dominant individuals
aim to keep control of their social position or status (Grant et al., 2011), they are likely to
respond to threats of dominance with domineering behaviors. This is also aligned with leadership
identity construction theory, which states that if one identifies as a leader, as is often the case
with dominant individuals (Judge, Piccolo, & Kosalka, 2009), he/she is likely to respond to
claims of leadership with subsequent claims (DeRue & Ashford, 2010).
On the other hand, individuals low on dominance tend to engage in submissive

22
interactions in a group, where they often defer to others to make decisions and resolutions (Dryer
& Horrowitz, 1997) and engage in non-dominant behaviors (Lock and Saddler, 2007). Thus, the
behavioral patterns of dyads with members who both score low on dominance are likely
characterized by successive expressions of non-dominance, or grants of leadership (DeRue &
Ashford, 2010). In terms of relational control, these represent symmetrical moves that both
acquiesce of control, or, in other words submissive symmetry, whereby each defers to the other
to decisions and resolutions.
Finally, when one dyad member is high on dominance, and one dyad member is low on
dominance (i.e., they are dissimilar), the highly dominant member, inclined to exert leadership
and control, is likely to do so, and the non-dominant member is likely to submit to such
behaviors. That is, non-dominant individuals are likely to respond to assertions of control with
acquiescence or seek responses of control. These types of exchanges are called complementary
interacts and are aligned with dominance complementary theory (Kiesler, 1983) and research
suggesting most individuals have preferences to engage in dyadic interactions characterized by
behavioral complementarity (Carson, 1969; Dryer & Horowitz, 1997; Tiedens & Fragale, 2003;
Tiedens & Jimenez, 2003). I therefore hypothesize:
H4a: Dyads’ dissimilarity in levels of dominance will be positively associated with the
frequency of complementary interacts.
H4b: Dyads’ similarity in levels of dominance will be positively associated with the
frequency of symmetrical interacts.
Leadership self-efficacy
Leadership self-efficacy (LSE) is one’s own self-conceptions as to his/her abilities to be
effective as a leader (Chemers, Watson, & May, 2000; Murphy & Eshner, 1999). LSE has been

23
found to be positively associated with a variety of leadership outcomes (Ng et al., 2008; Paglis,
2010). For example, a study Chemers, et al. (2000) examined the relationship between leader
emergence and performance in a group of military cadets and individual leadership self-efficacy.
Results showed leadership self-efficacy predicted ratings of cadet leadership potential by the
cadets’ instructors. Similarly, a study by Anderson and colleagues (2008) found mangers’ levels
of LSE to be positively associated with ratings of leadership effectiveness.
While the vast majority of research examining LSE has been conducted at the individual
level, existing theory and research suggests similarity and dissimilarly of LSE between dyad
members likely impact dyadic interactions. First, evaluations of the self are inherently relational,
as posited by Social Comparison Theory (Festinger, 1954), which suggests that evaluations or
perceptions of the self (e.g., LSE) can only be made by comparing the self to others in social
situations. Furthermore, if individual LSE is a key antecedent of how an individual behaves in a
group (Social Cognitive Theory; Bandura, 2001), then it follows that a key antecedent of how a
dyad behaves is likely a conceptualization of LSE at the dyad level. The importance of
considering LSE at the dyad level was emphasized by Hannah, Avolio, Luthans, and Harms
(2008) in the development of their multilevel and multivariate model of LSE. As part of their
model, Hannah et al. argued outcomes of LSE can manifest at the dyad level. I propose one of
such outcomes is dyadic behavior.
Empirical research shows there is a positive relationship between individual levels of
LSE and attempts to assume leadership roles, for both working adult samples (Paglis & Green,
2002) and student samples (McCormick, 2002). Similarly, Paglis and Green’s (2002) research
suggests these leadership attempts are related to the finding that those with high LSE are more
likely to see situations as controllable and act accordingly. If those with high LSE are likely to

24
engage in behaviors to exert control, and those with low LSE are likely to behave the opposite
way, then behavioral exchanges between dyads where members have dissimilar levels of LSE
are likely to be characterized by patterns of exertion (from high LSE member) and acquiescence
(from low LSE member) of control. This complementary pattern of interaction is likely to
perpetuate, since research shows interpersonal and social feedback from others reinforces LSE
beliefs (Hannah et al., 2008). As the exertions of control from those with high LSE are
responded to with acquiesces of control by those with low LSE, the self-perceptions of each
individual’s abilities to lead in a situation are reinforced and strengthened (Quigley, 2013), then
likely subsequently manifested in complementary interacts. In addition, research shows the more
similar dyads are in LSE, the less likely they are to share cooperative goals and rate their
relationship positively. (Chen et al., 2015). If dyads do not share cooperative goals, and if goals
guide behavior, then it is likely that dyads that share more similar levels of LSE are more likely
to engage in symmetrical interacts. Accordingly, I predict:
H5a: Dyads’ dissimilarity in levels of LSE will be positively associated with the
frequency of complementary interacts.
H5b: Dyads’ similarity in levels of LSE will be positively associated with the frequency of
symmetrical interacts.
Implicit Leadership and Implicit Followership Theories
While I have conceptualized leadership as an inherently perceptual and relational process,
the majority of the discussion thus far has focused more so on the behavioral interaction
components of relations rather than their cognitive components. However, the cognitive
components of relations have long held importance in the study of leadership (Dinh, Lord,
Gardner, Meuser, Liden, & Hu, 2014). In fact, research on implicit theories of leadership and

25
followership suggests that the process of leadership emergence begins with cognitive
components, specifically, with cognitive schemas and prototypical representations that people
hold of leaders and followers. These representations are referred to as implicit leadership theories
(ILTs; Lord et al., 1984; Lord & Maher, 1991) and implicit followership theories (IFTs; Sy,
2010). As with other natural cognitive categorization (Rosch, 1977), people use the cognitive
heuristics of ILTs and IFTs to respectively categorize others as leaders and followers (Lord &
Maher, 1991). The more closely the characteristics one perceives in another match the
characteristics contained in the perceiver’s ILT (IFT), the more likely the perceiver is to
categorize the other person as a leader (follower). Because ILTs and IFTs are theories about
people in their entirety, a stream of ILT/IFT research takes a pattern-oriented approach to
identify profiles of ILTs and IFTs (e.g., Foti, Bray, Thompson, & Allgood, 2012). Research
shows there likely exist four ILT profiles (Prototypical, Laissez-faire, Autocratic, and Anti-
prototypical) and four IFT profiles (Exemplary, Pragmatic, Isolated and Passive), which are
discussed in further detail in Appendix A and below.
ILTs and IFTs are important for understanding how people interact with one another for
multiple reasons. First, because people behave as leaders and followers in accordance with the
ILTs and IFTs they hold for those roles (Lord & Maher, 1991), ILTs and IFTs guide how people
behave as leaders and followers generally (van Gils et al., 2010). Second, ILTs and IFTs give
meaning and sense to the behaviors of others (Shondrick & Lord, 2010); they frame how
behaviors are interpreted. Thus, ILTs and IFTs are important for interpreting others’ behaviors.
Finally, ILTs and IFTs influence how people choose to respond to certain behaviors (DeRue &
Ashford, 2010), depending on how one categorizes the self and the others involved in the dyad.
Thus, dyad members’ ILTs and IFTs are inextricably linked to how the dyad interacts,

26
underscoring the importance of studying ILTs and IFTs at the dyad level.
While the vast majority of ILT and IFT research has been conducted at an individual
level (assessment of either ILTs or IFTs from one dyad member’s point of view) a growing body
of research has extended ILT and IFT research to the dyad level (Epitropaki, Sy, Martin, Tram-
Quan, & Topakis, 2013). Most commonly, ILT and IFT research at the dyad level focuses on
congruence, or alignment, of ILTs and IFTs. Congruence of ILTs and IFTs has been studied in
various ways. First, intra-personal congruence concerns the alignment of ILTs and/or IFTs
within a person. One intra-personal approach, though rarely conducted, examines the patterns, or
alignment, of one’s ILT and IFT. For example, Coyle and Foti (2015) found people who hold
prototypical ILTs are most likely to hold exemplary IFTs, and people who hold autocratic ILTs
are most likely to hold pragmatic IFTs. Another type of intra-personal congruence approach
examines the degree to which one’s implicit leadership or followership theory aligns with his/her
explicit rating of another person on that same ILT or IFT scale. For example, Epitropki and
Martin (2005) showed that the more congruent employees’ explicit perception of their managers
were with their own ILT, the higher the quality of the dyads’ relationship (LMX).
The second broad category of ILT/IFT congruence is inter-personal congruence. The
most common inter-personal congruence method focuses on the match between dyad members’
ILTs or IFTs. For example, Engle and Lord (1997) as well as Coyle and Foti (2014) found that
when dyad members hold similar ILTs, they tend to rate their relationship quality higher. This is
likely because when people hold different ILTs and IFTs they accordingly hold differential
expectations, perceptions, and attributions of the other dyad members (Coyle & Foti, 2015;
Engle & Lord, 1997; van Gils et al., 2010). If one dyad member’s schema of a leader is the same
as the other dyad member’s, then the expectations that both have of a follower are similar and

27
aligned. Thus, when one dyad member behaves in accordance with what he/she believes is a
follower role, for example, the other dyad member will also perceive those behaviors as
follower-like and as exertions of follower identity (Coyle & Foti, in press; van Gils et al., 2010).
One step beyond inter-personal congruence on either ILTs of IFTs is inter-personal
congruence on both ILTs and IFTs. This approach takes a truly relational perspective because it
measures both ILTs and IFTs from both dyad members. To my knowledge, there is only one
study investigating this concept, and it is focused on the effectiveness of the relationship between
dyad members in formally designated leader and follower roles, as opposed to their emergence
(Coyle & Foti, under review). However, a similar premise holds for emergence as for
effectiveness: when dyad members hold the same (or similar) conceptualizations of what
constitutes a leader and what constitutes a follower, they not only mutually and similarly
understand the roles of leadership and followership, but they likely behave in similar ways in
response to and initiation of leadership and followership.
Take, for example, a situation where both dyad members share full interpersonal
congruence on ILTs and IFTs, meaning they both hold the same ILT and IFTs. That is, Person A
and Person B both hold autocratic ILTs and passive IFTs. If Person A initiates an autocratic
behavior, Person B will perceive that behavior as leader-like. Then, according to Leadership
Identity Construction Theory, Person B has the opportunity to “claim” or “grant’ leadership back
toward Person A. If the Person B decides to assume a followership relational identity toward
Person A, he/she will likely respond with a passive behavior. Person A will likely interpret this
behavior as follower-like, since Person A also holds a passive IFT. In this way, both dyad
members understand each other’s roles relative to the other and act accordingly, and a pattern of
complementary interactions likely follows. Alternatively, if Person B decides to claim leadership

28
back on Person A, then he/she will likely enact an autocratic behavior in accordance with his/her
ILT. Following the hypothesis described above, since Person A would have accurately perceived
Person B’s autocratic behavior as leader-like, they each understand each others’ roles and aim to
reduce conflict by gravitating toward complementary interactions. In both situations, role clarity
makes it more likely that dyads engage in complementary interactions. If dyad members were
only congruent on ILTs, only IFTs, or on neither (full interpersonal incongruence), dyad
members would share less of an understanding of each other’s roles relative to the other and
would thus engage in less complementary behavior. Accordingly, I predict:
H6: Dyads’ with more inter-personal ILT and IFT congruence will be positively
associated with the frequency of complementarily interacts.
In sum, Chapter 2 focused on the motivation for this dissertation, how it contributes to
the science of leadership emergence, relevant literature and theory, and predictions. I discussed
the misalignment of the theory-method of leadership emergence as a process as well as the need
to understand the micro-level interactional process mechanisms that underlie emergent leaders
and followers. I reviewed relevant literature leading to my hypotheses and conceptual model,
which are depicted in Figure 1 and Figure 2. In the next chapter, I discuss the method for testing
these hypotheses.

29
Chapter 3 – Method
3.1. – Data Source
Data for this study was collected as part of a larger dataset and funded in part by the
Virginia Tech Graduate Student Assembly (GSA). Data was collected in a naturalistic classroom
setting for twelve weeks over three semesters: Fall 2015, Spring 2016, and Fall 2016. The course
was an ideal setting for this study because it included a team project component, where students
were assigned to groups to collectively work on three projects throughout the course of the
semester. The class met three days per week for 50 minutes, one of which (Wednesdays) was
devoted to working together in their teams to complete the projects. While intra-team interaction
data were collected in person in the classroom one day per week for twelve weeks, only the first
four weeks of data- corresponding to the first project- were included in this study.
3.2. – Participants
The initial sample of participants included 127 undergraduate students (68% female)
from three introductory Industrial/Organizational Psychology courses at a large southeastern
university. All students from all three courses (100%) consented to participate in the study and
were compensated up to 12 extra credit points for their participation. For each class, participants
were stratified based on gender and academic major, then randomly assigned to teams of four to
six. This stratification ensured group heterogeneity based on gender and academic major. Each
group included at least one male and at least two students with majors outside of Psychology.
This process was intended to yield a total of 25 four to six person teams. However, due to a
technical malfunction with a voice recorder, two weeks of audio data were unable to be coded
for one group. This group was thus dropped from the analysis. Final sample size included 24
teams, 119 individuals, and 238 dyads.
30
3.3 – Procedure
On the first day of class, the class professor explained to the students the structure of the
course and the team project component. At the end of the first class, the researcher made a
presentation to each class, recruiting their participation in a “team interaction project.” Students
were informed that if they participated, the data collection would span twelve weeks (one class
per week, and two additional surveys) and included the opportunity to receive one point of extra
credit for each week they participated (up to 12 points). They were informed that aside from the
extra credit, their participation would have no impact on their grades or assessment in the course.
After the researcher’s presentation, students were administered and completed informed consent
forms (Appendix B). Next, all consenting participants were sent a link to complete an online
Qualtrics survey2 measuring individual difference characteristics, which included measures of
Dominance, Leadership Self-efficacy (LSE), Implicit Leadership Theories (ILT), and Implicit
Followership Theories (IFT). In the meantime, the researcher randomly assigned participants to
teams, but stratified them such that at least one male and at least two non-Psychology majors
were included in each team. Additionally, in an attempt to prevent assignment of friends to the
same group, individuals sitting next to each other (semester 1) or at the same table (semester 2
and 3) were not assigned to the same group. Students received their team assignments prior to
the following week (the first week of data collection).
The following week (second week of class and first week devoted to team projects), the
class instructor explained their first project, which they were to work on and complete over the
next four weeks. This project entailed conducting a job analysis of one team member’s
previously held job. It included four actionable sub-tasks: 1) assembling an action planning
2 Note: this questionnaire also included a questionnaire to measure Leadership Structure Schemas, which
was not included in this study.

31
worksheet, outlining what the team aimed to accomplish each week; 2) conducting a structured
interview of the person holding the job and a post-interview assessment in order to gather
information on job tasks and relevant KSAOs; 3) gathering information regarding comparable
jobs from O*NET; and 4) assembling a job summary report to turn in to be graded. For the
remainder of the four weeks, teams worked together in class for 50-minutes once per week to
complete the project. Throughout this time, verbal interactions between team members were
recorded using audio recorders that were placed on each team’s table. As soon as all team
members arrived, each team member identified his/herself verbally (e.g., “Hi my name is X, and
I am here today”), so that voices could be matched with names during the coding process.
At the end of each class, participants were administered a questionnaire, which included
questions about team member attendance, leadership and followership, and team productivity. As
a potential control, the first of these questionnaires included a single item asking whether any of
the team members were previously friends or acquaintances prior to the first day of class. Only
the attendance and friendship data from these questionnaires were used for this study. Finally, at
the end of the semester, all participants were sent a link to a questionnaire that included multiple
measures of team states (e.g., team viability, psychological safety) not included in this study, as
well as two single-item questions regarding who in the team the individual led and whom he/she
followed throughout the semester.
3.4. – Measures
3.4.1. – Antecedent measures.
Dominance. Dominance was measured using the dominance subscale of the California
Psychological Inventory (CPI; Gough, 1990), which is included in Appendix C. It has previously
been found to be reliable (α= .88; Foti & Hauenstein, 2007) and includes 46 true/false items such

32
as, “I like to give orders and get things moving” or “Taking charge comes easy to me.” Item
responses of “false” were coded as “0,” and item responses of “true” were coded as “1,” and the
reversed scoring was conducted for the negative items. Item responses were summed to produce
the total dominance score.
LSE. LSE was measured with the Paglis & Green’s Leadership Self-Efficacy Scale
(Paglis & Green, 2002), which assessed one’s own perceptions of his or her abilities to succeed
as a leader. The LSE measure has previously been found to be reliable (α= .85; Wellman et al.,
2014) and is included in Appendix D. Participants rated their self-confidence in 11 leadership
abilities on a 7-point scale (Extremely Unconfident to Extremely Confident). Example items
include, “planning ability,” “setting direction,” and “overall leadership effectiveness.” Item
responses were summed to produce the total LSE score.
Dyadic similarity and dissimilarity in dominance and LSE. Dyad members’ similarity
and dissimilarity on dominance and LSE were each calculated using the absolute difference
scores between dyad members’ respective levels of each attribute. While difference scores have
been used in recently published leadership and followership research to operationalize levels of
dyadic similarity (e.g., Venkataramani, Green, & Schleicher, 2010; Wang & Peng, 2016), I
recognize the methodological limitations associated with them (Edwards, 1994). Due to
restrictions of sample size, ideal methods to calculate similarity (i.e., polynomial regression;
Edwards, 2001) were not possible. These limitations will be discussed in more detail in the
Results section.
ILTs. ILTs were measured with Epitropaki & Martin’s 31-item ILT scale (2004), which
is a shortened version of the original 41-item scale developed by Offermann, Kennedy and Wirtz
(1994), included in Appendix E. The measure asks participants rate how descriptive each of the
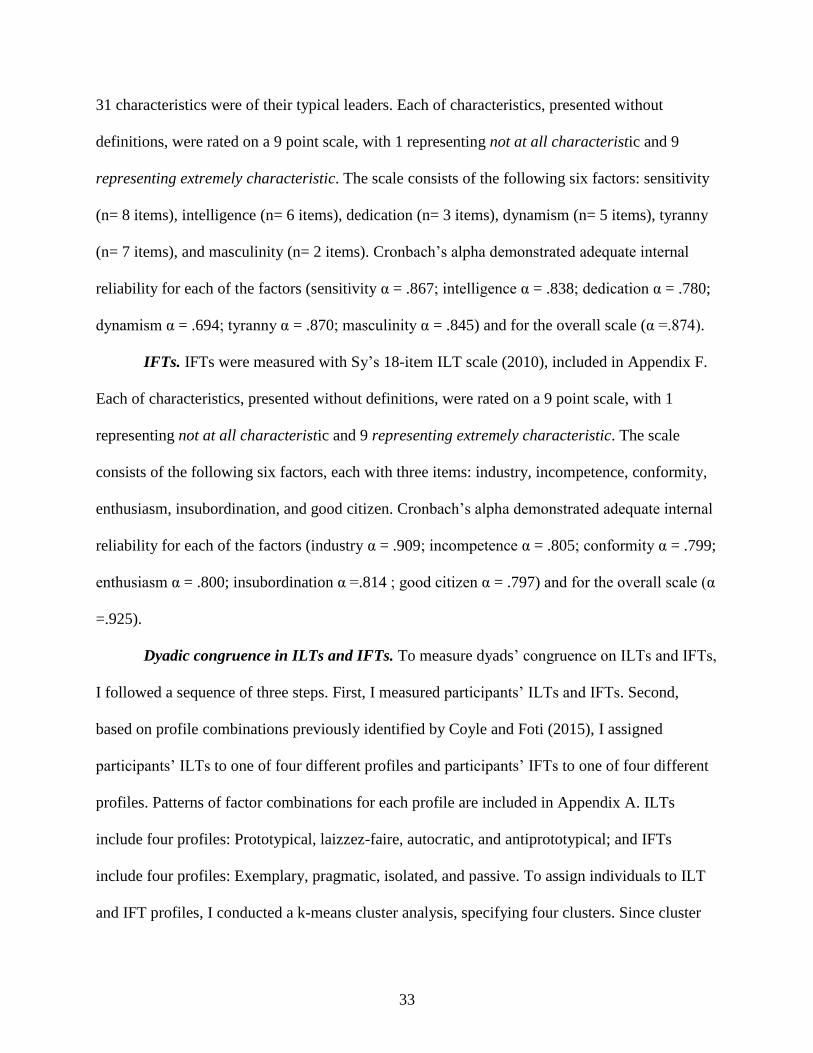
33
31 characteristics were of their typical leaders. Each of characteristics, presented without
definitions, were rated on a 9 point scale, with 1 representing not at all characteristic and 9
representing extremely characteristic. The scale consists of the following six factors: sensitivity
(n= 8 items), intelligence (n= 6 items), dedication (n= 3 items), dynamism (n= 5 items), tyranny
(n= 7 items), and masculinity (n= 2 items). Cronbach’s alpha demonstrated adequate internal
reliability for each of the factors (sensitivity α = .867; intelligence α = .838; dedication α = .780;
dynamism α = .694; tyranny α = .870; masculinity α = .845) and for the overall scale (α =.874).
IFTs. IFTs were measured with Sy’s 18-item ILT scale (2010), included in Appendix F.
Each of characteristics, presented without definitions, were rated on a 9 point scale, with 1
representing not at all characteristic and 9 representing extremely characteristic. The scale
consists of the following six factors, each with three items: industry, incompetence, conformity,
enthusiasm, insubordination, and good citizen. Cronbach’s alpha demonstrated adequate internal
reliability for each of the factors (industry α = .909; incompetence α = .805; conformity α = .799;
enthusiasm α = .800; insubordination α =.814 ; good citizen α = .797) and for the overall scale (α
=.925).
Dyadic congruence in ILTs and IFTs. To measure dyads’ congruence on ILTs and IFTs,
I followed a sequence of three steps. First, I measured participants’ ILTs and IFTs. Second,
based on profile combinations previously identified by Coyle and Foti (2015), I assigned
participants’ ILTs to one of four different profiles and participants’ IFTs to one of four different
profiles. Patterns of factor combinations for each profile are included in Appendix A. ILTs
include four profiles: Prototypical, laizzez-faire, autocratic, and antiprototypical; and IFTs
include four profiles: Exemplary, pragmatic, isolated, and passive. To assign individuals to ILT
and IFT profiles, I conducted a k-means cluster analysis, specifying four clusters. Since cluster

34
analyses require large sample sizes, I supplemented the ILT and IFT participant data from this
study (“study data”) with an archival data set (n = 555) acquired form the Virginia Tech SONA
system (“supplemental data”). Individuals in the supplemental data set resembled individuals in
the study data, as they were also undergraduate students from the same university, enrolled in at
least one Psychology course. Table 1 includes the results of both the ILT and the IFT k-means
cluster analyses run on the combined sample (study data and supplemental data), as well as
factor means within each cluster and cluster n-sizes. Table 2 represents results from the same
analyses, with the only difference being factor means and n-sizes calculated for the study data
only. Once profile assignments were made, the third step involved assigning dyads to ILT/IFT
congruence categories. Dyads were assigned to one of four dyadic congruence classes, based on
whether or not dyad members’ ILTs and IFTs aligned. Following Coyle and Foti (under review)
and Van Gils et al. (2010), dyads can show 1) full interpersonal congruence on both ILTs and
IFTs (i.e., each hold the same profiles of both ILTs and IFTs); 2) full interpersonal incongruence
on both ILTs and IFTs (i.e., each hold the different profiles of both ILTs and IFTs); 3)
congruence on only ILTs (i.e., each hold the same profiles of ILTs but different profiles of IFTs);
or 4) congruence on only IFTs (i.e., each hold the same profiles of IFTs but different profiles of
ILTs). Numeric dummy codes were assigned to each of the four categories.
3.4.2 – Process measure.
Dyadic interacts. As described above, dyadic interacts include a pair of mutually directed
verbal interactions. Coding interacts was a three-step process: 1) coding sense units; 2)
transforming sense units into moves; 3) combining moves into interacts. The coding scheme for
these interacts (See Appendix G) is an amended version of Fairhurst’s Relational Control Coding
Scheme (1989), which has previously been used as a means to operationalize leadership

35
interaction processes (Fairhurst et al., 1995).
Assigning codes to sense units. Only task-relevant verbal units of communication, or
“sense units” (Bales, 1951; Lehmann-Willenbrock & Allen, 2017; Weiss et al., 2017) were
coded. A sense unit was defined as any utterance representing one complete thought, or an
attempt at a complete thought (in the case of interruptions). Each sense unit was assigned four
different codes: the speaker, the recipient, the form, and the mode. The speaker represented who
expressed the sense unit and can include any one of the team members. The recipient represented
to whom the sense unit was directed. The recipient could include any one of the team members,
plus the team in its entirety (c.f., “talking to the room,” Kolbe et al., 2014). The form represented
the structural nature of the sense unit and included the codes question, assertion, and talk-over
(successful and unsuccessful). The mode represented the function of the sense unit in
conversation and included the codes support, nonsupport, extension, instruction. For example, a
single sense unit might have been coded as Speaker 1-Speaker 2-Assertion-Instruction.
A sense unit could range in length from a single word, to a phrase of multiple words, to
multiple sentences. In addition, any change in any of the four corresponding codes within a
single utterance required an additional independent code. That is, if Speaker 1 directed a question
of nonsupport to Speaker 2, and then continuously proceeded to direct an assertion of support to
Speaker 3, two codes were assigned to the single utterance from Speaker 1. An example
transcript of codes is included in Appendix H.
Aside from non-task related utterances, there were instances when utterances and sense
units were excluded from this study’s analysis. If an attempt at an utterance was made and no
meaningful sense could be determined from the utterance (i.e., no form and/or mode could be
assigned), the utterance was not coded and thus excluded. If the voice of a speaker or recipient of

36
a sense unit was not identifiable, the utterance was assigned the code “ambiguous” for speaker or
recipient and thus excluded. If the code did not fit into a particular form or mode category, it was
coded as “other” and thus excluded. Finally, while it was initially proposed to conduct analyses
in two ways, once including utterances directed toward the group (each team member becomes a
recipient) and once excluding utterances directed toward the group, issues with data aggregation
in the coding program prevented the ability to assign all team members as recipients. Thus,
utterances directed toward the group were excluded from analyses.
Transforming sense units into relational control moves. As shown in Appendix G, the
combination of the form and the mode produced one of three relational control codes, best
denoted with arrows. A one-up move () indicated an attempt to verbally assert control toward
the recipient(s); a one-down move () indicated an attempt to verbally acquiesce control toward
the recipient(s); and a lateral move () indicated an attempt to neither assert nor acquiesce, but
neutralize control toward the recipient(s). Upon completion of coding, the form and mode of
each coded sense unit was recoded into on of the relational control arrow moves, so that each
sense unit included a speaker, a recipient and a relational control move.
Combining moves into interacts. The final step entailed combining sequential pairs of
relational control moves between dyad members into dyadic interacts. As defined in past
relational control research (de la Pena et al., 2012; Fairhurst, et al., 1995), a complementary
interact was defined as a one-up move, followed by a one-down move, or vice versa (;
)). A symmetrical interact was defined as a pair of sequential one-up moves () or as a
pair of sequential one-down moves (). For the purposes of this study, interacts including
lateral moves were not analyzed. Because dyads engaged in different amounts of
communication, the raw frequency counts of complementary and symmetrical interacts were

37
standardized by the total number of interacts dyads engaged in throughout each time point (T1-
T4). The result was a percentage of all interacts that were complementary and symmetrical.
Training the coders and the coding process: All verbal interactions were coded directly
from the audio recordings, as opposed to transcriptions of the interactions. Research shows
coding based on video and audio observations more accurately captures interpersonal processes
than coding based on transcriptions of data alone (Nicolai, Demmel, Farsch, 2010). All coding
was conducted using INTERACT software (Mangold, 2010), a coding and statistical analysis
program that provides a platform to develop codebooks, code behavioral data, and analyze
interaction based data (Figure 3). Coding was primarily (~83%) conducted by two undergraduate
research assistants studying Psychology and one graduate I/O Psychology Ph.D. student, all
blind to the hypotheses of this study. Due to timing constraints, I coded 17% of the audio data.
Prior to coding, coders engaged in extensive training, practice and feedback, codebook
refinement and tests of agreement. Formal training included the following: approximately 10
hours (2 weeks) of education of literature on leadership communication (e.g., Lehman-
Willenbrock et al., 2015) and relational leadership processes (e.g., DeRue & Ashford, 2010);
approximately 15 hours (3 weeks) of education on relational control coding and research (e.g.,
Courtright et al., 1989) and definitions of the codes included in the codebook; and approximately
25 hours (4 weeks) of coding practice and feedback, both independently and as a group.
Throughout this time, inclusion criteria for what to code, definitions of codes and the decision
tree for coding were refined.
Upon completion of training, pairwise agreement was calculated among all 6 pairs of
coders. Given coding required first identification of an utterance as a code-able sense unit
(unitizing) and then assigning form and mode codes to each sense unit, calculating agreement
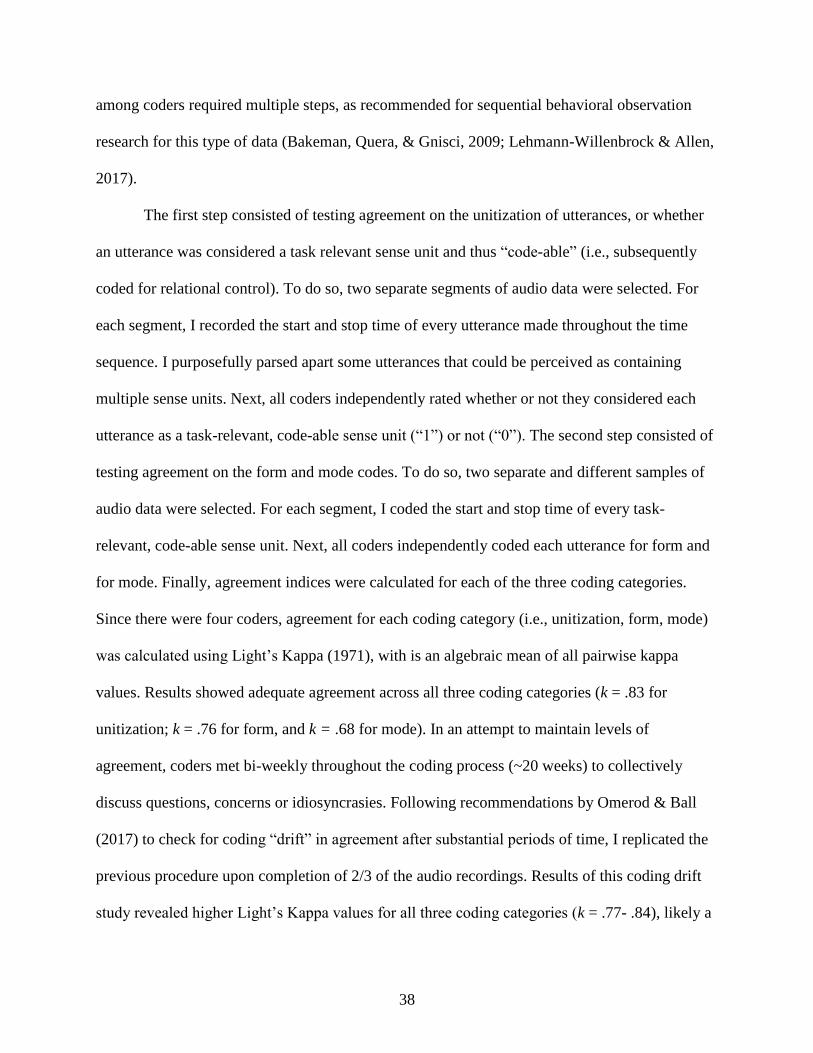
38
among coders required multiple steps, as recommended for sequential behavioral observation
research for this type of data (Bakeman, Quera, & Gnisci, 2009; Lehmann-Willenbrock & Allen,
2017).
The first step consisted of testing agreement on the unitization of utterances, or whether
an utterance was considered a task relevant sense unit and thus “code-able” (i.e., subsequently
coded for relational control). To do so, two separate segments of audio data were selected. For
each segment, I recorded the start and stop time of every utterance made throughout the time
sequence. I purposefully parsed apart some utterances that could be perceived as containing
multiple sense units. Next, all coders independently rated whether or not they considered each
utterance as a task-relevant, code-able sense unit (“1”) or not (“0”). The second step consisted of
testing agreement on the form and mode codes. To do so, two separate and different samples of
audio data were selected. For each segment, I coded the start and stop time of every task-
relevant, code-able sense unit. Next, all coders independently coded each utterance for form and
for mode. Finally, agreement indices were calculated for each of the three coding categories.
Since there were four coders, agreement for each coding category (i.e., unitization, form, mode)
was calculated using Light’s Kappa (1971), with is an algebraic mean of all pairwise kappa
values. Results showed adequate agreement across all three coding categories (k = .83 for
unitization; k = .76 for form, and k = .68 for mode). In an attempt to maintain levels of
agreement, coders met bi-weekly throughout the coding process (~20 weeks) to collectively
discuss questions, concerns or idiosyncrasies. Following recommendations by Omerod & Ball
(2017) to check for coding “drift” in agreement after substantial periods of time, I replicated the
previous procedure upon completion of 2/3 of the audio recordings. Results of this coding drift
study revealed higher Light’s Kappa values for all three coding categories (k = .77- .84), likely a

39
result of bi-monthly coding discussions.
3.4.3 – Outcome measure.
Emergent leader-follower relationships. At the end of the semester, participants were
asked to reflect back on their semester and list the names of their team members they relied on
most for leadership and the team members they led the most (Appendix I). Following
suggestions to measure and operationalize leadership relationships from both the perspective of
the emergent leader and emergent follower (Gooty et al., 2012), and following research on
perceptual disconnects in leadership relationships (Holland, 2015), an emergent leader-follower
relationship was operationalized as an instance when both dyad members agreed that one
member was the leader and one member was the follower. Because dyad members could agree
and disagree with regard to dyadic leadership and followership, each dyad was capable of being
characterized by one of the following six scenarios shown in Table 3: 1) both dyad members
agreed they both led each other (“shared leadership relationship”); 2) both dyad members agreed
the did not lead each other (“naught leadership relationship”); 3) both dyad members agreed that
only one dyad member led and only one dyad member followed (“complementary leader-
follower relationship”); 4) both dyad members agreed that one of the dyad members followed,
but they disagreed about the other dyad member (“partial agreement, follower”; 5) both dyad
members agreed that one of the dyad members led, but they disagreed about the other dyad
member (“partial agreement, leader”); and 6) both dyad members disagreed on both members
leadership and followership (“complete disagreement”). Although dyad members’ agreement and
disagreement on who led and who followed is an interesting question in itself, the outcome of
interest in this study was a complementary leader-follower relationship (i.e., one dyad member
led and one dyad member followed), not agreement or disagreement in that relationship. Thus,

40
only results pertaining to the first three scenarios (shared leadership relationship, naught
leadership relationship, and complementary leader-follower relationship) were reported in the
results.
3.4.4 – Control measure.
Friendship/acquaintances. In order to control for previous (leadership) relationships or
behaviors due to friendship or liking, students were administered a sociometic measure stating,
“Please select your relationship status with each of your team members prior to this class: friend,
acquaintance, did not know him/her.”
In sum, chapter 3 focused on specifying the process through which data for this study
were collected, operationalized, and coded. I discussed the quasi-naturalistic nature of the study
context and participants’ teams included in the study, the process for preparing the data for
analyses, and coding the longitudinal interaction process data. In the next chapter, I review the
process for analyzing the collected data and results from the analyses.

41
Chapter 4 – Results
4.1 – Descriptive Statistics, Correlations, and Reliability
Table 4 presents intercorrelations of study variables collected at the individual level, as
well as their respective means, standard deviations and reliabilities. Cronbach’s alpha values =
for all individual difference scales (dominance, LSE, ILT, IFT) showed they were adequately
reliable (α = .783-.93). The variables “up moves sent” and “down moves sent” refer to their
respective percentage of individuals’ coded sense units directed toward a team member. In place
of scale reliabilities, the diagonals of these variables represent the range of initial Light’s Kappa
statistics. Finally, the “leader claims” and “follower claims” refer to the quotient of the number
of team members reported having led/followed and the total number of team members minus 1.
Given both were single-item scales, no reliabilities are reported.
There exist significant intercorrelations of individual level variables. Most notably LSE
and dominance were highly positively correlated (r = .650, p < .001), which is consistent with
previous research (e.g., Foti & Hauenstein, 2007). Neither the percentages of up or nor down
moves were correlated with individual differences at the individual level of analysis. However,
relationships did exist between individual differences and leader claims. Leader claims, were
positively correlated with both dominance (r = .214, p < .05) and LSE (r = .325, p < .05).
Finally, follower claims were positively associated with down moves (r = .200, p < .05), and
negatively associated with lateral moves (r = -.191, p < .05).
For dyadic level variables, intercorrelations, means, and standard deviations of
continuous variables are presented in Table 5. As with the individual level, difference scores for
dominance and LSE were positively correlated (r = .490, p < .01). In addition, dyads’ percent of
symmetrical interactions was negatively correlated with dyadic difference scores for LSE (r = -

42
.180, p < .01). This suggests the more dissimilar dyad members were in the levels of LSE, the
less frequently they engaged in symmetrical interactions.
Table 6 shows the means of dyadic dissimilarity on dominance and LSE by each category
of ILT-IFT congruence, and Table 7 shows the means of dyadic dissimilarity on dominance and
LSE by each category of leader-follower relationship congruence. For ILT-IFT congruence, most
dyads (n= 127) were fully incongruent, meaning dyad members did not have the same ILT, nor
the same IFT. The smallest category was the fully congruent group, where dyad members shared
the same ILTs and the IFTs. This group also had the smallest mean levels of dyadic dissimilarity
on dominance and LSE. For all categories of ILT-IFT congruence, the mean levels of percent
symmetrical interacts were higher than the percent complementary interacts. Of the 95 dyads
who agreed on each others’ roles, the majority (n = 59) agreed one dyad member led and the
other dyad member followed (complementary leader-follower relationship). Of the groups that
agreed, the smallest group contained dyads who agreed neither led each other (naught leadership;
n = 16). This group also had the smallest mean level of complementary and symmetrical interacts
(.095 and .088, respectfully).
Reliability of Difference Scores. At the dyadic level, I used absolute difference scores to
capture the degree of similarity and dissimilarity between dyad members on levels of dominance
and LSE. The use of difference scores in statistical analyses has long been scrutinized for the
methodological problems they present (e.g., Cronbach & Furby, 1970; Edwards & Parry, 1993;
Johns, 1981). Of primary concern is whether the difference scores are reliable (Johns, 1981),
more specifically, if the difference scores are more reliable than their component measures
together (Edwards, 2001). In this case, the question is whether the dyadic, absolute difference
scores of dominance and LSE are more reliable than the individual dominance and LSE scores.

43
Edwards (1994) discussed ways to test this question for different kinds of difference measures
using linear regression and a set of constraints. Edwards’ approach has been used by previous
published leadership research in an attempt to justify the reliability of difference score measures
(e.g., Coyle & Foti, 2015).
The approach entails running a multivariate linear regression on the differences scores
with five predictor terms in the model. I conducted this test using two models, one for the
dominance attribute and one for the LSE attribute. The first two terms in the model were the
individual scores of each of the dyad members (member 1 dominance/LSE, member 2
dominance/LSE). The third term was a dummy variable (W1) assigning a code of “0” to dyads
where member 2’s dominance/LSE score was less than or equal to dyad member 1’s score and a
code of “1” to dyads where member 2’s dominance/LSE score was greater dyad member 1’s
score. The final two terms were interactions of W1 with the individual member’s scores (W1*
member 1 dominance/LSE and W1*member 2 dominance/LSE). The set of constraints imposed
by this regression model are the following: 1) the coefficients of each of the component
measures (individual dominance/LSE scores) are “equal in magnitude but opposite in sign;” 2)
the coefficients of each of the interaction variables (W1* member 1 dominance/LSE and
W1*member 2 dominance/LSE) are “equal in magnitude but opposite in sign;” 3) the coefficient
of each interaction variable is 2 times the magnitude of its component variable coefficient, but
opposite in sign; 4) the coefficient of W1 is zero. Results for this analysis conducted on both
dominance and LSE difference scores is included in Table 8. All constraints were met for both
models. Thus, according to Edwards (1994), I believe there is valid justification in interpreting
the differences scores for dominance and LSE as dissimilarity between dyad members in
dominance and LSE.

44
4.2 – Hypothesis Tests
Hypothesis 1 proposed that the frequency of dyadic, complementary interacts would
increase over time, with each time point being one of the four, 50-minute, consecutive class
periods. While the initial intention was to conduct all analyses at the dyadic level, the test of
Hypothesis 1 was conducted at the individual level, for the following reasons. Approximately
30% of the dyads (n = 69) did not engage in any complementary interacts over all four class
periods, and approximately 65% engaged in four or fewer complementary interacts over the four
time periods. When divided across all four time periods, this suggests the cell sizes for a very
large portion of dyads would be 0, limiting the ability to calculate meaningful change over time.
Thus, in place of analyzing the change in dyadic interacts over time, I explored the change in
individual relational control moves from one dyad member to the other dyad member over time.
While this type of analysis is dyadic in a general sense in that it focuses on how one person
directs moves toward another person, it does not consider the sequential responses to each move
by the other dyad member, as initially proposed. In this way, studying individual directed
communication over time is substantively and theoretically different than studying dyadic
interactional communication over time. However, since complementary interacts are composed
of one up move and one down move, examining change in individual moves over time may
provide some insight as to whether individuals, but not necessarily dyads, changed in how they
communicated with dyadic partners over time. The outcomes of the frequency of up relational
control moves and down relational control moves were standardized by the total frequency of an
individual’s total relational control moves for each time point.
Since no formal hypothesis was proposed for this analysis, it was treated as exploratory
in nature. To do so, the data were modeled using two-level hierarchical linear modeling

45
(Raudenbush & Bryk, 2002), where four waves of time (T1, T2, T3, T4) were nested within
every dyad. A total of four models were run, two for each of the two types of relational control
moves (up and down) using the statistical program HLM 7 (SSI, 2017), using full maximal
likelihood estimation. Following procedures recommended by Bliese and Ployhart (2002), first
an unconditional means model, Model A, was run to determine if there existed individual
differences in percentages of each type of move. Results for Model A are included in Table 9.
Using the variance components, intraclass correlation coefficients (ICCs) were calculated to
determine the percentage of the total variability that lay between people. ICCs for both types of
control moves suggested a considerable amount of variance was due to the individual. ICC was
.324 for up moves and .143 for down moves, meaning approximately 32% and 14% the variation
in up, and down moves, respectively, was attributable to the individuals. This signifies there
existed meaningful variance in each of the moves and justified continuing to the unconditional
growth model, or Model B.
In Model B, the time variable was added to the Level 1 model. Doing so modeled the
average starting point and average rate of change for each outcome type of move (fixed effects),
as well as if there existed meaningful differences in both (random effects). Results for Model B
are included in Table 9. The linear trend was significant and negative for both up moves (β10= -
.016, p < .01) and down moves (β10= -.009, p < .01), suggesting that the percentages of both
types of moves tended to decrease over time. Chi-square difference tests for deviance scores
showed Model B was a better fit to the data than Model A. In sum, this exploratory analysis
showed that as time progressed, individuals engaged in a lower percentage of directed
communication toward dyad members that served to assert or acquiesce control. It is important
to note that these data did not include any communication from individuals directed toward the
46
group in its entirety, so results are restricted to include communication where the recipient of the
communication was one particular team member.
Next, I turn to tests of Hypotheses 2a and 2b regarding the effect of complementary and
symmetrical interactions on the outcome of leader-follower relationship emergence. Hypotheses
2a predicted that the percentage of dyadic complementary interacts, collapsed across time, would
be positively associated with the emergence of a leader-follower relationship. Hypotheses 2b
predicted that the percentage of dyadic complementary interacts, collapsed across time, would be
negatively associated with the emergence of a leader-follower relationship. To test these
hypotheses, ICCs were first calculated to determine the degree of nonindependence of the dyadic
outcome variable. The ICC was .060; meaning 6% of the variance in the outcome was due to
team membership. This value is well below the average ICC estimate of .21 reported in the teams
literature (Woehr, Loignon, Schmidt, Loughry, & Ohland, 2015) and is considered a small effect
of variance due team membership (Bliese, 2000; Woehr, et al., 2015). Thus, Hypotheses 2a and
2b were not conducted in a multi-level framework. Next, I conducted a multiple multinomial
logistic regression, where leader-follower relationship emergence was regressed upon both the
percent of complementary interacts and the percent of symmetrical interacts, each collapsed
across time. Recall there were six categories of leader-follower relationships, but only the three
relevant categories are reported: 1) shared leadership (both members agreed they both led; 2)
naught leadership (both dyad members agreed they both followed; and 3) complementary
leadership-followership (both dyad members agreed that one dyad member led and one dyad
member followed. Odds compare the effect of the antecedent on the probability of each possible
outcome category relative to the other. For instance, one the odd ratio in this study represents the
probability that the antecedent (complementary or symmetrical interacts) increased/decreased the

47
likelihood that dyad formed a leader-follower complementary relationship as compared to a
shared leadership relationship.
Table 10 presents the odds for all pairwise combinations of the three outcomes of
interest. Results showed that while controlling for percent symmetrical interacts, the percentage
of complementary interacts was not significantly related to the odds of any outcome
combinations. Thus, a dyad’s percent complementary interacts was not significantly related to
the odds that they formed a complementary leader-follower relationship, and Hypothesis 2a was
not supported. As for Hypothesis 2b, a dyad’s percent symmetrical interacts was also not
significantly related to the odds that they formed a complementary leader-follower relationship
as compared to any other type of relationship. Thus, Hypothesis 2b was not supported. However,
a significant relationship did emerge between the percentage of symmetrical interacts and the
odds of forming a shared leadership relationship versus a naught leadership relationship. That is,
while controlling for complementary interacts, with every one unit increase in the percentage of
symmetrical interacts, the odds that dyads formed a shared leadership relationship were
significantly higher than the odds that they formed a naught leadership relationship (B = 7.634, p
<. 05). It should be noted that the odd ratio for this comparison was questionably large. Thus, as
a confirmation of this finding, a one-way analysis of variance was conducted to test for mean
differences in between leadership relationship groups. Similar results were found for relevant
variables (F(5, 231) = 3.375, p <.05) and are presented in Appendix J.
Hypothesis 3 proposed that the rate of change in complementary interacts over time
(slope) would predict the emergence of leader-follower relationships. However, since Hypothesis
1 was not able to be tested at the level of dyadic interacts, and the theoretical justification for
Hypothesis 3 was based on dyadic interaction, Hypothesis 3 was not able to be tested.

48
Before testing Hypotheses 4-6, which examined the effect of dyadic attributes on the
percent of complementary and symmetrical interactions, ICCs were first calculated on the
interaction variables to determine the degree of nonindependence. The ICC for percent
complementary interacts was .130, and the ICC for percent symmetrical interacts was .260,
meaning approximately 13% and 26% of the variance in percent complementary and
symmetrical interacts, respectively, were attributed to team membership (Model A). Given these
are both relatively high ICC levels, tests of hypothesis 4-6 were conducted in a multi-level
framework, where dyads were nested in teams. To test the effect of each of the dyadic attributes
independently on percent complementary and percent symmetrical interacts, I first added each of
dyadic attributes to the models on their own (Models B-D), then I added all to the models
together (Model E; “full model”). I compared changes in deviances to determine if the full model
was a better representation of the data than each of the individual variable models. Since
Hypotheses 4a, 5a, and 6a all pertained to complementary interacts, and Hypotheses 4b, 5b, and
6c pertained to symmetrical interacts, I first discuss the results of the regressions with
complementary interacts as the outcome, then I discuss the results of the regressions with
symmetrical interacts as the outcome.
Results of regressions of the dyadic level variables on dyads’ percent complementary
interacts are presented in Table 11. Hypothesis 4a predicted that dissimilarity in levels of
dominance would be positively associated with complementary interacts. Results showed that
when dominance dissimilarity levels were modeled on their own, they did not predict the percent
of complementary interacts (Model B; β10= .002, p > .05), suggesting no support for Hypothesis
4a. Hypothesis 5a predicted that dissimilarity in levels of LSE would be positively associated
with the percent of complementary interacts. Results showed that when LSE dissimilarity levels
49
were modeled on their own, they did not predict the percent of complementary interacts (Model
C; β10= .001, p > .05), suggesting no support for Hypothesis 5a. Finally, Hypothesis 6, predicted
that more inter-personal ILT and IFT congruence would be positively associated with the percent
of complementarily interacts. Results showed that when ILT-IFT congruence was modeled on its
own, it did not predict the percent of complementary interactions (Model D; β10= -.034, p > .05),
suggesting no support for Hypothesis 6. Next, I entered in all the dyadic variables into one
parsimonious model (Model E). Chi-square difference tests of the deviance (-2*Log likelihood)
between each of the individual models and the full model showed that the full model (Model E)
was a better fit than each of the individual models. Results of this model (Table 11) aligned with
the individual models, showing that neither dominance dissimilarity (β10= .002, p > .05), LSE
dissimilarity (β10= .001, p > .05), nor ILT-IFT congruence (β10= -.034, p > .05) predicted percent
complementary interacts, failing to support Hypotheses 4a, 5a, and 6.
Turning next to tests of Hypotheses 4b and 5b, pertaining to the outcome of symmetrical
interacts. Results are presented in Table 12. Hypothesis 4b predicted that similarity in levels of
dominance would be positively associated with symmetrical interacts. Results showed that when
dominance dissimilarity was modeled on its own, it was negatively predictive of percent
symmetrical interacts (Model B; β10= -.003, p < .05). This finding suggests that the less
dissimilar (more similar) two dyad members were on dominance, the more likely they were to
engage in symmetrical interacts, and it provides preliminary (dependent on full model) support
for Hypothesis 4b. Hypothesis 5b predicted that similarity in levels of LSE would be positively
associated with the percent of symmetrical interacts. Results showed that when LSE dissimilarity
was modeled on its own, it was negatively predictive of percent symmetrical interacts (Model C;
β10= -.002, p < .05). This suggests that the less dissimilar (more similar) two dyad members were

50
on LSE, the more likely they were to engage in symmetrical interacts, and it provides
preliminary (dependent on full model) support for Hypotheses 5b. While no hypothesis was
made regarding the effect of ILT-IFT congruence on symmetrical interacts due to lack of theory,
I conducted an exploratory test of this relationship. Results showed that when ILT-IFT
congruence was modeled on its own, it did not predict the percent of symmetrical interactions
(β10= .002, p > .05). As with tests of complementary interacts, I next entered in all the dyadic
variables into one parsimonious model (Model E). Chi-square difference tests of the deviance (-
2*Log likelihood) between each of the individual models and the full model showed that the full
model (Model E) was a better fit than each of the individual models. Results from of this model
(Table 12) did not align completely with the individual models, showing that dominance
dissimilarity was not a significant predictor of symmetrical interacts (β10= -.001, p > .05). LSE
dissimilarity, however remained a significant predictor (β10= -.002, p < .05), and ILT-IFT
congruence (β10= .002, p > .05) remained non-significant. Thus, Hypothesis 5a was not
supported, but 5b was supported.
The finding that LSE dissimilarity predicted symmetrical interacts is interesting in that it
showed the more similar people were, the more likely they were to respond to particular
communications with the same type of communication. However, the finding on its own
provides little insight into whether the finding stems from both dyad members being high on
LSE or low on LSE. To shed more light on this question, I conducted a correlation between the
mean level of dyad members’ LSE and their difference scores. Results yielded a significantly
negative correlation (r= -.527, p< .01), meaning the lower the dissimilarity level (higher the
similarity levels) between dyad members, the higher their mean level of LSE. Accordingly, it is
likely the relationship between LSE similarity and symmetrical interacts is likely driven by both

51
dyad members scoring high on LSE.
In sum, in Chapter 4, I described the data collected in this study, established reliability for
all appropriate variables, and presented the results of the tests of the study hypotheses.
Unanticipated issues associated with test of Hypotheses 1 and 3 were also discussed. In the next
chapter, I summarize the overall findings in relation to relevant literature and discuss
implications for advancing the science of leadership emergence, as well as limitations and
opportunities for future research.

52
Chapter 5 – Discussion
5.1 – Summary of Findings and Contributions
The purpose of this study was to advance the science of leadership emergence by taking a
process-oriented approach aligned with the conceptualization of leadership as a socio-relational
process. The overwhelming majority of leadership emergence research focuses on individual
attributes, individual behaviors, and individual perceptions of either leaders or followers
(Yammarino & Gooty, 2017). However, none of these individual factors can feasibly be the
underlying mechanisms of leadership emergence because they make up only one half of the
equation. If informal leaders are only leaders insofar as they are perceived to be so by one or
more others, then understanding how and why leadership emerges in collectives requires a focus
on dyads’ attributes, dyads’ behaviors, and dyads’ perceptions of each other. Such was the
primary focus of this study. By capturing verbal communication patterns among dyads in teams
as they work together in situ, over time, this study is one of the first to test the conceptual linkage
between dyadic attributes, dyadic micro-level interactional processes, and the emergence of
mutual leadership and followership perceptions at a relational level. Results of this study provide
evidence that dyadic attributes, particularly similarity, impact patterns of interactions among
dyad members, and that these patterns of interactions impact mutual perceptions of leadership
and followership, at least within this sample. In addition, this study shows that within this sample
and this context, individuals tended to decrease the frequency with which they directed control
moves (assertion or acquiesce of control) to their peers over time.
Specifically, findings suggest that people in this sample who were more similar in terms
of their self-efficacy as leaders were more likely to engage in symmetrical types of interactions.
In other words, they were more likely to respond to each other’s verbal assertions of control with

53
subsequent assertions of control and to respond to acquiescence of control with subsequent
acquiescences. Furthermore, the more dyads engaged in such symmetrical exchanges, the more
likely they were to both see each other as leaders, than to both not see each as leaders. These two
findings -when taken together with the negative correlation between the mean and dissimilarity
levels of LSE as well as the higher frequency of assertions relative to acquiesences of control-
suggest they are both largely driven by people who both score high on LSE. They likely
accordingly engage in “competitive symmetrical” interactions and thus both see each other as
leaders.
The term “competitive symmetry” carries a negative connotation, as a traditional sense of
“competition” would suggest that dyad members were rivaling over resources, goals or attempts
to the be the leader (Deutsch, 1949), or were trying to beat each other toward those leadership
positions (Festinger, 1954). However, the finding that both members selected each other as
leaders potentially changes the connotation from negative competition to positive sharing. Rather
than treating these interactions as competitions for leadership positions, the argument could be
made that “competitive symmetrical” interactions are manifestations of dyads sharing leadership
positions. An explanation for this notion may be found in the Attraction-Similarity Hypothesis
(Bryne, 1961) in conjunction with Social Exchange Theory (Emerson, 1976). The Attraction-
Similarity Hypotheses claims similar others are attracted to each other and have outcomes for the
individual and team (e.g., Woehr, Arciniega, & Poling, 2013) because their similarity allows for
them to act in trait consistent ways (Bell & Brown, 2015).
Thus, in this study, it is possible that dyads similar in LSE afforded each other the
opportunity to exert assertions of control, or manifestations of their efficacy to lead. Then, when
these assertions were in turn reciprocated with assertions, Social Exchange Theory would

54
suggest that such reciprocal exchanges facilitated positive attraction and toward each other with
regard to leadership potential and task-related rewards (Emerson, 1976). The result of this
process may have likely been the emergence of a shared leadership relationship.
Researchers have advocated for the need for a clearer conceptualization of “shared
leadership,” since its current conceptualization is characterized by numerous slightly different
possible forms of plural leadership (e.g., coordinated leadership, distributed leadership,
sequential leadership) and few consistent measurement approaches (Maupin, McCusker,
Slaughter, Ruark, in preparation). Single item measures of shared leadership provide little insight
into whether leadership is consistently held by both dyad members (i.e., co-leadership; Rittner &
Hammons, 1992) or whether it dynamically shifts between dyad members depending on
situational circumstances (Klein, Ziegert, Knight, & Xiao, 2006). However, as Klein et al. (2006)
show in their study of medical action teams, and as supported with this study, behavioral
observation of leadership as it unfolds in real time provides a fruitful opportunity for
understanding how and when leadership is shared and could provide more insight into aggregate
measures of shared leadership. In addition, understanding how dyads communicate, antecedents
of their communication patterns, and resulting patters of leadership can be useful for fulfilling
organizations’ selection, promotion or training goals. For example, for organizations seeking to
facilitate a shared leadership structure, training employees to engage in symmetrical forms of
communication or selecting employees who have high leadership self efficacy may be opportune
means to do so. Future research examining the relationship between training dyads’
communication patterns and individual/organizational outcomes has high potential utility for
achieving such organizational goals.
While the relationship between LSE similarity and symmetrical interacts as well as the

55
relationship between symmetrical interaction and leadership emergence have so far been
discussed in a positive light, it is important clarify the importance of context and the interactions
of attributes in context. Research shows different traits are relevant, expressed and important in
different contexts (Tett & Burnett, 2003). For example, in high stake situations, or in situations
where only one leader was able to emergence, symmetry in interactions may represent a more
competitive and conflict-based orientation and would likely prevent sharing of leadership roles.
Similarly, different, more contextually relevant attributes might emerge as important for
interactions, such as need for achievement (Spangler, Tikhomirov, Sotak, & Palrecha, 2014). The
context may also be one explanation for the lack of significance of dyadic dissimilarity in
dominance. Given the task allowed for multiple leaders to assume and share leadership, there
was no strong need or demand for dyads to form complementary leader-follower relationships
continuously. Thus, Trait Activation Theory (Tett & Burnett, 2003) would suggest that the
strength of the situation (Michel, 1976) did not elicit the activation that dominance be expressed.
Even given the context, it is still curious that dominance at the dyadic level was not
predictive of interpersonal interactions, as dominance is one of the strongest predictors of
leadership emergence (Judge et al. 2002; Lord et al., 1986). However, the majority of the studies
that have found these effects have neglected the role of time, and research shows that time
matters for the relationship between attributes and leadership emergence. For example,
Bendersky and Shah (2013) showed that people high on extroversion were initially perceived as
leaders, but this perception diminished over time as the extroverts failed to meet expectations of
leadership. Similarly, Kalish and Luria (2016) found that “surface level characteristics” predicted
leadership emergence early on in the teams lifespan, but “deep level characteristics” predicted
leadership emergence in later time periods. With regard to verbal interactions, dominance is a

56
surface level characteristic because dominance is expressed in frequency and type of
communication and is easily perceived by others. Dominant people were likely to assert control
early on in this study, and this may have explained the decrease in assertions of control (up
moves) over time. While dyads’ comparative levels of dominance may have been important
predictors of dyads’ interactions at this time, this study could not examine the relationship
between individual or dyadic variables at different points in time. Rather, this study looked
across time to extend research on surface and deep level characteristics in leadership emergence
to the dyad level. This study shows that for attributes at the dyad level, surface level
characteristics, such as dominance, may not be as important as deep level characteristics, such as
LSE, in predicting dyadic perceptions of leadership.
An opportunity for future research is to replicate this study with different individual
difference variables, using different individual difference variables unaccounted for in this study,
in particular deep level variables such as identity. Individual and relational leader/follower
identity is considered by some to be two are the strongest underlying mechanisms of leadership
emergence (Lord, Gatti, & Chiu, 2016), and they are of central focus in relational identity
construction theory (DeRue & Ashford, 2010).
As for the lack of support for ILT and IFT congruence on dyadic interactions, one
explanation might be regarding the way that “congruence” was conceptualized. In this study,
ILT-IFT congruence was conceptualized as dyads having the same profile of ILT, the same
profile of IFT, or both. While having similar ideas of what a leader should be like and what a
follower should be like may be important for leader-follower relationships because it allows for a
shared understanding of leadership and followership (Van Gils, et al., 2010). Perhaps what is
more important for the emergence of dyadic interactions is the complementarity between a

57
particular ILT profile and a particular IFT profile. For example, those who hold authoritarian
ILTs may also hold passive IFTs and thus interact differently with those they perceive as fitting
one or both of their schemas. Examining the patterns of dyadic congruence in ILTs and IFTs
(Coyle & Foti, Under Review), as well as the impact of such congruence on dyadic interactions
may be fruitful opportunity for future research.
Finally, one explanation for the lack of findings for any complementary interactions may
be their low prevalence, as they made up the smallest portion of coded interactions between dyad
members. This low prevalence does not necessarily suggest that complementary interactions
occurred this infrequently; rather, it means that verbal complementary interactions occurred
relatively infrequently. Take, for example, an assertion of control that is the instruction, “Hey,
Joe, save the document on the shared drive, so that we can all work on it.” Next, Joe shares the
document as he was instructed without verbalizing anything. Unless Joe responded, something
along the lines of “Sure, I’ll do that right now,” the acquiescence of control would not have been
verbally captured. Such is a limitation of relying solely on verbal communication to capture
interactional processes and presents an opportunity to expand this research to include additional
forms of communication, such as nonverbal behavior (e.g., facial expression, physical gesture
and posture) and other paralinguistic features of communication (e.g., communication flow, time
speaking, pitch, tone, and tempo) that can be captured to characterize complementarity in
interactions (Rosen, Kazi, Khaleghzadegan, Dinh, Paoletti, Oswald, & Salas, 2018).
5.2 – Limitations, Strengths, and Future Research
While this study addresses some of the major problems associated with previous
leadership emergence research, it not without its limitations. First, participants for this sample
were undergraduate university students in a classroom, whose individual differences,

58
interactions, and perceptions may differ from working adults in an organization. Thus,
generalizability is of concern. However, with a sacrifice in generalizability comes a substantial
advantage in standardization and control over a number of potentially confounding variables,
such as group size, interaction time, task, context, and context- social (e.g., group composition,
friendship) and environmental. In addition, the relatively unobtrusive nature of audio coding
within the setting of a classroom was more closely aligned with a naturalistic work-related
setting, thus mitigating to a certain extent issues associated with external validity.
Second, although this study moves beyond the traditional cross-sectional leadership
emergence research by including four data points, several temporal issues require
acknowledgement. The inability to examine interacts cross time points prevented the ability to
make a cohesive integration between the first hypotheses and the remaining ones. Perhaps
replicating this research so that communications could be directed toward the group might
increase the number of interacts and allow for a longitudinal of examination of interacts over
time. Additionally, this study did not control for the time lag between each directed utterance.
Instead, I examined the overall sequential patterns of communication between dyad members
without regard for time, similar to previous sequential discourse-based leadership research
involving leadership in teams (Lehmann-Willenbrock et al., 2015). Since the purpose was to
understand how dyads communicate generally, and excluding interacts from the analysis due to
time lag restrictions would have limited the sample more so, I believe the approach taken in this
study addresses the research question while maximizing power. Lags and pauses between verbal
control moves pose interesting questions related to dyadic communication more broadly (Rosen
et al., 2018) and presents an interesting avenue for future research.
Lastly regarding to time, I treated time as four discrete time points, as opposed to a

59
continuously unfolding temporal process occurring within each weekly class. This is aligned
with the vast majority longitudinal research, mainly because most longitudinal methods have not
afforded researchers to ability to treat time otherwise. However, with recent and novel
advancements in technology and dynamic modeling analytical techniques, researchers are
quickly gaining the tools to treat time as a continuous stream of events (Murase et al., 2017;
Wang, Zhang, & Zhou, 2016). One such approach is Relational Event Modeling (Marcum &
Butts, 2015), which could be applied this study. REM a temporally based social network
technique that has the ability to treat all streams of communication within teams as a
continuously unfolding set of directed events and exchanges between dyads. Furthermore, under
the social network framework, additional limitations of dyadic dependences not controlled for in
this study could be measured and accounted for (e.g., triadic effects, popularity effects).
As previously addressed, difference scores between dyad members carry methodological
complications, and this is an issue that has long plagued dyadic level research. While my
supplemental analyses showed adequate reliability based on the recommended strategies, issues
regarding difference scores remain (Edwards, 2010). Unfortunately, the alternative to difference
scores requires large amounts of data that are often challenging to collect and analyze under the
process-oriented communication model of this study. However, collecting other forms of
inherently dyadic data (as opposed to individual differences), such as other dyadic relationships
(e.g., liking, trust) could be incorporated into this study, mitigating difference score problems
while still advancing dyadic level research.
In addition to the future research opportunities discussed so far, this study opens doors for
additional opportunities to conduct exciting future research at additional levels of analysis. For
example, at the team level, interpersonal communication is well recognized as a critical
60
mechanism underlying team phenomena (Mathieu et al., 2008), yet the majority of research
capturing communication at the team level focuses on surface-level communication processes
such as frequency. Capturing the content and meaning of micro-level interactional processes
among all group may provide insight into how leadership is structured in a group (Rosen et al.,
2018) and address more nuances questions about how such leadership structures hinder or
facilitate other critical team processes and states, such as conflict, psychological safety and
cohesion.
5.3 – Conclusion
This study advances the leadership emergence field of research beyond individual, static,
and a-contextual methods that provide little insight into the micro-level interactional processes
underlying the emergence of leadership and followership. Grounded in the notion that leadership
is a socio-relational and perceptual process between dyad members, this study blends qualitative
behavioral coding with quantitative analysis techniques aligned with this conceptualization to
address “how” and “why” questions of leadership emergence. Findings suggest that particular
patterns of dyadic interactions result in different patterns of dyadic leadership relationships,
attributes of dyads impact such interactions, and certain types of interactions may change over
time.
61
References
Alvesson, M., & Kärreman, D. (2000). Varieties of discourse: On the study of organizations
through discourse analysis. Human Relations, 53, 1125-1149.
Alvesson, M., & Spicer, A. (2014). Critical perspectives on leadership. In D. Day (Ed.),
The Oxford Handbook of Leadership and Organizations, (pp. 40-56). New York: Oxford
University Press.
Anderson, D. W., Krajewski, H. T. Goffin, R. D., Jackson, D. N. (2008) A leadership self
efficacy taxonomy and its relation to effective leadership. The Leadership Quarterly, 19,
595-608.
Avolio, B. J., Walumbwa, F. O., & Weber, T. J. (2009). Leadership: Current theories, research,
and future directions. Annual Review of Psychology, 60, 421-449.
Bales, R. F. (1950). Interaction process analysis: A method for the study of small groups.
Cambridge, MA: Addison Wesley Press.
Bales, R. F. (1999). Social interaction systems: Theory and measurement. New Brunswick, NJ:
Transaction Publishers.
Bakeman, R., & Gottman, J. M. (1986). Observing interaction: An introduction to sequential
analysis. Cambridge, UK: Cambridge University Press.
Bakeman, R., Quera, V., & Gnisci, A. (2009). Observer agreement for timed-event sequential
data: A comparison of time-based and event based algorithms. Behavior Research
Methods, 41, 137–147.
Balkundi, P., & Kilduff, M. (2006). The ties that lead: A social network approach to leadership.
The Leadership Quarterly, 17, 419-439.
Barrick, M. R., Stewart, G. L., Neubert, M. J., & Mount, M. K. (1998). Relating member ability

62
and personality to work-team processes and team effectiveness. Journal of Applied
Psychology, 83, 377-391.
Bass, B. M. (1949). An analysis of the leaderless group discussion. Journal of Applied
Psychology, 33, 527–533.
Bendersky, C., & Shah, N. P. (2013). The downfall of extraverts and rise of neurotics: The
dynamic process of status allocation in task groups. Academy of Management
Journal, 56, 387-406.
Bergman, J. Z., Rentsch, J. R., Small, E. E., Davenport, S. W., & Bergman, S. M. (2012). The
shared leadership process in decision-making teams. Journal of Social Psychology, 152,
17–42.
Bliese, P. D., & Ployhart, R. (2002). Growth modeling using random coefficient modeling:
Model building, testing, and illustrations. Organizational Research Methods, 5, 362–387.
Bryne, D. E. (1971). The attraction paradigm. New York: Academic Press.
Carson, R. C. (1969). Interaction concepts of personality. Chicago: Aldine.
Carter, D. R., DeChurch, L. A., Braun, M. T., & Contractor, N. S. (2015). Social network
approaches to leadership: An integrative conceptual review. Journal of Applied
Psychology, 100, 597–622.
Chemers, M. M., Watson, C. B., & May, S. T., (2000). Disposition affect and leadership
effectiveness: A comparison of self-esteem, optimism, and efficacy. Personality and
Social Psychology Bulletin, 26, 267-277.
Cronbach, L. J., & Furby, L. (1970). How we should measure" change": Or should we?.
Psychological bulletin, 74, 68-80.
Connaughton, S., Shuffler, M., & Goodwin, G.F. (2011). Leading distributed teams: the

63
communicative constitution in leadership. Military Psychology, 23, 502-527.
Courtright, J. A., Fairhurst, G. T., & Rogers, L. E. (1989). Interaction patterns in organic and
mechanistic system. Academy of Management Journal, 32, 773-802.
Coyle, P. T., & Foti, R. (2015). If you’re not with me you’re...? Examining prototypes and
cooperation in leader–follower relationships. Journal of Leadership & Organizational
Studies, 22, 161–174.
Coyle, P. T. & Foti , R. J. (Under review). Patterns of congruence implicit theories.
Cronin, M. A., Weingart, L. R., & Todorova, G. (2011). Dynamics in groups: Are we there
yet?. The Academy of Management Annals, 5, 571-612.
Dachler, H. P., & Hosking, D. M. (1995). The primacy of relations in socially constructing
organizational realities. In D. M. Hosking, H. P. Dachler, & K. J. Gergen (Eds.),
Management and organization: Relational alternatives to individualism (pp. 1−29).
Aldershot: Avebury
Day, D. V. (2000). Leadership development: A review in context. Leadership Quarterly,
11, 581-613.
Day, D.V.( 2014). Time and leadership. In A.J. Shipp & Y. Fried (Eds.) Time and Work Volume
2: How Time Impacts Groups, Organizations And Methodological Choices. New York:
Psychology Press.
De La Peña, C.M., Friedlander, M. L., Escudero, V., & Heatherington, L. (2012). How do
therapists ally with adolescents in family therapy? An examination of relational control
communication in early sessions. Journal of Counseling Psychology, 59, 339-351.
DeRue, D. S., & Wellman, N. (2009). Developing leaders via experience: The role of
developmental challenge, learning orientation, and feedback availability. Journal

64
of Applied Psychology, 94, 859-875.
DeRue, D. S. (2011). Adaptive leadership theory: Leading and following as a complex adaptive
process. Research in Organizational Behavior, 31, 125-150.
DeRue, D. S., & Ashford, S. J. (2010). Who will lead and who will follow: A social process of
leadership identity construction in organizations. Academy of Management Review, 35,
627-647.
Deutsch, M. (1949). A theory of co-operation and competition. Human relations, 2, 129-152.
Donnelly, J., Ivancevich, J., & Gibson, J. (1985). Organizations: behavior, structure, processes.
Plano, TX: Business Publications.
Dryer, D. C., & Harowitz, L. M. (1997). When do opposites attract? Interpersonal
complementarity versus similarity. Journal of Applied Psychology, 72(3), 592-603.
Duncan, S., Kanki, B. G., Mokros, H., & Fiske, D. W. (1984). Pseudounilaterality, simple-rate
variables, and other ills to which interaction research is heir. Journal of Personality and
Social Psychology, 46, 1335.
DeRue, D. S. (2011). Adaptive leadership theory: Leading and following as a complex adaptive
process. Research in organizational behavior, 31, 125-150.
Edwards, J. R. (1994). Regression analysis as an alternative to difference scores. Journal of
Management, 20, 683-689.
Edwards, J. R., & Parry, M. E. (1993). On the use of polynomial regression equations as an
alternative to difference scores in organizational research. Academy of Management
Journal, 36, 1577-1613.
Engle, E. M., & Lord, R. G. (1997). Implicit theories, self schemas, and leader-member
exchange. Academy of Management Journal, 40, 988–1010.

65
Epitropaki, O. & Martin, R. (2004). Implicit leadership theories in applied settings: factor
structure, generalizability, and stability over time. Journal of Applied Psychology, 89,
293–310.
Epitropaki, O., & Martin, R. (2005). From ideal to real: a longitudinal study of the role of
implicit leadership theories on leader-member exchanges and employee outcomes.
Journal of Applied Psychology, 90, 659-676.
Epitropaki, O., Sy, T., Martin, R., Tram, S., & Topakas, A. (2013). Implicit leadership and
followership theories ‘In the Wild:’ Taking stock of leadership processing approaches in
organizational settings. The Leadership Quarterly, 24, 858–851.
Fairhurst, G. T. (2007a). Discursive leadership: In conversation with leadership psychology.
Thousand Oaks: Sage.
Fairhurst, G., & Antonakis, J. 2012. Dialogue: A research agenda for relational leadership. In
M. Uhl-Bien, & S. Ospina (Toim.), Advancing relational leadership research. A dialogue
among perspectives (433–459). Charlotte, NC: Information Age Publishers.
Fairhurst, G. T., & Connaughton, S. L. (2014). Leadership: A communicative perspective.
Leadership, 10, 7–35.
Fairhurst, G. T., Green, S. G., & Courtright, J. A. (1995). Inertial forces and the implementation
of a socio-technical systems approach: A communication study. Organization Science, 6,
168–185.
Fairhurst, G. T., & Uhl-Bien, M. (2012). Organizational discourse analysis (ODA):
Examining leadership as a relational process. Leadership Quarterly, 23, 1043-1062.
Festinger, L. (1954). A theory of social comparison processes. Human relations, 7, 117-140.
Fischer, T., Dietz, J., & Antonakis, J. (2017). Leadership process models: A review and

66
synthesis. Journal of Management, 43, 1726-1753.
Fleishman, E. A. (1953). The description of supervisory behavior. Journal of Applied
Psychology, 37, 1-6.
Foti, R. J., Bray, B. C., Thompson, N. J., Allgood, S. F. (2012). Know thy self, know thy leader:
Contributions of a pattern-oriented approach to examining leader perceptions. The
Leadership Quarterly, 23, 702-717.
Foti, R. J., Coyle, P. T. (August, 2015). Patterns of leader and follower perceptions: How are
they related? In T. Dennerlein, & B. Schyns (Chairs), Implicit followership theories and
people’s dispositions as drivers of leadership effectiveness. Symposium presented at the
annual meeting of the Academy of Management conference, Vancouver, BC.
Foti, R. J., & Hauenstein, N. M. A. (2007). Pattern and variable approaches in leadership
emergence and effectiveness. Journal of Applied Psychology , 92, 347–355.
Gooty, J., Serban, A., Thomas, J.S., Gavin, M.B., & Yammarino, F.J. (2012) Use and
misuse of levels of analysis in leadership research: an illustrative review of
leader-member exchange. The Leadership Quarterly, 23, 1080-1103.
Gough, H. G. (1990). Testing for leadership with the California Psychological Inventory. In K.
E. Clark & M. B. Clark (Eds.), Measures of leadership (pp. 355-379). Orange, NJ:
Leadership Library of America.
Grand, J. A., Braun, M. T., Kuljanin, G., Kozlowski, S. W. J., & Chao, G. T. (2016). The
dynamics of team cognition: A process-oriented theory of knowledge emergence in
teams. Journal of Applied Psychology, 101, 1353–1385.
Grant, A. M., Gino, F. & Hofman, D. A. (2011). Reversing the extraverted leadership advantage:
The role of employee proactivity. Academy of Management Journal, 54, 528-550.
67
Hannah, S., Avolio, B. J., Chan, A., & Walumbwa, F. (2012). Leader self and means efficacy: A
multi-component approach. Organizational Behavior and Human Decision Processes,
118, 143–161.
Hannah, S. T., Avolio, B., Luthans, F., & Harms, P. D. (2008). Leadership efficacy: Review and
future directions. The leadership Quarterly, 19, 669-692.
Hirsh, J. B., Mar, R. A., & Peterson, J. B. 2012. Psychological entropy: A framework for
understanding uncertainty related anxiety. Psychological Review, 119, 304–320.
Hogan, R., Curphy, G. J., & Hogan, J. (1994). What we know about leadership: Effectiveness
and personality. American Psychologist, 49, 493–504.
Hollander, E. P., & Julian, J. W. (1969). Contemporary trends in the analysis of leadership
processes. Psychological Bulletin, 71, 387.
Horowitz, L. M. (2004). Interpersonal foundations of psychopathology. Washington, DC:
American Psychological Association.
Humphrey, S. E., Hollenbeck, J. R., Meyer, C. J., & Ilgen, D. R. (2007). Trait configurations in
self-managed teams: A conceptual examination of the use of seeding to maximize and
minimize trait variance in teams. Journal of Applied Psychology, 92, 885-892.
Hunter, S. T., Bedell-Avers, K. E., & Mumford, M. D. (2007). The typical leadership study:
Assumptions, implications, and potential remedies. The Leadership Quarterly, 18, 435-
446.
Jackson, S. E., Brett, J. F., Sessa, V. I., Cooper, D. M., Julin, J. A., & Peyronnin, K.
(1991). Some differences make a difference: Individual dissimilarity and group
heterogeneity as correlates of recruitment, promotions, and turnover. Journal of Applied
Psychology, 76, 675–689.

68
Johns, G. (1981). Difference score measures of organizational behavior variables: A
critique. Organizational Behavior and Human Performance, 27, 443-463.
Judge, T. A., Colbert, A. E., & Ilies, R. (2004). Intelligence and Leadership: A quantitative
review and test of theoretical propositions. Journal of Applied Psychology, 89, 542-552.
Judge, T. A., Piccolo, R. F., & Kosalka, T. (2009). The bright and dark sides of leader
Traits, A review and theoretical extension of the leader trait paradigm. The Leadership
Quarterly, 20, 855-875.
Kalish, Y. (2014). Harnessing the power of social network analysis to explain organizational
phenomena. In J. M. Cortina & R. S. Landis (Eds.), Modern research methods for the
study of behavior in organizations (pp. 99-135). New York: Routledge.
Kalish, Y., & Luria, G. (2016). Leadership emergence over time in short-lived groups:
Integrating expectations states theory with temporal person-perception and self-serving
bias. Journal of Applied Psychology, 101, 1474-1486.
Kiesler, D. J. (1983). The 1982 Interpersonal Circle: A taxonomy for complementarity in human
transactions. Psychological Review, 90, 185– 214.
Klein, K. J., Ziegert, J. C., Knight, A. P., & Xiao, Y. (2006). Dynamic delegation: Shared,
hierarchical, and deindividualized leadership in extreme action teams. Administrative
Science Quarterly, 51, 590-621.
Kolbe, M., Burtscher, M. J., & Manser, T. (2013). Co-ACT—a framework for observing
coordination behavior in acute care teams. BMJ Quality and Safety, 22, 596–605.
Kozlowski, S. W. J., & Ilgen, D. R. (2006). Enhancing the effectiveness of work groups and
teams (Monograph). Psychological Science in the Public Interest, 7, 77-124.
Kozlowski, S. W., & Klein, K. J. (2000). A multilevel approach to theory and research in

69
organizations: Contextual, temporal, and emergent processes. In K.J. Klein & S.W.J.
Kozlowski (Eds.), Multilevel theory, research and methods in organizations:
Foundations, extensions, and new directions (pp. 3-90). San Francisco, CA: Jossey-Bass.
Kozlowski, S. W., Mak, S., & Chao, G. T. (2016). Team-Centric Leadership: An Integrative
Review. Annual Review of Organizational Psychology and Organizational Behavior, 3,
21-54.
Krasikova, D. V., & LeBreton, J. M. (2012). Just the two of us: Misalignment of theory and
methods in examining dyadic phenomena. Journal of Applied Psychology, 97, 739-757.
Langley, A., Smallman, C., Tsoukas, H., & Van de Ven, A. H. (2013). Process studies of change
in organization and management: Unveiling temporality, activity, and flow. Academy of
Management Journal, 56, 1-13.
Lehmann-Willenbrock, N., & Allen, J. A. (2017). Modeling temporal interaction dynamics in
organizational settings. Journal of Business and Psychology, 1-20.
Lehmann-Willenbrock, N., Chiu, M. M., Lei, Z., & Kauffeld, S. (2017). Understanding positivity
within dynamic team interactions: A statistical discourse analysis. Group & Organization
Management, 42, 39-78.
Lehmann-Willenbrock, N., Meinecke, A. L., Rowold, J., & Kauffeld, S. (2015). How
transformational leadership works during team interactions: A behavioral process
analysis. The Leadership Quarterly, 26, 1017-1033.
Light, R. J. (1971). Measures of response agreement for qualitative data: Some generalizations
and alternatives. Psychological Bulletin, 76, 365-377.
Locke, K. D., & Sadler, P. (2007). Self-efficacy, values, and complementarity in dyadic

70
interactions: Integrating interpersonal and social-cognitive theory. Personality and Social
Psychology Bulletin, 33, 94-109.
Lord, R. G., Foti, R. J. & De Vader, C. L. (1984). A test of leadership categorization theory:
internal structure, information processing, and leadership perceptions. Organizational
Behavior & Human Performance, 34, 343-378.
Lord, R. G., Gatti, P. & Chui, S. L. M. (2016). Social-cognitive, relational, and identity-based
approaches to leadership. Organizational Behavior and Human Decision Processes, 136,
119-134.
Lord, R. G., & Maher, K. J. (1991). Leadership and Information Processing: Linking
Perceptions and Performance. Boston, MA: Unwin Hyman.
Marchiondo, L. A., Myers, C. G., & Kopelman, S. (2015). The relational nature of leadership
identity construction: How and when it influences perceived leadership and decision-
making. The Leadership Quarterly, 26, 892-908
Mathieu, J., Maynard, M. T., Rapp, T., & Gilson, L. (2008). Team effectiveness 1997-2007: A
review of recent advancements and a glimpse into the future. Journal of Management, 34,
410-476.
McCormick, M. J., Tanguma, J., & López-Forment, A. S. (2002). Extending self-efficacy theory
to leadership: A review and empirical test. Journal of Leadership Education, 1, 34-49.
McCusker, M. E., Foti, R. J. & Abraham, E. (In press). What’s wrong with leadership research
methods. In R. Riggio (Eds), What’s wrong with leadership (and how to fix it).
McGrath, J. E. (1964). Social psychology: A brief introduction. New York: Holt, Rinehart,
and Winston.
Morgeson, F. P., DeRue, S. D., Karam, E. P. (2010). Leadership in teams: A functional
71
approach to understanding leadership structures and processes. Journal of Management,
36, 5-39.
Morgeson, F. P., & Hofmann, D. A. (1999). The structure and function of collective constructs:
Implications for multilevel research and theory development. Academy of Management
Review, 24, 249-265.
Murase, T., Poole, M. S., Asencio, R., & McDonald, J. (2017). Sequential Synchronization
Analysis. In A. Pilny, M.S. Poole (Eds.), Group Processes (pp. 119-144). Springer,
Cham.
Nicolai, J., Demmel, R., & Farsch, K. (2010). Effects of mode of presentation on ratings of
empathic communication in medical interviews. Patient Education and Counseling, 80,
76–79.
Ng, K., Ang, S. & Chan, K. (2008). Personality and leader effectiveness: A moderated mediation
model of leadership self-efficacy, job demands, and job autonomy. Journal of Applied
Psychology, 92, 733-743.
Oc, B. (2018). Contextual leadership: A systematic review of how contextual factors shape
leadership and its outcomes. The Leadership Quarterly.
Offermann, L. R., Kennedy, J. K. & Wirtz, P. W. (1994). Implicit leadership theories: Content,
structure, and generalizability. The Leadership Quarterly, 5, 43-58.
Omerod, T. C. & Ball, L. J. (2017). Cognitive Psychology. In C. Wililg and W. S. Rogers (eds).
The SAGE Handbook of Qualitative Research in Psychology: Sage: London.
Paglis, L. L. (2010). Leadership self-efficacy: Research findings and practical
applications. Journal of Management Development, 29, 771-782.
Paglis, L. L., & Green, S. G. (2002). Leadership self‐efficacy and managers' motivation for

72
leading change. Journal of Organizational Behavior, 23, 215-235.
Quigley, N. R. (2013). A longitudinal, multilevel study of leadership efficacy development in
MBA teams. Academy of Management Learning & Education, 12, 579-602.
Raudenbush, S. W., & Bryk, A. S. (2002). Hierarchical linear models: Applications and data
analysis methods. Newbury Park, CA: Sage Publications.
Rittner, B., & Hammons, K. (1993). Telephone group work with people with end stage
AIDS. Social Work with Groups, 15, 59-72.
Rogers, L. E., & Escudero, V. (2004). Theoretical foundations. In L. E. Rogers & V. Escudero
(Eds.), Relational communication: An interactional perspective to the study of process
and form (pp. 3–22). London, England: Erlbaum.
Rosen M. Kazi S. Khalegzadegan S. Dinh J. Paoletti J. Oswald F. Salas E. (April, 2018).
Unobtrusive Measures of Team Communication: State of the Science and the Road.
Poster at the 33rd Annual Conference of the Society for Industrial and Organizational
Psychology.
Rosch, E. (1977). Classification of real-world objects: Origins and representations in
cognition. Thinking: Readings in Cognitive Science, 212-222.
Schmid Mast, M. (2010) Interpersonal behaviour and social perception in a hierarchy: The
interpersonal power and behaviour model. European Review of Social Psychology, 21, 1-
33.
Schneider, B. (1987). The people make the place. Personnel psychology, 40, 437-453.
Shamir, B. (2011). Leadership takes time: Some implications of (not) taking time seriously in
leadership research. The Leadership Quarterly, 22, 307-315.
Shin, S. J., & Zhou, J. (2007). When is educational specialization heterogeneity related to

73
creativity in research and development teams? Transformational leadership as a
moderator. Journal of applied Psychology, 92, 1709-1721.
Shondrick, S. J., & Lord, R. G. (2010). Implicit leadership and followership theories: Dynamic
structures for leadership perceptions, memory, and leader-follower processes.
International Review of Industrial and Organizational Psychology, 25, 1-33.
Spangler, W. D., Tikhomirov, A., Sotak, K. L., & Palrecha, R. (2014). Leader motive profiles in
eight types of organizations. The Leadership Quarterly, 25, 1080-1094.
Stogdill, R. M. (1959). Individual behavior and group achievement: A theory; the experimental
evidence. Oxford, England: Oxford University Press.
Stogdill, R. M. (1974). Handbook of Leadership: A Survey of Theory and Research. New York:
Free Press.
Sy, T. (2010). What do you think of followers? Examining the content, structure, and
consequences of implicit followership theories. Organizational Behavior and Human
Decision Processes, 113, 73-84.
Tennenbaum, R., Weschler, I., & Massarik, F. (1961). Leadership and organization.
Tett, R. P., & Burnett, D. D. (2003). A personality trait-based interactionist model of job
performance. Journal of Applied Psychology, 88, 500-517.
Tiedens, L. Z., & Fragale, A. R. (2003). Power moves: complementarity in dominant and
submissive nonverbal behavior. Journal of Personality and Social Psychology, 84, 558-
568.
Tiedens, L. Z., & Jimenez, M. C. (2003). Assimilation for affiliation and contrast for control:
complementary self-construals. Journal of Personality and Social Psychology, 85, 1049-
1061.

74
Tiedens, L. Z., Unzueta, M. M., & Young, M. J. (2007). An unconscious desire for hierarchy?
The motivated perception of dominance complementarity in task partners. Journal of Personality
and Social Psychology, 93, 402-414.
Uhl-Bien, M. (2006). Relational leadership theory: Exploring the social processes of leadership
and organizing. The Leadership Quarterly, 17, 654-676.
Uhl-Bien, M., Riggio, R. E., Lowe, K. B., & Carsten, M. K. 2014. Followership theory: A
review and research agenda. The Leadership Quarterly, 25, 83-104.
van Gils, S., van Quaquebeke, N. & van Knippenberg, D. (2010). The X-factor: On the relevance
of implicit leadership and followership theories for leader-member exchange agreement.
European Journal of Work and Organizational Psychology, 19, 333-363.
van Knippenberg, D., & Hogg, M. A. (2003). A social identity model of leadership effectiveness
in organizations. In R. M. Kramer & B. M. Staw (Eds.), Research in Organizational
Behavior (Vol. 25, pp. 245-297). Amsterdam: Elsevier.
van Knippenberg, D., & Sitkin, S. B. (2013). A critical assessment of charismatic—
transformational leadership research: Back to the drawing board? Academy of
Management Annals, 7, 1-60.
Venkataramani, V., Green, S. G., & Schleicher, D. J. (2010). Well-connected leaders: The
impact of leaders' social network ties on LMX and members' work attitudes. Journal of
Applied Psychology, 95, 1071-1084.
Wang, X., & Peng, J. (2016). The effect of implicit-explicit followership congruence on
benevolent leadership: Evidence from Chinese family firms. Frontiers in Psychology, 7.
Weick, K. (1979). The social psychology of organizing (2nd edition). Reading, MA: Addison-
Wesley.
75
Weiss, M., Kolbe, M., Grote, G., Spahn, D. R., & Grande, B. (2017). Why didn’t you say
something? Effects of after-event reviews on voice behaviour and hierarchy beliefs in
multi-professional action teams. European Journal of Work and Organizational
Psychology, 26, 66-80.
Wellman, E. M. (2013). Enabling shared leadership in hierarchical groups (Doctoral
dissertation, University of Michigan).
Wilgus (2017). Examining the effect of self-monitoring on leader-follower congruence (Master’s
thesis, North Carolina State University).
Wilhelm, C. C., Herd, A. M., & Steiner, D. D. (1993). Attributional conflict between managers
and subordinates: An investigation of leader‐member exchange effects. Journal of
Organizational Behavior, 14, 531-544.
Woehr, D. J., Arciniega, L. M., & Poling, T. L. (2013). Exploring the effects of value diversity
on team effectiveness. Journal of Business and Psychology, 28, 107-121.
Yammarino, F. J., & Gooty, J. (2017). Multi-level issues and dyads in leadership research. In B.
Schyns, R. J. Hall, & P. Neves (Eds.), Handbook of Methods in Leadership Research (pp.
229-255). Gloss, UK: Edward Elgar Publishing, Inc.
Yukl, G. (1989). Managerial leadership: A review of theory and research. Journal of
Management, 15, 251-289.
Zhu, H., Kraut, R. E., Wang, Y. C., & Kittur, A. (2011, May). Identifying shared leadership in
Wikipedia. In Proceedings of the SIGCHI Conference on Human Factors in Computing
Systems (pp. 3431-3434)

76
Appendix A
ILT and IFT Profile Configurations
ILT Configurations
Prototypical Laissez-Faire Autocratic Anti-protypical
Sensitivity High High Low Low
Intelligence High Low High Low
Dedication High Low High Low
Dynamism High Low High Low
Tyranny Low Low High High
Masculinity Low Low High High
IFT Configurations
Exemplary Pragmatic Isolated Passive
Industry High High Low Low
Enthusiasm High Low Low Low
Good Citizen High High Low Low
Conformity High Low Low High
Insubordinate Low High Low High
Incompetence Low High Low High

77
Appendix B
Informed Consent Form
VIRGINIA POLYTECHNIC INSTITUTE AND STATE UNIVERSITY
Consent Form
Title of Study: Team Interaction Processes
Principal Investigator: Neil Hauenstein, Ph.D., Associate Professor, Department of
Psychology, Virginia Tech
Co-Investigator: Maureen McCusker, Graduate Student, Department of Psychology, Virginia
Tech
Thank you for your willingness to participate in my study! Please read the information below
carefully. If you agree to all the terms of the study and would like to proceed, please sign your
name at the bottom of the page to acknowledge your willingness to participate. Thank you very
much!
I. Purpose of this study
The study aims examine the team processes in groups over time. We aim to collect information
on the interactions and behaviors exhibited by group members as develop over the course of the
semester.
II. Procedures
For your class requirements, it is necessary for you to complete all aspects of the two group
project that has been assigned by your instructor. Please ask your instructor for guidelines for the
project if you have not already received them or if you need another copy. If you choose to
participate in this study, your interactions with your group members will be recorded using an
audio recording during class time devoted to working on your group projects. In addition, you
will be asked to complete a series of brief questionnaires that includes the following: a
questionnaire regarding personal demographics and attributes, a questionnaire summarizing
specific events and perceptions from your group, an end-of-the year project assessment. You will
be given time in class to complete each of these, and they will each take less than 15 minutes to
complete.
III. Risks
There are no more than minimal risks associated with participation in this study.

78
IV. Benefits
The results of the study will enhance our understanding of group processes and their effects on
various group-related outcomes.
V. Extent of Anonymity and Confidentiality
Your participation in this study will remain confidential. If you elect not to participate in this
research, you will not be penalized (e.g., grade impact, class standing), and if you elect to
participate, your responses will not impact your grades. Your name will not appear anywhere in
any study report or publication. Any personal information that may reveal your identity (i.e.
consent form) will be separated from your responses to maintain that survey responses remain
anonymous, and only the co-investigator will have access to this information. The research team
will retain all data five years post publication and destroy thereafter.
VI. Compensation
No compensation is being offered for participation.
VII. Freedom to Withdraw
If at any point in the study, you do not feel comfortable continuing, you may withdraw without
penalty. If you choose to withdraw, you will not be penalized by reduction in points or course
grade. You are free not to respond to questions without penalty.
VIII. Permission
If you have read the conditions of this project and voluntary agree to participate in the study,
please sign and date at the bottom of the page.
By signing my name, I acknowledge that I have read the statement and agree to participate
in the study.
Name Date
Neil Hauenstein, Ph.D. 540-231-5716/ [email protected]
Principle Investigator
Maureen McCusker 540-231-5410/[email protected]
Co-Investigator
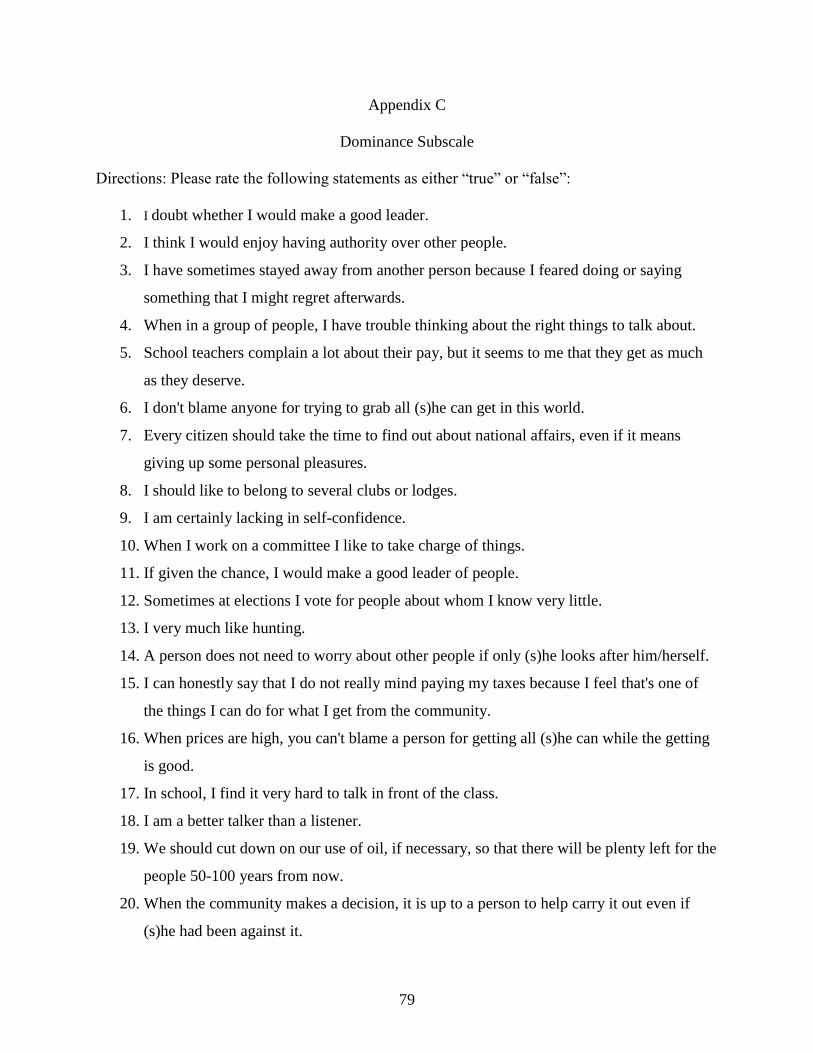
79
Appendix C
Dominance Subscale
Directions: Please rate the following statements as either “true” or “false”:
1. I doubt whether I would make a good leader.
2. I think I would enjoy having authority over other people.
3. I have sometimes stayed away from another person because I feared doing or saying
something that I might regret afterwards.
4. When in a group of people, I have trouble thinking about the right things to talk about.
5. School teachers complain a lot about their pay, but it seems to me that they get as much
as they deserve.
6. I don't blame anyone for trying to grab all (s)he can get in this world.
7. Every citizen should take the time to find out about national affairs, even if it means
giving up some personal pleasures.
8. I should like to belong to several clubs or lodges.
9. I am certainly lacking in self-confidence.
10. When I work on a committee I like to take charge of things.
11. If given the chance, I would make a good leader of people.
12. Sometimes at elections I vote for people about whom I know very little.
13. I very much like hunting.
14. A person does not need to worry about other people if only (s)he looks after him/herself.
15. I can honestly say that I do not really mind paying my taxes because I feel that's one of
the things I can do for what I get from the community.
16. When prices are high, you can't blame a person for getting all (s)he can while the getting
is good.
17. In school, I find it very hard to talk in front of the class.
18. I am a better talker than a listener.
19. We should cut down on our use of oil, if necessary, so that there will be plenty left for the
people 50-100 years from now.
20. When the community makes a decision, it is up to a person to help carry it out even if
(s)he had been against it.

80
21. I would rather have people dislike me than look down on me.
22. I must admit, I try to see what others think before I take a stand.
23. People should not have to pay taxes for the schools if they do not have children.
24. In a group, I usually take the responsibility for getting people introduced.
25. There are times when I act like a coward.
26. I must admit I am a pretty fair talker.
27. I have strong political opinions.
28. I think I am usually a leader in my group.
29. Disobedience to any government is never justified.
30. I enjoy planning things and deciding what each person should do.
31. I would rather not have very much responsibility for other people.
32. I usually have to stop and think before I act, even in trifling matters.
33. It is pretty easy for people to win arguments with me.
34. I have not lived the right kind of life.
35. I have a natural talent for influencing people.
36. I like to give orders and get things moving.
37. I am embarrassed with people I do not know well.
38. The one to whom I was most attached and whom I most admired as a child was a woman
(mother, sister, aunt, or other woman).
39. I am not the type to be a political leader.
40. People seem naturally to turn to me when decisions have to be made.
41. I dislike to have to talk in front of a group of people.
42. I have more trouble concentrating than others seem to have.
43. I find it hard to keep my mind on a task or a job.
44. I would be willing to give money myself in order to right a wrong, even though I was not
mixed up in it in the first place.
45. I would be willing to describe myself as a pretty "strong" personality.
46. I seem to do things I regret more often than other people do.

81
Appendix D
LSE Scale
Directions: Please rate how confident you are in your own abilities on each of the following:
Extremely
Unconfident
(1)
Unconfident
(2)
Slightly
Unconfident
(3)
Neutral
(4)
Slightly
Confident
(5)
Confident
(6)
Extremely
Confident
(7)
Planning
ability (1) o o o o o o o Setting
direction (2) o o o o o o o Delegating
and assigning
tasks (3) o o o o o o o Coordinating
tasks (4) o o o o o o o Ability to
communicate
(5) o o o o o o o Leading by
example (6) o o o o o o o Ability to
motivate
others (7) o o o o o o o Creating team
spirit (8) o o o o o o o Using rewards
and
punishment
(9) o o o o o o o
Confidence to
lead a team
(10) o o o o o o o Overall
leadership
effectiveness
(11) o o o o o o o

82
Appendix E
ILT Scale
Directions: Please take a moment to think about your idea of a typical LEADER in terms of the
characteristics listed below. Then rate how descriptive the characteristics presented are

83
of your idea of a typical LEADER using the scale presented below where 1 is "not at all
characteristic" and 9 is "extremely characteristic."

84
1 (1) 2 (2) 3 (3) 4 (4) 5 (5) 6 (6) 7 (7) 8 (8) 9 (9)
Understanding (1) o o o o o o o o o
Sincere (2) o o o o o o o o o
Compassionate (3) o o o o o o o o o
Helpful (4) o o o o o o o o o
Sensitive (5) o o o o o o o o o
Warm (6) o o o o o o o o o
Sympathetic (7) o o o o o o o o o
Forgiving (8) o o o o o o o o o
Intelligent (9) o o o o o o o o o
Clever (10) o o o o o o o o o
Knowledgeable (11) o o o o o o o o o
Experienced (12) o o o o o o o o o
Wise (13) o o o o o o o o o
Intellectual (14) o o o o o o o o o
Motivated (15) o o o o o o o o o
Dedicated (16) o o o o o o o o o
Hard-working (17) o o o o o o o o o
Bold (18) o o o o o o o o o

85
Dynamic (19) o o o o o o o o o
Strong (20) o o o o o o o o o
Energetic (21) o o o o o o o o o
Charismatic (22) o o o o o o o o o
Domineering (23) o o o o o o o o o
Pushy (24) o o o o o o o o o
Dominant (25) o o o o o o o o o
Manipulative (26) o o o o o o o o o
Conceited (27) o o o o o o o o o
Selfish (28) o o o o o o o o o
Loud (29) o o o o o o o o o
Masculine (30) o o o o o o o o o
Male (31) o o o o o o o o o
Appendix F
IFT Scale
Directions: Please take a moment to think about your idea of a typical FOLLOWER in terms of
the characteristics listed below. Then rate how descriptive the characteristics presented are
of your idea of a typical FOLLOWER using the scale presented below where 1 is "not at all

86
characteristic" and 9 is "extremely characteristic."

87
1 (1) 2 (2) 3 (3) 4 (4) 5 (5) 6 (6) 7 (7) 8 (8) 9 (9)
Hardworking
(1) o o o o o o o o o Productive
(2) o o o o o o o o o Goes above
and beyond
(3) o o o o o o o o o
Excited (4) o o o o o o o o o Outgoing (5) o o o o o o o o o
Happy (6) o o o o o o o o o Loyal (7) o o o o o o o o o
Reliable (8) o o o o o o o o o Team player
(9) o o o o o o o o o Easily
Influenced
(10) o o o o o o o o o
Follows
trends (11) o o o o o o o o o Soft spoken
(12) o o o o o o o o o Arrogant (13) o o o o o o o o o
Rude (14) o o o o o o o o o Bad tempered
(15) o o o o o o o o o Uneducated
(16) o o o o o o o o o Slow (17) o o o o o o o o o

88
Inexperienced
(18) o o o o o o o o o

89
Appendix G
Relational Control Codebook
Form Definitions:
1. Assertion: Any completed referential statement expressed in either the declarative or
imperative format, i.e., a message that has a subject and a verb.
2. Question: Any message that takes an interrogative form.
3. Successful Talk-over: Any interruption or verbal intervention made while another
person is speaking, and successful because the first speaker "relinquishes the floor" after
the second speaker starts talking.
4. Unsuccessful Talk-over: Any interruption or verbal intervention made while
another person is speaking, and not successful because the first speaker continues talking
despite the second speaker's attempt to interrupt.
Mode Definitions:
1. Support: Any utterance giving or asking for agreement, acceptance, encouragement,
approval and/or opinion
2. Nonsupport: Any utterance expressing opposition through resistance, disagreement,
challenge, or rejection
3. Extension: Any utterance continuing the flow or theme of the preceding message,
without containing any control orientation; unsolicited information sharing or asking for
information.
4. Instruction: Any utterance giving a command, directive, order, or unsolicited
suggestion.
5. Answer Support: Any response to a question that gives or seeks agreement
acceptance, encouragement and/or approval
6. Answer Nonsupport: Any response to a question that expresses opposition through
resistance, disagreement, challenge, or rejection.
7. Answer Extension: Any response to a question that continues that contains no control
orientation and/or gives information.
8. Answer Instruction: Any response to a question that gives a command, directive,
order, or suggestion.
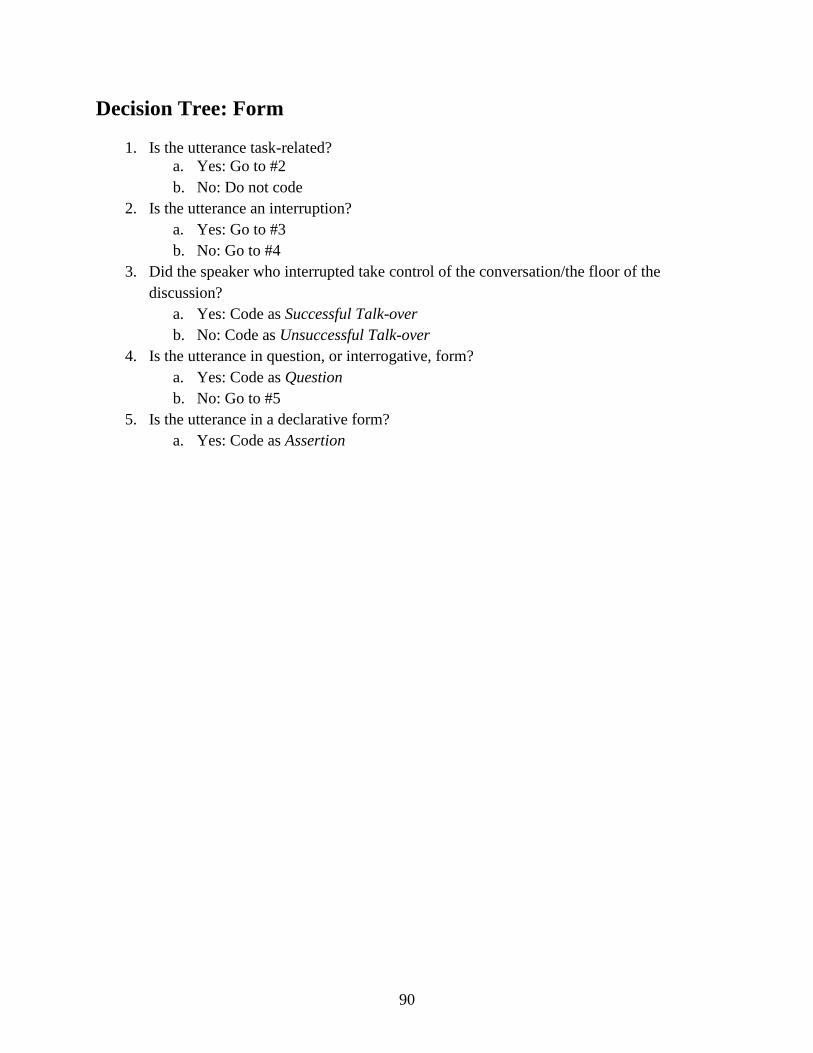
90
Decision Tree: Form
1. Is the utterance task-related?
a. Yes: Go to #2
b. No: Do not code
2. Is the utterance an interruption?
a. Yes: Go to #3
b. No: Go to #4
3. Did the speaker who interrupted take control of the conversation/the floor of the
discussion?
a. Yes: Code as Successful Talk-over
b. No: Code as Unsuccessful Talk-over
4. Is the utterance in question, or interrogative, form?
a. Yes: Code as Question
b. No: Go to #5
5. Is the utterance in a declarative form?
a. Yes: Code as Assertion

91
Decision Tree: Mode
1. Is the utterance an answer to a question?
a. Yes: Go to #6
b. No: Go to #2
2. Is the utterance agreeing, approving or encouraging someone, or is it asking for
approval, opinion, or acceptance?
a. Yes: Code as Support
b. No: Go to #3
3. Is the utterance disagreeing, disapproving, challenging, or rejecting, or is it
confronting/questioning judgments or ideas?
a. Yes: Code as Nonsupport
b. No: Go to #4
4. Is the utterance a demand, command, order, or unsolicited suggestion; is it an
announcement of one’s taking the initiative to do something (e.g., I’m going to do
upload this.)
a. Yes: Code as Instruction
b. No: Go to #5
5. Is the utterance in a continuation of a previous utterance, containing no indication of
asserting or relinquishing control; is it just giving information for the sake of sharing
information; is it asking for information (not asking for opinion or ideas)?
a. Yes: Code as Extension
b. No: Code as Other
6. Is the utterance answering a question by agreeing, approving or encouraging the
previous statement, or is it asking for approval, opinion, or acceptance?
a. Yes: Code as Answer Support
b. No: Go to #7
7. Is the utterance answering a question by disagreeing, disapproving, challenging, or
rejecting, or is it confronting/questioning judgments or ideas?
a. Yes: Code as Answer Nonsupport
b. No: Go to #8
8. Is the utterance answering a question with a demand, command, order, or suggestion?
a. Yes: Code as Answer Instruction
b. No: Go to #9
9. Is the utterance answering a question by giving the requested information or by asking
for more information?
a. Yes: Code as Answer extension
*Code “I don’t know” as Assertion-Answer Extension

Exemplary utterances
Support Nonsupport Extension Instruction Answer Support Answer
Nonsupport
Answer
Extension
Answer
Instruction
Assertion
-I agree with
Sam
-Nice find!
-I like that idea
-Eh, I don’t really
agree with that
-No way, we’ll
fail.
-I don’t know, I
feel like she
doesn’t want that
-Okay so it’s
due Monday.
-She sent us
an email
-I think we
have to type
on the doc.
-I’ll finish this
tonight.
-Lets do job
#2.
-I think your
job is he best
one.
-What if you do
question 1?
--yeah I can do
that.
-What if you do
question 1?
--I think it would
be better for Sam
to do it.
-Where are the
powerpoint
slides?
--they’re on
canvas.
--I don’t know.
-Where are the
powerpoint
slides?
--I will pull them
up.
Question -Can I help you
do that?
-Are you sure
that’s a good idea?
-Is it though?
-What if we did
this instead of
what you
suggested?
-When is his
due?
-Is this online?
-Why is mine
not working?
--How about
you do the
first part?
-I have an
idea.. how
about we do
your job?
-What if you do
question 1?
--Why not?
What if you do
question 1?
--Do you really
think that’s a
good idea?
-What if you do
question 1?
--The ones from
yesterday?
-Where are the
powerpoint
slides?
--Why doesn’t
sam just pull
them up?
Successful
talk-over
-I think we
should do that
first because…
-Yeah good call.
-I think we should
first do…
-Eh, I think it’d be
better to do that
last.
-I think we
should first
do…
-The action
planning
sheet.
-I think we
should first
do…
-Pull up the
document.
-Are you all okay
with first doing…
-Yeah I’m cool
with it.
- Are you all okay
with first doing..
-Eh, I don’t think
so.
- Are you all okay
with first doing..
-doing the task?
- Are you all okay
with first doing..
-You should do it.
Unsucces.
talk-over
-I think we
should do that
first because…
-Yeah good…
….because
that’s what she
said.
-I think we should
first do…
- Eh, I think it’d
be…
-…the planning
sheet.
-I think we
should first
do…
-The action…
-the interview.
-I think we
should first
do…
-Pull up the …
-the interview.
-I think we should
first do…
-Pull up the …
-the interview.
Are you all okay
with first doing..
-eh, I don’t think..
-the interview?
Are you all okay
with first doing..
-like doing the ta-
-the interview?
Are you all okay
with first doing..
-you should…
-the interview?

93
Relational Control Arrows (Moves)
Support Nonsupport Extension Instruction Answer
Support
Answer
Nonsupport
Answer
Instruction
Answer
Extension
Assertion
Question
Successful talk-over
Unsuccessful talk-over

94
Appendix H
Example Transcript of Audio Coded Data
Speaker Recipient Form Mode Arrow
/Move
Person 4 Group “So, let’s figure out what we need to do tod-” Assertion Instruction
Person 1 Person 4 “We need to do the job interview.” Talk-over
Successful Instruction
Person 1 Person 2 “Okay so do you just want to talk about your
job and I’ll write about it?” Question Instruction
Person 2 Person 1 “Yeah that’s fine.”
Assertion Answer Support
Person 3 Group
“Wait did she say we have to, like, write the
whole thing down?”
Question Extension
Person 2 Person 3 “Yeah she said it at the beginning of class.” Question Answer Extension
Person 3 Person 2 “I think she said we don’t have to write it
down.” Assertion Nonsupport
Person 3 Group
“I feel like that would take a lot more time
than we have, maybe we should just write
down the main points.”
Assertion Instruction
Person 1 Person 2 “That works, too.” Assertion Support
Person 1 Person 4 “Sounds good.” Assertion Support

Appendix I
Sociometric Leader-follower Relationship Measures
1. Directions: Thinking back throughout this past semester, please list the names of the group
member(s) you relied on most for leadership. If you did not rely on anyone for leadership, please type
"n/a."
2. Directions: Thinking back throughout this past semester, please list the names of the group
member(s) you led the most. If you did not lead anyone, please type "n/a."

96
Appendix J
Analysis of Variance of Leader-Follower Relationship Emergence on Symmetrical Interacts
Leader-Follower
Relationship
(I)
Leader-Follower
Relationship
(J)
Mean Difference
(I-J) Std. Error
Shared Leadership
Complementary Leader-
Follower Relationship .083 .033
Naught Leadership .127* .043
Complementary
Leader-Follower
Relationship
Naught Leadership .044 .036
*p < .05; Pairwise comparisons conducted using Tukey HSD.

97
Appendix K
Full Results of Multiple Multinomial Logistic Regression of the Effect of Dyadic Interacts on Leader-
Follower Relationship Emergence
Complementary
Interacts
Symmetrical
Interacts
Exp (β) B (SE) Exp (β) B (SE)
Shared leadership vs. Naught Leadership 3.433
1.233
(3.598)
2067.356*
7.634*
(3.156)
Complementary Leadership-Followership vs. Naught
Leadership
.231
4.075
(3.355)
58.837
-1.464
(2.884)
Partial agreement; leadership vs. Naught Leadership 3.0723
1.123
(3.067)
1.951
.668
(2.964)
Partial agreement; followership vs. Shared leadership 5.720 1.744
(2.985)
80.586 4.389
(2.813)
Complete disagreement vs. Symmetrical Followership .137 -1.989
(3.809)
518.965* 6.252*
(3.061)
Complementary Leadership-Followership vs. Shared
leadership
.067 -2.697
(2.877)
.028 -3.559
(2.090)
Partial agreement; followership vs. Shared leadership .895 -.111
(2.629)
.001* -
6.966*
(2.276)
Partial agreement; leadership vs. Shared leadership 1.666 .511
(2.487)
.039 -3.245
(1.982)
Complete disagreement vs. Shared leadership .040 -3.223
3.343)
.251 -1.382
(2.270)
Partial agreement; followership vs. Complementary
Leadership-Followership
.5.162 1.641
(1.891)
.050 -2.994
(1.864)
Partial agreement; leadership vs. Complementary Leadership-
Followership
13.616 2.611
(.626)
1.870 .626
(1.548)
Complete disagreement vs. Complementary Leadership-
Followership
.506 -.681
(2.429)
10.417 2.343
(1.859)
Partial agreement; leadership vs. Partial agreement;
followership
.123 .970
(1.563)
1.147* 3.620*
(1.777)
Complete disagreement vs. Partial agreement; followership .001 -2.322
(2.420)
3.370* 5.337*
(2.103)
Partial agreement; followership vs. Complete disagreement .304 3.292
(2.287)
.005 -1.718
(1.800)
Note. N = 254; *p < .05 ,**p < .01model χ2(10) = 20.547, p < .05; –2 log likelihood = 597.768. Pseudo R2=
0.088.

98
Appendix L
Glossary of Study Variables
Competitive Symmetrical Interact: A pair of sequential one-up moves ()
Complementary Interact: A one-up move, followed by a one-down move, or vice versa (; )
Complementary Leader-follower Relationship: both dyad members agreed that only one dyad
member led and only one dyad member followed
Complete Disagreement: both dyad members disagreed on both members leadership and
followership
Congruence on IFT Only: Dyad members held the same IFT, but held different ILTs
Congruence on ILT Only: Dyad members held the same ILT, but held different IFTs
Follower Claims: The number of team members individuals reported they followed, divided by the
total number of team members minus 1
Full Interpersonal Congruence in ILTs and IFTs: Dyad members held the same ILT and the same
IFT
Full Interpersonal Incongruence in ILTs and IFTs: Dyad members held neither the same ILT, nor
the same IFT
Leader Claims: The number of team members individuals reported they led, divided by the total
number of team members minus 1
Naught leadership relationship: Both dyad members agreed the did not lead each other
Neutralized interact: A pair of one-across moves ()
One-down move (down move): A single sense unit attempting to verbally acquiesce control toward
the recipient ()

99
One-lateral move: A single sense unit attempting neither to neutralize control toward the recipient
()
One-up move (up move): A single sense unit attempting to verbally assert control toward the
recipient ()
Partial agreement, follower: Both dyad members agreed that one of the dyad members followed, but
they disagreed about the other dyad member
Partial agreement, leader: Both dyad members agreed that one of the dyad members led, but they
disagreed about the other dyad member
Shared leadership relationship: Both dyad members agreed they both led each other
Submissive symmetrical interact: A pair of sequential one-down moves ()
Transitory interact: A one-up or one-down, followed by a lateral move (; )

100
Table 1
Results of K-mean Cluster Analysis for ILT and IFT of Entire Sample
ILT
1 (N= 92) 2 (N= 129) 3 (N= 160) 4 (N= 295)
Sensitivity 6.40 7.29 5.73 6.92
Intelligence 7.32 8.11 6.79 7.14
Dedication 8.00 8.71 7.89 8.37
Dynamism 7.10 7.90 6.30 6.50
Tyranny 5.23 4.69 4.40 2.75
Masculinity 7.20 3.50 4.10 1.60
IFT
1 (N= 156) 2 (N= 238) 3 (N= 191) 4 (N= 81)
Industry 3.827 8.048 6.068 6.860
Enthusiasm 4.128 6.811 5.169 6.288
Good Citizen 5.297 8.021 6.948 7.160
Conformity 7.436 4.136 6.028 7.095
Insubordination 3.096 1.532 2.124 4.173
Incompetence 4.259 1.999 2.544 5.272
Note. n= 666.

101
Table 2
Results of K-mean Cluster Analysis for ILT and IFT of Study Sample Only
ILT
1 (N= 16) 2 (N= 35) 3 (N= 32) 4 (N= 39)
Sensitivity 5.780 7.330 5.710 7.130
Intelligence 7.420 8.160 7.060 7.860
Dedication 8.000 8.600 7.640 8.670
Dynamism 7.080 7.950 6.460 6.940
Tyranny 5.480 4.700 4.370 2.840
Masculinity 6.700 3.910 4.360 1.400
IFT
1 (N= 26) 2 (N= 50) 3 (N= 34) 4 (N= 13)
Industry 3.810 8.120 5.980 6.490
Enthusiasm 4.060 6.830 5.100 5.650
Good Citizen 5.550 8.220 7.240 7.290
Conformity 7.670 4.210 6.410 5.840
Insubordination 2.770 4.430 1.980 2.070
Incompetence 5.140 2.270 2.930 3.400
Note. n=122 for ILT; n= 123 for IFT.

Table 3
Categories of Outcome Variable of Leader-follower Relationship
Dyad Member 1
Leads Member 2 Follows Member 2 Disagrees
Dyad
Member 2
Leads Member 1 1. Shared Leadership
Relationship*
3. Complementary Leader-
Follower Relationship*
5. Partial Agreement,
Leadership Relationship
Follows Member 1 3. Complementary Leader-
Follower Relationship*
2. Naught Leadership
Relationship*
4. Partial Agreement,
Followership Relationship
Disagrees 5. Partial Agreement,
Leadership Relationship
4. Partial Agreement,
Followership Relationship 6. Complete Disagreement
Note. * Relationships relevant to study results.

Table 4
Means, Standard Deviations, Intercorrelations and Reliability Coefficients for Individual Level Variables
Variable M SD 1 2 3 4 5 6 7 8
1. Dom 27.843 6.302 (.783)
2. LSE 60.148 10.375 .650** (.913)
3. ILT 6.329 1.044 -.080 -.015 (.874)
4. IFT 6.908 .925 -.177 -.216* - (.925)
5. Up Moves Sent .184 .266 .074 .050 -.028 .082 (.680-.832)
6. Down Moves Sent .141 .221 .144 .174 -.084 .143 -.115 (.680-.832)
7. Total Number Utterances 127.586 90.063 .181 .063 -.045 .108 .024 .027 -
8. Leader Claims .613 .420 .214* .325** -.100 -.120 .072 -.006 .269** -
9. Follower Claims .516 .256 -.065 .039 .052 -.093 .093 .200* -.012 .147
Note. N= 119; *p < .05, **p < .01.Up, Down, and Lateral Moves Sent = total number of directed relational control utterances,
collapsed across time. Reliability coefficients are in parentheses on the main diagonal. Reliabilities for attributes are coefficient alpha.
Reliabilities for arrow types refer to range of Light’s Kappa calculated for all coding. “Leader Claims” and “Follower Claims” refers
to the number of team members individuals reported they led and followed, respectively, divided by the total number of team
members -1.
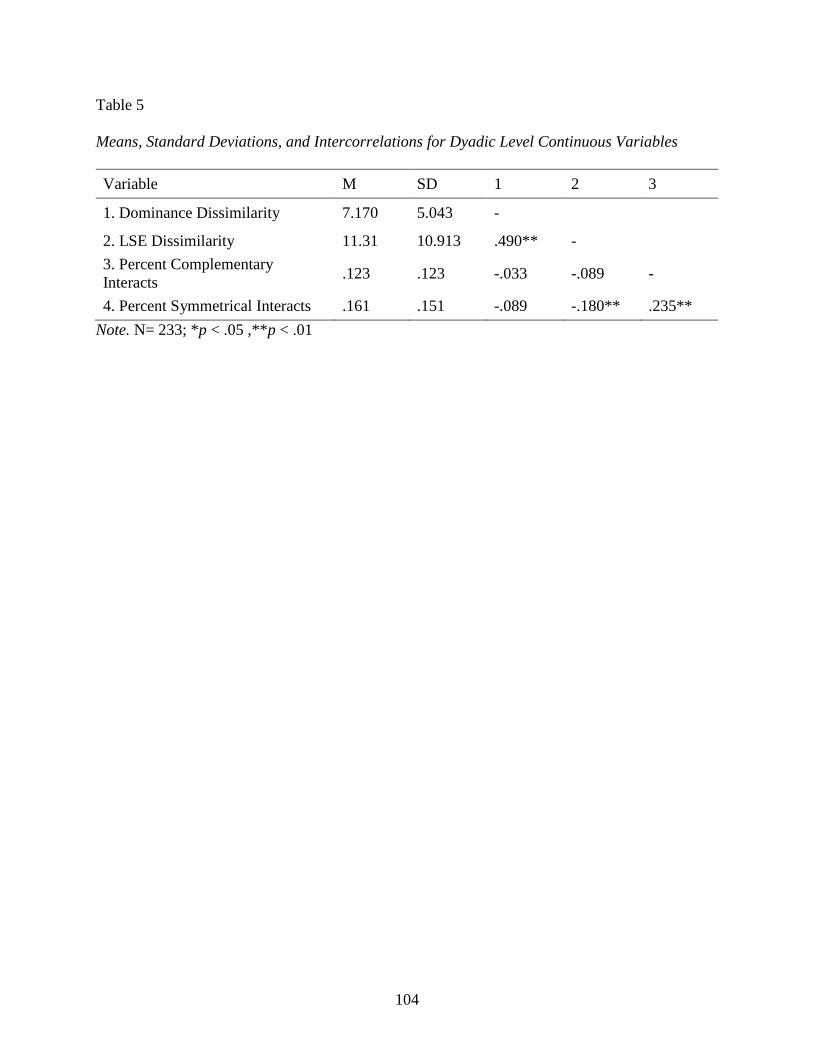
104
Table 5
Means, Standard Deviations, and Intercorrelations for Dyadic Level Continuous Variables
Variable M SD 1 2 3
1. Dominance Dissimilarity 7.170 5.043 -
2. LSE Dissimilarity 11.31 10.913 .490** -
3. Percent Complementary
Interacts .123 .123 -.033 -.089 -
4. Percent Symmetrical Interacts .161 .151 -.089 -.180** .235**
Note. N= 233; *p < .05 ,**p < .01

Table 6
Means of Dyadic Dissimilarity of Dominance and LSE and Percent of Complementary and Percent of Symmetrical Interacts by ILT-
IFT Congruence Categories
ILT-IFT Congruence Dyadic Dissimilarity Dyadic Interacts
N Dominance LSE Percent
Complementary
Percent
Symmetrical
Full incongruence 127 6.760 10.590 .108 .143
Congruence on ILT only 53 6.770 12.190 .123 .163
Congruence on IFT only 44 8.410 11.840 .125 .139
Full congruence 14 6.140 8.430 .123 .141

106
Table 7
Means of Dyadic Dissimilarity of Dominance and LSE and Percent of Complementary and Percent of Symmetrical Interacts by
Leader-follower Relationship Categories
Leader-Follower Relationship Dyadic Dissimilarity Dyadic Interacts
N Dominance LSE Percent
Complementary
Percent
Symmetrical
Shared Leadership Relationship*
(Agreed both led) 20 7.200 6.900 .150 .215
Naught Leadership Relationship*
(Agreed neither led) 16 6.140 10.070 .095 .088
Complementary Leadership-Followership*
(Agreed only one led & one followed) 59 6.730 10.200 .098 .132
Partial Agreement, Follower Relationship
(Agreed one did not lead, disagreed on other) 46 7.540 14.07 .105 .010
Partial Agreement, Leader Relationship
(Agreed one did lead, disagreed on other) 62 7.980 12.81 .138 .156
Complete Disagreement
(Disagreed on both) 30 6.200 9.470 .104 .169
Note. * Relationships relevant to study results

107
Table 8
Results of Regression Analysis Testing Reliability of Dyadic Attribute Difference Scores.
Dominance Dissimilarity
Predictor B
Member 1’s Dominance 1.000**
Member 2’s Dominance -1.000**
W l 0
W l x Member 1’s Dominance -2.000**
W l x Member 2’s Dominance 2.000**
LSE Dissimilarity
Predictor B
Member 1’s LSE 1.000**
Member 2’s LSE -1.000**
W l 0
W l x Member 1’s LSE -2.000**
W l x Member 2’s LSE 2.000**
Note. N = 233; **p < .01

108
Table 9
Results of Hierarchical Linear Regression of Change in Relational Control Moves over Time
Model A Model B
Up
Fixed Effects Intercept (β00)
(SE)
.184**
(.008)
.208**
(.011)
Linear Trend (β10)
(SE)
-.016**
(.004)
Variance Components Intercept (r0i)
(SD)
.023**
(.152)
.030**
(.174)
Linear Trend (r1i)
(SD)
.000
(.016)
Level-1 (e1i)
(SD)
.048
(.220)
.047
(.218)
Deviance 149.105 (3) 129.772 (6)
Δ Deviance 15.690**
Down
Fixed Effects Intercept (β00)
(SE)
.141**
(.006)
.155**
(.009)
Linear Trend (β10)
(SE)
-.009*
(.004)
Variance Components Intercept (r0i)
(SD)
.007**
(.083)
.011**
(.103)
Linear Trend (r1i)
(SD)
.001*
(.023)
Level-1 (e1i)
(SD)
.042
(.205)
.041
(.203)
Deviance -401.886 (3) -409.261 (6)
Δ Deviance 7.38*
Note. N = 466; Model A tests if there exist individual differences in the average frequency of
move type, generally; Model B tests if there exist differences in the change in frequency of move
type over time.

Table 10
Results of Multiple Multinomial Logistic Regression of the Effect of Dyadic Interacts on Leader-
Follower Relationship Emergence
Complementary
Interacts
Symmetrical
Interacts
Exp
(β) B (SE) Exp (β) B (SE)
Complementary Leadership-Followership vs.
Naught Leadership
.231
4.075
(3.355)
58.837
-1.464
(2.884)
Complementary Leadership-Followership vs. Shared
Leadership .067
-2.697
(2.877) .028
-3.559
(2.090)
Shared Leadership vs. Naught Leadership 3.433
1.233
(3.598)
2067.356*
7.634*
(3.156)
N = 254; *p < .05 ,**p < .01model χ2(10) = 20.547, p < .05; –2 log likelihood = 597.768. Pseudo
R2= 0.088.

Table 11
Results of Hierarchical Linear Regression of Dyadic Complementary Interacts on Dyadic Attributes of LSE Dissimilarity, Dominance
Dissimilarity, and ILT-IFT Congruence
Model A Model B
(Dom Diff)
Model C
(LSE Diff)
Model D
(ILT-IFT)
Model E
(All)
Fixed Effects Intercept (β00)
(SE)
.683**
(.023)
. 673**
(.032)
.673**
(.032)
.711**
(.031)
.180**
(.022)
Dom Difference (β10)
(SE)
-.002
(.003)
.002
(.004)
LSE Difference (β10)
(SE)
.001
(.002)
.001
(.002)
ILT-IFT Congruence (β10)
(SE)
-.034
(.020)
.034
(.020)
Variance
Components
Intercept (r0i)
(SD)
.007**
(.086)
.006**
(.079)
.006**
(.076)
.008**
(.089)
.006**
(.076)
Level-1 (e1i)
(SD)
.049
(.223)
.047
(.217)
.047
(.218)
.047
(.216)
.046
(.215)
Deviance -16.930 (3) -27.411 (4) -27.750 (4) -28.220 (4) -32.156 (6)
Δ Deviance 10.451** 10.820** 11.29** 15.226**
N = 254; Model A tests if there exist differences in the mean frequency of complementary interacts, generally; Model B, C, and D test
the effect of the dyadic attributes of Dom, LSE, or ILT-IFT congruence on complementary interacts, respectively and individually.
Model E tests the effect of each of the dyadic attributes on complementary interacts, while controlling for all other dyadic attributes in
the model. Δ Deviance = deviance of estimated model from Model A.

Running Head: COMMUNICATIVE PROCESS OF LEADERSHIP EMERGENCE
111
Table 12
Results of Hierarchical Linear Regression of Dyadic Symmetrical Interacts on Dyadic Attributes of LSE Dissimilarity, Dominance
Dissimilarity, and ILT-IFT Congruence
Model A Model B
(Dom Diff)
Model C
(LSE Diff)
Model D
(ILT-IFT)
Model E
(All)
Fixed Effects Intercept (β00)
(SE)
.161*
(.018)
.021**
(.175)
.177**
(.020)
.157**
(.020)
.180**
(.022)
Dom Dissimilarity (β10)
(SE)
-.003*
(.001)
-.001
(.001)
LSE Dissimilarity (β10)
(SE)
-.002**
(.001)
-.002**
(.001)
ILT-IFT Congruence (β10)1
(SE)
.0021
(.006)
.0021
(.006)
Variance
Components
Intercept (r0i)
(SD)
.006**
(.077)
.005**
(.070)
.005**
(.069)
.006**
(.080)
.005**
(.069)
Level-1 (e1i)
(SD)
.017
(.131)
.012
(.109)
.012
(.108)
.014
(.118)
.012
(.108)
Deviance -232.973 (3) -302.110 (4) -.306.106 (4) -267.859 (4) -306.463 (6)
Δ Deviance 69.137** 73.133** 34.886** 79.490**
Note. Model A tests if there exist differences in the mean frequency of symmetrical interacts, generally; Model B, C, and D test the
effect of the dyadic attributes of Dom, LSE, or ILT-IFT congruence on symmetrical interacts, respectively and individually. Model E
tests the effect of each of the dyadic attributes on symmetrical interacts, while controlling for all other dyadic attributes in the model.
Δ Deviance = deviance of estimated model from Model A. 1 Hypothesis for the effect of ILT-IFT congruence on symmetrical interacts
was not proposed; thus, this test is considered exploratory.
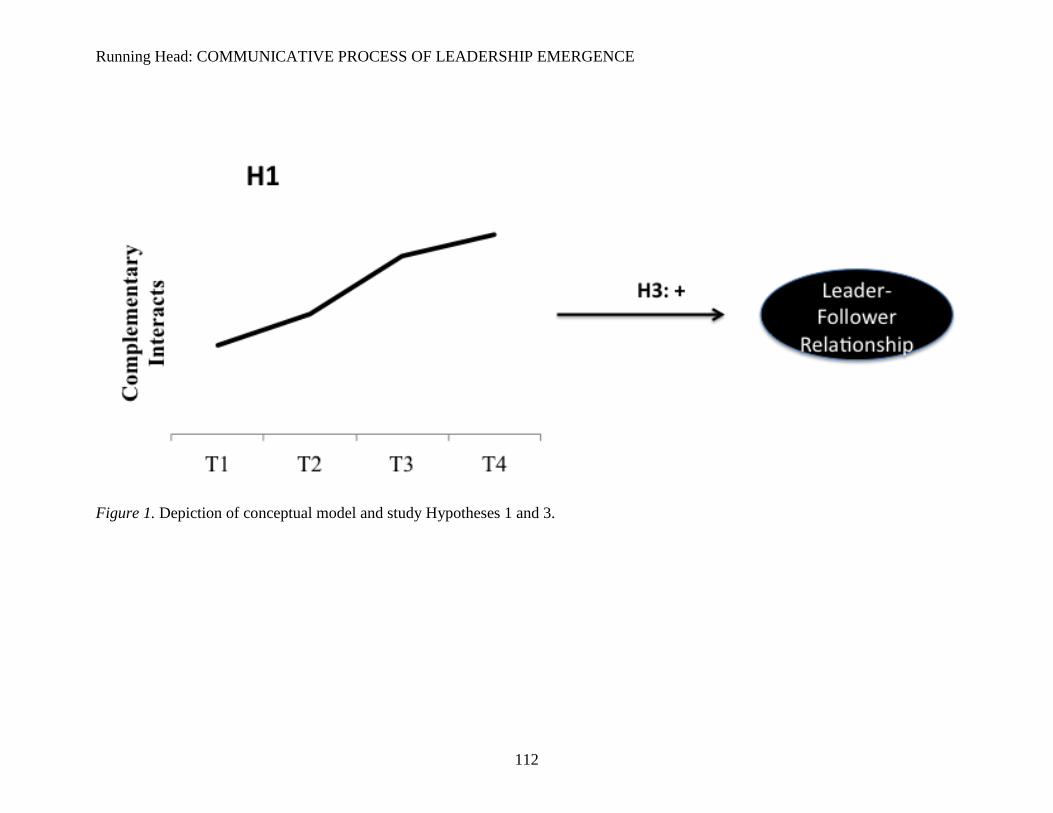
Running Head: COMMUNICATIVE PROCESS OF LEADERSHIP EMERGENCE
112
Figure 1. Depiction of conceptual model and study Hypotheses 1 and 3.
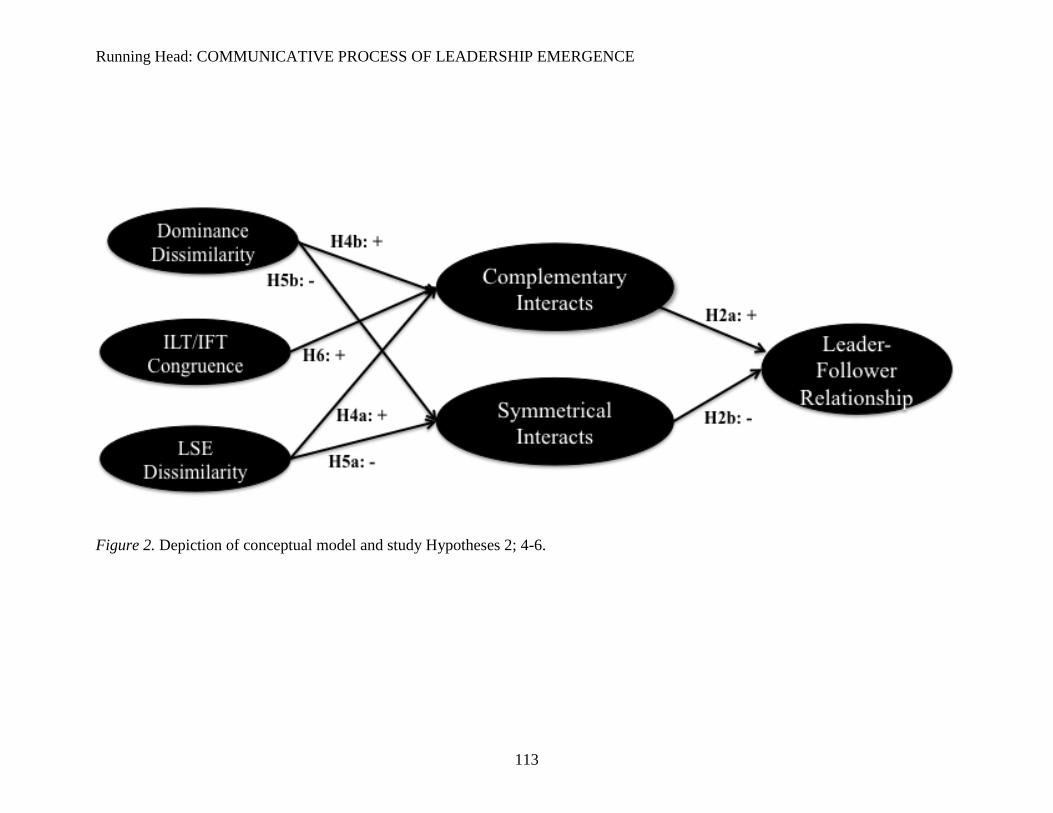
Running Head: COMMUNICATIVE PROCESS OF LEADERSHIP EMERGENCE
113
Figure 2. Depiction of conceptual model and study Hypotheses 2; 4-6.

Running Head: COMMUNICATIVE PROCESS OF LEADERSHIP EMERGENCE
114
Figure 3. Image of coding platform of Mangold Interact program (Mangold, 2010).

Running Head: COMMUNICATIVE PROCESS OF LEADERSHIP EMERGENCE
115
Figure 4. Longitudinal trajectory of percent of relational control moves sent from individuals to dyadic partners.
0.05
0.1
0.15
0.2
0.25
T1 T2 T3 T4
% R
ela
tio
na
l C
on
tro
l M
ov
es S
ent
Time
Up
Down