Investigation of Vehicle Motion on sharp Horizontal Curves combined with steep longitudinal Grades
33
Stergios Mavromatis, Assistant Professor Technological Educational Institute of Athens [email protected] Basil Psarianos, Professor National Technical University of Athens [email protected] Pavlos Tsekos, Research Associate Technological Educational Institute of Athens [email protected] Giorgos Kleioutis, Research Associate Technological Educational Institute of Athens [email protected] Evaggelos Katsanos, Research Associate National Technical University of Athens [email protected]
-
Upload
basil-psarianos -
Category
Engineering
-
view
140 -
download
9
Transcript of Investigation of Vehicle Motion on sharp Horizontal Curves combined with steep longitudinal Grades

Stergios Mavromatis, Assistant Professor Technological Educational Institute of Athens
Basil Psarianos, ProfessorNational Technical University of Athens
Pavlos Tsekos, Research AssociateTechnological Educational Institute of Athens
Giorgos Kleioutis, Research AssociateTechnological Educational Institute of Athens
Evaggelos Katsanos, Research AssociateNational Technical University of Athens
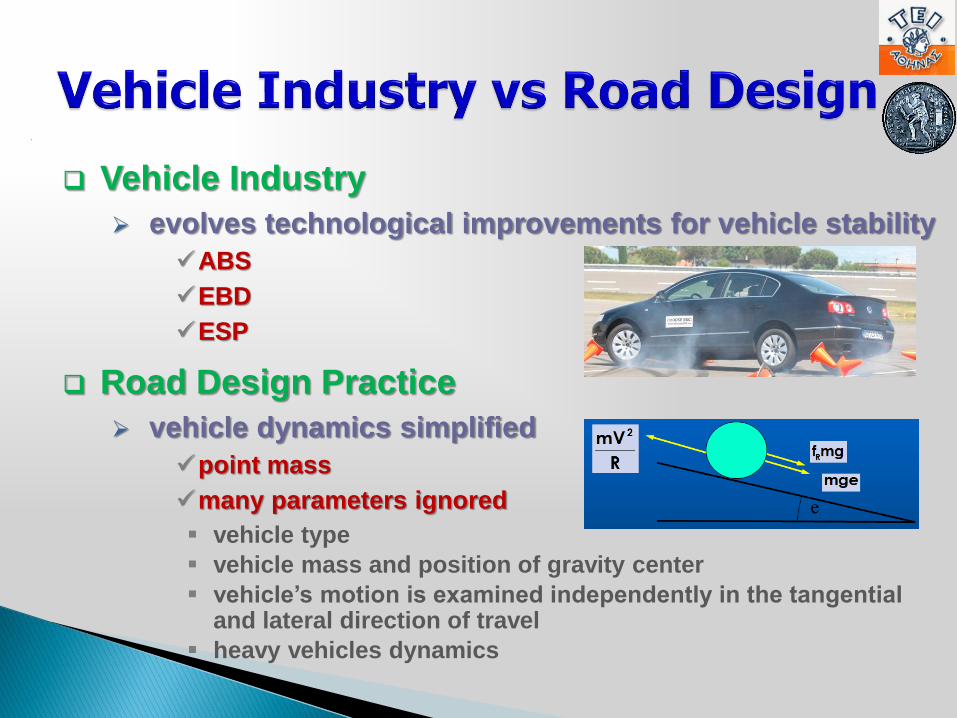
Vehicle Industry
evolves technological improvements for vehicle stability
ABS
EBD
ESP
Road Design Practice
vehicle dynamics simplified
point mass
many parameters ignored
vehicle type
vehicle mass and position of gravity center
vehicle’s motion is examined independently in the tangential and lateral direction of travel
heavy vehicles dynamics

)e+f(127
V=R
maxperm,R
2
min
where
Rmin : minimum curve’s radius (m)
V : vehicle speed – usually design speed (km/h)
emax : maximum superelevation rate (%/100)
m : vehicle’s mass
fR,perm: permissible side friction factor as a portion of peak friction
Parameters Ignored
actual demand of lateral friction
roadway’s longitudinal profile
vehicle dynamics
e.g. loading, driving configuration, horse-power supply

Point Mass Model
adopted in current practice
Bicycle Model
simulates the vehicle by an axle in steady state cornering conditions
Transient Formulation of the Bicycle Model
utilized in cases of variable steering inputs (e.g. lane changes)
Full Multi–Body Vehicle Simulation
used mostly by the automotive industry for vehicle stability prediction
lflrL/R
L
fαrα
fθ
β
L/R
m VR
2
V
Vf
Vr
R

Determine the Safety Hazard
passenger cars in tractive mode
sharp horizontal curves
combined with steep
longitudinal grades
Examine Point Mass
Model’s Adequacy
to Assess
Vehicle Motion

Field Measurements
on Road Section
road geometry elements
tire – road adhesion values
speed data vs driven distance
Correlate Vehicle
Performance against
Existing Vehicle Dynamics
Model
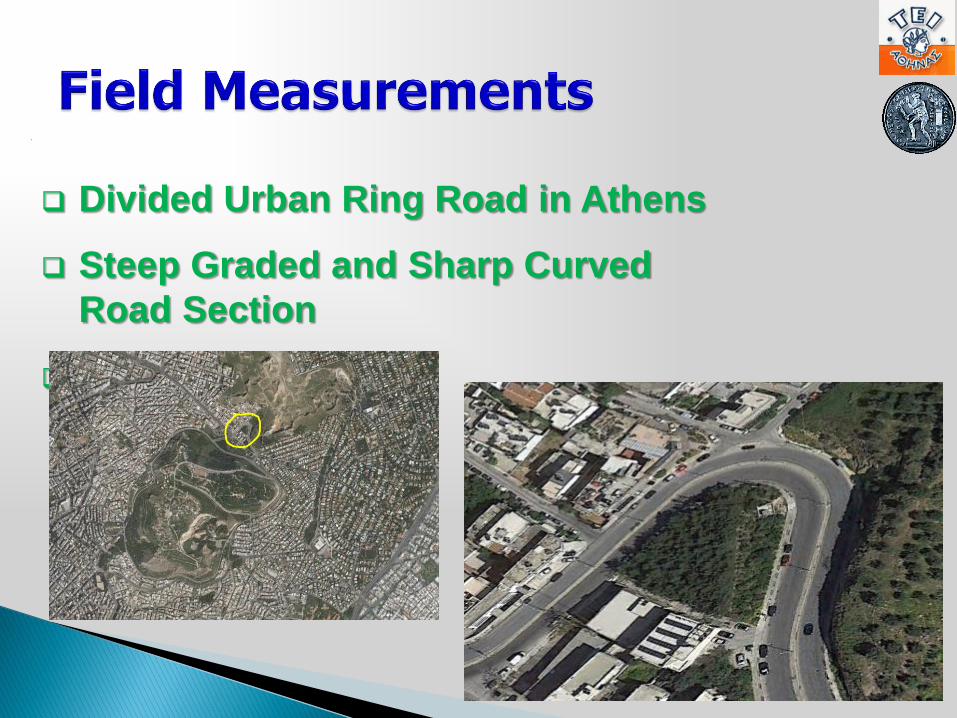
Divided Urban Ring Road in Athens
Steep Graded and Sharp Curved
Road Section

Road Section Surveyed
via Laser Scanner

Road Section Surveyed
via Laser Scanner
median of 1.50m

Road Section Surveyed
via Laser Scanner
median of 1.50m
independent road
geometries representing
vehicle paths
(offset 4.00m from axis)
per vehicle’s
direction of travel

cross - slope
e (%)
0,00 0,00
14,62 R=○○ 2,50
14,62
13,10 A=16,90 2,50 - 5,50 35,78 6,50
27,72 43,73 8,49
48,65 R=21,80 5,50 79,51 11,00
76,37
3,51 A=8,74 2,50 - 5,50
79,87
32,02 R=○○ 2,50
111,90 111,90
upgrade section
horizontal
station (m)
distance
between (m)
horizontal geometry
(A,R) (m)
vertical
station (m)
distance
between (m)
vertical geometry
(K) (m) grade between (%)
32,3911,92
10,8735,78
cross - slope
e (%)
0,00 0,00
18,99
18,99 12,00
16,76
4,10 A=11,05 2,50 - 5,00
20,85
68,16 R=29,80 5,00
89,01
15,30 A=21,35 2,50 - 5,00 89,54 6,50
104,31
13,71 R=○○ 2,50
118,02 118,02
16,76 R=○○ 2,50
downgrade section
horizontal
station (m)
distance
between (m)
horizontal geometry
(A,R) (m)
vertical
station (m)
distance
between (m)
vertical geometry
(K) (m) grade between (%)
70,55 -6,58
28,48
-9,54
-11,04

Test Vehicle
C class passenger car, FWD
(KIA, Proceed)
ABS equipped

Test Vehicle
C class passenger car, FWD
(KIA, Proceed)
ABS equipped
Measuring Device
Accelometer, (Vericom, VC4000)

Test Vehicle
C class passenger car, FWD
(KIA, Proceed)
ABS equipped
Measuring Device
Accelometer, (Vericom, VC4000)
Dry Pavement
Runs
(performed by the same driver)
braking (friction)
driving in tractive mode
(speed vs distance)

Time, Speed and Distance Data

Time, Speed and Distance Data
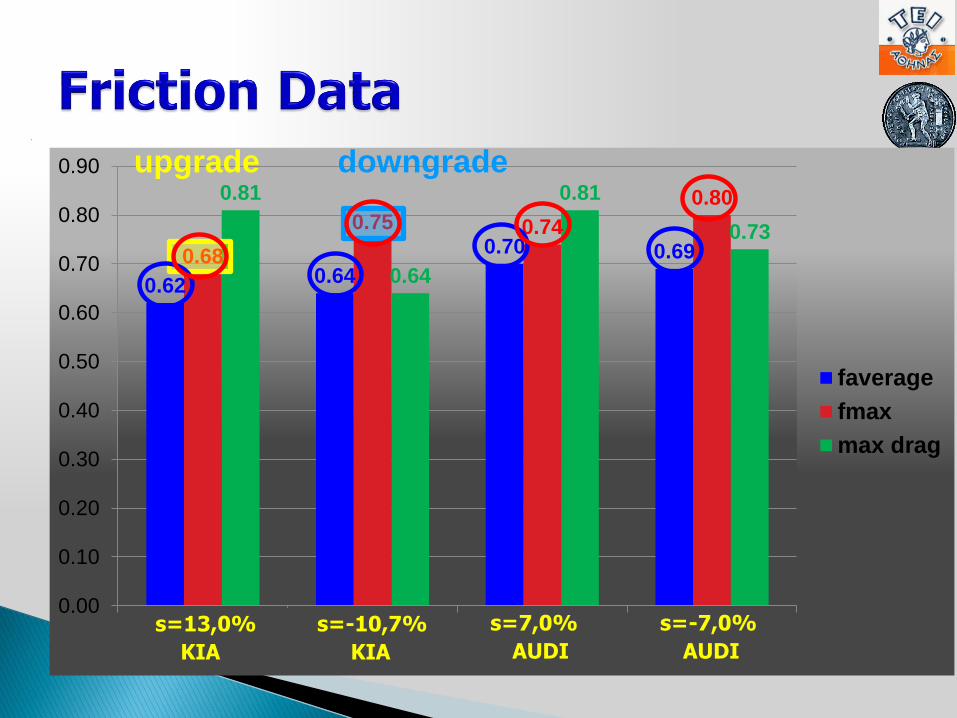
Friction Data
braking runs on tangent sections
and constant grade
drag factor
drag = f + s
where
f: braking friction coefficient
s: roadway’s grade value (%/100) [(+) for upgrades, (-) for downgrades]
0.62 0.64
0.70 0.690.68
0.75 0.74
0.800.81
0.64
0.81
0.73
0.00
0.10
0.20
0.30
0.40
0.50
0.60
0.70
0.80
0.90
s= 13,0%KIA
s= -10,7%KIA
s= 7,0%AUDI
s= -7,0%AUDI
faverage
fmax
max drag
upgrade downgrade
s=13,0%
KIA
s=-10,7%
KIA
s=7,0% s=-7,0%
AUDI AUDI

Parameters Correlated
vehicle technical characteristics
vehicle speed, wheel drive, sprung and unsprung mass
and its position of gravity center, aerodynamic drag,
vertical lift, track width, wheel-base, roll center, vertical
suspension stiffness, cornering stiffness, etc.

Parameters Correlated
vehicle technical characteristics
vehicle speed, wheel drive, sprung and unsprung mass
and its position of gravity center, aerodynamic drag,
vertical lift, track width, wheel-base, roll center, vertical
suspension stiffness, cornering stiffness, etc.
road geometry
grade, superelevation rate,
horizontal radius
tire friction

Four - Wheel Model
Actual Wheel Load
due to
Lateral Load Transfer
Alteration of
Lateral Force
on each Wheel

Vehicle Examined at Impending Skid
Vehicle Speed Variation as a Function of Driven
Distance
Variation of Vehicle Dynamic Parameters
acceleration, horse power utilization, lateral –
longitudinal friction values for every wheel, etc.
Definition of Vsafe (dv/dt=0)

0.00
0.50
1.00
1.50
2.00
2.50
10
20
30
40
50
60
0 10 20 30 40 50 60 70 80 90 100 110 120
dv/d
t(m
/se
c2)
V (
km
/h)
distance (m)
run1
run2
run3
run4
V
dv/dt
R=oo A=16.90 R=21.80 A=8.74 R=oo
Vsafe

0.00
0.50
1.00
1.50
2.00
2.50
3.00
3.50
4.00
4.50
0
10
20
30
40
50
60
70
80
0 10 20 30 40 50 60 70 80 90 100 110 120
dv/d
t(m
/se
c2)
V (
km
/h)
distance (m)
run1
run2
run3
run4
V
dv/dt
R=oo A=11.05 R=29.80 A=21.35 R=oo
Vsafe

0.00
0.10
0.20
0.30
0.40
0.50
0.60
0.70
0 10 20 30 40 50 60 70 80 90 100 110 120
fric
tio
n
distance (m)
fMAX
fTfo model
fRfo model
fTfi model
fRfi model
fR pm
fRri modelR=oo A=16.90 R=21.80 A=8.74 R=oo

0.00
0.10
0.20
0.30
0.40
0.50
0.60
0.70
0.80
0 10 20 30 40 50 60 70 80 90 100 110 120
fric
tio
n
distance (m)
fMAX
fTfo model
fRfo model
fTfi model
fRfi model
fR pm
fRri modelR=oo A=11.05 R=29.80 A=21.35 R=oo

4953
77
86
0
10
20
30
40
50
60
70
80
90
s = 8% s = -8% s = 8% s = -8%
V(k
m/h
)
R=30m R=80m

0.00
0.50
1.00
1.50
2.00
2.50
3.00
3.50
4.00
4.50
5.00
0
10
20
30
40
50
60
70
80
90
100
0 10 20 30 40 50 60 70 80 90 100 110 120
accele
rati
on
(m
/se
c2)
ho
rse p
ow
er
uti
lizati
on
n (
%)
distance (m)
n (%)
dv/dt
R=oo A=11.05 R=29.80 A=21.35 R=oo

Friction Values
Braking Performance of Vehicles
Equipped with ABS,
on Steep Grades
average braking performance
is actually the same
peak friction coefficients higher
on downgrades
Possible Explanation
steep upgrades subject to more
intense road distortion

Determination of Vsafe (model)
Correlation against Field Measurements
model provides accurate results
vehicle drifting on certain upgrade runs
driver’s discomfort reported on downgrades
Critical Wheel for Skidding
inner to the curve
inner front prevails

Point – Mass Model Accuracy in fR
better approximation on upgrade
sections
downgrade section demand greater
portion of lateral friction
point mass model model usually
underestimates the actual friction
requirements especially
on steep grades

Steep Upgrade Road Segments
More Critical
at Impending Skid Conditions
portion of friction is engaged
in the longitudinal direction
of travel causing less friction
availability in the
lateral direction

Vehicle’s Acceleration Safety
Performance at Curve Entrance
vehicles equipped with excessive
amounts of horse power rates must
be driven very conservatively in
sharp horizontal curves combined
with steep vertical grades
previous research findings
confirmed
highlight the increased risk
associated with such alignment
combinations

Investigation in Entire Vehicle Fleet
(SUVs, Heavy Vehicles, etc.)
Analyse in More Detail
the Interaction between Driver – Vehicle
on Sharp Curves and Steep Grades
determine appropriate
horizontal and vertical
alignment combinations