A fuzzy-Bayesian model for supplier selection
11
A fuzzy-Bayesian model for supplier selection Luciano Ferreira a,⇑ , Denis Borenstein b a Science and Technology School, Federal University of Rio Grande do Norte, Brazil b Management School, Federal University of Rio Grande do Sul, Brazil article info Keywords: Supply chain Supplier selection Fuzzy Bayesian networks Influence diagrams abstract The selection supplier problem has received a lot of attention from academics in recent years. Several models were developed in the literature, combining consolidated operations research and artificial intel- ligence methods and techniques. However, the tools presented in the literature neglected learning and adaptation, since this decision making process is approached as a static one rather than a highly dynamic process. Delays, lack of capacity, quality related issues are common examples of dynamic aspects that have a direct impact on long-term relationships with suppliers. This paper presents a novel method based on the integration of influence diagram and fuzzy logic to rank and evaluate suppliers. The model was developed to support managers in exploring the strengths and weaknesses of each alternative, to assist the setting of priorities between conflicting criteria, to study the sensitivity of the behavior of alternatives to changes in underlying decision situations, and finally to identify a preferred course of action. To be effective, the computational implementation of the method was embedded into an information system that includes several functionalities such as supply chain simulation and supplier’s databases. A case study in the biodiesel supply chain illustrates the effectiveness of the developed method. Ó 2012 Elsevier Ltd. All rights reserved. 1. Introduction Nowadays, many companies are organized in supply chains (SC), looking for raw-material sources, transforming them into intermediate and final products, and distributing these products to consumers. The concept of supply chain (SC) presents a systemic approach in which the SC is seen as single entity rather than a set of fragmented components. The idea is to synchronize strategies, activities and operations in a unified manner (Bowersox, Closs, & Cooper, 2002). The modern focus on supply chain management (SCM), with emphasis in relationships between suppliers and buyers, escalated the purchasing process to a strategic level. According to Bowersox et al. (2002), the purchase of goods and services represents the largest single cost for any enterprise. It is estimated that for each dollar a company earns on the sale of a product, it spends about 50–60% on goods and services. More capital is spent on the pur- chase of goods and services to support the business’ operations than on all other expensive items combined. Therefore, much attention now is devoted to supplier selection. Supplier relationship management is a comprehensive long- term approach to managing an enterprise’s interactions with the organizations that supply the goods and services it uses. The goal of supplier relationship management (SRM) is to streamline and make the processes between an enterprise and its suppliers more effective. Within this context, supplier selection is a complex deci- sion making process, being multi-objective in nature; that is, sev- eral and conflicting criteria should be considered and evaluated during the process (Lin, Chuang, Liou, & Wua, 2009). In addition, in long-term relationships, supplier selection decisions are compli- cated by the fact that are not static decisions, at opposite, they are severely affected by the dynamics caused by market prices, capac- ity fluctuation, and uncertain demand. Historically, different approaches have been proposed to evaluate, select and monitor potential suppliers by evaluating mul- tiple criteria, using methodologies and techniques from diverse fields such as operations research, artificial intelligence, and deci- sion analysis theory. Ho, Xu, and Dey (2010) presented a literature review of the multi-criteria decision making approaches for supplier evaluation and selection. The authors pointed out that the most commonly approaches to model the problem are namely data envelopment analysis (DEA), multi-objective programming (MOP), analytic hierarchy process (AHP), case-based reasoning (CBR), fuzzy logic, genetic algorithms (GA), and artificial neural networks (ANN). Chan and Chan (2004) applied AHP to evaluate and select suppliers. Levary (2008) proposed a new AHP model to evaluate disruption risks that a manufacturer’s assembly opera- tion associated with the characteristics of the potential supplier might face. Kull and Talluri (2008) proposed a decision tool for supplier selection in the presence of risk measures and product life 0957-4174/$ - see front matter Ó 2012 Elsevier Ltd. All rights reserved. doi:10.1016/j.eswa.2012.01.068 ⇑ Corresponding author. Tel.: +55 51 3308 4053; fax: +55 51 3308 3991. E-mail addresses: [email protected] (L. Ferreira), [email protected] (D. Borenstein). Expert Systems with Applications 39 (2012) 7834–7844 Contents lists available at SciVerse ScienceDirect Expert Systems with Applications journal homepage: www.elsevier.com/locate/eswa
-
Upload
luciano-ferreira -
Category
Documents
-
view
225 -
download
4
Transcript of A fuzzy-Bayesian model for supplier selection
Expert Systems with Applications 39 (2012) 7834–7844
Contents lists available at SciVerse ScienceDirect
Expert Systems with Applications
journal homepage: www.elsevier .com/locate /eswa
A fuzzy-Bayesian model for supplier selection
Luciano Ferreira a,⇑, Denis Borenstein b
a Science and Technology School, Federal University of Rio Grande do Norte, Brazilb Management School, Federal University of Rio Grande do Sul, Brazil
a r t i c l e i n f o
Keywords:Supply chainSupplier selectionFuzzyBayesian networksInfluence diagrams
0957-4174/$ - see front matter � 2012 Elsevier Ltd. Adoi:10.1016/j.eswa.2012.01.068
⇑ Corresponding author. Tel.: +55 51 3308 4053; faE-mail addresses: [email protected] (L. Fe
(D. Borenstein).
a b s t r a c t
The selection supplier problem has received a lot of attention from academics in recent years. Severalmodels were developed in the literature, combining consolidated operations research and artificial intel-ligence methods and techniques. However, the tools presented in the literature neglected learning andadaptation, since this decision making process is approached as a static one rather than a highly dynamicprocess. Delays, lack of capacity, quality related issues are common examples of dynamic aspects thathave a direct impact on long-term relationships with suppliers. This paper presents a novel method basedon the integration of influence diagram and fuzzy logic to rank and evaluate suppliers. The model wasdeveloped to support managers in exploring the strengths and weaknesses of each alternative, to assistthe setting of priorities between conflicting criteria, to study the sensitivity of the behavior of alternativesto changes in underlying decision situations, and finally to identify a preferred course of action. To beeffective, the computational implementation of the method was embedded into an information systemthat includes several functionalities such as supply chain simulation and supplier’s databases. A casestudy in the biodiesel supply chain illustrates the effectiveness of the developed method.
� 2012 Elsevier Ltd. All rights reserved.
1. Introduction
Nowadays, many companies are organized in supply chains(SC), looking for raw-material sources, transforming them intointermediate and final products, and distributing these productsto consumers. The concept of supply chain (SC) presents a systemicapproach in which the SC is seen as single entity rather than a setof fragmented components. The idea is to synchronize strategies,activities and operations in a unified manner (Bowersox, Closs, &Cooper, 2002).
The modern focus on supply chain management (SCM), withemphasis in relationships between suppliers and buyers, escalatedthe purchasing process to a strategic level. According to Bowersoxet al. (2002), the purchase of goods and services represents thelargest single cost for any enterprise. It is estimated that for eachdollar a company earns on the sale of a product, it spends about50–60% on goods and services. More capital is spent on the pur-chase of goods and services to support the business’ operationsthan on all other expensive items combined. Therefore, muchattention now is devoted to supplier selection.
Supplier relationship management is a comprehensive long-term approach to managing an enterprise’s interactions with theorganizations that supply the goods and services it uses. The goal
ll rights reserved.
x: +55 51 3308 3991.rreira), [email protected]
of supplier relationship management (SRM) is to streamline andmake the processes between an enterprise and its suppliers moreeffective. Within this context, supplier selection is a complex deci-sion making process, being multi-objective in nature; that is, sev-eral and conflicting criteria should be considered and evaluatedduring the process (Lin, Chuang, Liou, & Wua, 2009). In addition,in long-term relationships, supplier selection decisions are compli-cated by the fact that are not static decisions, at opposite, they areseverely affected by the dynamics caused by market prices, capac-ity fluctuation, and uncertain demand.
Historically, different approaches have been proposed toevaluate, select and monitor potential suppliers by evaluating mul-tiple criteria, using methodologies and techniques from diversefields such as operations research, artificial intelligence, and deci-sion analysis theory. Ho, Xu, and Dey (2010) presented a literaturereview of the multi-criteria decision making approaches forsupplier evaluation and selection. The authors pointed out thatthe most commonly approaches to model the problem are namelydata envelopment analysis (DEA), multi-objective programming(MOP), analytic hierarchy process (AHP), case-based reasoning(CBR), fuzzy logic, genetic algorithms (GA), and artificial neuralnetworks (ANN). Chan and Chan (2004) applied AHP to evaluateand select suppliers. Levary (2008) proposed a new AHP modelto evaluate disruption risks that a manufacturer’s assembly opera-tion associated with the characteristics of the potential suppliermight face. Kull and Talluri (2008) proposed a decision tool forsupplier selection in the presence of risk measures and product life
L. Ferreira, D. Borenstein / Expert Systems with Applications 39 (2012) 7834–7844 7835
cycles considerations, combining AHP and goal programming.Chen, Lin, and Huang (2006) utilized an extension version of TOP-SIS (Chen, 2000) for solving supplier selection problems in fuzzyenvironment. Linguistic values are used to assess the ratings andweights for different criteria, such as quality, price, flexibility anddelivery. Hong, Park, Jang, and Rho (2005) designed a mathemati-cal programming model to consider multiple criteria (quantity,price, quantity and delivery) and to evaluate the change in suppli-ers’ capabilities over a period of time. According to the authors, thesuppliers cannot maintain the same conditions of supplying sincethe delivery condition, inventory level and market environmentschange constantly. Narasimhan, Talluri, and Mahapatra (2006) pro-posed a mathematical model to incorporate the product life cycleperspective into strategic selection of suppliers. Valluri and Croson(2005) utilized agent-based simulation to study the performance ofa supplier selection model. The authors used agents to model sup-pliers who learn to produce at their optimal quality levels througha pre-specified system of rewards and punishments administeredby the buyer. Ng (2008) designed a multi-criteria model to maxi-mize the supplier scores. The decision maker must inform the rel-ative importance of each criterion and sort them according withtheir importance. Awasthi, Chauhan, Goyal, and Proth (2009) pre-sented a supplier selection model where each supplier acceptsthe order only if the order size lies between the given minimumand maximum limits. The authors presented a heuristic solutionand experimental results with a set of randomly generated data.Ordoobadi (2009) presented the utilization of fuzzy logic to eluci-date the decision maker’s preferences. These preferences are usedas inputs into the selection process where selection criteria areevaluated and suppliers’ performances are measured. These tasksare accomplished by applying fuzzy set theory.
However, given the complexity of the problem, severalresearchers are focusing on the integration of the above cited tech-niques and methodologies towards effective support tools. Choy,Lee, and Lo (2003) proposed a system called Intelligent SupplierRelationship Management System (ISRMS), using hybrid CBR andANN techniques to select and benchmark potential suppliers.Amid, Ghodsypour, and O’Brien (2006) presented a multi-objectivemodel for the supplier selection problem, in which an asymmetricfuzzy-decision making technique is applied to enable the decision-maker to assign different weights to several criteria. Sevkli, Koh,Zaim, Demirbag, and Tatoglu (2008) applied a similar model. Lau,Lee, Ho, Pun, and Choy (2006) applied ANN for benchmarking thepotential suppliers and GA to determine the best combination ofsuppliers. Celebi and Bayraktar (2008) proposed a supplier evalua-tion method which integrates ANN and DEA. Golmohammadi, Cre-ese, Valian, and Kolassa (2009) developed a model using ANN toselect suppliers, while a genetic algorithm was applied to generateweights and network architecture. Lee (2009) proposes a methodthat integrates fuzzy logic and AHP, taking the following criteriato rank the supplier’s performance into consideration: benefits(quality, flexibility and delivery), opportunities (supplier’s technol-ogy, joint growth and relationship building), costs and risks (sup-ply constraints, supplier’s profile and buyer–supplier constraints).The model considers these four criteria simultaneously. Wangand Yang (2009) also integrated fuzzy logic and AHP, howeverthe proposed solution considers a quantity discount from the sup-plier. Razmi, Rafiei, and Hashemi (2009) developed a fuzzy analyticnetwork process model to evaluate the potential suppliers and se-lect the best one with respect to the vendor important factors, suchas price, quality, finish time, company’s rank, company’s anteced-ents and company’s economic status. Bottani and Rizzi (2008)structured a model that integrates cluster analysis, AHP and fuzzylogic to group and rank alternatives. Ha and Krishnan (2008) out-lined a hybrid method, incorporating AHP, DEA, and ANN intothe evaluation process. Lin et al. (2009) proposed a method that
utilizes the association rule algorithm of data mining and the settheory to find key suppliers. The set theory is used towards avoid-ing exhaustive search over all the supplier set. Shih, Hung, and Lin(2009) developed a model with AAN and fuzzy logic to select sup-pliers, after the training and test of the model, multiple discrimi-nate analyses is applied to compare the accuracy of theclassification. Wu, Zhang, Wu, and Olson (2010) developed a fuzzymulti-objective programming model for supply chain outsourcingrisk management. An algorithm to solve the proposed fuzzy mul-ti-objective programming model was proposed. A very interestingcomparison of three different risk evaluation models namelychance constrained programming (CCP), DEA, and MOP modelsare presented by Wu and Olson (2008). Based on simulations car-ried out with these techniques, they concluded that (i) CCP pro-vides the ability to incorporate uncertainty directly into models;(ii) DEA guarantees nondominated solutions, but do not incorpo-rate decision maker preference functions into the models; and(iii) MOP provides flexibility for decision makers to reflect theirpreferences over different criteria.
Although these supplier selection models and tools have usefuland interesting principles, the majority of them neglect the dy-namic aspects of this problem. Learning and adaptation are keyrequirements for supplier selection models. Talluri and Sarkis(2002) demonstrated that it is difficult for suppliers to maintainthe same capability condition during all supply periods, especiallyin industries which have seasonal demands and experience awide fluctuation of capability conditions over periods of time. Dy-namic changes of the environment must be supported by aneffective supplier selection model. Furthermore, the process ofgenerating criteria, validate them and determine their weightsis a challenging task in models such as AHP, ANP, MOP andDEA (Aissaouia, Haouaria, & Hassinib, 2007; De Boer, Labro, &Morlacchi, 2001; Golmohammadi et al., 2009; Ng, 2008). There-fore, there is a space for the development of new approaches to-wards effective support in the selection of suppliers in SC, mainlyfor long-term relationships, characterized by the occurrence ofseveral dynamic events.
This paper contributes to the state-of-art of the supplier selec-tion problem, presenting a novel approach that combines influencediagram (ID) and fuzzy logic to select suppliers, emphasizing thedynamics characteristics of a long-term relationship with suppli-ers. ID extends the scope of Bayes network to decision models(Shachter, 1986). The state of each node of the influence diagramcan be represented by linguistic fuzzy variables, allowing to over-come the vagueness and imprecision of the information and reducethe model complexity. The first advantage of ID is to model deci-sion problems in a graphical manner. This feature facilitates thevalidation process and promotes greater understanding by deci-sion makers. The ID’s notation supports the decision maker tochoose the structure that best represents his/her perception aboutthe supplier selection process. It is possible to estimate and evalu-ate the consequences of the weights of each criterion with the useof specialized tools (Hugin�, for example). The probabilistic natureand hierarchical structure of the IDs is an additional advantage thathelps in the simultaneous treatment of learning, adaptation, riskand multiple-criteria, since it represents knowledge in domainsof uncertainty and provides a probabilistic approach to learning.As any time, the probability distribution reflects the current beliefof the agent about the state of the model. A prior probability distri-bution reflects the agent’s belief before any observation is made,and a posteriori probability distribution reflects the agent’s beliefafter observation. Belief updating refers to the computation carriedout by the agent to update its prior belief to its posteriori belief(Xiang, 2003). Moreover, probabilistic methods, such as ID, provideconsistent requirements for the choice of actions. They are basedon normative knowledge, that is, judgments about values,
7836 L. Ferreira, D. Borenstein / Expert Systems with Applications 39 (2012) 7834–7844
preferences, and desirability; and represent reliable abstractions ofhuman experience.
The remainder of this paper is organized as follows. The nextsection introduces a brief review of fuzzy sets and influence dia-grams. Section 3 presents a complete description of the logicalstructure of the proposed method. In order to illustrate the effec-tiveness and applicability of the developed approach, a case studyis presented in Section 4. Finally, Section 5 is reserved for conclu-sions and future works.
2. Theoretical background
Before describing the developed method, we introduce somedefinitions and notation related to fuzzy logic and influence dia-grams. They are widely used in Section 3.
2.1. Fuzzy sets
In this section we briefly review some definitions of fuzzy setaccording to Zimmermann (1991), Ross (2004) and Cheng (1998).
Definition 2.1.1. A fuzzy set eA in universe of discourse X is a set ofordered pairs eA ¼ fðx;leAðxÞÞjx 2 Xg where leAðxÞ is called mem-bership function or grade of x in eA.
Definition 2.1.2. The a-cut of fuzzy number ~k is defined as~k ¼ fxi : l~aðxi P a; xi 2 Xg, where ain½0;1�
Definition 2.1.3. A fuzzy set eA is convex if l~Aðkx1 þ ð1� kx2ÞPminðl~Aðx1Þ;leAðx2ÞÞ; x1; x2 2 X; k 2 ½0;1�. Alternatively, a fuzzy setis convex if all a-levels sets are convex.
Definition 2.1.4. A fuzzy set eA is called a normal fuzzy set if9xi 2 X;leAðxiÞ ¼ 1. Alternatively, a fuzzy set is convex if all a-levelssets are convex.
Definition 2.1.5. A fuzzy number ~k is normalized ifsupx2Xl�kðxÞ ¼ 1, where X is the universe of discourse.
Definition 2.1.6. A linguistic variable is one whose values are notnumbers but rather words or sentences in a natural or artificiallanguage, such as ‘‘high’’, ‘‘average’’ and ‘‘low’’.
Definition 2.1.7. A trapezoidal fuzzy number ~k is a convex andnormal set defined as ~k ¼ ðn1;n2;n3;n4;1Þ. The membership func-tion, l~kðxÞ is defined by Cheng (1998) as
l~kðxÞ ¼
f L~kðxÞ; a 6 x 6 b
1; b 6 x P c
f R~kðxÞ; c 6 x P d
0; otherwise
8>>>><>>>>:
where f L~kðxÞ : ½a; b� ! ½0:1� and f R
~kðxÞ : ½c;d� ! ½0:1�. Since f L
~kis con-
tinuous, strictly increasing and its inverse function exists, f R~k
is con-tinuous, strictly decreasing and its inverse functional also exists. Ifb = c, then ~k is called a triangular fuzzy number.
Definition 2.1.8. The centroid point ð�x0; �y0Þ for a fuzzy number ~k isdefined by Cheng (1998) as
�x0ð~kÞ ¼R b
a ðxf L~kÞdxþ
R cb xdxþ
R dc ðxf R
~kÞdxR ba ðf L
~kÞdxþ
R cb dxþ
R dc ðf R
~kÞdx
�y0ð~kÞ ¼R 1
0 ðygL~kÞdyþ
R 10 ðygR
~kÞdyR 1
0 ðgL~kÞdyþ
R 10 ðgR
~kÞdy
Definition 2.1.9. The distance index between an original fuzzynumber and its centroid is defined by Cheng (1998) as
Rð~AÞ ¼ffiffiffiffiffiffiffiffiffiffiffiffiffiffiffiffiffiffiffiffiffiffiffiffiffiffiffið�x0Þ2 þ ðy0Þ
2q
ð1Þ
Thus, for any fuzzy numbers ~Ai, ~Aj 2 S, where S ¼ f~A1; ~A2; . . . ; ~Ang is aset of convex fuzzy numbers, the fuzzy number ranking has the fol-lowing properties:
(1) If Rð~AiÞ < Rð~AjÞ, then ~Ai < ~Aj,(2) If Rð~AiÞ ¼ Rð~AjÞ, then ~Ai ¼ ~Aj, and(3) If Rð~AiÞ > Rð~AjÞ, then ~Ai > ~Aj;
2.2. Influence diagrams
An influence diagram (ID) is a network with directed arcs andno cycles. The nodes represent random variables and decisions.Arcs into random variables indicate probabilistic dependence,while arcs into decisions specify the information available at thetime of decision. The diagram is compact and intuitive, emphasiz-ing the relationships among variables and representing a completeprobabilistic description of the problem. The influence diagram(ID) has been designed as a knowledge representation to reducethe gap between analysis and formulation, more specifically to-wards the simplification of modeling and analysis of decision trees.It is intuitive enough to communicate with the decision makersand experts and, at the same time, precise enough for normativeanalysis (Shachter, 1986).
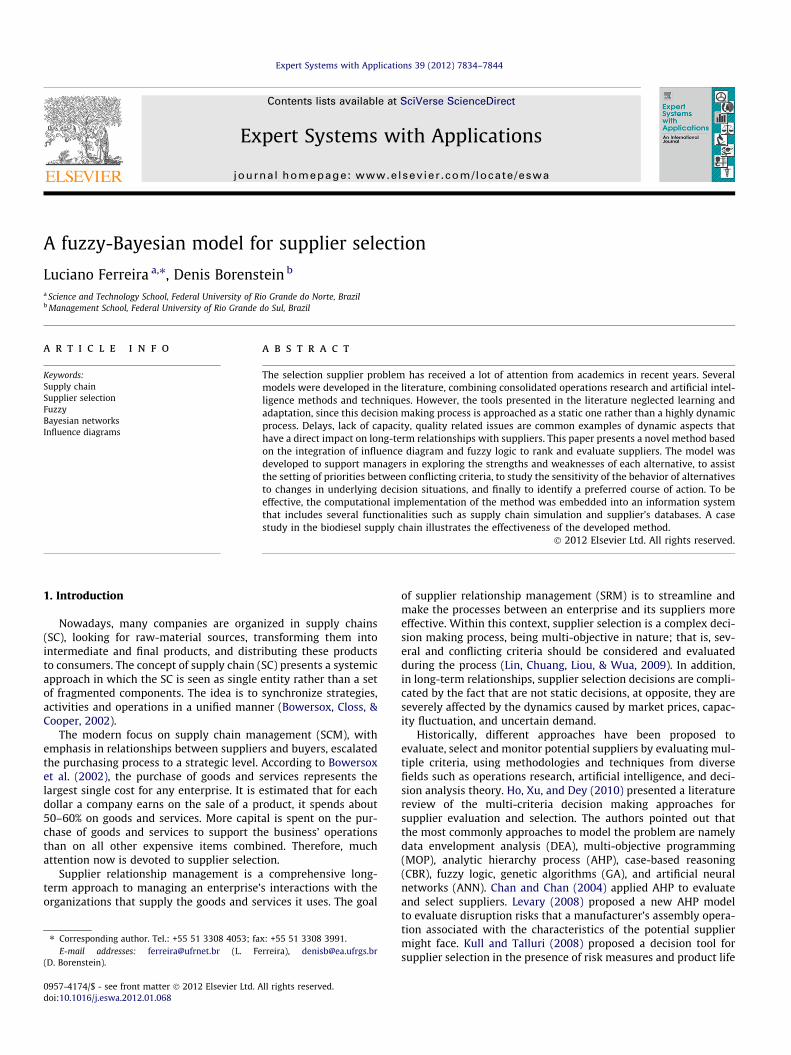
ID can be mathematically defined as a directed acyclic graphG = (N, A), where N represents the nodes. N can be partitioned intosets D, C and V. There is at most one value node m e V, drawn as adiamond, which represents the objective to be maximized. Thereare zero or more chance nodes in set C, represented by circles(we use rectangles when it is necessary to show the probabilities,as in Fig. 1), representing random variables (or uncertain quanti-ties). Finally, there are zero or more decision nodes in set D, drawnas squares, corresponding to choices available to the decision ma-ker. A represents the set of arcs, indicating dependency betweenthe nodes.
Suppose that in the decision maker’s problem there is a variableXi associated with each node i e N in the graph, and a set Xi of pos-sible values it may assume. If i is a value node, then Xi express thedesirability of a state of nature and its domain Xi e R. Each valuenode i has an associated utility function which represents the ex-pected utility as a function of the values of the conditioning prede-cessors of node i. If i is a chance node, then ~Xi is a fuzzy setrepresenting the different states that Xi can assume. Each node ihas a conditional probability table which quantifies the effect ofits parents (or predecessors) on it. For purpose of simplification,we do not utilize decision nodes in the proposed method, sincewe associate an ID to each supplier.
Classical Bayesian decision methods presume that future statesof nature can be characterized probabilistically. However, theBayesian method can be further extended to include fuzzy statesof nature (Ross, 2004). Suppose the new information, ~X ¼ f~x1; ~x2;
. . . ; ~xrg is a universe of discourse. It is possible to define fuzzyevents on this information, such as ‘‘good’’ information, ‘‘moder-ate’’ information and ‘‘poor’’ information. The fuzzy event will havemembership function l ~MðxkÞ; k ¼ 1;2; . . . ; r. Thus, a probability of afuzzy event ~M can defined as
ServiceLevelELVLLAHVHEH
0 0 0
3.0026.843.926.3
1.16 ± 1.8
leadTimeELVLLAHVHEH
0 0
10.020.020.025.025.0
4.35 ± 1.3
SupplierPerformance
CostELVLLAHVHEH
010.010.040.015.015.010.0
3.45 ± 1.4
complianceWithQuantityELVLLAHVHEH
0 0 0
26.753.36.6713.3
4.07 ± 0.93
complianceWithDueDateELVLLAHVHEH
0 0
10.010.030.025.025.0
4.45 ± 1.2
Fig. 1. Example of influence diagram.
L. Ferreira, D. Borenstein / Expert Systems with Applications 39 (2012) 7834–7844 7837
Pð ~MÞ ¼Xr
k¼1
l ~MðxkÞpðxkÞ ð2Þ
Additionally, let S = {S1, S2, . . . , Sn} be a set of state of nature, theposterior probability of a state si, given fuzzy information ~M, is
Pðsij ~MÞ ¼Pð ~MjsiÞpðsiÞ
Pð ~MÞð3Þ
where
Pð ~MjsiÞ ¼Xr
k�1
l ~MðxkÞpðxkjsiÞ ð4Þ
According to Ross (2004), we can extend the Bayesian approachto consider fuzzy information, provided that the fuzzy events onthe new information universe are orthogonal, i.e.,
Prk¼1l ~MðxkÞ ¼ 1,
for all xk e X.
3. Developed method
3.1. Supplier selection method
The supplier selection in supply chain system is by nature agroup multiple-criteria decision making problem, which may bedescribed by means of the following sets,
(1) A set of K decision-makers called E = {D1, D2, . . . , Dk}.(2) A set of m suppliers called A = {A1, A2, . . . , Am}.(3) A set of n criteria, C = {C1, C2, . . . , Cn}, with which supplier
performance are measured.(4) A vector ~W ¼ ð~w1; ~w2; . . . ; ~wnÞ related to the weight of the
criteria, according with the judgment of the decision-makers.
(5) A vector of performance ratings of supplier Ai(i = 1, 2, . . . , m)with respect to criteria Cj{j = 1, 2, . . . , n} called ~X ¼ ð~xi;j; i ¼1;2; . . . ;m; j ¼ 1;2; . . . ;nÞ.
Based on the definitions presented in the previous section, andin the formulation of the problem above, we summarize the fol-lowing steps to evaluate suppliers:
Step 1: Translate the company’s strategy into a set of criteria toevaluate suppliers. The main objective is to define a set C of criteria(or attributes) for supplier selection and their hierarchical relation-ship. This task might require the formation of a multi-disciplinarycommittee of experts involved on the problem. The definition ofthe criteria is one of the most difficult tasks in any decision makingprocess. Although there is no universal method described in the lit-erature to generate and structure a set of criteria, Keeney points outimportant evaluation aspects when carrying out this task as fol-lows: (i) criteria should be meaningful indicators of performance;(ii) the definition of the attribute should be concise and clear; (iii)the set of criteria must address all the critical aspects of a problem;and (iv) the set of criteria should be defined in a such a way that thesame dimension is not measured by several different and indepen-dent criteria in the criteria structure. A good starting point is to lookfor support in previous work in the area. Several criteria lists havealready been generated by several researchers such as Ho et al.(2010), De Boer et al. (2001), Wu et al. (2010) and Lee (2009).
Step 2: Construct an ID, identifying the nodes of chance, the va-lue of nodes and arcs, as defined in Section 2.2. Fig. 1 presents anexample of an ID for supplier selection with five criteria as follows,delivery lead time, compliance with promised quality, compliancewith the due date, supplying costs, and service level. It should benoticed that the first three criteria influence and characterize theperformance of the criterion service level, clearly denoting a hier-archy relationship.
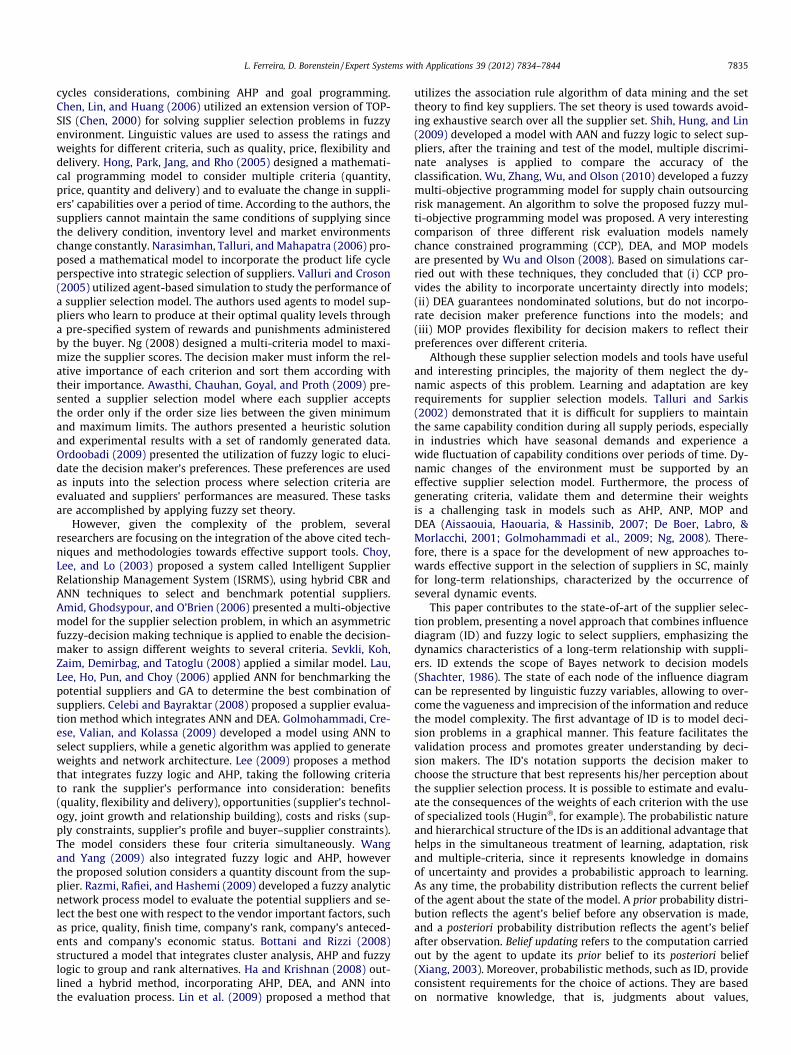
Step 3: Determine the number of state for each node and thecorresponding linguistic variables to express the performance rat-
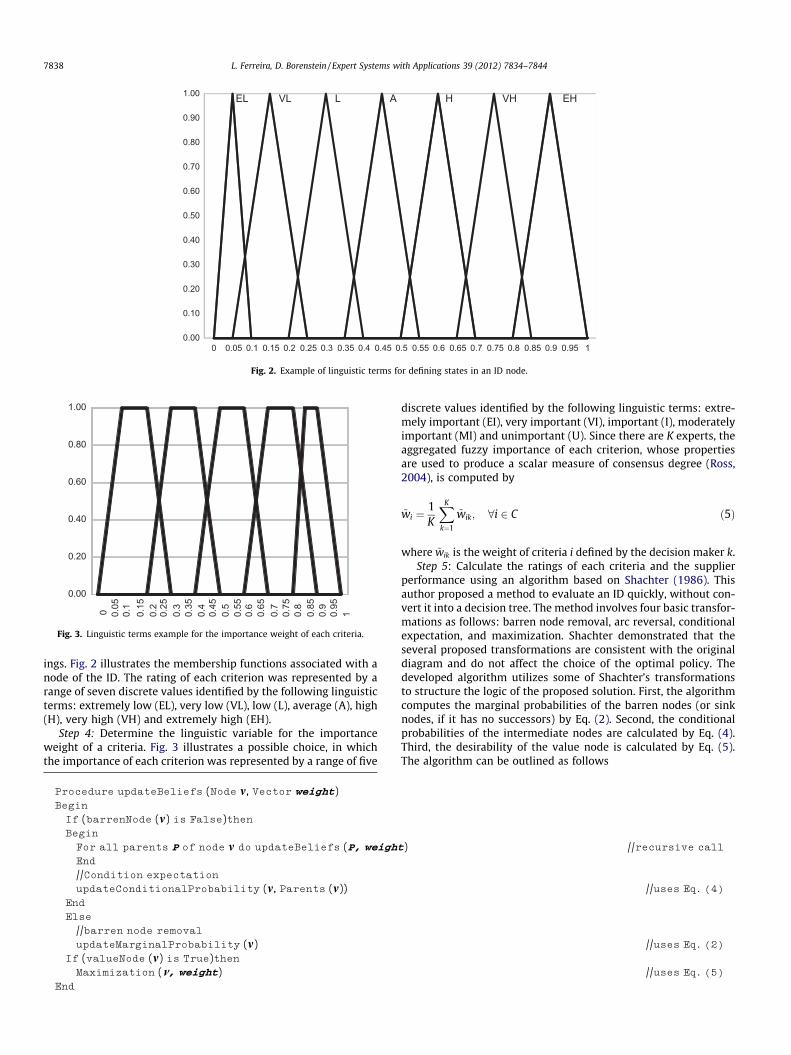
0 0.05 0.1 0.15 0.2 0.25 0.3 0.35 0.4 0.45 0.5 0.55 0.6 0.65 0.7 0.75 0.8 0.85 0.9 0.95 10.00
0.10
0.20
0.30
0.40
0.50
0.60
0.70
0.80
0.90
1.00 EL VL L A H VH EH
Fig. 2. Example of linguistic terms for defining states in an ID node.
0.05
0.1
0.15
0.2
0.25
0.3
0.35
0.4
0.45
0.5
0.55
0.6
0.65
0.7
0.75
0.8
0.85
0.9
0.95
10
0.00
0.20
0.40
0.60
0.80
1.00
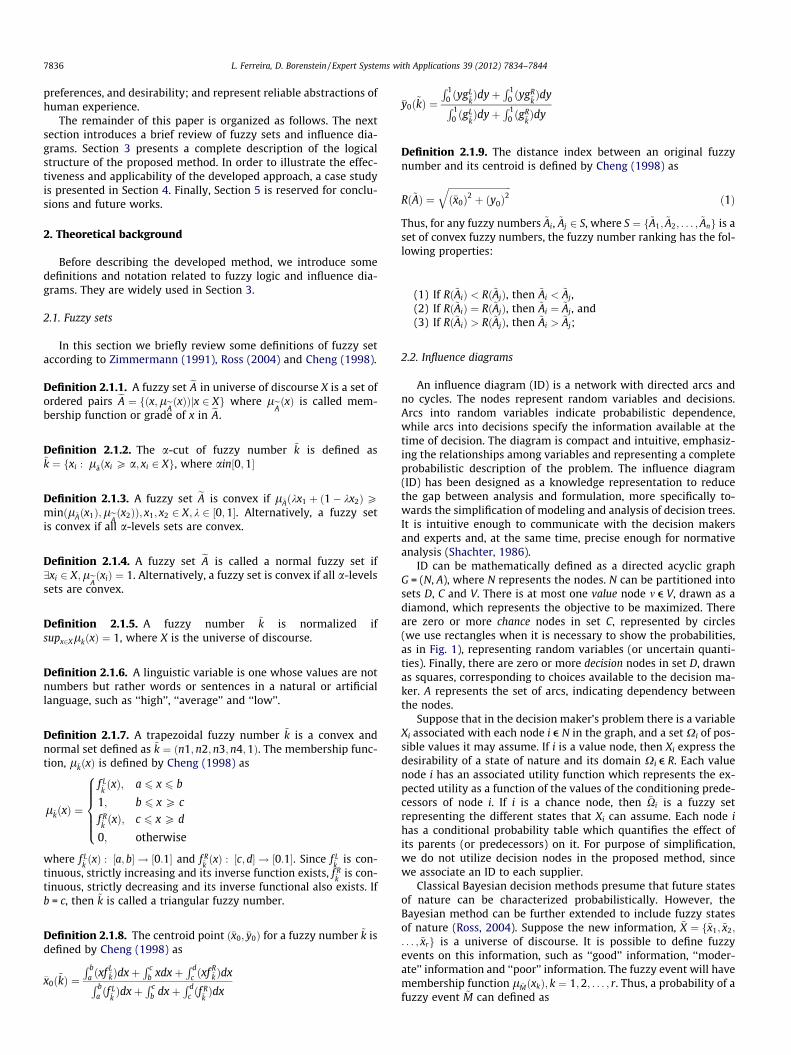
Fig. 3. Linguistic terms example for the importance weight of each criteria.
7838 L. Ferreira, D. Borenstein / Expert Systems with Applications 39 (2012) 7834–7844
ings. Fig. 2 illustrates the membership functions associated with anode of the ID. The rating of each criterion was represented by arange of seven discrete values identified by the following linguisticterms: extremely low (EL), very low (VL), low (L), average (A), high(H), very high (VH) and extremely high (EH).
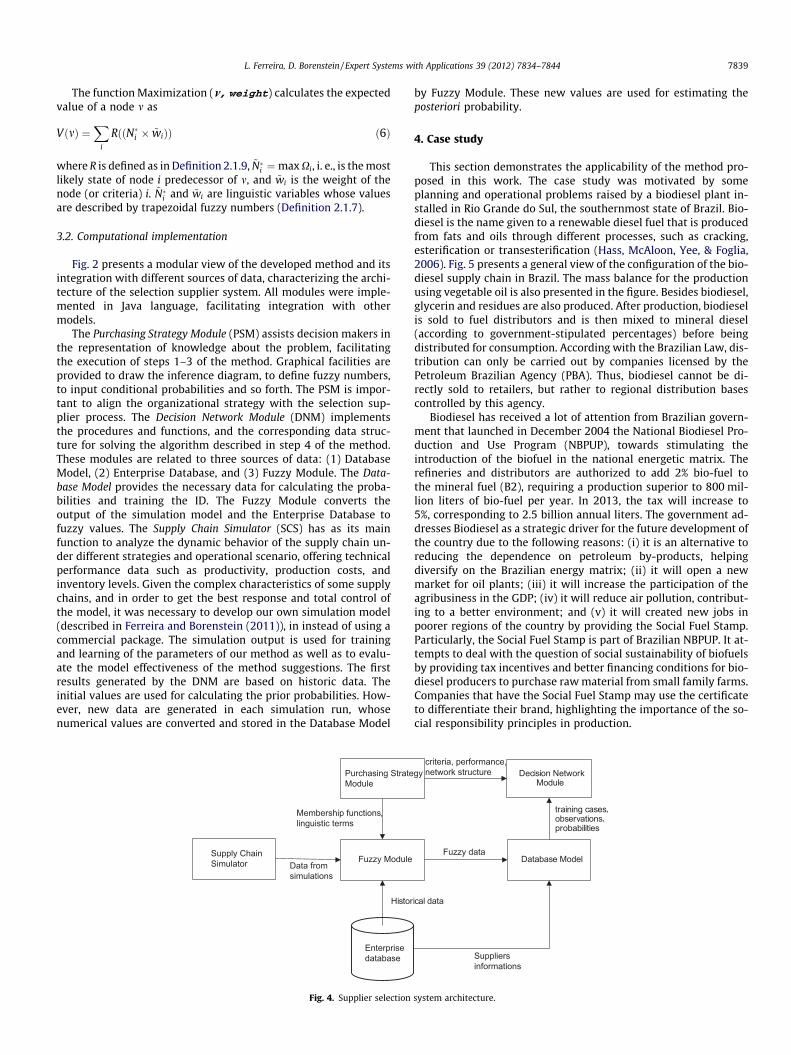
Step 4: Determine the linguistic variable for the importanceweight of a criteria. Fig. 3 illustrates a possible choice, in whichthe importance of each criterion was represented by a range of five
Procedure updateBeliefs (Node m, Vector weight)Begin
If (barrenNode (m) is False)thenBegin
For all parents P of node m do updateBeliefs (P, weight
End
//Condition expectation
updateConditionalProbability (m, Parents (m))End
Else
//barren node removal
updateMarginalProbability (m)If (valueNode (m) is True)thenMaximization (m, weight)
End
discrete values identified by the following linguistic terms: extre-mely important (EI), very important (VI), important (I), moderatelyimportant (MI) and unimportant (U). Since there are K experts, theaggregated fuzzy importance of each criterion, whose propertiesare used to produce a scalar measure of consensus degree (Ross,2004), is computed by
~wi ¼1K
XK
k¼1
~wik; 8i 2 C ð5Þ
where ~wik is the weight of criteria i defined by the decision maker k.Step 5: Calculate the ratings of each criteria and the supplier
performance using an algorithm based on Shachter (1986). Thisauthor proposed a method to evaluate an ID quickly, without con-vert it into a decision tree. The method involves four basic transfor-mations as follows: barren node removal, arc reversal, conditionalexpectation, and maximization. Shachter demonstrated that theseveral proposed transformations are consistent with the originaldiagram and do not affect the choice of the optimal policy. Thedeveloped algorithm utilizes some of Shachter’s transformationsto structure the logic of the proposed solution. First, the algorithmcomputes the marginal probabilities of the barren nodes (or sinknodes, if it has no successors) by Eq. (2). Second, the conditionalprobabilities of the intermediate nodes are calculated by Eq. (4).Third, the desirability of the value node is calculated by Eq. (5).The algorithm can be outlined as follows
) //recursive call
//uses Eq. (4)
//uses Eq. (2)
//uses Eq. (5)
L. Ferreira, D. Borenstein / Expert Systems with Applications 39 (2012) 7834–7844 7839
The function Maximization (m, weight) calculates the expectedvalue of a node m as
VðmÞ ¼X
i
RððN�i � ~wiÞÞ ð6Þ
where R is defined as in Definition 2.1.9, ~N�i ¼max Xi, i. e., is the mostlikely state of node i predecessor of m, and ~wi is the weight of thenode (or criteria) i. ~N�i and ~wi are linguistic variables whose valuesare described by trapezoidal fuzzy numbers (Definition 2.1.7).
3.2. Computational implementation
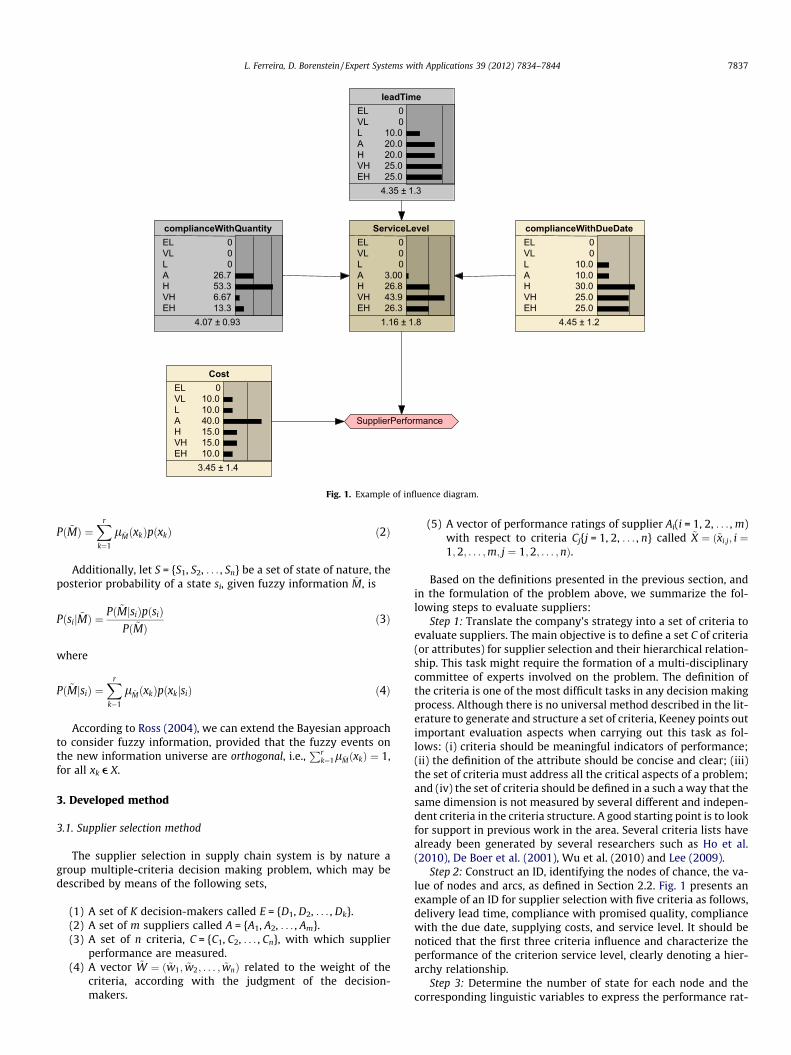
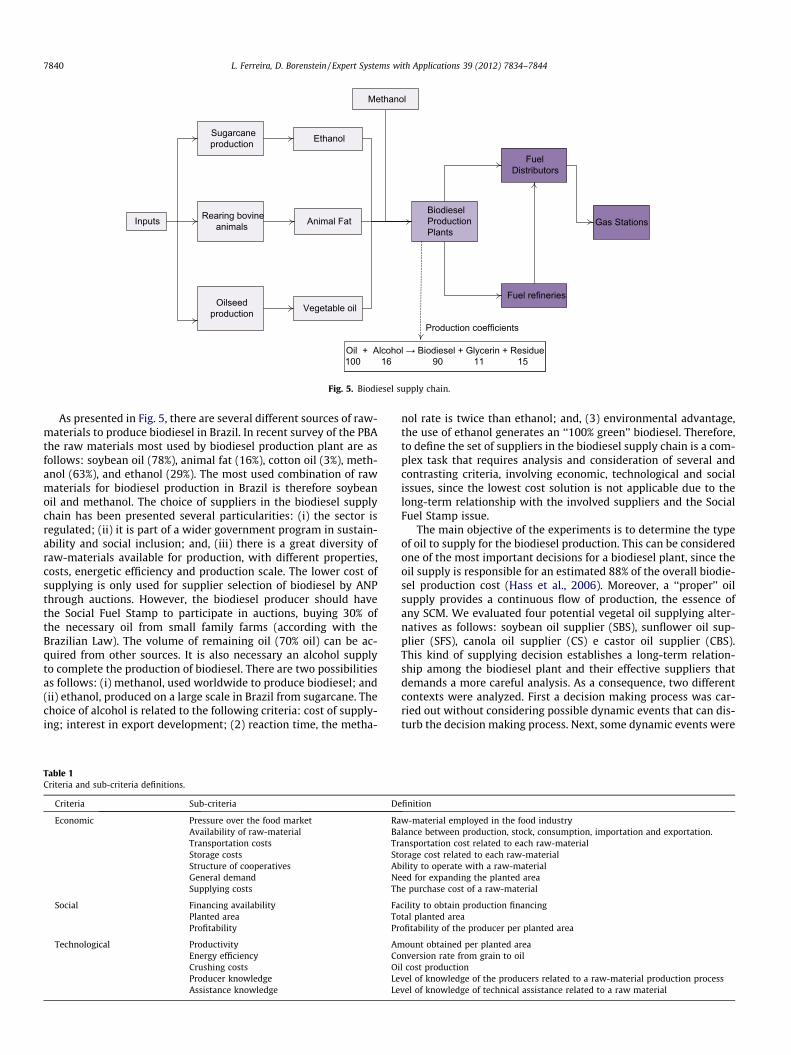
Fig. 2 presents a modular view of the developed method and itsintegration with different sources of data, characterizing the archi-tecture of the selection supplier system. All modules were imple-mented in Java language, facilitating integration with othermodels.
The Purchasing Strategy Module (PSM) assists decision makers inthe representation of knowledge about the problem, facilitatingthe execution of steps 1–3 of the method. Graphical facilities areprovided to draw the inference diagram, to define fuzzy numbers,to input conditional probabilities and so forth. The PSM is impor-tant to align the organizational strategy with the selection sup-plier process. The Decision Network Module (DNM) implementsthe procedures and functions, and the corresponding data struc-ture for solving the algorithm described in step 4 of the method.These modules are related to three sources of data: (1) DatabaseModel, (2) Enterprise Database, and (3) Fuzzy Module. The Data-base Model provides the necessary data for calculating the proba-bilities and training the ID. The Fuzzy Module converts theoutput of the simulation model and the Enterprise Database tofuzzy values. The Supply Chain Simulator (SCS) has as its mainfunction to analyze the dynamic behavior of the supply chain un-der different strategies and operational scenario, offering technicalperformance data such as productivity, production costs, andinventory levels. Given the complex characteristics of some supplychains, and in order to get the best response and total control ofthe model, it was necessary to develop our own simulation model(described in Ferreira and Borenstein (2011)), in instead of using acommercial package. The simulation output is used for trainingand learning of the parameters of our method as well as to evalu-ate the model effectiveness of the method suggestions. The firstresults generated by the DNM are based on historic data. Theinitial values are used for calculating the prior probabilities. How-ever, new data are generated in each simulation run, whosenumerical values are converted and stored in the Database Model
Purchasing StrateModule
Histor
Supply Chain Simulator Fuzzy Module
Data from simulations
Enterprise database
Membership functionslinguistic terms
,
Fig. 4. Supplier selection
by Fuzzy Module. These new values are used for estimating theposteriori probability.
4. Case study
This section demonstrates the applicability of the method pro-posed in this work. The case study was motivated by someplanning and operational problems raised by a biodiesel plant in-stalled in Rio Grande do Sul, the southernmost state of Brazil. Bio-diesel is the name given to a renewable diesel fuel that is producedfrom fats and oils through different processes, such as cracking,esterification or transesterification (Hass, McAloon, Yee, & Foglia,2006). Fig. 5 presents a general view of the configuration of the bio-diesel supply chain in Brazil. The mass balance for the productionusing vegetable oil is also presented in the figure. Besides biodiesel,glycerin and residues are also produced. After production, biodieselis sold to fuel distributors and is then mixed to mineral diesel(according to government-stipulated percentages) before beingdistributed for consumption. According with the Brazilian Law, dis-tribution can only be carried out by companies licensed by thePetroleum Brazilian Agency (PBA). Thus, biodiesel cannot be di-rectly sold to retailers, but rather to regional distribution basescontrolled by this agency.
Biodiesel has received a lot of attention from Brazilian govern-ment that launched in December 2004 the National Biodiesel Pro-duction and Use Program (NBPUP), towards stimulating theintroduction of the biofuel in the national energetic matrix. Therefineries and distributors are authorized to add 2% bio-fuel tothe mineral fuel (B2), requiring a production superior to 800 mil-lion liters of bio-fuel per year. In 2013, the tax will increase to5%, corresponding to 2.5 billion annual liters. The government ad-dresses Biodiesel as a strategic driver for the future development ofthe country due to the following reasons: (i) it is an alternative toreducing the dependence on petroleum by-products, helpingdiversify on the Brazilian energy matrix; (ii) it will open a newmarket for oil plants; (iii) it will increase the participation of theagribusiness in the GDP; (iv) it will reduce air pollution, contribut-ing to a better environment; and (v) it will created new jobs inpoorer regions of the country by providing the Social Fuel Stamp.Particularly, the Social Fuel Stamp is part of Brazilian NBPUP. It at-tempts to deal with the question of social sustainability of biofuelsby providing tax incentives and better financing conditions for bio-diesel producers to purchase raw material from small family farms.Companies that have the Social Fuel Stamp may use the certificateto differentiate their brand, highlighting the importance of the so-cial responsibility principles in production.
Database Model
Decision Network Module
gy
ical data
training cases, observations, probabilities
criteria, performance, network structure
Fuzzy data
Suppliers informations
system architecture.
Inputs
Sugarcane production
Rearing bovine animals
Oilseed production
Ethanol
Animal Fat
Vegetable oil
Biodiesel Production Plants
Fuel refineries
Fuel Distributors
Gas Stations
Methanol
Oil + Alcohol → Biodiesel + Glycerin + Residue100 16 90 11 15
Production coefficients
Fig. 5. Biodiesel supply chain.
7840 L. Ferreira, D. Borenstein / Expert Systems with Applications 39 (2012) 7834–7844
As presented in Fig. 5, there are several different sources of raw-materials to produce biodiesel in Brazil. In recent survey of the PBAthe raw materials most used by biodiesel production plant are asfollows: soybean oil (78%), animal fat (16%), cotton oil (3%), meth-anol (63%), and ethanol (29%). The most used combination of rawmaterials for biodiesel production in Brazil is therefore soybeanoil and methanol. The choice of suppliers in the biodiesel supplychain has been presented several particularities: (i) the sector isregulated; (ii) it is part of a wider government program in sustain-ability and social inclusion; and, (iii) there is a great diversity ofraw-materials available for production, with different properties,costs, energetic efficiency and production scale. The lower cost ofsupplying is only used for supplier selection of biodiesel by ANPthrough auctions. However, the biodiesel producer should havethe Social Fuel Stamp to participate in auctions, buying 30% ofthe necessary oil from small family farms (according with theBrazilian Law). The volume of remaining oil (70% oil) can be ac-quired from other sources. It is also necessary an alcohol supplyto complete the production of biodiesel. There are two possibilitiesas follows: (i) methanol, used worldwide to produce biodiesel; and(ii) ethanol, produced on a large scale in Brazil from sugarcane. Thechoice of alcohol is related to the following criteria: cost of supply-ing; interest in export development; (2) reaction time, the metha-
Table 1Criteria and sub-criteria definitions.
Criteria Sub-criteria De
Economic Pressure over the food market RaAvailability of raw-material BaTransportation costs TrStorage costs StStructure of cooperatives AbGeneral demand NeSupplying costs Th
Social Financing availability FaPlanted area ToProfitability Pr
Technological Productivity AmEnergy efficiency CoCrushing costs OiProducer knowledge LeAssistance knowledge Le
nol rate is twice than ethanol; and, (3) environmental advantage,the use of ethanol generates an ‘‘100% green’’ biodiesel. Therefore,to define the set of suppliers in the biodiesel supply chain is a com-plex task that requires analysis and consideration of several andcontrasting criteria, involving economic, technological and socialissues, since the lowest cost solution is not applicable due to thelong-term relationship with the involved suppliers and the SocialFuel Stamp issue.
The main objective of the experiments is to determine the typeof oil to supply for the biodiesel production. This can be consideredone of the most important decisions for a biodiesel plant, since theoil supply is responsible for an estimated 88% of the overall biodie-sel production cost (Hass et al., 2006). Moreover, a ‘‘proper’’ oilsupply provides a continuous flow of production, the essence ofany SCM. We evaluated four potential vegetal oil supplying alter-natives as follows: soybean oil supplier (SBS), sunflower oil sup-plier (SFS), canola oil supplier (CS) e castor oil supplier (CBS).This kind of supplying decision establishes a long-term relation-ship among the biodiesel plant and their effective suppliers thatdemands a more careful analysis. As a consequence, two differentcontexts were analyzed. First a decision making process was car-ried out without considering possible dynamic events that can dis-turb the decision making process. Next, some dynamic events were
finition
w-material employed in the food industrylance between production, stock, consumption, importation and exportation.ansportation cost related to each raw-materialorage cost related to each raw-materialility to operate with a raw-materialed for expanding the planted areae purchase cost of a raw-material
cility to obtain production financingtal planted areaofitability of the producer per planted area
ount obtained per planted areanversion rate from grain to oill cost productionvel of knowledge of the producers related to a raw-material production processvel of knowledge of technical assistance related to a raw material
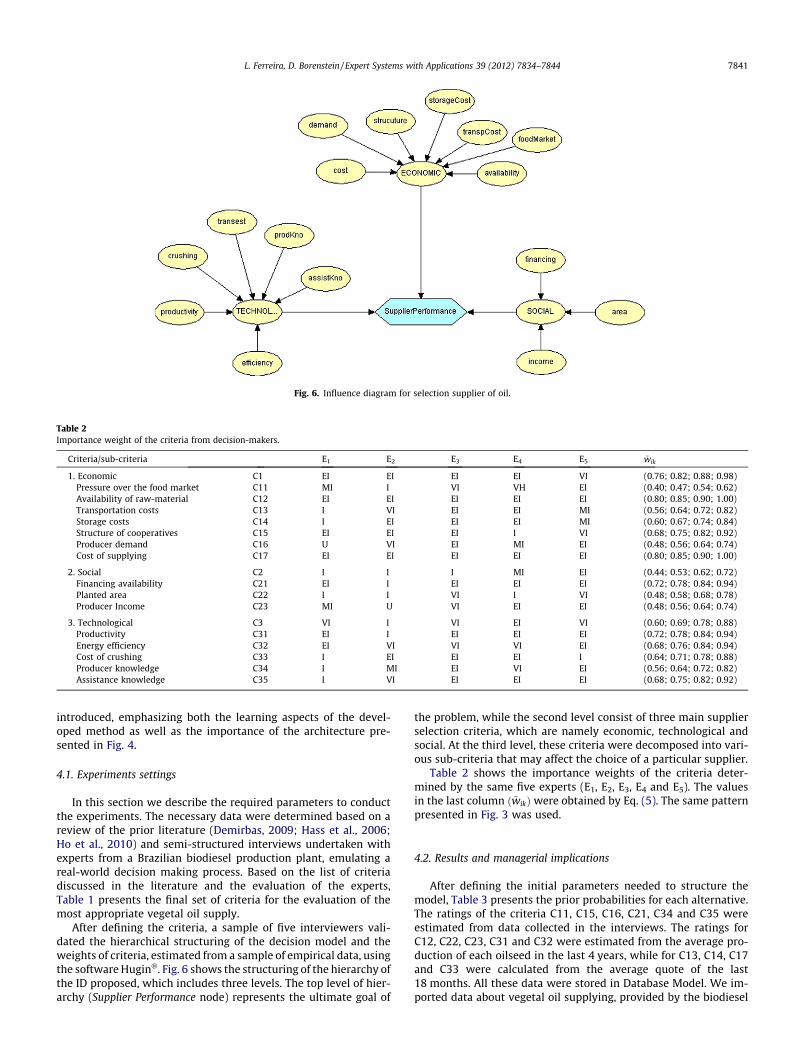
Fig. 6. Influence diagram for selection supplier of oil.
Table 2Importance weight of the criteria from decision-makers.
Criteria/sub-criteria E1 E2 E3 E4 E5 ~wik
1. Economic C1 EI EI EI EI VI (0.76; 0.82; 0.88; 0.98)Pressure over the food market C11 MI I VI VH EI (0.40; 0.47; 0.54; 0.62)Availability of raw-material C12 EI EI EI EI EI (0.80; 0.85; 0.90; 1.00)Transportation costs C13 I VI EI EI MI (0.56; 0.64; 0.72; 0.82)Storage costs C14 I EI EI EI MI (0.60; 0.67; 0.74; 0.84)Structure of cooperatives C15 EI EI EI I VI (0.68; 0.75; 0.82; 0.92)Producer demand C16 U VI EI MI EI (0.48; 0.56; 0.64; 0.74)Cost of supplying C17 EI EI EI EI EI (0.80; 0.85; 0.90; 1.00)
2. Social C2 I I I MI EI (0.44; 0.53; 0.62; 0.72)Financing availability C21 EI I EI EI EI (0.72; 0.78; 0.84; 0.94)Planted area C22 I I VI I VI (0.48; 0.58; 0.68; 0.78)Producer Income C23 MI U VI EI EI (0.48; 0.56; 0.64; 0.74)
3. Technological C3 VI I VI EI VI (0.60; 0.69; 0.78; 0.88)Productivity C31 EI I EI EI EI (0.72; 0.78; 0.84; 0.94)Energy efficiency C32 EI VI VI VI EI (0.68; 0.76; 0.84; 0.94)Cost of crushing C33 I EI EI EI I (0.64; 0.71; 0.78; 0.88)Producer knowledge C34 I MI EI VI EI (0.56; 0.64; 0.72; 0.82)Assistance knowledge C35 I VI EI EI EI (0.68; 0.75; 0.82; 0.92)
L. Ferreira, D. Borenstein / Expert Systems with Applications 39 (2012) 7834–7844 7841
introduced, emphasizing both the learning aspects of the devel-oped method as well as the importance of the architecture pre-sented in Fig. 4.
4.1. Experiments settings
In this section we describe the required parameters to conductthe experiments. The necessary data were determined based on areview of the prior literature (Demirbas, 2009; Hass et al., 2006;Ho et al., 2010) and semi-structured interviews undertaken withexperts from a Brazilian biodiesel production plant, emulating areal-world decision making process. Based on the list of criteriadiscussed in the literature and the evaluation of the experts,Table 1 presents the final set of criteria for the evaluation of themost appropriate vegetal oil supply.
After defining the criteria, a sample of five interviewers vali-dated the hierarchical structuring of the decision model and theweights of criteria, estimated from a sample of empirical data, usingthe software Hugin�. Fig. 6 shows the structuring of the hierarchy ofthe ID proposed, which includes three levels. The top level of hier-archy (Supplier Performance node) represents the ultimate goal of
the problem, while the second level consist of three main supplierselection criteria, which are namely economic, technological andsocial. At the third level, these criteria were decomposed into vari-ous sub-criteria that may affect the choice of a particular supplier.
Table 2 shows the importance weights of the criteria deter-mined by the same five experts (E1, E2, E3, E4 and E5). The valuesin the last column ð~wikÞ were obtained by Eq. (5). The same patternpresented in Fig. 3 was used.
4.2. Results and managerial implications
After defining the initial parameters needed to structure themodel, Table 3 presents the prior probabilities for each alternative.The ratings of the criteria C11, C15, C16, C21, C34 and C35 wereestimated from data collected in the interviews. The ratings forC12, C22, C23, C31 and C32 were estimated from the average pro-duction of each oilseed in the last 4 years, while for C13, C14, C17and C33 were calculated from the average quote of the last18 months. All these data were stored in Database Model. We im-ported data about vegetal oil supplying, provided by the biodiesel
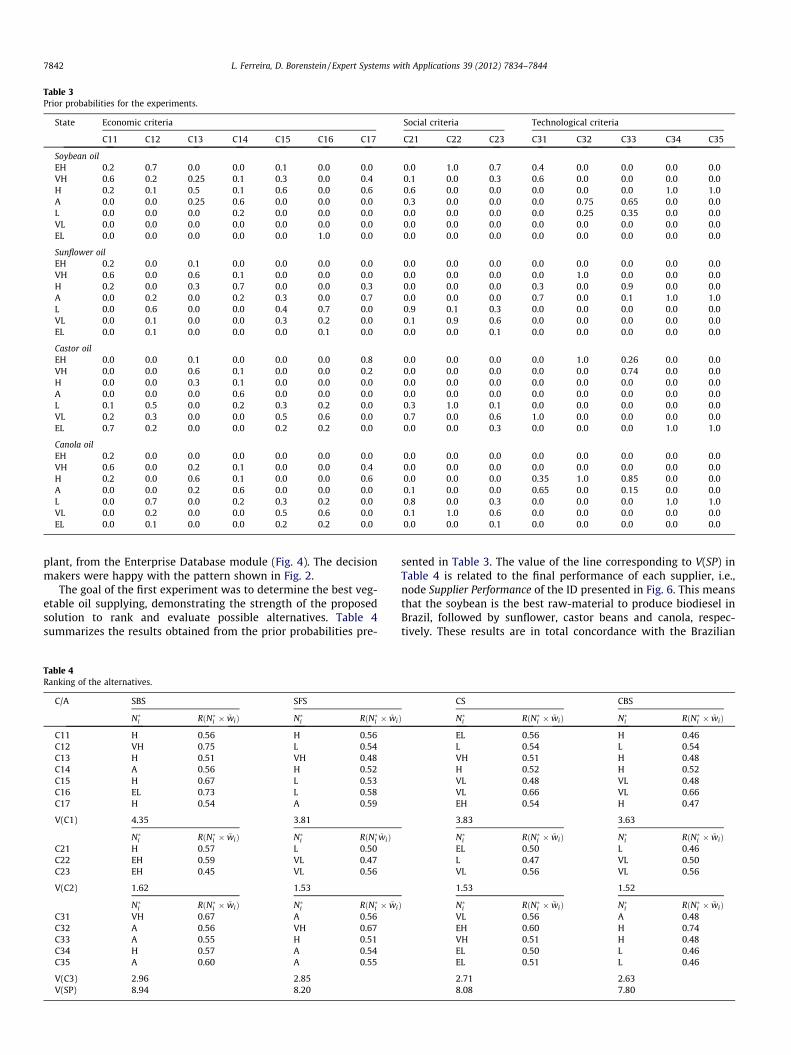
Table 3Prior probabilities for the experiments.
State Economic criteria Social criteria Technological criteria
C11 C12 C13 C14 C15 C16 C17 C21 C22 C23 C31 C32 C33 C34 C35
Soybean oilEH 0.2 0.7 0.0 0.0 0.1 0.0 0.0 0.0 1.0 0.7 0.4 0.0 0.0 0.0 0.0VH 0.6 0.2 0.25 0.1 0.3 0.0 0.4 0.1 0.0 0.3 0.6 0.0 0.0 0.0 0.0H 0.2 0.1 0.5 0.1 0.6 0.0 0.6 0.6 0.0 0.0 0.0 0.0 0.0 1.0 1.0A 0.0 0.0 0.25 0.6 0.0 0.0 0.0 0.3 0.0 0.0 0.0 0.75 0.65 0.0 0.0L 0.0 0.0 0.0 0.2 0.0 0.0 0.0 0.0 0.0 0.0 0.0 0.25 0.35 0.0 0.0VL 0.0 0.0 0.0 0.0 0.0 0.0 0.0 0.0 0.0 0.0 0.0 0.0 0.0 0.0 0.0EL 0.0 0.0 0.0 0.0 0.0 1.0 0.0 0.0 0.0 0.0 0.0 0.0 0.0 0.0 0.0
Sunflower oilEH 0.2 0.0 0.1 0.0 0.0 0.0 0.0 0.0 0.0 0.0 0.0 0.0 0.0 0.0 0.0VH 0.6 0.0 0.6 0.1 0.0 0.0 0.0 0.0 0.0 0.0 0.0 1.0 0.0 0.0 0.0H 0.2 0.0 0.3 0.7 0.0 0.0 0.3 0.0 0.0 0.0 0.3 0.0 0.9 0.0 0.0A 0.0 0.2 0.0 0.2 0.3 0.0 0.7 0.0 0.0 0.0 0.7 0.0 0.1 1.0 1.0L 0.0 0.6 0.0 0.0 0.4 0.7 0.0 0.9 0.1 0.3 0.0 0.0 0.0 0.0 0.0VL 0.0 0.1 0.0 0.0 0.3 0.2 0.0 0.1 0.9 0.6 0.0 0.0 0.0 0.0 0.0EL 0.0 0.1 0.0 0.0 0.0 0.1 0.0 0.0 0.0 0.1 0.0 0.0 0.0 0.0 0.0
Castor oilEH 0.0 0.0 0.1 0.0 0.0 0.0 0.8 0.0 0.0 0.0 0.0 1.0 0.26 0.0 0.0VH 0.0 0.0 0.6 0.1 0.0 0.0 0.2 0.0 0.0 0.0 0.0 0.0 0.74 0.0 0.0H 0.0 0.0 0.3 0.1 0.0 0.0 0.0 0.0 0.0 0.0 0.0 0.0 0.0 0.0 0.0A 0.0 0.0 0.0 0.6 0.0 0.0 0.0 0.0 0.0 0.0 0.0 0.0 0.0 0.0 0.0L 0.1 0.5 0.0 0.2 0.3 0.2 0.0 0.3 1.0 0.1 0.0 0.0 0.0 0.0 0.0VL 0.2 0.3 0.0 0.0 0.5 0.6 0.0 0.7 0.0 0.6 1.0 0.0 0.0 0.0 0.0EL 0.7 0.2 0.0 0.0 0.2 0.2 0.0 0.0 0.0 0.3 0.0 0.0 0.0 1.0 1.0
Canola oilEH 0.2 0.0 0.0 0.0 0.0 0.0 0.0 0.0 0.0 0.0 0.0 0.0 0.0 0.0 0.0VH 0.6 0.0 0.2 0.1 0.0 0.0 0.4 0.0 0.0 0.0 0.0 0.0 0.0 0.0 0.0H 0.2 0.0 0.6 0.1 0.0 0.0 0.6 0.0 0.0 0.0 0.35 1.0 0.85 0.0 0.0A 0.0 0.0 0.2 0.6 0.0 0.0 0.0 0.1 0.0 0.0 0.65 0.0 0.15 0.0 0.0L 0.0 0.7 0.0 0.2 0.3 0.2 0.0 0.8 0.0 0.3 0.0 0.0 0.0 1.0 1.0VL 0.0 0.2 0.0 0.0 0.5 0.6 0.0 0.1 1.0 0.6 0.0 0.0 0.0 0.0 0.0EL 0.0 0.1 0.0 0.0 0.2 0.2 0.0 0.0 0.0 0.1 0.0 0.0 0.0 0.0 0.0
7842 L. Ferreira, D. Borenstein / Expert Systems with Applications 39 (2012) 7834–7844
plant, from the Enterprise Database module (Fig. 4). The decisionmakers were happy with the pattern shown in Fig. 2.
The goal of the first experiment was to determine the best veg-etable oil supplying, demonstrating the strength of the proposedsolution to rank and evaluate possible alternatives. Table 4summarizes the results obtained from the prior probabilities pre-
Table 4Ranking of the alternatives.
C/A SBS SFS
N�i RðN�i � ~wiÞ N�i RðN�i � ~wi
C11 H 0.56 H 0.56C12 VH 0.75 L 0.54C13 H 0.51 VH 0.48C14 A 0.56 H 0.52C15 H 0.67 L 0.53C16 EL 0.73 L 0.58C17 H 0.54 A 0.59
V(C1) 4.35 3.81
N�i RðN�i � ~wiÞ N�i RðN�i ~wiÞC21 H 0.57 L 0.50C22 EH 0.59 VL 0.47C23 EH 0.45 VL 0.56
V(C2) 1.62 1.53
N�i RðN�i � ~wiÞ N�i RðN�i � ~wi
C31 VH 0.67 A 0.56C32 A 0.56 VH 0.67C33 A 0.55 H 0.51C34 H 0.57 A 0.54C35 A 0.60 A 0.55
V(C3) 2.96 2.85V(SP) 8.94 8.20
sented in Table 3. The value of the line corresponding to V(SP) inTable 4 is related to the final performance of each supplier, i.e.,node Supplier Performance of the ID presented in Fig. 6. This meansthat the soybean is the best raw-material to produce biodiesel inBrazil, followed by sunflower, castor beans and canola, respec-tively. These results are in total concordance with the Brazilian
CS CBS
Þ N�i RðN�i � ~wiÞ N�i RðN�i � ~wiÞ
EL 0.56 H 0.46L 0.54 L 0.54VH 0.51 H 0.48H 0.52 H 0.52VL 0.48 VL 0.48VL 0.66 VL 0.66EH 0.54 H 0.47
3.83 3.63
N�i RðN�i � ~wiÞ N�i RðN�i � ~wiÞEL 0.50 L 0.46L 0.47 VL 0.50VL 0.56 VL 0.56
1.53 1.52
Þ N�i RðN�i � ~wiÞ N�i RðN�i � ~wiÞVL 0.56 A 0.48EH 0.60 H 0.74VH 0.51 H 0.48EL 0.50 L 0.46EL 0.51 L 0.46
2.71 2.638.08 7.80
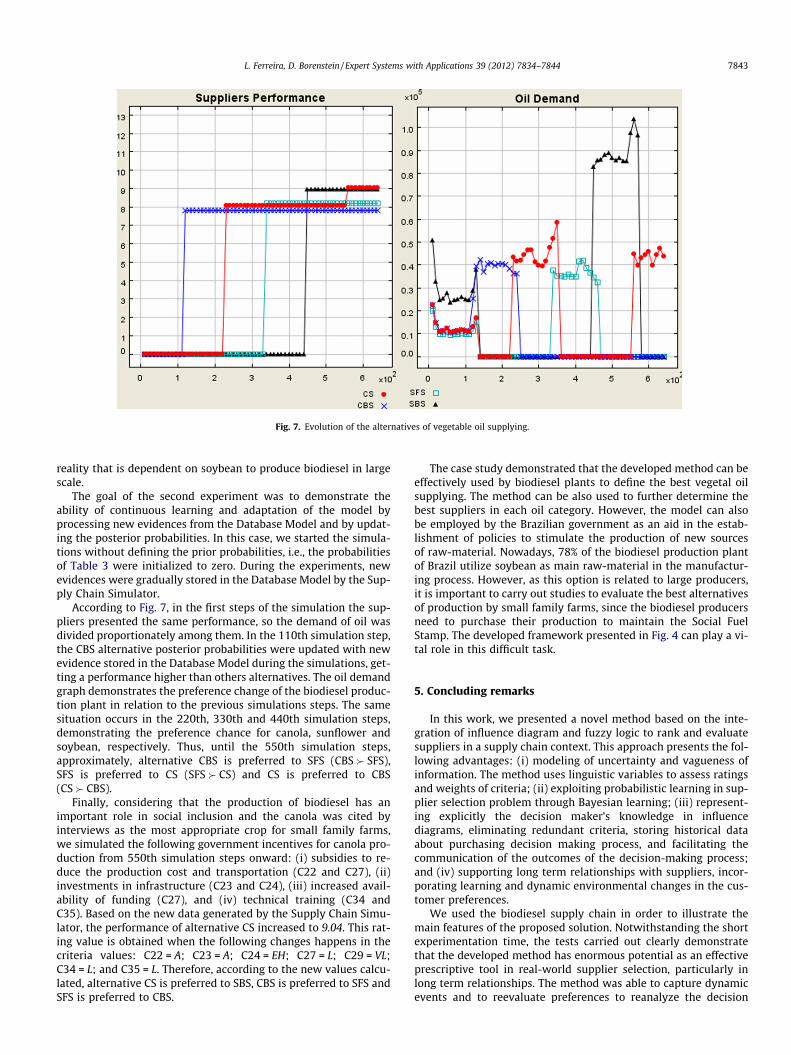
Fig. 7. Evolution of the alternatives of vegetable oil supplying.
L. Ferreira, D. Borenstein / Expert Systems with Applications 39 (2012) 7834–7844 7843
reality that is dependent on soybean to produce biodiesel in largescale.
The goal of the second experiment was to demonstrate theability of continuous learning and adaptation of the model byprocessing new evidences from the Database Model and by updat-ing the posterior probabilities. In this case, we started the simula-tions without defining the prior probabilities, i.e., the probabilitiesof Table 3 were initialized to zero. During the experiments, newevidences were gradually stored in the Database Model by the Sup-ply Chain Simulator.
According to Fig. 7, in the first steps of the simulation the sup-pliers presented the same performance, so the demand of oil wasdivided proportionately among them. In the 110th simulation step,the CBS alternative posterior probabilities were updated with newevidence stored in the Database Model during the simulations, get-ting a performance higher than others alternatives. The oil demandgraph demonstrates the preference change of the biodiesel produc-tion plant in relation to the previous simulations steps. The samesituation occurs in the 220th, 330th and 440th simulation steps,demonstrating the preference chance for canola, sunflower andsoybean, respectively. Thus, until the 550th simulation steps,approximately, alternative CBS is preferred to SFS (CBS � SFS),SFS is preferred to CS (SFS � CS) and CS is preferred to CBS(CS � CBS).
Finally, considering that the production of biodiesel has animportant role in social inclusion and the canola was cited byinterviews as the most appropriate crop for small family farms,we simulated the following government incentives for canola pro-duction from 550th simulation steps onward: (i) subsidies to re-duce the production cost and transportation (C22 and C27), (ii)investments in infrastructure (C23 and C24), (iii) increased avail-ability of funding (C27), and (iv) technical training (C34 andC35). Based on the new data generated by the Supply Chain Simu-lator, the performance of alternative CS increased to 9.04. This rat-ing value is obtained when the following changes happens in thecriteria values: C22 = A; C23 = A; C24 = EH; C27 = L; C29 = VL;C34 = L; and C35 = L. Therefore, according to the new values calcu-lated, alternative CS is preferred to SBS, CBS is preferred to SFS andSFS is preferred to CBS.
The case study demonstrated that the developed method can beeffectively used by biodiesel plants to define the best vegetal oilsupplying. The method can be also used to further determine thebest suppliers in each oil category. However, the model can alsobe employed by the Brazilian government as an aid in the estab-lishment of policies to stimulate the production of new sourcesof raw-material. Nowadays, 78% of the biodiesel production plantof Brazil utilize soybean as main raw-material in the manufactur-ing process. However, as this option is related to large producers,it is important to carry out studies to evaluate the best alternativesof production by small family farms, since the biodiesel producersneed to purchase their production to maintain the Social FuelStamp. The developed framework presented in Fig. 4 can play a vi-tal role in this difficult task.
5. Concluding remarks
In this work, we presented a novel method based on the inte-gration of influence diagram and fuzzy logic to rank and evaluatesuppliers in a supply chain context. This approach presents the fol-lowing advantages: (i) modeling of uncertainty and vagueness ofinformation. The method uses linguistic variables to assess ratingsand weights of criteria; (ii) exploiting probabilistic learning in sup-plier selection problem through Bayesian learning; (iii) represent-ing explicitly the decision maker’s knowledge in influencediagrams, eliminating redundant criteria, storing historical dataabout purchasing decision making process, and facilitating thecommunication of the outcomes of the decision-making process;and (iv) supporting long term relationships with suppliers, incor-porating learning and dynamic environmental changes in the cus-tomer preferences.
We used the biodiesel supply chain in order to illustrate themain features of the proposed solution. Notwithstanding the shortexperimentation time, the tests carried out clearly demonstratethat the developed method has enormous potential as an effectiveprescriptive tool in real-world supplier selection, particularly inlong term relationships. The method was able to capture dynamicevents and to reevaluate preferences to reanalyze the decision
7844 L. Ferreira, D. Borenstein / Expert Systems with Applications 39 (2012) 7834–7844
making process. Further tests using quantitative techniques areforthcoming towards assessing the range of its capabilities.
Many areas of our research can be further explored as follows:(i) to develop a graphic interface to assist the decision makers inthe design of the influence diagram. Currently, the constructionof the model is made with Hugin� software; (ii) to expand thedeveloped model in order to consider large databases; and (ii) toexplore the use of qualitative attributes.
References
Aissaouia, N., Haouaria, M., & Hassinib, E. (2007). Supplier selection and order lotsizing modeling: A review. Computers and Operations Research, 34, 3516–3540.
Amid, A., Ghodsypour, S. H., & O’Brien, C. (2006). Fuzzy multiobjective linear modelfor the supplier selection in a supply chain. International Journal of ProductionEconomics, 104, 394–407.
Awasthi, A., Chauhan, S. S., Goyal, S. K., & Proth, J. M. (2009). Supplier selectionproblem for a single manufacturing unit under stochastic demand. InternationalJournal of Production Economics, 117, 229–233.
Bottani, E., & Rizzi, A. (2008). An adapted multi-criteria approach to suppliers andproducts selection – An application oriented to lead-time reduction.International Journal of Production Economics, 111(2), 763–781.
Bowersox, D., Closs, D., & Cooper, M. B. (2002). Supply chain logistics management.New York: McGraw-Hill.
Celebi, D., & Bayraktar, D. (2008). Hybrid analytical hierarchy process model forsupplier selection. Expert Systems with Applications, 35, 1698–1710.
Chan, F. T. S., & Chan, H. K. (2004). Development of the supplier selection model – Acase study in the advanced technology industry. Proceedings of the Institution ofMechanical Engineers Part B – Journal of Engineering Manufacture, 218(12),1807–1824.
Chen, C. T. (2000). Extensions of the TOPSIS for group decision-making under fuzzyenvironment. Fuzzy Sets and Systems, 114, 1–9.
Chen, C. T., Lin, C. T., & Huang, S. F. (2006). A fuzzy approach for supplier evaluationand selection in supply chain management. International Journal of ProductionEconomics, 102(2), 289–301.
Cheng, C. H. (1998). A new approach for ranking fuzzy numbers by distance method.Fuzzy Sets and Systems, 95, 307–317.
Choy, K. L., Lee, W. B., & Lo, V. (2003). Design of an intelligent supplier relationshipmanagement system: A hybrid case based neural network approach. ExpertSystems with Applications, 24(2), 225–237.
De Boer, L., Labro, E., & Morlacchi, P. (2001). A review of methods supportingsupplier selection. European Journal of Purchasing and Supply Management, 7(2),75–89.
Demirbas, A. (2009). Political, economic and environmental impacts of biofuels: Areview. Applied Energy, 86, 108–117.
Ferreira, L., & Borenstein, D. (2011). Normative agent-based simulation for supplychain planning. Journal of the Operational Research Society, 62, 501–514.
Golmohammadi, D., Creese, R. C., Valian, H., & Kolassa, J. (2009). Supplier selectionbased on a neural network model using genetic algorithm. IEEE Transactions onNeural Network, 20(9), 1504–1519.
Ha, S. Ho, & Krishnan, R. (2008). A hybrid approach to supplier selection for themaintenance of a competitive supply chain. Expert Systems with Applications, 34,1303–1311.
Hass, M. J., McAloon, A. J., Yee, W. C., & Foglia, T. A. (2006). A process model toestimate biodiesel production costs. Bioresource Technology, 97, 671–678.
Ho, W., Xu, X., & Dey, P. K. (2010). Multi-criteria decision making approaches forsupplier evaluation and selection: A literature review. European Journal ofOperational Research, 202, 16–24.
Hong, G. H., Park, S. C., Jang, D. S., & Rho, H. M. (2005). An effective supplier selectionmethod for constructing a competitive supply-relationship. Expert Systems withApplications, 28(4), 629–639.
Kull, T., & Talluri, S. (2008). A supply-risk reduction model using integrated multi-criteria decision making. IEEE Transactions on Engineering Management, 55,409–419.
Lau, H. C. W., Lee, C. K. M., Ho, G. T. S., Pun, K. F., & Choy, K. L. (2006). A performancebenchmarking system to support supplier selection. International Journal ofBusiness Performance Management, 8(2–3), 132–151.
Lee, A. H. I. (2009). A fuzzy supplier selection model with the consideration ofbenefits, opportunities, costs and risks. Expert Systems with Applications, 36,2879–2893.
Levary, R. R. (2008). Using the analytic hierarchy process to rank foreign suppliersbased on supply risks. Computers and Industrial Engineering, 55, 535–542.
Lin, R. H., Chuang, C. L., Liou, J. J. H., & Wua, G. D. (2009). An integrated methodfor finding key suppliers in SCM. Expert Systems with Applications, 36,6461–6465.
Narasimhan, R., Talluri, S., & Mahapatra, S. K. (2006). Multiproduct, multicriteriamodel for supplier selection with product life-cycle considerations. DecisionSciences, 37(4), 577–603.
Ng, W. L. (2008). An efficient and simple model for multiple criteria supplierselection problem. European Journal of Operational Research, 186(3), 1059–1067.
Ordoobadi, S. M. (2009). Development of a supplier selection model using fuzzylogic. Supply Chain Management: An International Journal, 14(4), 314–327.
Razmi, J., Rafiei, H., & Hashemi, M. (2009). Designing a decision support system toevaluate and select suppliers using fuzzy analytic network process. Computersand Industrial Engineering, 57, 1282–1290.
Ross, T. J. (2004). Fuzzy logic with engineering applications (3rd ed.). Chichester: JohnWiley & Sons Ltd.
Sevkli, M., Koh, L., Zaim, S., Demirbag, M., & Tatoglu, K. (2008). Hybrid analyticalhierarchy process model for supplier selection. Industrial Management and DataSystems, 108(1), 122–142.
Shachter, R. S. (1986). Evaluating influence diagrams. Operations Research, 34(6),871–882.
Shih, K. H., Hung, H. F., & Lin, B. (2009). Supplier evaluation model for computerauditing and decision-making analysis. Kybernetes, 38(9), 1439–1460.
Talluri, S., & Sarkis, J. (2002). A model for performance monitoring of suppliers.International Journal of Production Research, 40(16), 4257–4269.
Valluri, A., & Croson, D. C. (2005). Agent learning in supplier selection models.Decision Support Systems, 39, 219–240.
Wang, T. Y., & Yang, Y. H. (2009). A fuzzy model for supplier selection in quantitydiscount environments. Expert Systems with Applications, 36, 12179–12187.
Wu, D., & Olson, D. L. (2008). Supply chain risk, simulation, and vendor selection.International Journal of Production Economics, 114, 646–655.
Wu, D. D., Zhang, Y., Wu, D., & Olson, D. L. (2010). Fuzzy multi-objectiveprogramming for supplier selection and risk modeling: A possibility approach.European Journal of Operational Research, 200, 774–787.
Xiang, Y. (2003). Probabilistic reasoning in multi-agent systems: A graphical modelsapproach. New York: Cambridge University Press.
Zimmermann, H. J. (1991). Fuzzy set theory and its applications (2rd ed.). Boston:Kluwer Academic Publishers.


![Bayesian Inference With Adaptive Fuzzy Priors and …sipi.usc.edu/~kosko/SMC-B-Bayes-Fuzzy-Approximation...fuzzy-set inputs and other fuzzy constraints [7], [32]. We first demonstrate](https://static.fdocuments.us/doc/165x107/5f6c4b91eef26c5a30798282/bayesian-inference-with-adaptive-fuzzy-priors-and-sipiuscedukoskosmc-b-bayes-fuzzy-approximation.jpg)